
Dual-Objective Reinforcement Learning-Based Adaptive Traffic Signal Control for Decarbonization and Efficiency Optimization

Abstract
:1. Introduction
2. Literature Review
2.1. TSC System for Decarbonization and Efficiency
2.2. DRL-Based ATSC
3. Deep Reinforcement Learning-Based ATSC Algorithm
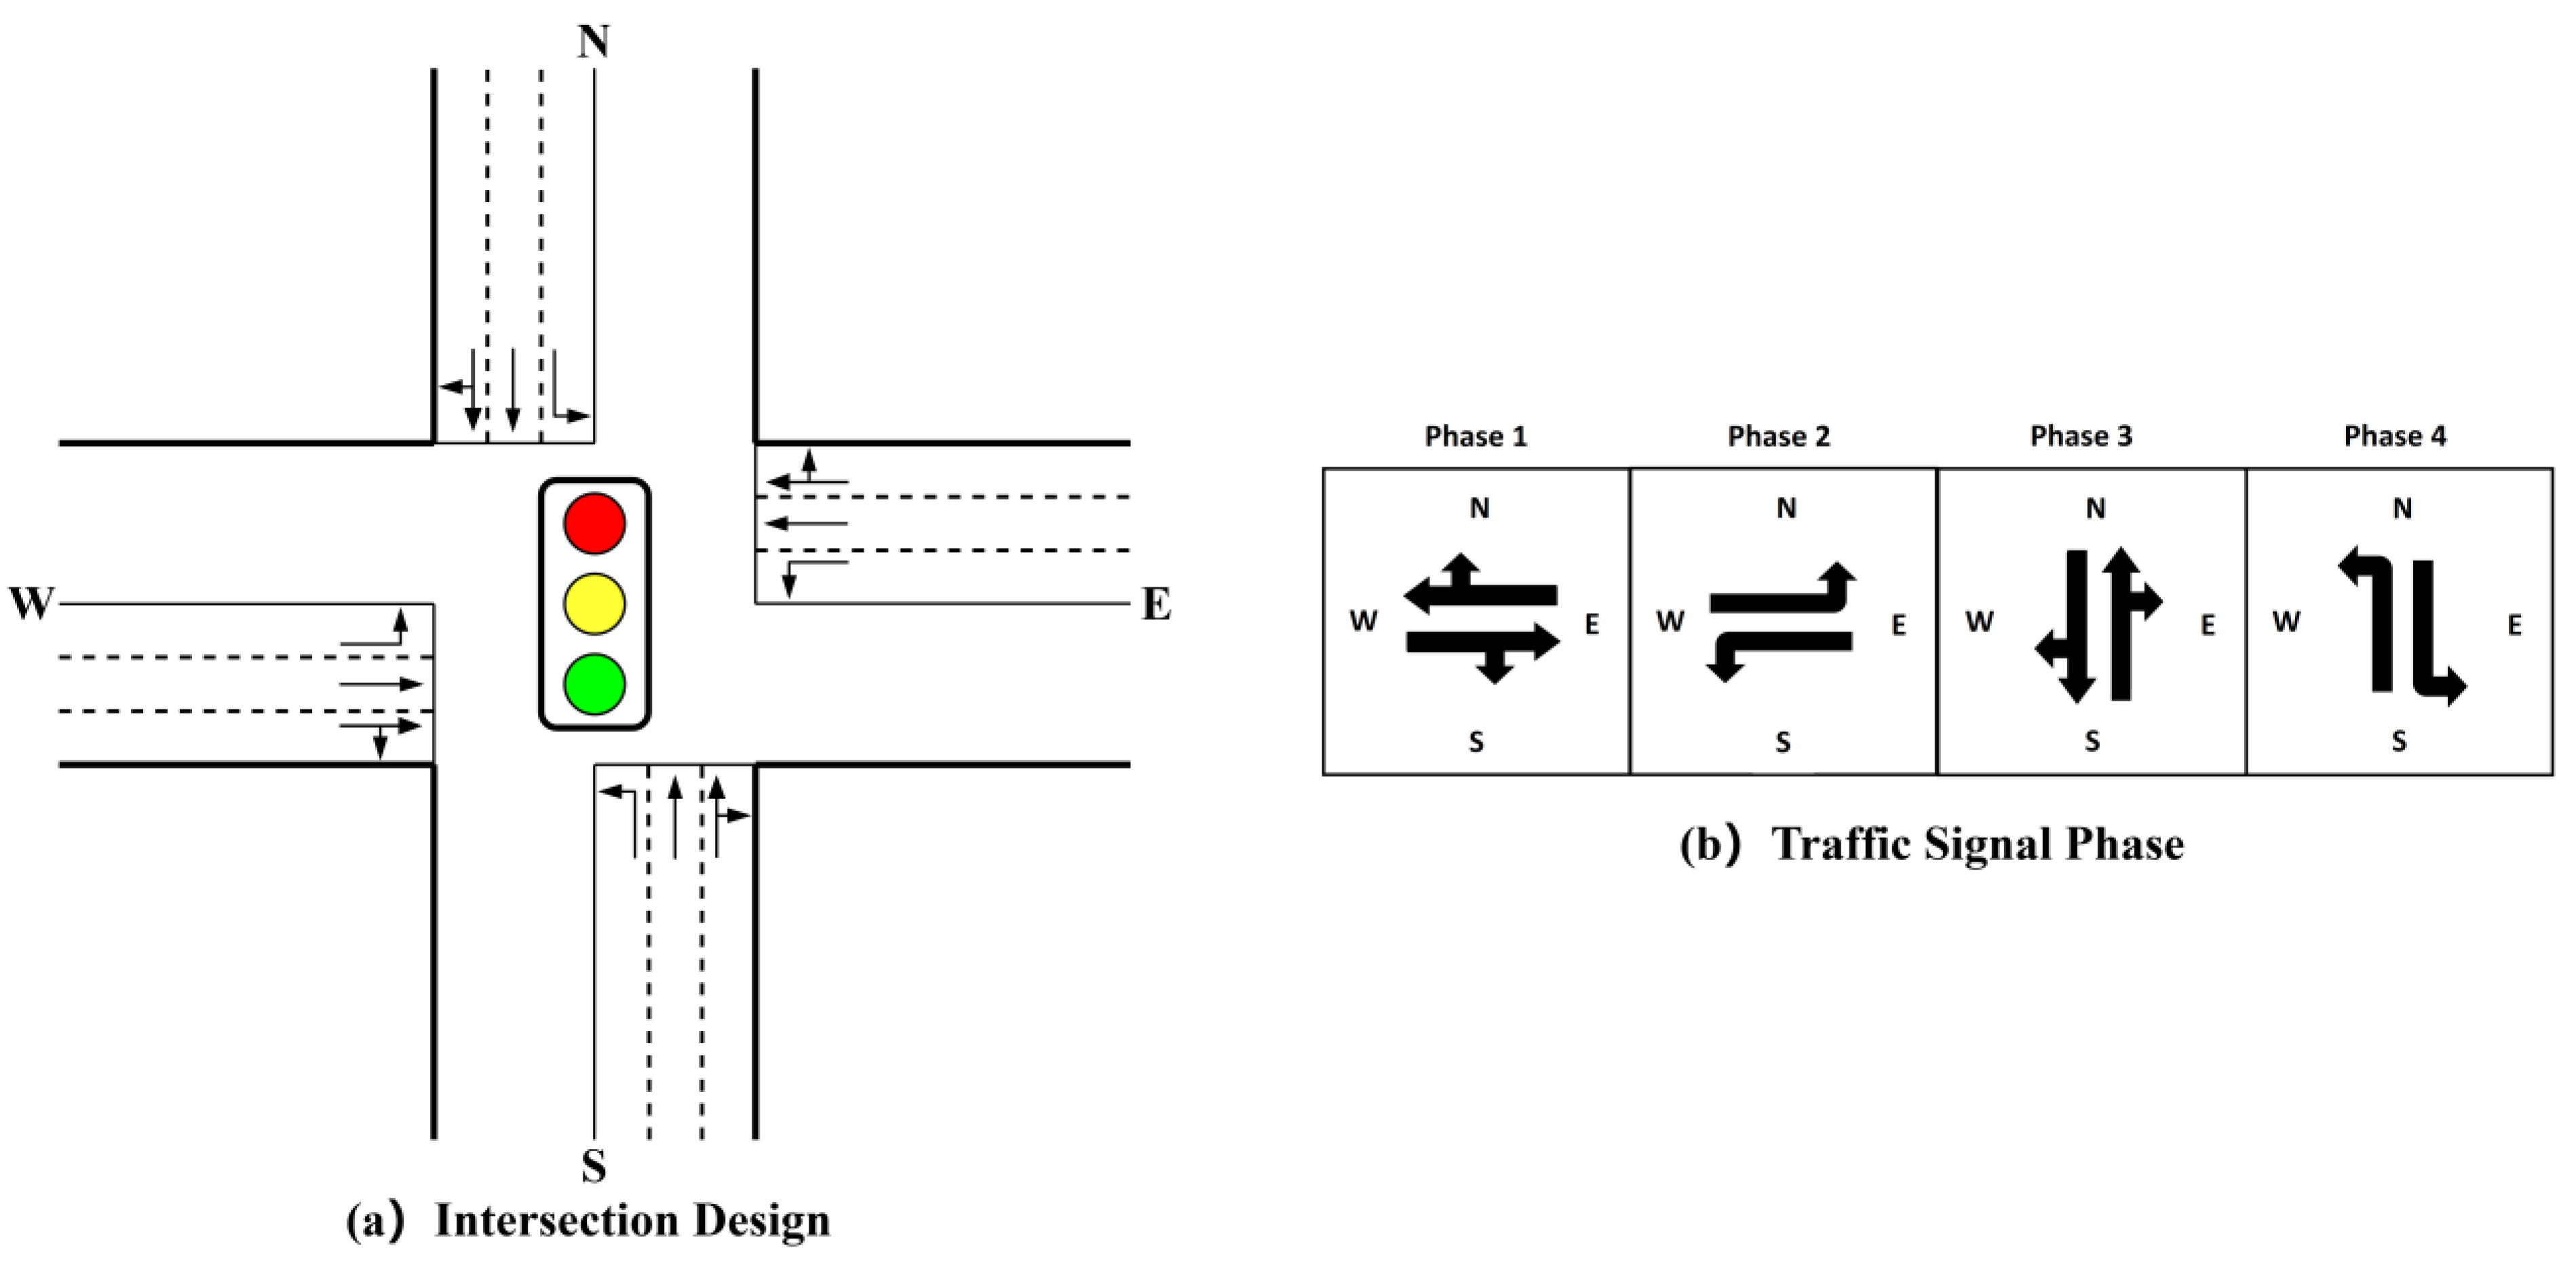
3.1. Research Problem Statement
3.2. Deep Reinforcement Learning
3.3. Framework
3.4. Agent Design
3.4.1. State
3.4.2. Action
3.4.3. Reward
| driver train loss (set to 0.95); | |
| , | vehicular masses and load masses, respectively; |
| gravitational constant (; | |
| , , | coefficients of resistance/friction; |
| the instantaneous velocity of vehicles; | |
| the vehicular coefficient from drag; | |
| cross-sectional area ; | |
| air mass density ; | |
| rotating mass. |
3.4.4. DQN Model
3.5. Overall Algorithm
| Algorithm 1: DRL-DG Algorithm Flow | |
| 1: | Initialize: Evaluation DQN, Target DQN, TSC component, memory pool |
| 2: | Establish simulation interface (TRACI) |
| 3: | for episode = 1 to total episode do |
| 4: | Initialize: road network environment, import traffic flow data |
| 5: | for time step = 1 to maximum time do |
| 6: | Agent observes the current environment |
| 7: | Choose based on -greedy policy |
| 8: | Import to TSC component |
| 9: | TSC component changes traffic signal phase |
| 10: | Output and calculates reward |
| 11: | Store in memory pool |
| 12: | end for |
| 13: | Extract samples from the memory pool to train the network |
| 14: | Based on to calculate optimization goals |
| 15: | Update the parameters of Evaluation/Target DQN using the mean square error loss function |
| 16: | end for |
4. Case Validation
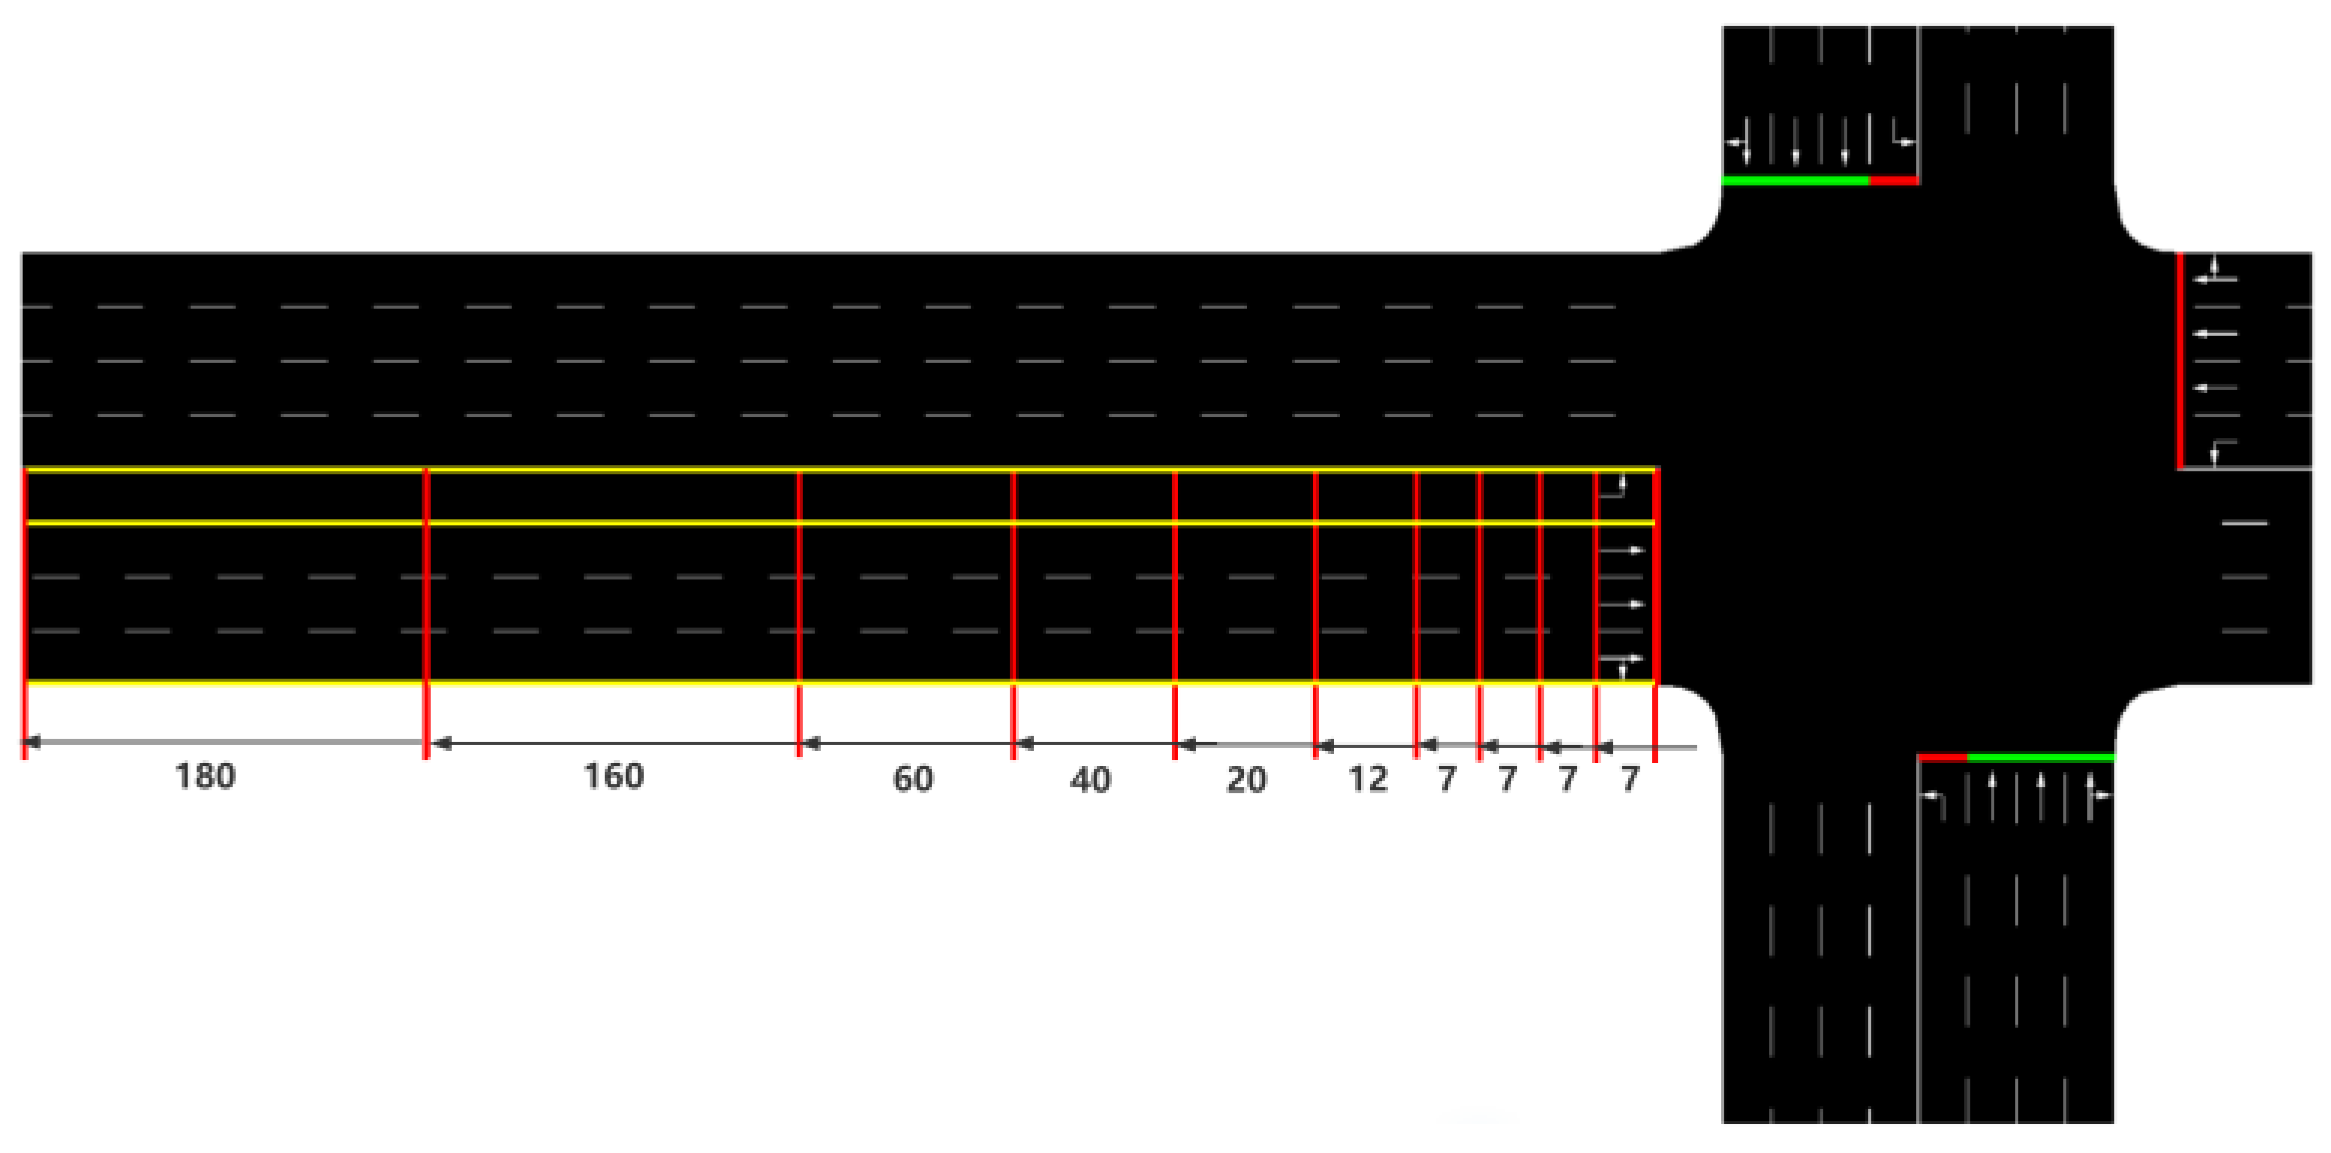
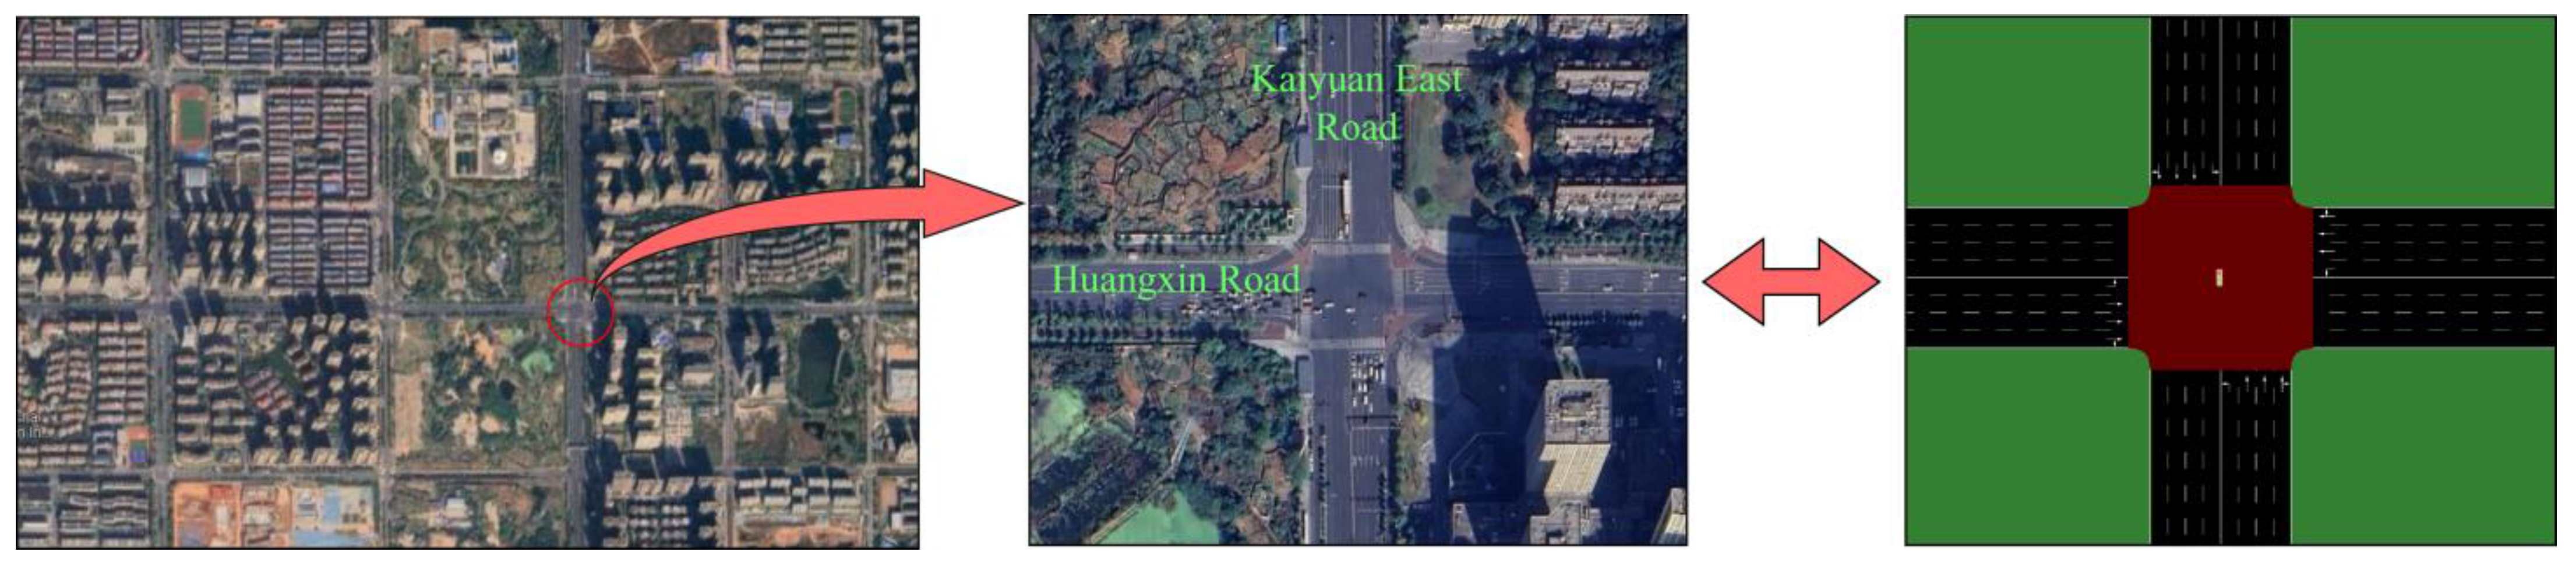
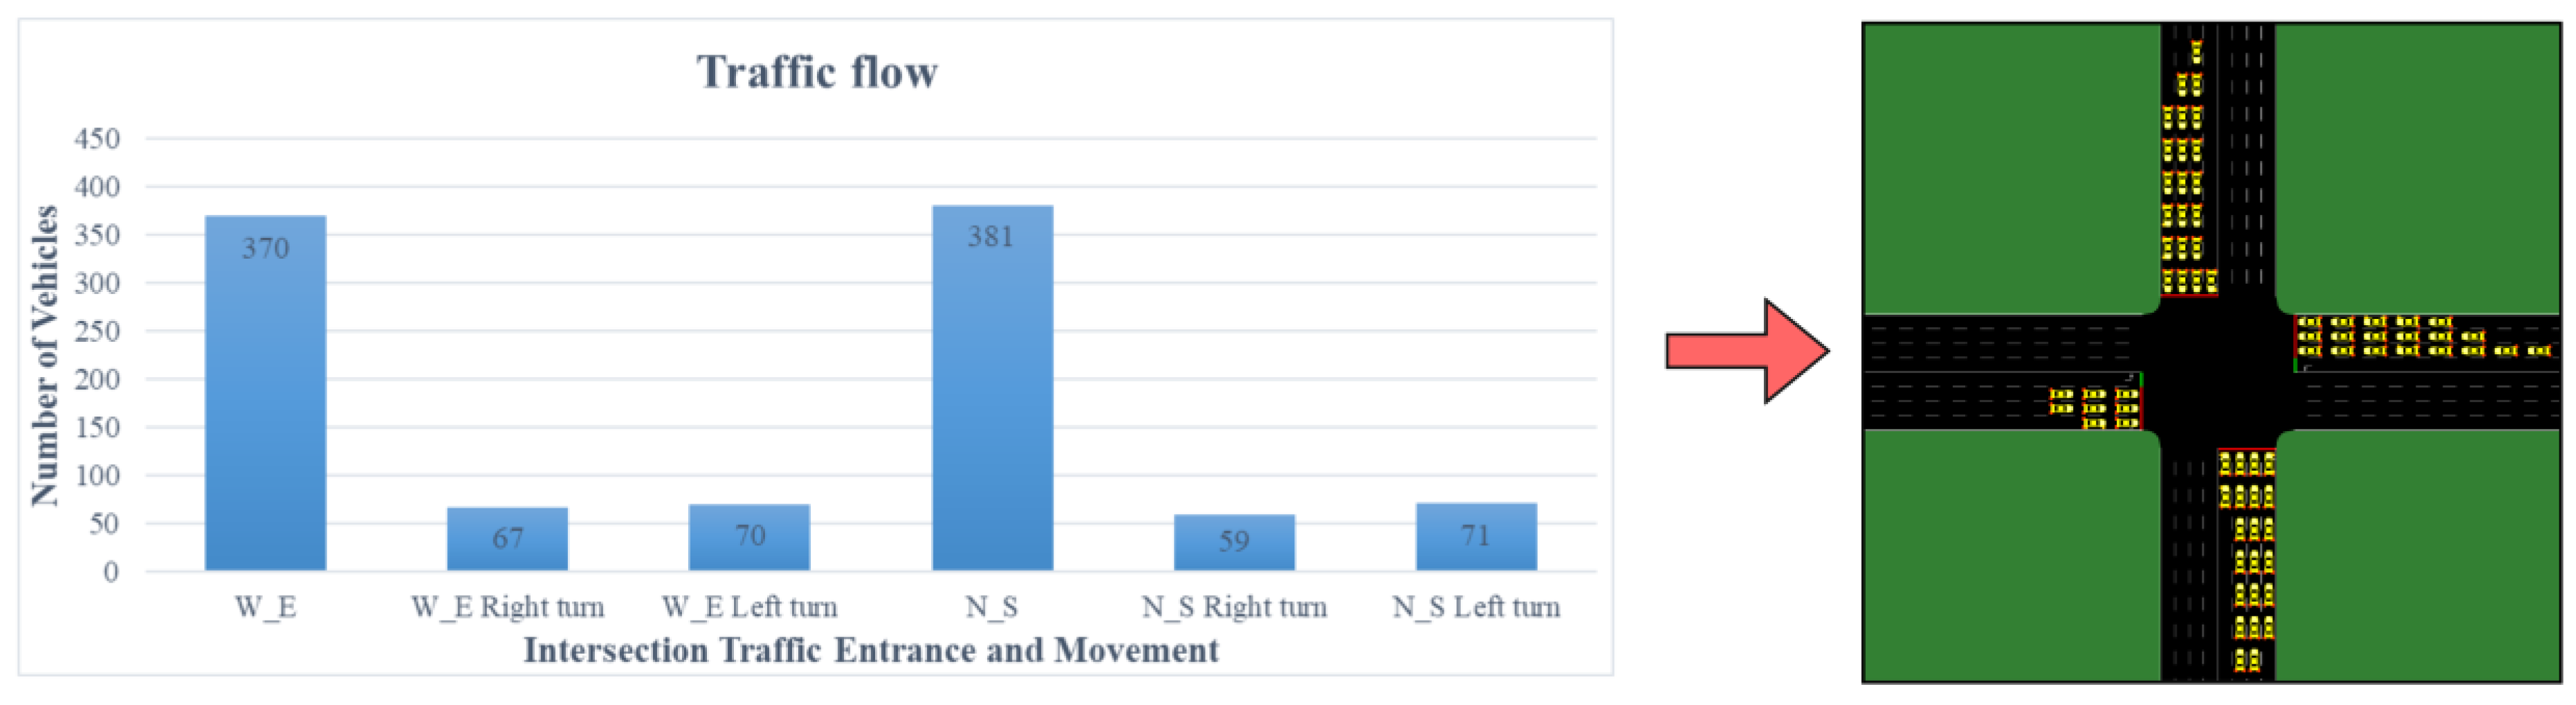
4.1. Scenario
4.2. Simulation and Algorithm Setting
4.3. Comparisons among Different TSC Systems
- (1)
- Fixed-time signal control (FTSC): FTSC predefines a set of timing schemes by the classic Webster timing method and is widely used for real-world traffic intersections. The duration set for phase 1, phase 2, phase 3, and phase 4 is 60, 40, 60, and 40 s, respectively. Between two adjacent phases, a four-second yellow signal is set.
- (2)
- Actuated signal control (ASC): ASC adjusts the traffic signal phase and the duration time based on the queue length and traffic flow. Once the queue length of the lane during the red signal phase reaches the threshold which is set as 70 m, the signal for this lane turns green. In case many vehicles are still in the lane during the green signal, the duration of the green signal will be extended up to 60 s [80].
- (3)
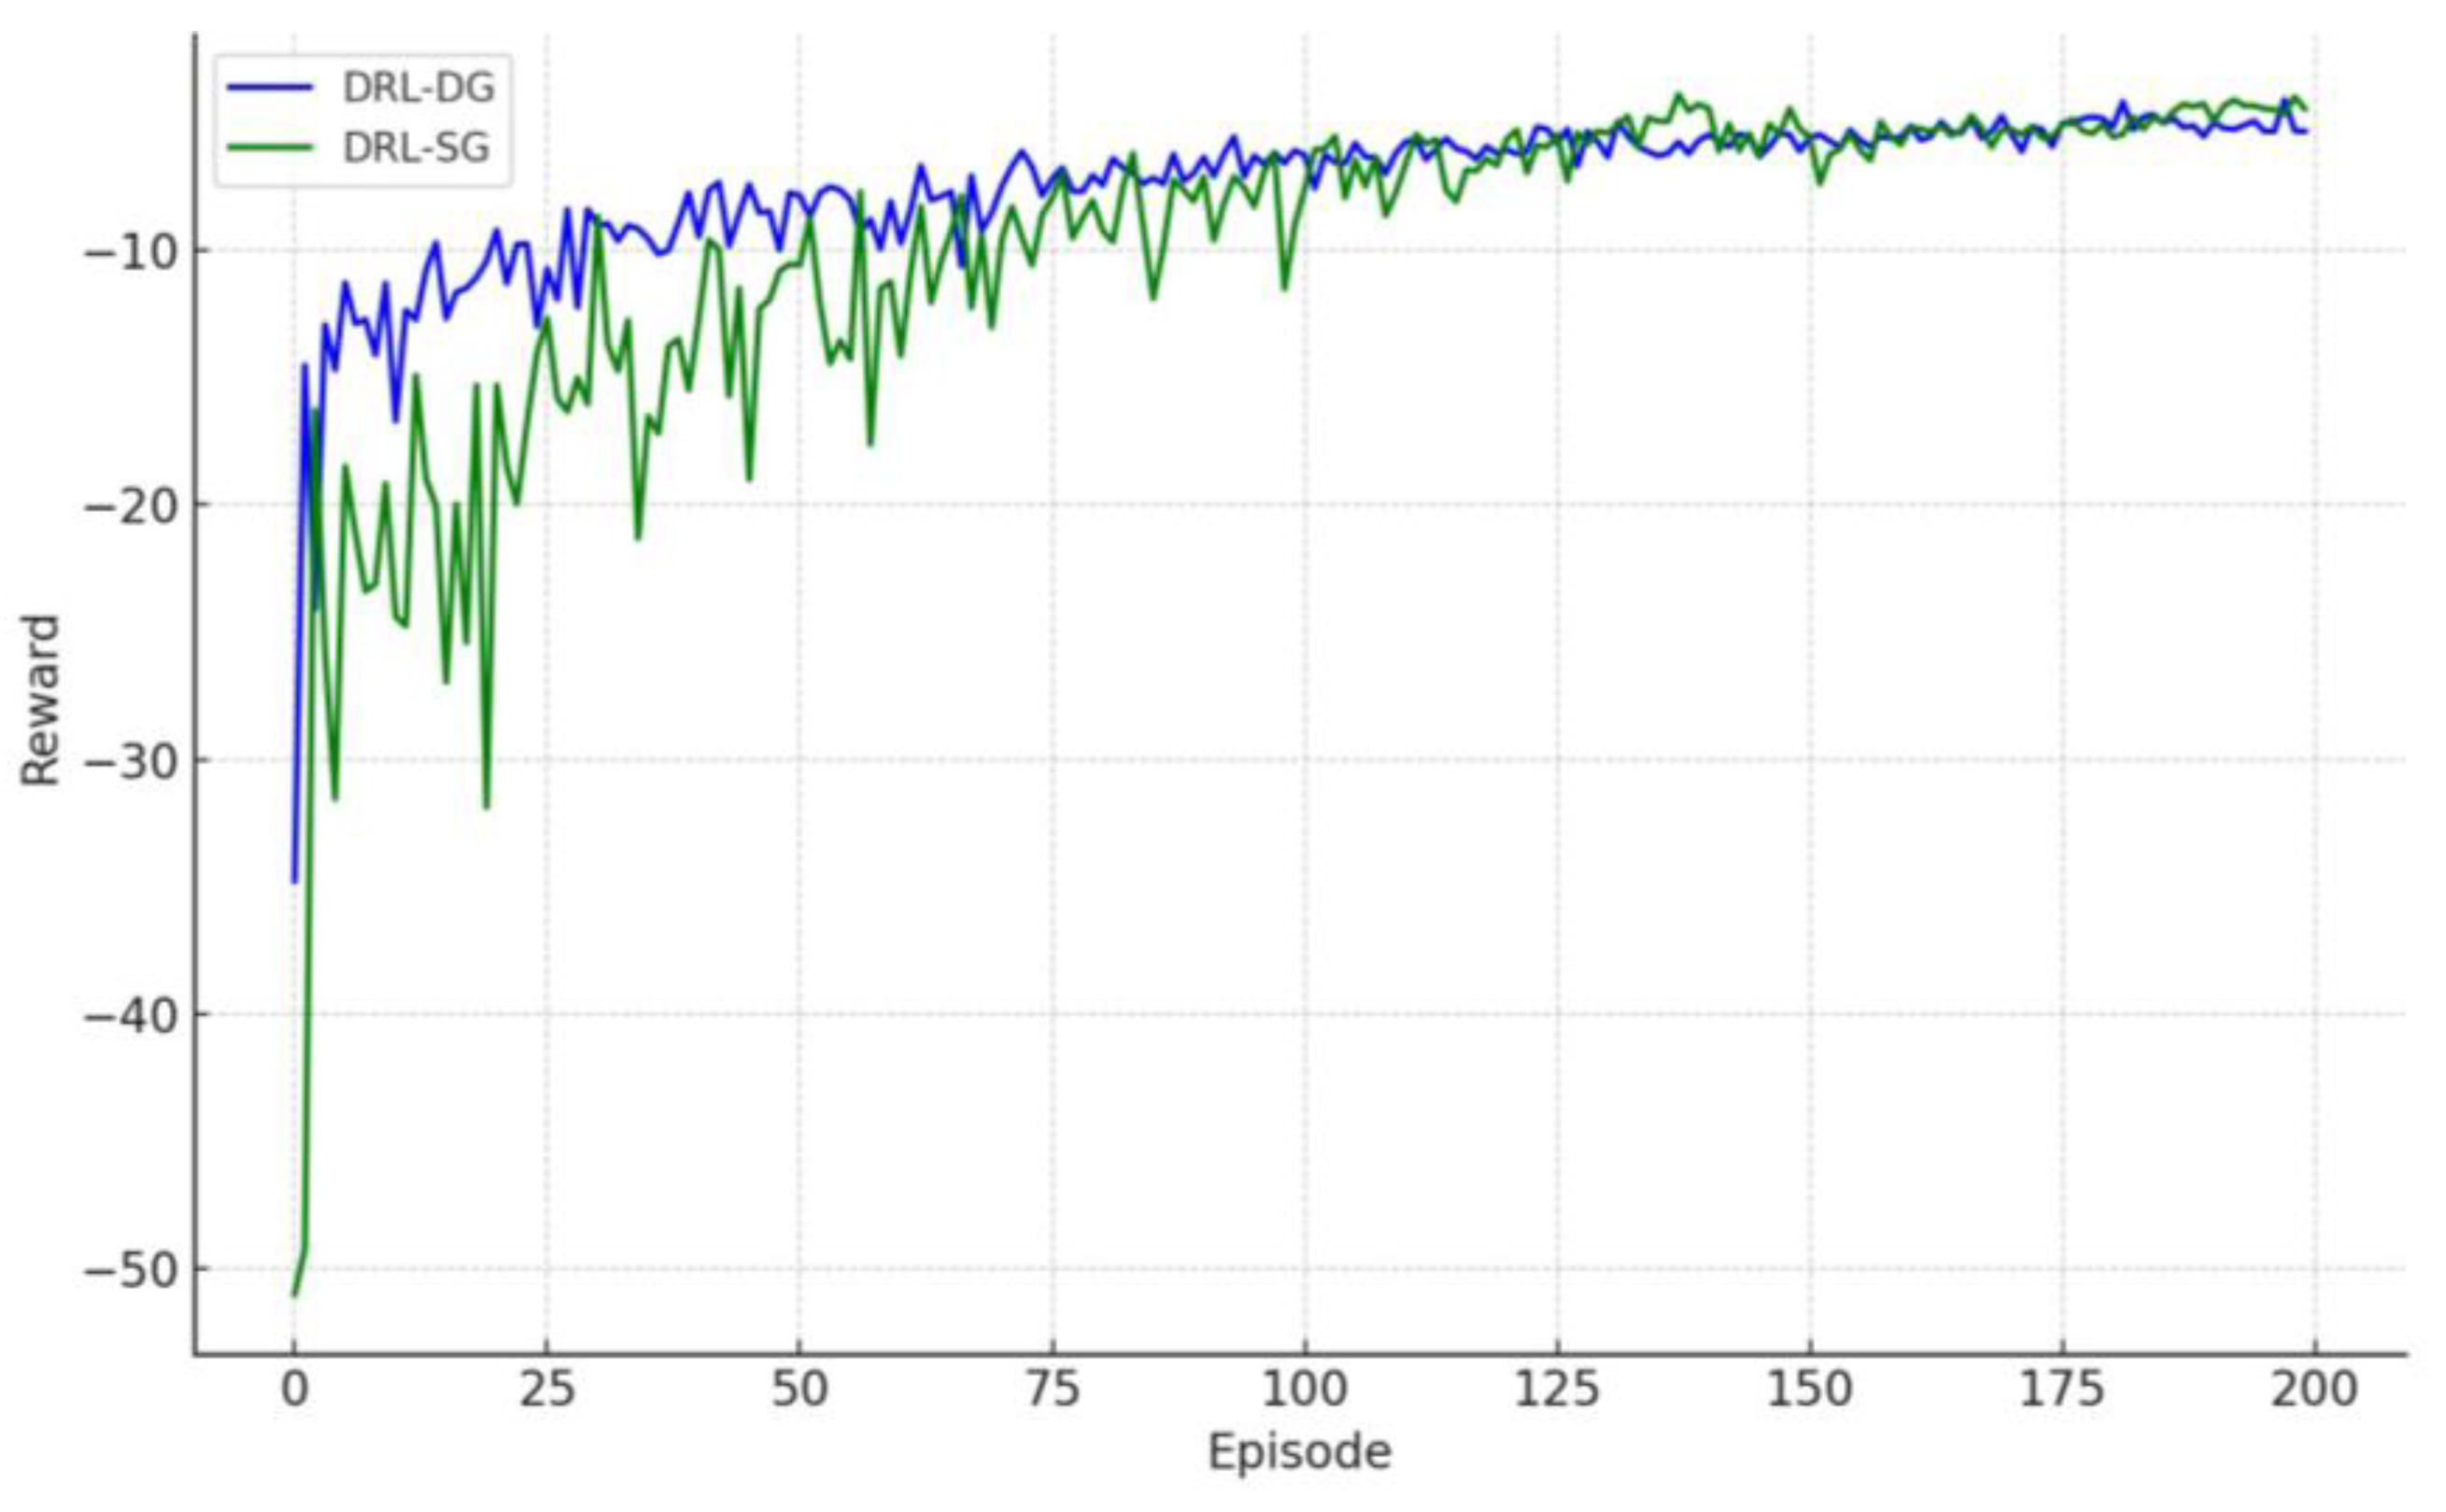
- DRL-based ATSC Optimizing Single Goal (DRL-SG): DRL-SG applies the DRL algorithm framework into ATSC to optimize traffic efficiency that receives the most attention. Similarly, the DQN model used for efficiency optimization is a conventional, long short-term, and fully connected neural network. The reward refers to the difference in the vehicular waiting time at two adjacent time steps.
4.4. Evaluation Metrics
- (1)
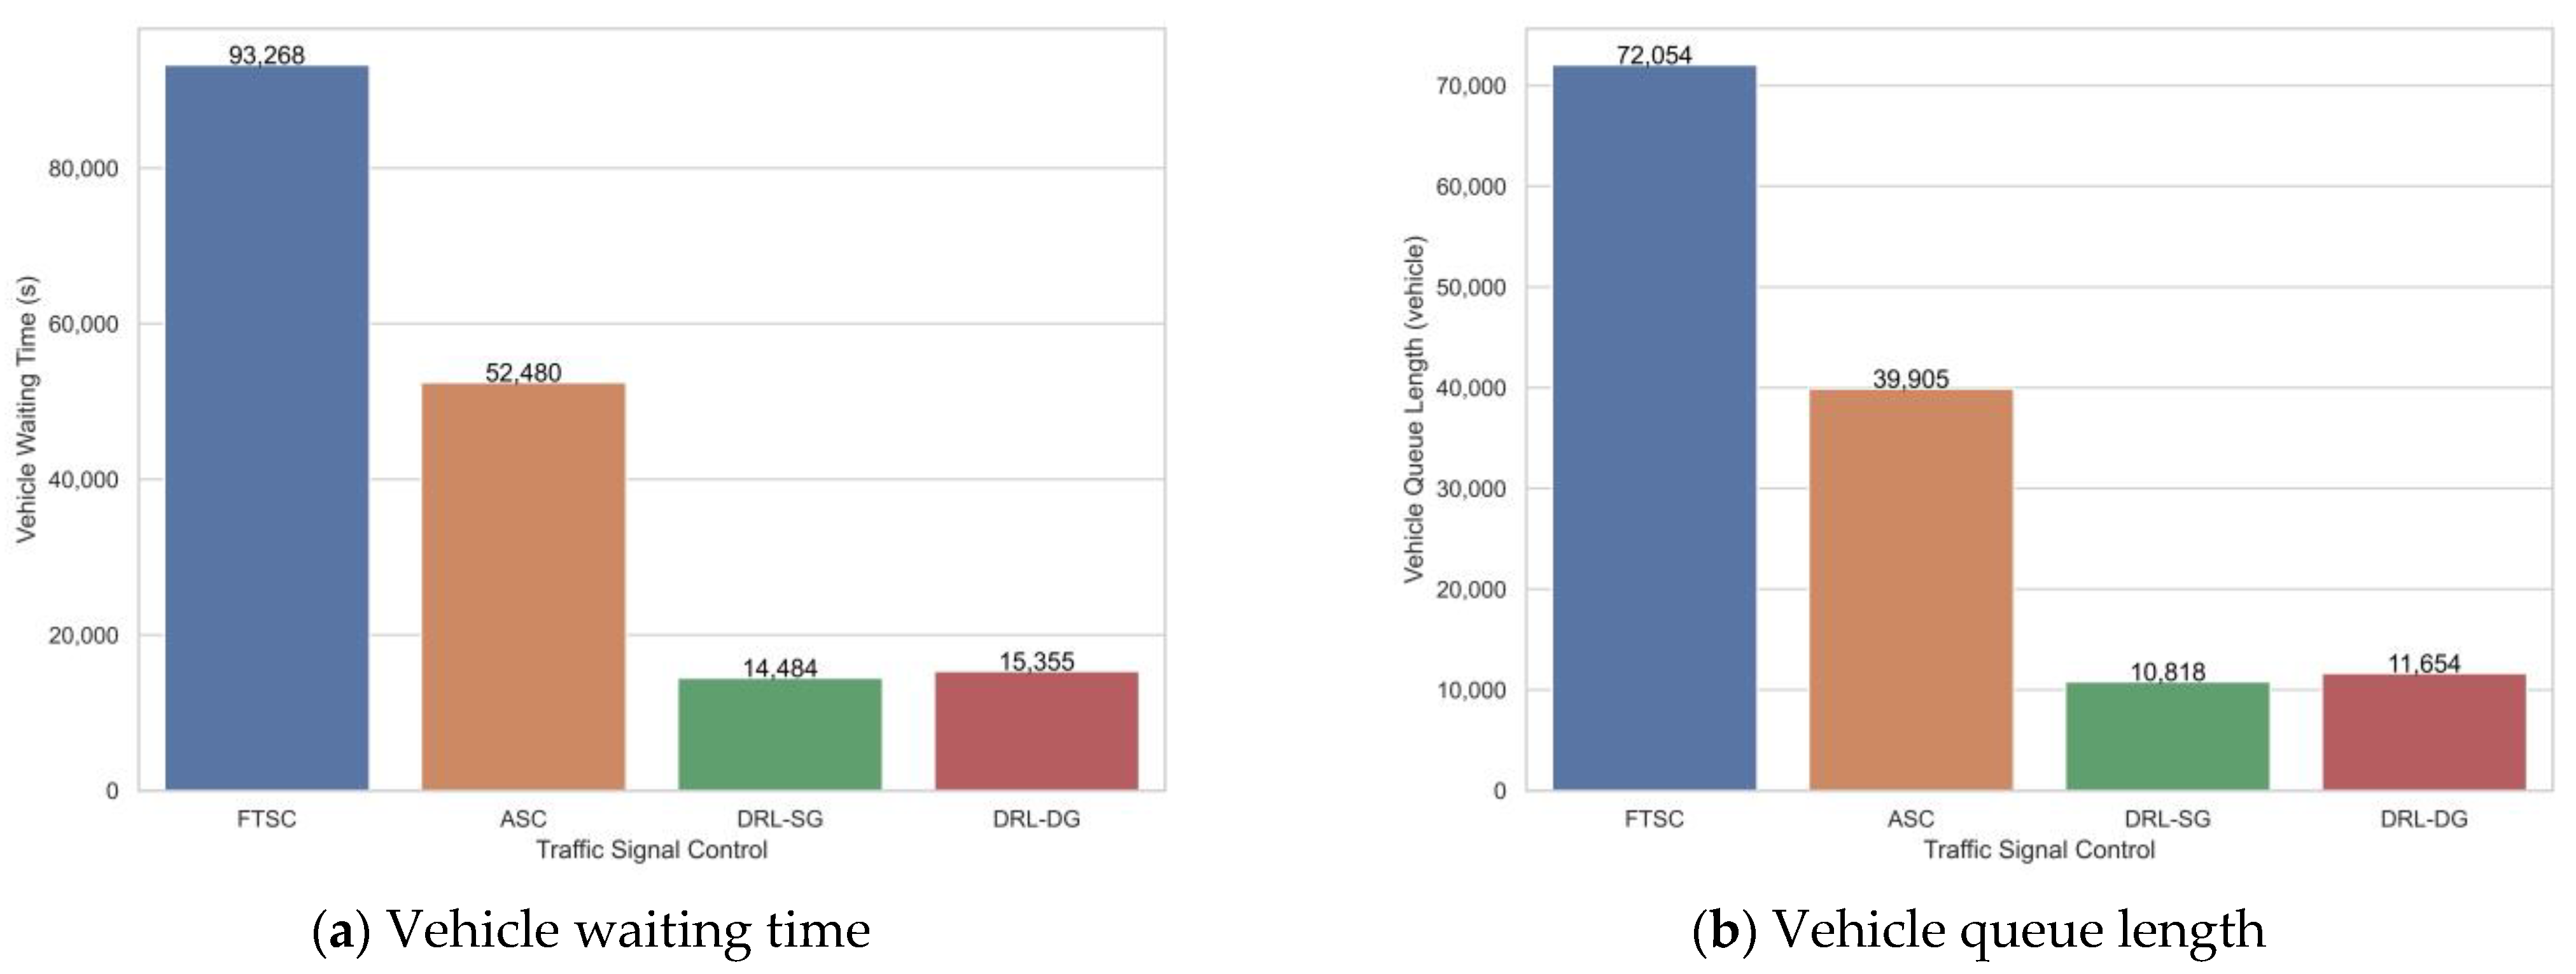
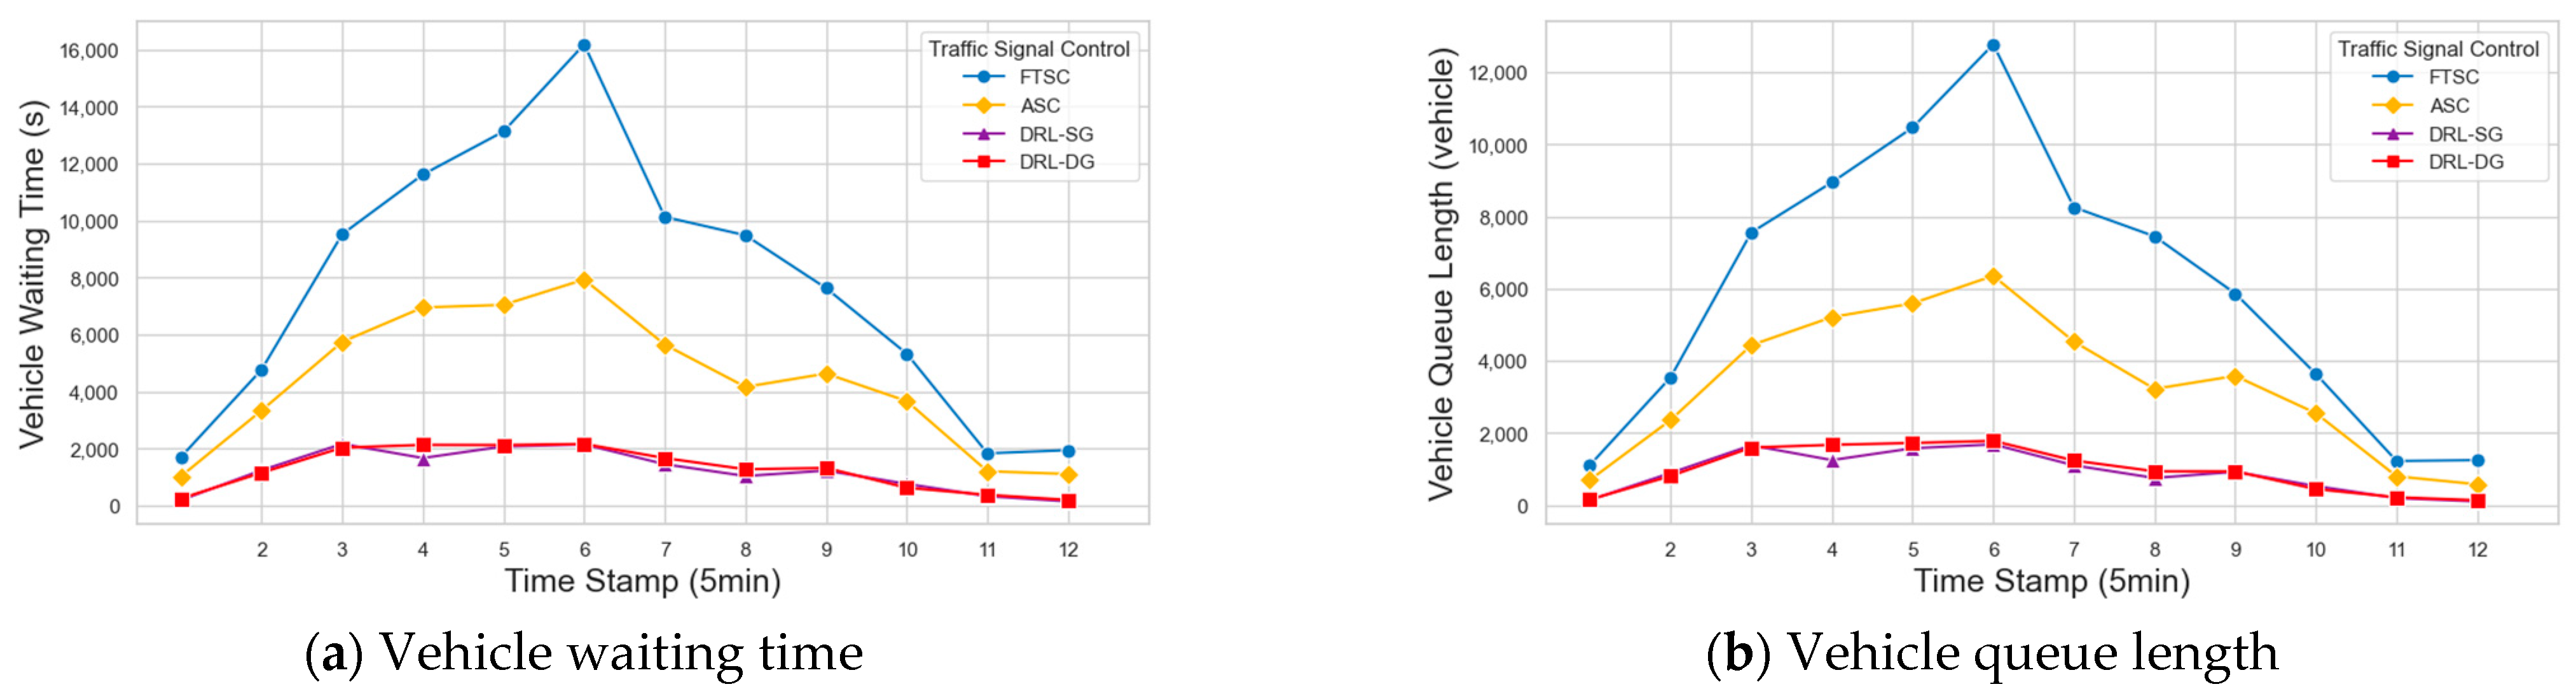
- Vehicle waiting time (VWT): This refers to the cumulative waiting time of vehicles stopping at the intersection in each time stamp (5 min). A lower VWT indicates a shorter time that vehicles are stopped at the intersection, contributing to higher traffic efficiency.
- (2)
- Vehicle queue length (VQL): This refers to the cumulative quantity of vehicles stopping at the intersection entrance in each time stamp (5 min). A lower VQL implies more vehicles crossing the intersection, reducing the possibility of congestion.
- (3)
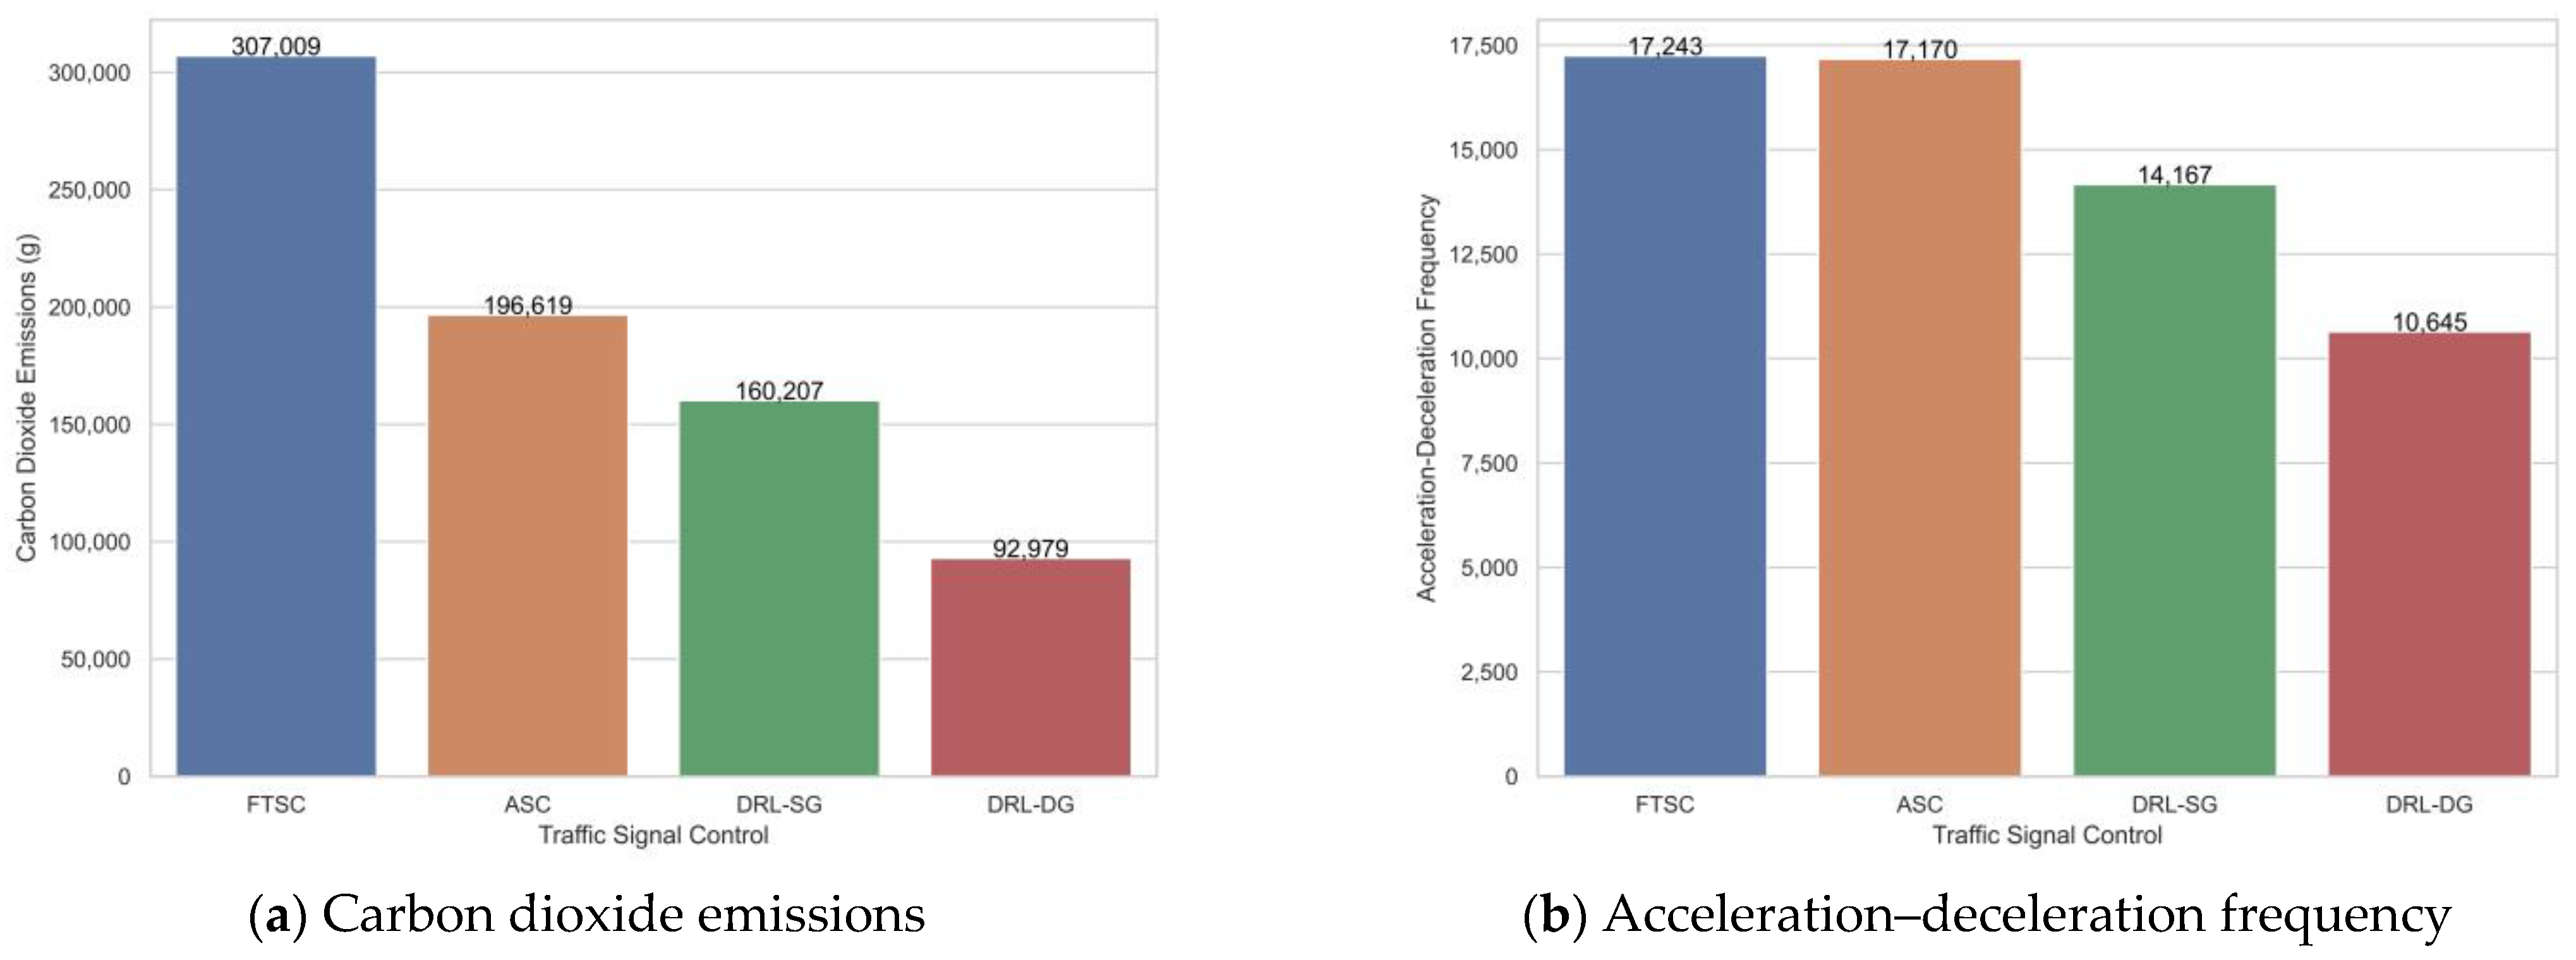
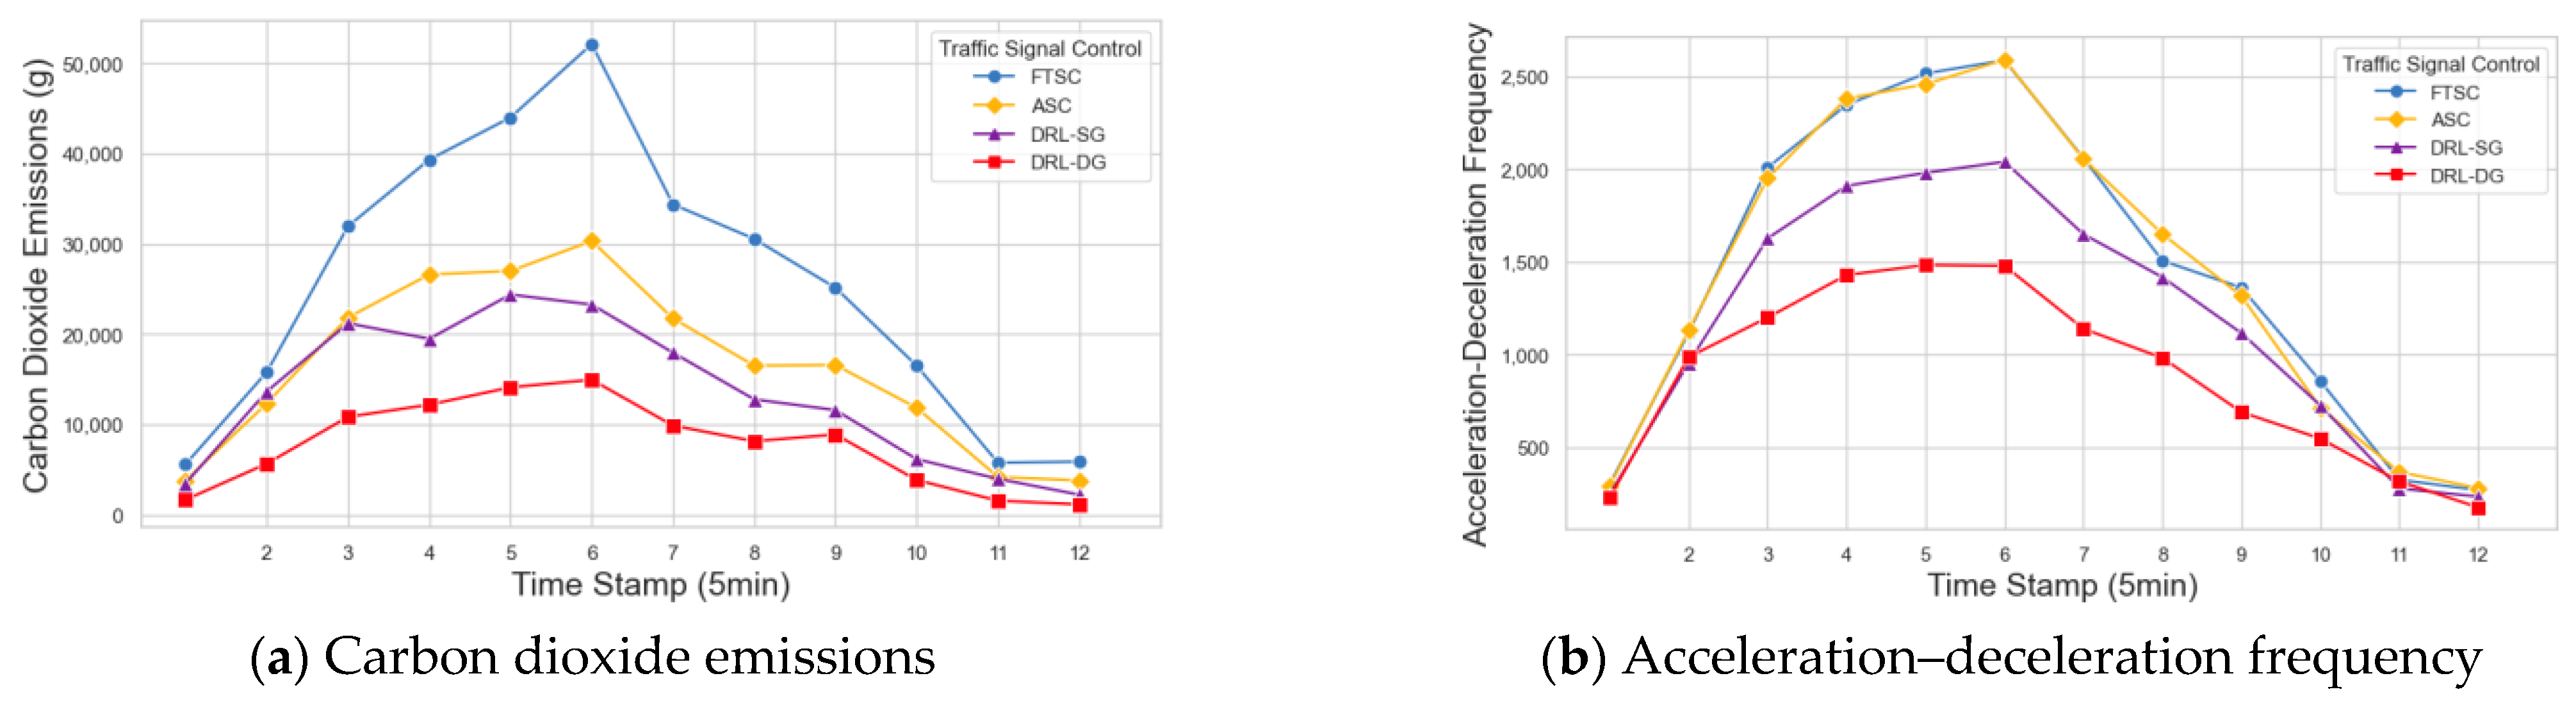
- Carbon Dioxide Emissions (CDEs): These refer to the total carbon dioxide emissions of vehicles in each time stamp (5 min). CDEs are used as the main index to evaluate vehicle carbon emissions. Lower CDEs denote lower carbon emissions.
- (4)
- Acceleration–deceleration frequency (ADF): This refers to the total frequency of vehicle accelerations or deceleration in each time stamp (5 min)). A lower ADF reveals lower extra carbon dioxide emissions (Vasconcelos et al. [23]).
- (5)
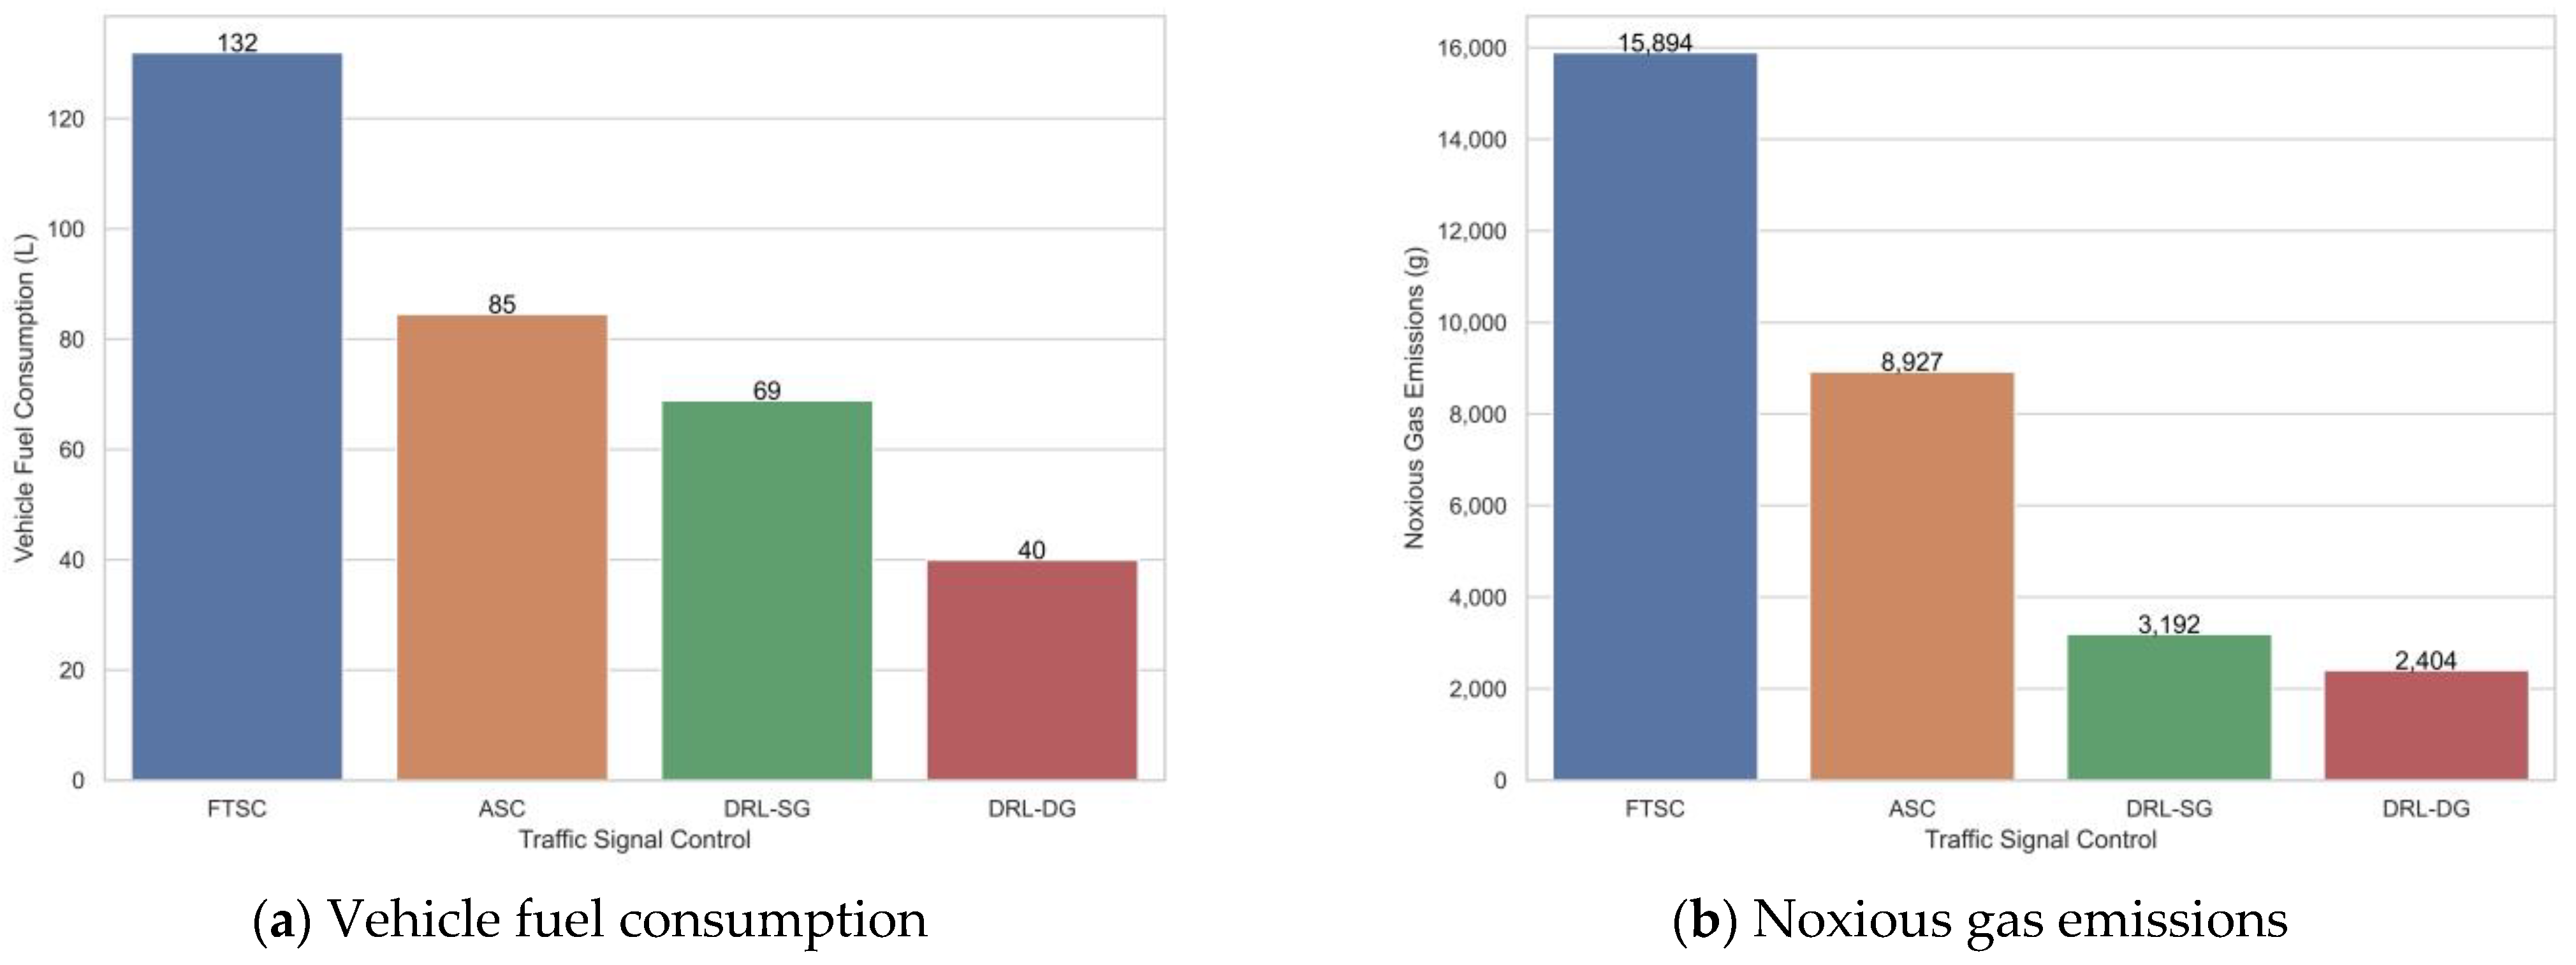
- Vehicle fuel consumption (VFC): This refers to the cumulative fuel consumed during driving in each time stamp (5 min). A lower VFC denotes a higher energy efficiency.
- (6)
- Noxious gas emissions (NGEs): These are the total emissions of carbon monoxide (CO) and nitrogen oxides (NOx) emitted by vehicles in each time stamp (5 min). Lower NGEs denote less toxic air pollutants. The CO and NOx emissions are estimated using SUMO’s pollutant emission model, which calculates emissions based on the vehicle’s current engine power and typical emission curves [78].
4.5. Results and Discussion
4.5.1. Overall Analysis
4.5.2. Comparative Analysis in Simulation
4.5.3. Opening the “Black Box” in DRL-DG
5. Conclusions
Author Contributions
Funding
Data Availability Statement
Conflicts of Interest
References
- Zhu, L.; Yu, F.R.; Wang, Y.; Ning, B.; Tang, T. Big Data Analytics in Intelligent Transportation Systems: A Survey. IEEE Trans. Intell. Transp. Syst. 2019, 20, 383–398. [Google Scholar] [CrossRef]
- Zhao, Y.; Tian, Z. Applicability of Adaptive Traffic Control Systems in Nevada’s Urban Areas; No. 092-09-803; Nevada Department of Transportation: Carson City, NV, USA, 2011. [Google Scholar]
- Federal Highway Administration. Traffic Signal Timing Manual; Technical Report FHWA-HOP-08-024; U.S. Department of Transportation: Washington, DC, USA, 2008. [Google Scholar]
- Muralidharan, A.; Pedarsani, R.; Varaiya, P. Analysis of fixed-time control. Transp. Res. Part B Methodol. 2015, 73, 81–90. [Google Scholar] [CrossRef]
- Celtek, S.A.; Durdu, A.; Ali, M.E.M. Evaluating Action Durations for Adaptive Traffic Signal Control Based On Deep Q-Learning. Int. J. Intell. Transp. Syst. Res. 2021, 19, 557–571. [Google Scholar] [CrossRef]
- Roess, R.P.; Prassas, E.S.; Mcshane, W.R. Traffic Engineering; Pearson/Prentice Hall: Hoboken, NJ, USA, 2014. [Google Scholar]
- Zhou, P.; Fang, Z.; Dong, H.; Liu, J.; Pan, S. Data analysis with multi-objective optimization algorithm: A study in smart traffic signal system. In Proceedings of the 2017 IEEE 15th International Conference on Software Engineering Research, Management and Applications (SERA), London, UK, 7–9 June 2017; pp. 307–310. [Google Scholar]
- Cesme, B.; Furth, P.G. Self-organizing traffic signals using secondary extension and dynamic coordination. Transp. Res. Part C Emerg. Technol. 2014, 48, 1–15. [Google Scholar] [CrossRef]
- Wang, X.B.; Yin, K.; Liu, H. Vehicle actuated signal performance under general traffic at an isolated intersection. Transp. Res. Part C Emerg. Technol. 2018, 95, 582–598. [Google Scholar] [CrossRef]
- Eom, M.; Kim, B.-I. The traffic signal control problem for intersections: A review. Eur. Transp. Res. Rev. 2020, 12, 50. [Google Scholar] [CrossRef]
- Wang, Y.; Yang, X.; Liang, H.; Liu, Y. A Review of the Self-Adaptive Traffic Signal Control System Based on Future Traffic Environment. J. Adv. Transp. 2018, 2018, 1096123. [Google Scholar] [CrossRef]
- Stevanovic, A.; Kergaye, C.; Martin, P.T. Scoot and scats: A closer look into their operations. In Proceedings of the 88th Annual Meeting of the Transportation Research Board, Washington DC, USA, 11–15 January 2009. [Google Scholar]
- Zhao, D.; Dai, Y.; Zhang, Z. Computational Intelligence in Urban Traffic Signal Control: A Survey. IEEE Trans. Syst. Man Cybern. Part C Appl. Rev. 2011, 42, 485–494. [Google Scholar] [CrossRef]
- Wei, H.; Zheng, G.; Gayah, V.; Li, Z. Recent advances in reinforcement learning for traffic signal control: A survey of models and evaluation. ACM SIGKDD Explor. Newsl. 2021, 22, 12–18. [Google Scholar] [CrossRef]
- Balaji, P.; German, X.; Srinivasan, D. Urban traffic signal control using reinforcement learning agents. IET Intell. Transp. Syst. 2010, 4, 177–188. [Google Scholar] [CrossRef]
- Mikami, S.; Kakazu, Y. Genetic reinforcement learning for cooperative traffic signal control. First IEEE Conference on Evolutionary Computation. In Proceedings of the IEEE World Congress on Computational Intelligence, Orlando, FL, USA, 27–29 June 1994; pp. 223–228. [Google Scholar]
- Dai, Y.; Hu, J.; Zhao, D.; Zhu, F. Neural network based online traffic signal controller design with reinforcement training. In Proceedings of the 2011 14th International IEEE Conference on Intelligent Transportation Systems—(ITSC 2011), Washington, DC, USA, 5–7 October 2011; pp. 1045–1050. [Google Scholar]
- Arel, I.; Liu, C.; Urbanik, T.; Kohls, A. Reinforcement learning-based multi-agent system for network traffic signal control. IET Intell. Transp. Syst. 2010, 4, 128. [Google Scholar] [CrossRef]
- Haydari, A.; Yilmaz, Y. Deep Reinforcement Learning for Intelligent Transportation Systems: A Survey. IEEE Trans. Intell. Transp. Syst. 2020, 23, 11–32. [Google Scholar] [CrossRef]
- Noaeen, M.; Naik, A.; Goodman, L.; Crebo, J.; Abrar, T.; Abad, Z.S.H.; Bazzan, A.L.; Far, B. Reinforcement learning in urban network traffic signal control: A systematic literature review. Expert Syst. Appl. 2022, 199, 116830. [Google Scholar] [CrossRef]
- Gregurić, M.; Vujić, M.; Alexopoulos, C.; Miletić, M. Application of Deep Reinforcement Learning in Traffic Signal Control: An Overview and Impact of Open Traffic Data. Appl. Sci. 2020, 10, 4011. [Google Scholar] [CrossRef]
- Liu, S.; Wu, G.; Barth, M. A Complete State Transition-Based Traffic Signal Control Using Deep Reinforcement Learning. In Proceedings of the 2022 IEEE Conference on Technologies for Sustainability (SusTech), Corona, CA, USA, 21–23 April 2022; pp. 100–107. [Google Scholar]
- Vasconcelos, L.; Silva, A.B.; Seco, Á.M.; Fernandes, P.; Coelho, M.C. Turboroundabouts: Multicriterion assessment of intersection capacity, safety, and emissions. Transp. Res. Rec. 2014, 2402, 28–37. [Google Scholar] [CrossRef]
- Yao, R.; Wang, X.; Xu, H.; Lian, L. Emission factor calibration and signal timing optimisation for isolated intersections. IET Intell. Transp. Syst. 2018, 12, 158–167. [Google Scholar] [CrossRef]
- Yao, R.; Sun, L.; Long, M. VSP-based emission factor calibration and signal timing optimisation for arterial streets. IET Intell. Transp. Syst. 2019, 13, 228–241. [Google Scholar] [CrossRef]
- Hao, P.; Wu, G.; Boriboonsomsin, K.; Barth, M.J. Eco-Approach and Departure (EAD) Application for Actuated Signals in Real-World Traffic. IEEE Trans. Intell. Transp. Syst. 2018, 20, 30–40. [Google Scholar] [CrossRef]
- Shepelev, V.; Glushkov, A.; Fadina, O.; Gritsenko, A. Comparative Evaluation of Road Vehicle Emissions at Urban Intersections with Detailed Traffic Dynamics. Mathematics 2022, 10, 1887. [Google Scholar] [CrossRef]
- Shepelev, V.; Glushkov, A.; Slobodin, I.; Balfaqih, M. Studying the Relationship between the Traffic Flow Structure, the Traffic Capacity of Intersections, and Vehicle-Related Emissions. Mathematics 2023, 11, 3591. [Google Scholar] [CrossRef]
- Jovanović, A.; Kukić, K.; Stevanović, A.; Teodorović, D. Restricted crossing U-turn traffic control by interval Type-2 fuzzy logic. Expert Syst. Appl. 2023, 211, 118613. [Google Scholar] [CrossRef]
- Zheng, L.; Li, X. Simulation-based optimization method for arterial signal control considering traffic safety and efficiency under uncertainties. Comput. Civ. Infrastruct. Eng. 2023, 38, 640–659. [Google Scholar] [CrossRef]
- Tsitsokas, D.; Kouvelas, A.; Geroliminis, N. Two-layer adaptive signal control framework for large-scale dynamically-congested networks: Combining efficient Max Pressure with Perimeter Control. Transp. Res. Part C Emerg. Technol. 2023, 152, 104128. [Google Scholar] [CrossRef]
- Zhao, J.; Ma, W. An Alternative Design for the Intersections with Limited Traffic Lanes and Queuing Space. IEEE Trans. Intell. Transp. Syst. 2021, 22, 1473–1483. [Google Scholar] [CrossRef]
- Li, J.; Peng, L.; Xu, S.; Li, Z. Distributed edge signal control for cooperating pre-planned connected automated vehicle path and signal timing at edge computing-enabled intersections. Expert Syst. Appl. 2024, 241, 122570. [Google Scholar] [CrossRef]
- Li, J.; Yu, C.; Shen, Z.; Su, Z.; Ma, W. A survey on urban traffic control under mixed traffic environment with connected automated vehicles. Transp. Res. Part C Emerg. Technol. 2023, 154, 104258. [Google Scholar] [CrossRef]
- McKenney, D.; White, T. Distributed and adaptive traffic signal control within a realistic traffic simulation. Eng. Appl. Artif. Intell. 2013, 26, 574–583. [Google Scholar] [CrossRef]
- Tan, W.; Li, Z.C.; Tan, Z.J. Modeling the effects of speed limit, acceleration, and deceleration on overall delay and traffic emission at a signalized intersection. J. Transp. Eng. Part A-Syst. 2017, 143, 04017063. [Google Scholar] [CrossRef]
- Shi, X.; Zhang, J.; Jiang, X.; Chen, J.; Hao, W.; Wang, B. Learning eco-driving strategies from human driving trajectories. Phys. A Stat. Mech. Its Appl. 2024, 633, 129353. [Google Scholar] [CrossRef]
- Rabinowitz, A.I.; Ang, C.C.; Mahmoud, Y.H.; Araghi, F.M.; Meyer, R.T.; Kolmanovsky, I.; Asher, Z.D.; Bradley, T.H. Real-Time Implementation Comparison of Urban Eco-Driving Controls. IEEE Trans. Control. Syst. Technol. 2023, 32, 143–157. [Google Scholar] [CrossRef]
- Li, Y.; Yang, Y.; Lin, X.; Hu, X. Traffic Information-Based Hierarchical Control Strategies for Eco-Driving of Plug-In Hybrid Electric Vehicles. IEEE Trans. Veh. Technol. 2023, 73, 3206–3217. [Google Scholar] [CrossRef]
- Dong, S.; Harzer, J.; Frey, J.; Meng, X.; Liu, Q.; Gao, B.; Diehl, M.; Chen, H. Cooperative Eco-Driving Control of Connected Multi-Vehicles With Spatio-Temporal Constraints. IEEE Trans. Intell. Veh. 2023, 9, 1733–1743. [Google Scholar] [CrossRef]
- Zhang, Z.; Ding, H.; Guo, K.; Zhang, N. An Eco-driving Control Strategy for Connected Electric Vehicles at Intersections Based on Preceding Vehicle Speed Prediction. IEEE Trans. Transp. Electrif. 2024, 1–13. [Google Scholar] [CrossRef]
- Boukerche, A.; Zhong, D.; Sun, P. FECO: An Efficient Deep Reinforcement Learning-Based Fuel-Economic Traffic Signal Control Scheme. IEEE Trans. Sustain. Comput. 2021, 7, 144–156. [Google Scholar] [CrossRef]
- Ding, H.; Zhuang, W.; Dong, H.; Yin, G.; Liu, S.; Bai, S. Eco-Driving Strategy Design of Connected Vehicle among Multiple Signalized Intersections Using Constraint-enforced Reinforcement Learning. IEEE Trans. Transp. Electrif. 2024, 1–12. [Google Scholar] [CrossRef]
- Wang, Q.; Ju, F.; Wang, H.; Qian, Y.; Zhu, M.; Zhuang, W.; Wang, L. Multi-agent reinforcement learning for ecological car-following control in mixed traffic. IEEE Trans. Transp. Electrification 2024, 1–14. [Google Scholar] [CrossRef]
- Feng, J.; Lin, K.; Shi, T.; Wu, Y.; Wang, Y.; Zhang, H.; Tan, H. Cooperative traffic optimization with multi-agent reinforcement learning and evolutionary strategy: Bridging the gap between micro and macro traffic control. Phys. A Stat. Mech. Its Appl. 2024, 647, 129734. [Google Scholar] [CrossRef]
- Krishankumar, R.; Pamucar, D.; Deveci, M.; Ravichandran, K.S. Prioritization of zero-carbon measures for sustainable urban mobility using integrated double hierarchy decision framework and EDAS approach. Sci. Total. Environ. 2021, 797, 149068. [Google Scholar] [CrossRef] [PubMed]
- Liu, J.; Wang, C.; Zhao, W. An eco-driving strategy for autonomous electric vehicles crossing continuous speed-limit signalized intersections. Energy 2024, 294, 130829. [Google Scholar] [CrossRef]
- Zhang, X.; Fan, X.; Yu, S.; Shan, A.; Fan, S.; Xiao, Y.; Dang, F. Intersection Signal Timing Optimization: A Multi-Objective Evolutionary Algorithm. Sustainability 2022, 14, 1506. [Google Scholar] [CrossRef]
- Zhang, G.; Chang, F.; Jin, J.; Yang, F.; Huang, H. Multi-objective deep reinforcement learning approach for adaptive traffic signal control system with concurrent optimization of safety, efficiency, and decarbonization at intersections. Accid. Anal. Prev. 2024, 199, 107451. [Google Scholar] [CrossRef]
- Salem, S.; Leonhardt, A. Optimizing Traffic Adaptive Signal Control: A Multi-Objective Simulation-Based Approach for Enhanced Transportation Efficiency. In Proceedings of the 10th International Conference on Vehicle Technology and Intelligent Transport Systems—VEHITS, Angers, France, 2–4 May 2024; pp. 344–351. [Google Scholar] [CrossRef]
- Lin, Z.; Gao, K.; Wu, N.; Suganthan, P.N. Problem-Specific Knowledge Based Multi-Objective Meta-Heuristics Combined Q-Learning for Scheduling Urban Traffic Lights With Carbon Emissions. IEEE Trans. Intell. Transp. Syst. 2024, 1–12. [Google Scholar] [CrossRef]
- Deshpande, S.R.; Jung, D.; Bauer, L.; Canova, M. Integrated Approximate Dynamic Programming and Equivalent Consumption Minimization Strategy for Eco-Driving in a Connected and Automated Vehicle. IEEE Trans. Veh. Technol. 2021, 70, 11204–11215. [Google Scholar] [CrossRef]
- Wan, C.; Shan, X.; Hao, P.; Wu, G. Multi-objective coordinated control strategy for mixed traffic with partially connected and automated vehicles in urban corridors. Phys. A Stat. Mech. Its Appl. 2024, 635, 129485. [Google Scholar] [CrossRef]
- Jamil, A.R.M.; Ganguly, K.K.; Nower, N. Adaptive traffic signal control system using composite reward architecture based deep reinforcement learning. IET Intell. Transp. Syst. 2020, 14, 2030–2041. [Google Scholar] [CrossRef]
- Liu, C.; Sheng, Z.; Chen, S.; Shi, H.; Ran, B. Longitudinal control of connected and automated vehicles among signalized intersections in mixed traffic flow with deep reinforcement learning approach. Phys. A Stat. Mech. Its Appl. 2023, 629, 129189. [Google Scholar] [CrossRef]
- Hua, C.; Fan, W.D. Safety-oriented dynamic speed harmonization of mixed traffic flow in nonrecurrent congestion. Phys. A Stat. Mech. Its Appl. 2024, 634, 129439. [Google Scholar] [CrossRef]
- Jamil, A.R.M.; Nower, N. A Comprehensive Analysis of Reward Function for Adaptive Traffic Signal Control. Knowl. Eng. Data Sci. 2021, 4, 85–96. [Google Scholar] [CrossRef]
- Ahmed, A.A.; Malebary, S.J.; Ali, W.; Barukab, O.M. Smart Traffic Shaping Based on Distributed Reinforcement Learning for Multimedia Streaming over 5G-VANET Communication Technology. Mathematics 2023, 11, 700. [Google Scholar] [CrossRef]
- Agafonov, A.; Yumaganov, A.; Myasnikov, V. Cooperative Control for Signalized Intersections in Intelligent Connected Vehicle Environments. Mathematics 2023, 11, 1540. [Google Scholar] [CrossRef]
- Genders, W.; Razavi, S. Evaluating reinforcement learning state representations for adaptive traffic signal control. Procedia Comput. Sci. 2018, 130, 26–33. [Google Scholar] [CrossRef]
- Dong, L.; Xie, X.; Lu, J.; Feng, L.; Zhang, L. OAS Deep Q-Learning-Based Fast and Smooth Control Method for Traffic Signal Transition in Urban Arterial Tidal Lanes. Sensors 2024, 24, 1845. [Google Scholar] [CrossRef]
- Aslani, M.; Mesgari, M.S.; Wiering, M. Adaptive traffic signal control with actor-critic methods in a real-world traffic network with different traffic disruption events. Transp. Res. Part C Emerg. Technol. 2017, 85, 732–752. [Google Scholar] [CrossRef]
- Touhbi, S.; Babram, M.A.; Nguyen-Huu, T.; Marilleau, N.; Hbid, M.L.; Cambier, C.; Stinckwich, S. Adaptive Traffic Signal Control: Exploring Reward Definition For Reinforcement Learning. Procedia Comput. Sci. 2017, 109, 513–520. [Google Scholar] [CrossRef]
- Li, D.; Wu, J.; Xu, M.; Wang, Z.; Hu, K. Adaptive Traffic Signal Control Model on Intersections Based on Deep Reinforcement Learning. J. Adv. Transp. 2020, 2020, 6505893. [Google Scholar] [CrossRef]
- Arulkumaran, K.; Deisenroth, M.P.; Brundage, M.; Bharath, A.A. Deep Reinforcement Learning: A Brief Survey. IEEE Signal Process. Mag. 2017, 34, 26–38. [Google Scholar] [CrossRef]
- Van Hasselt, H.; Guez, A.; Silver, D. Deep reinforcement learning with double q-learning. In Proceedings of the AAAI Conference on Artificial Intelligence, Phoenix, AZ, USA, 12–17 February 2016. [Google Scholar] [CrossRef]
- Schaul, T.; Quan, J.; Antonoglou, I.; Silver, D. Prioritized experience replay. arXiv 2015, arXiv:1511.05952. [Google Scholar]
- Wang, Z.; Schaul, T.; Hessel, M.; Hasselt, H.; Lanctot, M.; Freitas, N. Dueling network architectures for deep reinforcement learning. In Proceedings of the 33rd International Conference on Machine Learning, PMLR, New York, NY, USA, 20–22 June 2016; pp. 1995–2003. [Google Scholar]
- Liang, X.; Du, X.; Wang, G.; Han, Z. A Deep Reinforcement Learning Network for Traffic Light Cycle Control. IEEE Trans. Veh. Technol. 2019, 68, 1243–1253. [Google Scholar] [CrossRef]
- Chu, T.; Wang, J.; Codeca, L.; Li, Z. Multi-Agent Deep Reinforcement Learning for Large-Scale Traffic Signal Control. IEEE Trans. Intell. Transp. Syst. 2019, 21, 1086–1095. [Google Scholar] [CrossRef]
- Lillicrap, T.P.; Hunt, J.J.; Pritzel, A.; Heess, N.; Erez, T.; Tassa, Y.; Silver, D.; Wierstra, D. Continuous control with deep reinforcement learning. arXiv 2015, arXiv:1509.02971. [Google Scholar]
- Pang, H.; Gao, W. Deep Deterministic Policy Gradient for Traffic Signal Control of Single Intersection. In Proceedings of the 2019 Chinese Control And Decision Conference (CCDC), Nanchang, China, 3–5 June 2019; pp. 5861–5866. [Google Scholar]
- Fujimoto, S.; Hoof, H.; Meger, D. Addressing function approximation error in actor-critic methods. In Proceedings of the International Conference on Machine Learning, PMLR, Stockholm Sweden, 10–15 July 2018; pp. 1587–1596. [Google Scholar]
- Ding, Z.; Huang, Y.; Yuan, H.; Dong, H. Introduction to reinforcement learning. In Deep Reinforcement Learning; Springer: Singapore, 2020; pp. 47–123. [Google Scholar]
- Zeng, J.; Hu, J.; Zhang, Y. Training Reinforcement Learning Agent for Traffic Signal Control under Different Traffic Conditions. In Proceedings of the 2019 IEEE Intelligent Transportation Systems Conference—ITSC, Auckland, New Zealand, 27–30 October 2019. [Google Scholar]
- Gao, C.; Wang, Z.; He, X.; Liu, Y.; Yue, D. Differentially Private Consensus Control for Discrete-time Multi-Agent Systems: Encoding-Decoding Schemes. IEEE Trans. Autom. Control. 2024, 1–8. [Google Scholar] [CrossRef]
- Jin, J.; Li, Y.; Huang, H.; Dong, Y.; Liu, P. A variable speed limit control approach for freeway tunnels based on the model-based reinforcement learning framework with safety perception. Accid. Anal. Prev. 2024, 201, 107570. [Google Scholar] [CrossRef]
- Krajzewicz, D.; Behrisch, M.; Wagner, P.; Luz, R.; Krumnow, M. Second generation of pollutant emission models for SUMO. In Modeling Mobility with Open Data; Springer: Cham, Switzerland, 2015; pp. 203–221. [Google Scholar]
- Jin, J.; Huang, H.; Yuan, C.; Li, Y.; Zou, G.; Xue, H. Real-time crash risk prediction in freeway tunnels considering features interaction and unobserved heterogeneity: A two-stage deep learning modeling framework. Anal. Methods Accid. Res. 2023, 40, 100306. [Google Scholar] [CrossRef]
- Wu, Y.; Ho, C. The development of taiwan arterial traffic-adaptive signal control system and its field test: A taiwan experience. J. Adv. Transp. 2009, 43, 455–480. [Google Scholar] [CrossRef]
- Tsang, K.; Hung, W.; Cheung, C. Emissions and fuel consumption of a Euro 4 car operating along different routes in Hong Kong. Transp. Res. Part D Transp. Environ. 2011, 16, 415–422. [Google Scholar] [CrossRef]
- Choudhary, A.; Gokhale, S. Urban real-world driving traffic emissions during interruption and congestion. Transp. Res. Part D Transp. Environ. 2016, 43, 59–70. [Google Scholar] [CrossRef]
- Zhou, X.; Tanvir, S.; Lei, H.; Taylor, J.; Liu, B.; Rouphail, N.M.; Frey, H.C. Integrating a simplified emission estimation model and mesoscopic dynamic traffic simulator to efficiently evaluate emission impacts of traffic management strategies. Transp. Res. Part D Transp. Environ. 2015, 37, 123–136. [Google Scholar] [CrossRef]
- Clarke, P.; Muneer, T.; Cullinane, K. Cutting vehicle emissions with regenerative braking. Transp. Res. Part D Transp. Environ. 2010, 15, 160–167. [Google Scholar] [CrossRef]
- Gallus, J.; Kirchner, U.; Vogt, R.; Benter, T. Impact of driving style and road grade on gaseous exhaust emissions of passenger vehicles measured by a Portable Emission Measurement System (PEMS). Transp. Res. Part D Transp. Environ. 2017, 52, 215–226. [Google Scholar] [CrossRef]
- Ye, Q.; Chen, X.; Liao, R.; Yu, L. Development and evaluation of a vehicle platoon guidance strategy at signalized intersections considering fuel savings. Transp. Res. Part D Transp. Environ. 2020, 77, 120–131. [Google Scholar] [CrossRef]
- Pandian, S.; Gokhale, S.; Ghoshal, A.K. Evaluating effects of traffic and vehicle characteristics on vehicular emissions near traffic intersections. Transp. Res. Part D Transp. Environ. 2009, 14, 180–196. [Google Scholar] [CrossRef]
- Boryaev, A.; Malygin, I.; Marusin, A. Areas of focus in ensuring the environmental safety of motor transport. Transp. Res. Procedia 2020, 50, 68–76. [Google Scholar] [CrossRef]
- Grote, M.; Williams, I.; Preston, J.; Kemp, S. A practical model for predicting road traffic carbon dioxide emissions using Inductive Loop Detector data. Transp. Res. Part D Transp. Environ. 2018, 63, 809–825. [Google Scholar] [CrossRef]


| Parameter | Value | Note |
|---|---|---|
| Number of actions | Number of phases | |
| Minimum green time | ||
| Yellow time | ||
| Default phase | Initial traffic signal phase | |
| Episode | 400 | Number of trainings |
| Step | 3600 | Step length of one training |
| Weight of CWT | ||
| Weight of CDE | ||
| Batch size | ||
| Learning rate | ||
| Epoch | ||
| Starting | ||
| Ending | To avoid local optimal solution | |
| Minimum memory pool size | To obtain all samples | |
| Maximum memory pool size | To remove the oldest element | |
| Discount factor | ||
| Leaky ReLU | ||
| Length of training step |
| TSC | Average VWT (s/Vehicle) | Average VQL (Vehicle/s) | Average CDE (g/Vehicle) | Average CDE (Rate) | Average VFC (mL/Vehicle) | Average NGE (g/Vehicle) |
|---|---|---|---|---|---|---|
| FTSC | 95.27 | 20.02 | 313.59 | 17.61 | 134.81 | 16.24 |
| ASC | 53.61 | 11.08 | 200.84 | 17.54 | 86.33 | 9.16 |
| DRL-SG | 14.79 | 3.01 | 163.64 | 14.47 | 70.35 | 3.26 |
| DRL-DG | 15.68 | 3.23 | 94.97 | 10.87 | 40.83 | 2.46 |
Disclaimer/Publisher’s Note: The statements, opinions and data contained in all publications are solely those of the individual author(s) and contributor(s) and not of MDPI and/or the editor(s). MDPI and/or the editor(s) disclaim responsibility for any injury to people or property resulting from any ideas, methods, instructions or products referred to in the content. |
© 2024 by the authors. Licensee MDPI, Basel, Switzerland. This article is an open access article distributed under the terms and conditions of the Creative Commons Attribution (CC BY) license (https://creativecommons.org/licenses/by/4.0/).
Share and Cite
Zhang, G.; Chang, F.; Huang, H.; Zhou, Z. Dual-Objective Reinforcement Learning-Based Adaptive Traffic Signal Control for Decarbonization and Efficiency Optimization. Mathematics 2024, 12, 2056. https://doi.org/10.3390/math12132056
Zhang G, Chang F, Huang H, Zhou Z. Dual-Objective Reinforcement Learning-Based Adaptive Traffic Signal Control for Decarbonization and Efficiency Optimization. Mathematics. 2024; 12(13):2056. https://doi.org/10.3390/math12132056
Chicago/Turabian StyleZhang, Gongquan, Fangrong Chang, Helai Huang, and Zilong Zhou. 2024. "Dual-Objective Reinforcement Learning-Based Adaptive Traffic Signal Control for Decarbonization and Efficiency Optimization" Mathematics 12, no. 13: 2056. https://doi.org/10.3390/math12132056