Article

Enhancing Fault Diagnosis in Mechanical Systems with Graph Neural Networks Addressing Class Imbalance

by
Wenhao Lu
1,2,
Wei Wang
1,
Xuefei Qin
1 and
Zhiqiang Cai
1,*
1
School of Mechanical Engineering, Northwestern Polytechnical University, Xi’an 710072, China
2
Department of Automotive Engineering, Suzhou Vocational Institute of Industrial Technology, Suzhou 215104, China
*
Author to whom correspondence should be addressed.
Mathematics 2024, 12(13), 2064; https://doi.org/10.3390/math12132064
Submission received: 17 May 2024 / Revised: 19 June 2024 / Accepted: 27 June 2024 / Published: 1 July 2024

Abstract

:
Recent advancements in intelligent diagnosis rely heavily on data-driven methods. However, these methods often encounter challenges in adequately addressing class imbalances in the context of the fault diagnosis of mechanical systems. This paper proposes the MeanRadius-SMOTE graph neural network (MRS-GNN), a novel framework designed to synthesize node representations in GNNs to effectively mitigate this issue. Through integrating the MeanRadius-SMOTE oversampling technique into the GNN architecture, the MRS-GNN demonstrates an enhanced capability to learn from under-represented classes while preserving the intrinsic connectivity patterns of the graph data. Comprehensive testing on various datasets demonstrates the superiority of the MRS-GNN over traditional methods in terms of classification accuracy and handling class imbalances. The experimental results on three publicly available fault diagnosis datasets show that the MRS-GNN improves the classification accuracy by 18 percentage points compared to some popular methods. Furthermore, the MRS-GNN exhibits a higher robustness in extreme imbalance scenarios, achieving an AUC-ROC value of 0.904 when the imbalance rate is 0.4. This framework not only enhances the fault diagnosis accuracy but also offers a scalable solution applicable to diverse mechanical and complex systems, demonstrating its utility and adaptability in various operating environments and fault conditions.

1. Introduction

The rapid development of modern industry has led to the widespread use of various machinery in sectors such as manufacturing, transportation, and power generation [1,2,3]. Ensuring the stable operation of this equipment is crucial for improving efficiency, safety, and economic growth. Bearings, as core components, significantly impact the performance and lifespan of machinery by supporting loads, transmitting power, and reducing friction. However, prolonged use and harsh conditions make them prone to wear and failures, necessitating precise and timely intelligent diagnosis to prevent breakdowns and to reduce maintenance costs. Challenges in bearing diagnosis include the complexity of the equipment, varying operational conditions, and harsh environments. Accurate diagnosis requires processing large volumes of sensor data and advanced signal processing techniques [4,5,6,7]. Thus, developing a reliable prognostics health management (PHM) system is essential for the effective monitoring and diagnosis of rotating machinery.
Traditional fault diagnosis methods include model-based and data-driven approaches. Model-based methods [8,9] use physical or mathematical models to predict the equipment conditions, but their applicability is limited in complex systems such as bearings due to parameter uncertainties and model deficiencies. Data-driven methods [10,11], which gather and analyze operational data, can handle unknown faults and dynamic changes but struggle with complex systems and high-dimensional data. The advent of measurement technologies and the IoT has led to an abundance of accessible data, supporting deep learning-based fault diagnosis [12,13,14]. These methods excel in pattern recognition, feature extraction, and managing high-dimensional nonlinear data, making them highly promising for fault prevention, productivity enhancement, and maintenance cost reduction.
Deep learning-based fault diagnosis models do not require prior knowledge and can autonomously extract fault features from input data, creating reliable and precise PHM systems. Common models include convolutional neural networks (CNNs) [15,16], recurrent neural networks (RNNs) [17,18], graph neural networks (GNNs) [19,20], and their variations [21]. For instance, Peng et al. [22] introduced a multi-channel framework for fault diagnosis in hydraulic systems, highlighting the importance of using multiple channels for accuracy. Additionally, a density-based affine propagation tensor clustering method has been applied to train bogie bearings, demonstrating the potential of unsupervised deep learning methods [23]. In intelligent engine diagnosis, a progressive adaptive sparse attention mechanism has shown effectiveness in fault detection for high-power diesel engines. The success of deep learning models largely depends on the availability of extensive labeled data across diverse fault types [24]. However, rotating machinery predominantly operates under normal conditions, with cost and safety concerns meaning that faults only occur briefly. This results in a significant data imbalance, with much more normal-state data than fault-state data, presenting a challenge for deep learning models to accurately define decision boundaries [25,26].
In recent years, GNNs have gained attention for their ability to process non-Euclidean data, such as graph data with spatial topology, unlike traditional CNN frameworks [27,28,29]. A common graph learning task is semi-supervised node classification, where a model is trained on a small subset of labeled nodes in a large graph and then used to classify the remaining nodes. GNNs have shown a superior performance in this task and are rapidly evolving. For example, Liu et al. [30] proposed a wavelet packet-enhanced deep graph contrastive learning method for the fault diagnosis of rolling bearings, combining wavelet packet decomposition with graph convolutional networks to capture node-level fault information. Another study investigated the fault diagnosis of planetary gearboxes using FDKNN-DGAT with limited labeled data, highlighting the importance of semi-supervised approaches [31]. Han et al. [32] introduced a weighted broad learning system (WBLS) to tackle imbalanced data classification through assigning weights based on sample size. Despite these advancements, most research still focuses on achieving class balance among nodes.
In this work, we address the issue of imbalanced node classification, as illustrated in Figure 1a. Using bearings as an example, the green nodes represent healthy bearings (the majority class), while the purple nodes represent faulty bearings (the minority class). The edges denote the connections between sample nodes. The goal of fault classification is to predict the labels of unlabeled nodes (the dashed lines) using existing samples. Due to the prolonged error-free operation of machinery, there are significantly fewer fault data, causing a class imbalance. This issue is exacerbated in a semi-supervised learning setup, where the limited labeled data further reduce the number of labeled minority samples. Consequently, an imbalanced node classification presents a challenge for current GNN models [33,34]. In such scenarios, the majority class heavily influences the GNN’s loss function, leading to a focus on the majority and inaccurate predictions for the minority. This limitation restricts the practical application of GNNs, especially in fault diagnosis with imbalanced data. Therefore, developing specialized GNN methods to address imbalanced node classifications is crucial.
Sample imbalance significantly impacts fault diagnosis in deep learning methods. Existing studies have focused on three main solutions: data-level approaches, algorithm-level approaches, and hybrid approaches. Data-level techniques adjust the data distribution directly and include oversampling [35,36] to increase the minority class samples and undersampling [37,38] to reduce the majority class samples. While effective, oversampling can cause overfitting, and undersampling can degrade the performance on the majority class samples. Algorithm-level strategies adapt the learning algorithm, for example, through adjusting the cost function to prioritize rare samples or incorporating mechanisms to handle imbalanced data in decision-making [39,40]. Hybrid approaches combine data preprocessing with algorithmic enhancements for better outcomes [41,42]. In GNN models, the graph topology is crucial for the analysis. The poor feature representation of certain nodes affects their embeddings and disrupts the feature exchange among neighboring nodes. Existing algorithms treat each sample independently, failing to effectively address any sample imbalance in the graph data. Thus, directly applying existing sample imbalance solutions to graph data often yields suboptimal results.
In particular, the existing category imbalance solutions are less effective in the GNN framework due to two main challenges. Firstly, generating relational information for newly synthesized samples is difficult. Conventional oversampling methods use the interpolation between the target sample and its nearest neighbors to create new training samples. However, interpolating edge relationships is often unsuitable due to their discrete and sparse nature, which can disrupt the topology among samples. Secondly, the quality of the newly synthesized samples may be compromised. Given the high dimensionality of the node attributes, direct interpolation can produce samples that are out of distribution or contain noise, negatively impacting the classifier training. Therefore, this study introduces a novel approach: exploring synthetic minority class oversampling in GNNs for imbalanced node classification, as shown in Figure 1b.
To address these challenges, this research extends the MeanRadius-synthetic minority oversampling technique (SMOTE) oversampling algorithm to GNNs, creating a new framework named MRS-GNN that is designed for graph data with distinctive topologies. First, we propose interpolating the dimensions in the intermediate embedding space within the GNN model. This process, following feature extraction, results in an intermediate embedding space with reduced dimensions and a more concentrated distribution of samples within the same class. This creates a more coherent subset of samples within the class domain, as intraclass similarities and interclass differences are captured by the preceding layers. Second, we introduce an edge predictor to establish new edges between the generated and existing samples. This edge generator learns the authentic edge distributions among the node samples, facilitating the generation of reliable relationship information. In summary, this study presents a novel framework to address the problem of an imbalanced node class distribution. The framework integrates automatic graph encoding with node classification, using the same feature extractor for both tasks. Additionally, oversampling is conducted in the module’s output space to enhance the reliability of the generated node samples. The main contributions of this work are as follows:
(1)
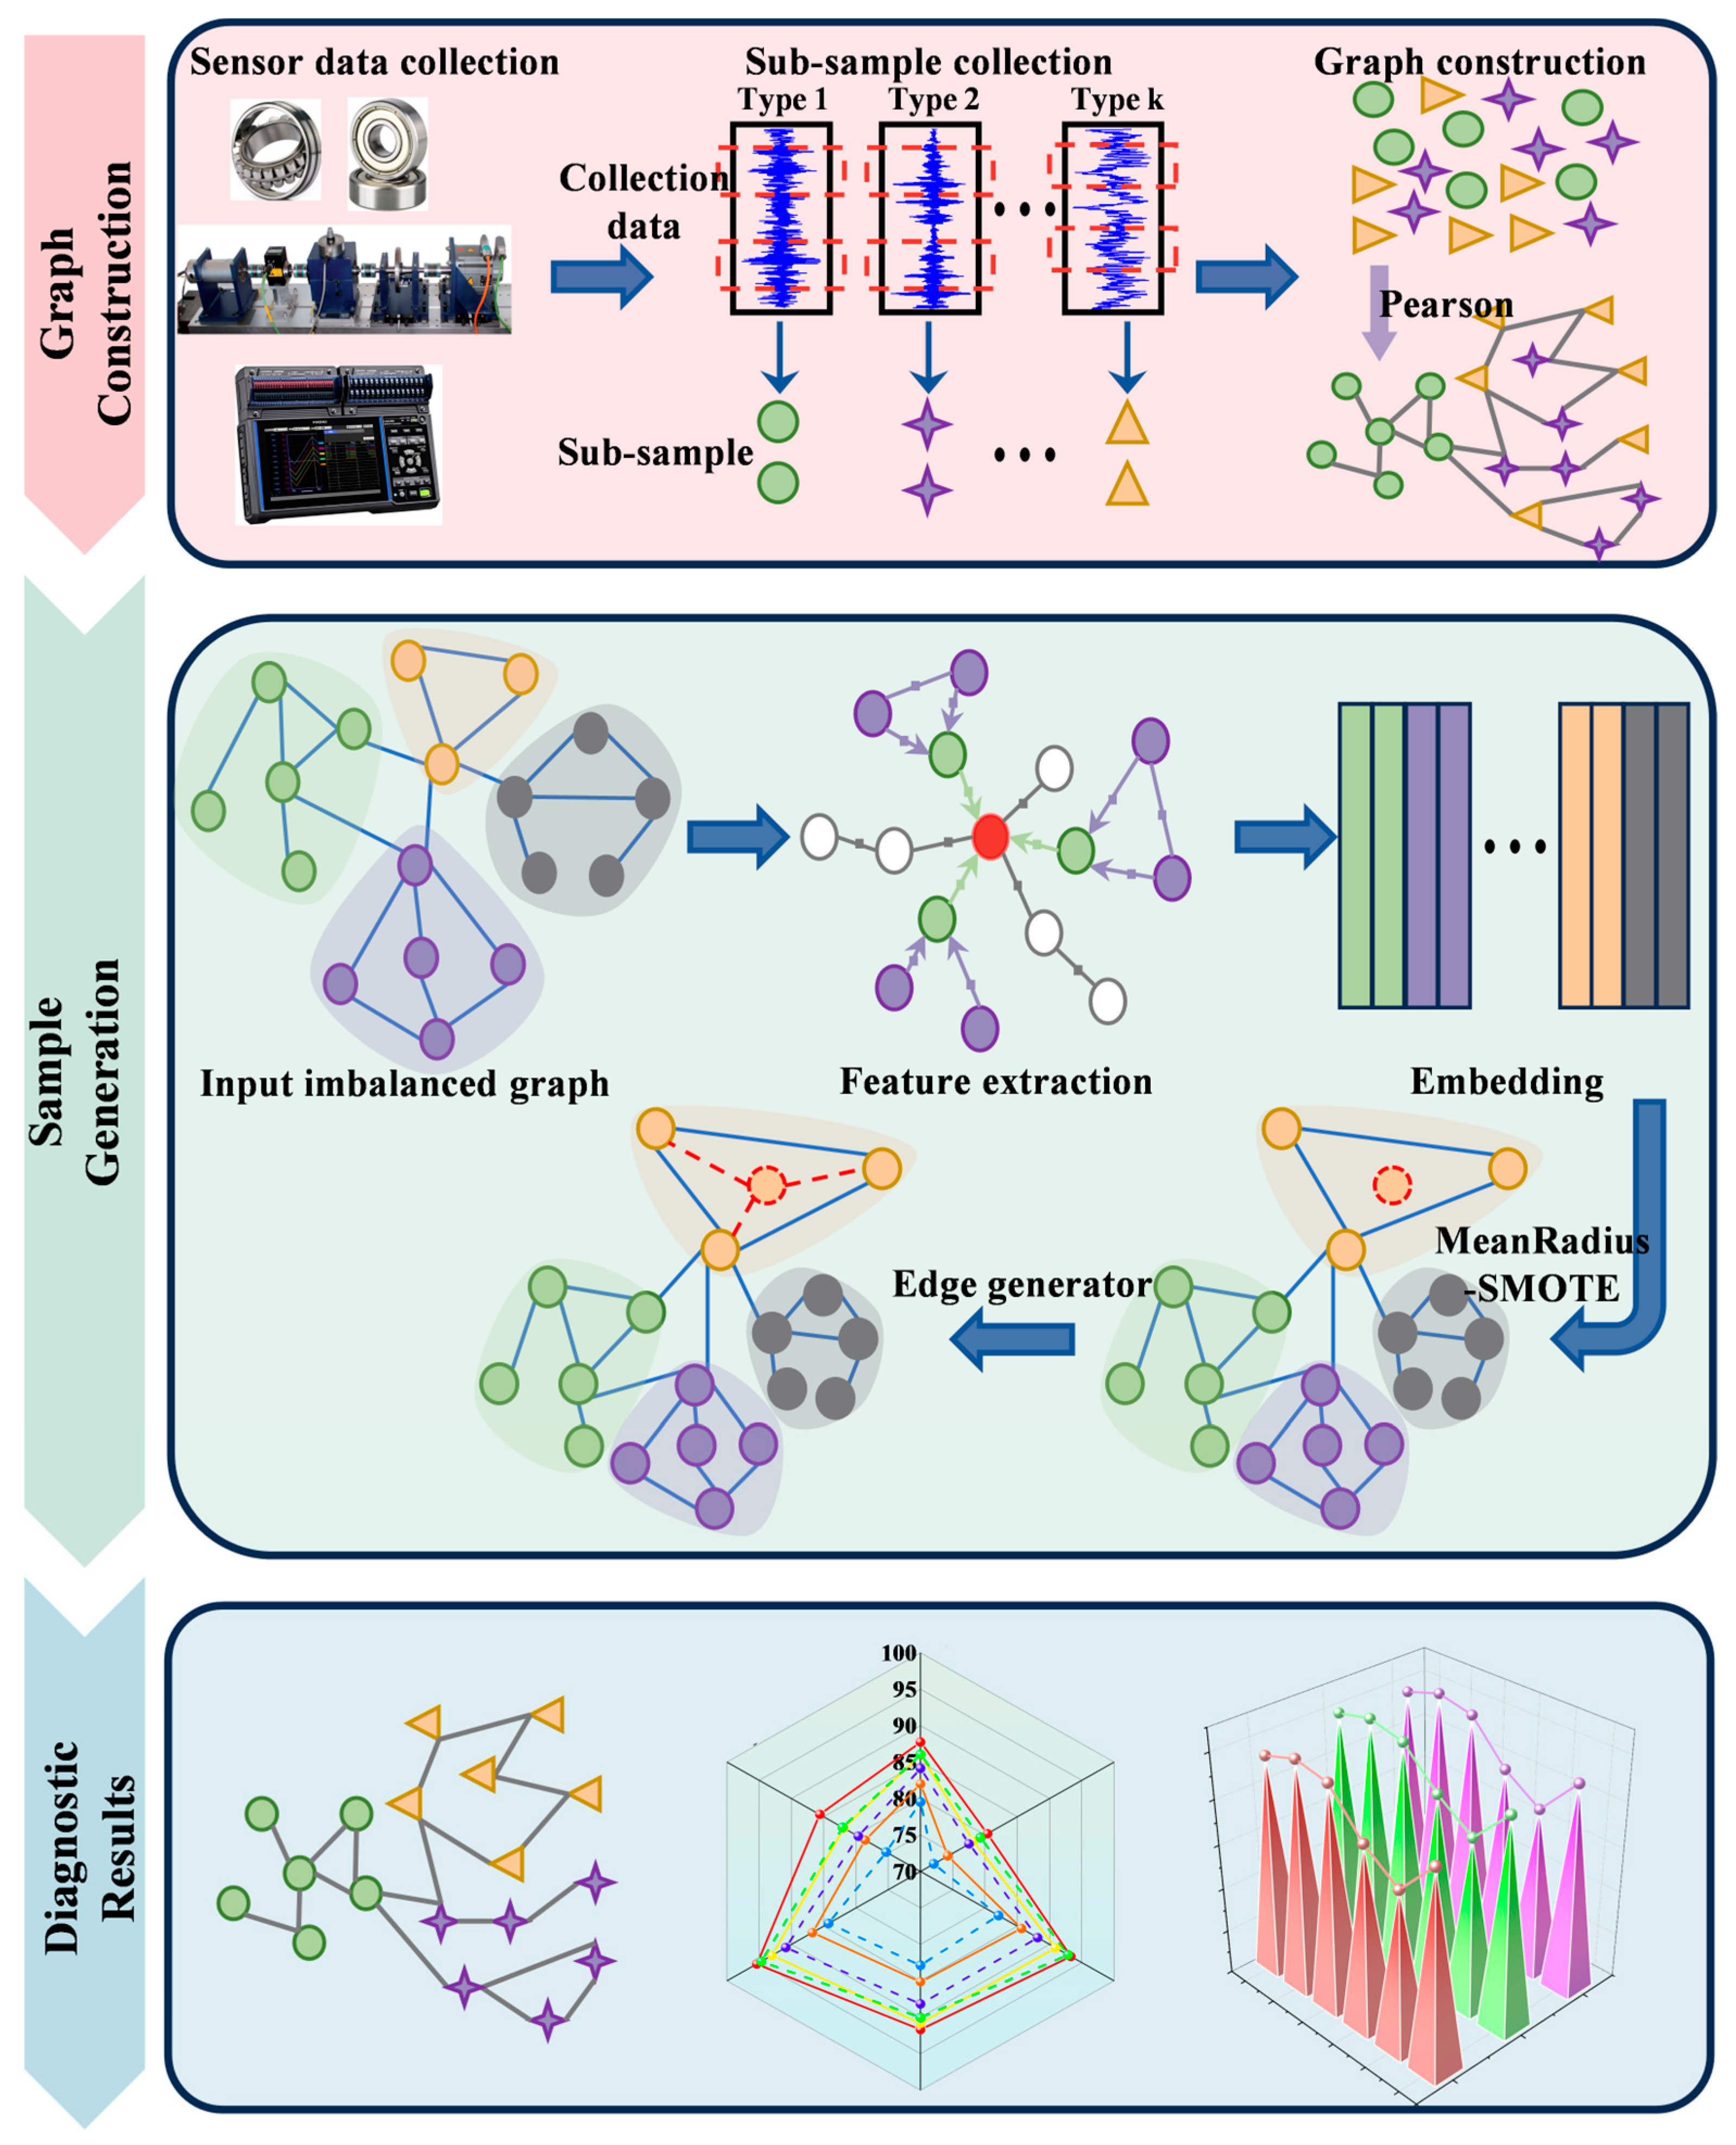
The MRS-GNN incorporates the MeanRadius-SMOTE algorithm into GNNs, improving the balance between minority and majority classes through interpolation within the embedded representation spaces of the nodes. This improves the model performance under conditions of class imbalance.
(2)
The framework includes an edge generator that synthesizes new nodes and connects them to existing ones, preserving the topology and structural integrity of the graph. This is crucial for maintaining a high performance in node classification.
(3)
Extensive testing on three public datasets shows that the MRS-GNN surpasses some popular current methods in classification accuracy and robustness regarding class imbalance. The framework’s adaptability and utility in various environments are also demonstrated.
The structure of the remainder of this paper is as follows: Section 2 introduces the sample imbalance problem and GNNs. Section 3 models sample imbalance in the context of fault diagnosis. Section 4 details the proposed MRS-GNN framework. Section 5 describes the experiments conducted to validate the effectiveness of the framework. The paper concludes with a comprehensive summary.

2. Related Work

A brief introduction to the sample class imbalance problem and related work on graph neural networks is provided in this section.

2.1. Class Imbalance Problems

Class imbalance is prevalent in practical applications and constitutes a classic research domain in deep learning. Various tasks encounter this issue. For instance, in the diagnosis of mechanical faults, vibration signals extracted from equipment operations provide sufficient fault features to reflect the equipment’s state, thus serving as inputs for deep learning models. Nonetheless, the scarcity of data on vibration signals, attributed to infrequent faults, impedes trained classifiers from accurately predicting these faults, constituting the class imbalance issue in fault diagnosis datasets [43]. In multi-classification mechanical fault diagnosis tasks, deep learning classifiers prioritize the overall prediction accuracy, often at the expense of the accuracy in predicting a few classes, to ensure the accurate prediction of the majority of the class samples. Nevertheless, rare faults in certain mechanical devices can result in significant economic losses upon occurrence. Hence, studying the problem of imbalanced datasets in machine fault diagnosis is imperative. Generally, the methods for addressing the imbalanced dataset problem are primarily categorized into two aspects, data and algorithms, with the occasional integration of both.
At the data level, many researchers primarily utilize resampling techniques to synthesize, duplicate, and remove original samples to adjust the sample quantities across different classes, thereby achieving a sample size balance to mitigate the impact of imbalanced data on classifiers. The resampling technique involves oversampling for a few sample classes and undersampling for the majority of the classes. The fundamental concept of oversampling is to replicate existing samples to augment the number of minority class samples and attain class balance. Oversampling methods primarily encompass two approaches: replication and new sample creation. Replication involves duplicating original samples to augment the number of minority samples, but may lead to the replication of noisy samples, thereby impacting the dataset’s overall quality. The classical oversampling algorithm, SMOTE [44], utilizes the line connecting two original minority class samples as the range for generating new samples, randomly selecting points on this line as the new samples. Nevertheless, the SMOTE algorithm still fails to prevent the generation of noisy samples, and the new samples are susceptible to the influence of the original samples’ distribution, potentially causing deviation from the actual distribution. Consequently, subsequent researchers have enhanced the SMOTE in terms of noise reduction and generation algorithms, exemplified by the LR-SMOTE [45], BorderlineSMOTE [46], and others. Conversely, undersampling methods achieve class balance by decreasing the quantity of the majority class samples in the dataset. For instance, in the diagnosis of transformer faults, techniques leveraging the synthetic minority oversampling technique (SMOTE) and neighborhood generation oversampling (NGO) have been devised to enhance the accuracy and alleviate the impact of imbalanced samples on model identification [47]; similarly, in the diagnosis of rotating machinery faults, the enhanced multidimensional normalized ResNet has been introduced to tackle the issue of limited labeled samples in cross-working conditions [48]. Additionally, the issue of sampling imbalanced fault data has been underscored [49], prompting the development of adversarial transfer learning-based methods to address the sample imbalance problem. Nonetheless, it is important to note that, in practice, most imbalanced datasets stem from a scarcity of samples in a few classes, emphasizing the significance of oversampling techniques as a primary research direction in this domain.
In the realm of algorithms, amidst the rapidly expanding domain of deep learning, numerous classifiers employing neural networks have actively tackled the challenges presented by imbalanced datasets. When each sample is assigned an equal weight, the classifier’s preference for a particular class is determined by the number of samples. Enhancing the classifier’s capability to handle imbalanced datasets entails making algorithmic adjustments such as modifying sample weights, adjusting decision boundary thresholds, or optimizing the classifier’s objective function [50,51]. These adjustments aid in mitigating the influence of imbalanced datasets on the classifier’s decision boundary [52].
Upon analyzing the aforementioned system, it becomes evident that the SMOTE and its variants, including the sampling-based synthesis of minority class samples, are prevalent and efficacious techniques for addressing the class imbalance issue. Nonetheless, it is noteworthy that the majority of existing SMOTE-related research has been conducted on independent and identically distributed data, rendering direct transferability to existing methods challenging due to the unique graph topology inherent in graph data. Specifically, interpolation by SMOTE variants and similar methods results in the generated nodes lacking edge connections to the original graph, rendering them less advantageous for the graph classifier GNN. Moreover, synthetic node generation across the source domain fails to consider the graph information. Hence, this research endeavors to extend the MeanRadius-SMOTE [53] technique, a prior endeavor of our group aimed at addressing the class imbalance sampling issue, to the GNN model framework. It aims to offer a constructive methodology for tackling the class imbalance problem by considering node connectivity.

2.2. Graph Neural Networks

This section delves into research concerning GNNs, which are potent tools for processing graphical and non-Euclidean data. The underlying theory and applications of GNNs have been extensively explored in recent years. Notably, graph convolutional networks (GCNs) [54], a significant variant of GNNs, extend convolutional operations from regular grid data (e.g., images) to graphical data, offering a novel approach to processing graphical data. One seminal work introduced a simplified GCN model [55], which has demonstrated a remarkable efficacy in practical applications. However, relying solely on convolutional operations might not sufficiently capture the complexity of the graph. To mitigate this issue, researchers have introduced graph attention networks (GATs) [56], which enhance the representation of graph complexity through incorporating an attention mechanism, enabling the network to assign varying importance to different neighbors. While GATs have made strides in addressing graph complexity, there remains room for enhancing representational capability. To further enhance the representational capacity of GNNs, graph isomorphism networks (GINs) [57] have been introduced. GINs notably enhance the representational capability of GNNs by incorporating the graph isomorphism test, which guarantees identical representations for two graphs only if they are isomorphic (i.e., the nodes and edges match one to one).
Recently, GNNs have found extensive application in diverse domains, such as social network analysis [58], bioinformatics [59], and recommender systems [60], and are increasingly penetrating the complex domain of “intelligent diagnosis.” Intelligent diagnosis, a crucial engineering application, entails analyzing systems’ operational data to detect, locate, and identify faults. Given the complexity of real engineering systems—typically featuring numerous components, variables, interactions, and diverse failure modes—modeling the issue with topologically structured graph data provides an effective approach. In particular, an interaction-aware graph neural network (IAGNN) is proposed to model sensor–signal interactions in complex industrial processes, enhancing the reliability and efficacy of fault diagnosis in such systems [61]. Xu [62] et al. devised a novel graph-guided collaborative convolutional neural network (GGCN) to investigate modality-specific and intrinsically shared features among multi-source signals. This approach enhances the exploration of such features and, consequently, the capability to explore multi-source data, ultimately facilitating efficient fault diagnosis in electromechanical systems. Therefore, GNNs can represent and analyze system topology and interactions, extracting valuable feature information to construct PHM systems for intelligent fault diagnosis.
It is noteworthy that, despite the significant accomplishments of various GNN models in intelligent diagnosis, there exists a research gap concerning the class imbalance problem, a prevalent real-world scenario that can substantially hamper the performance of a GNN. Hence, this paper concentrates on the novel research problem of synthesizing a limited number of classes through the application of oversampling techniques to graph-structured data. This endeavor aims to enhance the utilization of graph neural networks in addressing node classification with imbalanced categories.

3. Problem Modeling

This study aims to develop a GNN model that is suitable for semi-supervised node classification tasks. Firstly, vibration signals collected under various operating conditions are transformed into a large-scale topological graph, bearing significant implications. This graph not only depicts the characteristics of the sample nodes, but also captures the potential relationships between different samples. Consequently, each sample is treated as a node, and the linear relationships between nodes are computed to establish the edge connections. The specific process and methodology employed to convert these one-dimensional time signals into graph data are comprehensively detailed in Section 4.1. In Figure 1, the colored nodes represent labeled samples, while the colorless nodes represent unlabeled ones. Each entity node belongs to a category, but an imbalance exists in the size distribution of these categories. Through graph learning, all entity sample nodes can receive appropriate labels. It is noteworthy that, in graph topological networks, while unlabeled samples lack labeling information, they can serve as auxiliary data to furnish the model with additional topological information during sample similarity exploration. We posit that this study offers new perspectives and tools for analyzing and comprehending the dynamic behavior of complex mechanical systems, thereby unveiling fresh possibilities for future research and applications.
To address the class imbalance problem, a graph topological data representation denoted as G = V , A , X is utilized, where V = v 1 , v 2 , , v n signifies a set of nodes, X = x 1 , x 2 , , x n is defined as a feature matrix of dimension n × d , and d represents the dimension of the node feature vector.
Simultaneously, A n × n denotes the adjacency matrix of G , representing the connection relationship between nodes i and j when there is an edge a i j = 1 ; otherwise, it is represented as a i j = 0 . Let L n represent the attribute information of the nodes in G . During the training period, only partial node attribute information is available, such as the label information of the nodes. Specifically, only a subset L S of L is accessible during the model training. The total number of fault categories is denoted as K = c 1 , c 2 , , c k , where c k represents the number of samples belonging to a specific category (i.e., the size of the kth category). This study employs the imbalance rate ( IMR = m i n i c i m a x i c i ) as an indicator to quantify the degree of sample imbalance; a larger IMR indicates a greater degree of class imbalance in the dataset. Typically, the imbalance rate of L S in the class sample imbalance task setting is low. Hence, the training objective for the class imbalance sample task is as follows: given the node class imbalance data G and the labeling information L S for the appropriate subset of nodes, the aim is to train and learn to obtain a classifier (denoted as f V , A , X L ) that is adept at labeling both majority and minority classes.

4. Proposed Methods

This section presents a detailed exposition of the MRS-GNN: a framework designed to address the class imbalance problem. This operation aims to generate a limited number of class nodes. Additionally, the method employs an edge generator to establish connections between the generated nodes and the original graph, thereby equalizing the distribution of different classes. This process yields an improved balanced graph, enabling the classification of its nodes through a GNN classifier. Subsequently, each module of the MRS-GNN is comprehensively described.

4.1. Graph Data Generation

Traditional deep learning models are commonly employed for processing image data. In contrast, the input of the GNN model comprises graph data G , which includes the adjacency matrix A and the feature matrix X . Consequently, the process of converting one-dimensional vibration signal data into graph data warrants careful consideration. The adjacency matrix serves to depict the neighborhood relationship between nodes, reflecting the interconnection among different faults within a complex fault topology. However, solely focusing on the relationship between the directly connected nodes may overlook potential connections between different faults. Hence, this study explores mining the correlation between faults through analysis of the Pearson correlation coefficient. The Pearson correlation coefficient is a statistical measure that evaluates the degree of linear correlation between two variables, with values ranging from −1 to 1. When the correlation between two variables P and Q increases, the associated Pearson correlation coefficient approaches 1. Thus, through computing the Pearson correlation coefficients between two nodes, we can reveal potential connections that might have been disregarded by the direct connectivity relationship. This indicator not only captures the explicit connections between nodes representing direct fault interactions but also identifies implicit relationships that might be overlooked in conventional analyses. Specifically, the Pearson correlation coefficient between two variables can be computed using the following formula:
P ¯ = i = 1 d P i n   ,   Q ¯ = i = 1 d Q i n
C o v P , Q = i = 1 d P i P ¯ Q i Q ¯ d 1
Pearson = C o v P , Q S P S Q
where d represents the dimension of a node, C o v P , Q denotes the covariance between two sample nodes, and S P S Q signifies the product of the respective standard deviations of nodes v p and v q . Thus, if each fault sample is segmented using a sliding time window and the resulting data are treated as a sample node, the node Pearson correlation coefficients between various fault samples can be utilized to construct an adjacency matrix A , as illustrated below:
A = a 11 a 12 a n n a n 1 a n 2 a n n
where n represents the total number of nodes. The specific procedure for obtaining the graph data is depicted in Figure 2. It is important to note that the undirected dense graph constructed based on the Pearson correlation coefficient may include noisy or uninformative edges. This can result in excessively dense connectivity relationships between the nodes in the adjacency matrix, potentially causing the issue of oversmoothing during the training process of the graph neural networks. To mitigate potential oversmoothing—a common issue when GNNs process densely connected graphs—we introduce a sparsification step. This involves pruning the adjacency matrix A by reducing the connections based on a threshold derived from the correlation values, thereby preserving only the most significant relationships. This selective connectivity ensures that the GNN focuses on substantial and meaningful fault interactions, enhancing the model’s performance and interpretability.

4.2. Feature Extractor

After converting one-dimensional temporal vibration signals into graph data G , a straightforward approach to generate new node representations for a limited number of sample classes is to directly apply the SMOTE and its derived techniques to the original node feature space. Nevertheless, this strategy may encounter the following challenges: (a) the original feature space of a node may be sparse and high-dimensional, posing a difficulty in locating two similar nodes with identical labels for the interpolation operation; and (b) the direct oversampling operation in the original space, disregarding the graph topology inherent in the graph data, may result in suboptimal synthetic nodes. Hence, we propose a novel approach. Initially, a GNN feature extractor is employed to acquire the feature representation of the nodes through encoding both the node information and the graph topology into a continuous embedded representation space. This embedded representation space not only captures the features of the nodes but also encapsulates the relationships among the nodes. Generally, the node representation should depict the category and intraclass relationships among the samples. In other words, similar nodes should be mapped to proximate locations, whereas dissimilar nodes should be mapped to distant locations. Consequently, when interpolation operations are conducted on a limited set of nodes and their closest neighbors, the resulting embedded representations are more inclined to represent new samples from the same restricted number of classes. In graph data G , the similarity measurement of nodes should consider node labels, node feature attributes, and the local graph structure. Hence, we utilize the GNN model to analyze the graph data and train this feature extractor in the ensuing tasks of edge prediction, edge generation, and node classification.
It is important to note that there are a wide range of options for GNN feature extractors which can be applied to any GNN model. For demonstration purposes, GraphSage was selected as the foundational model architecture for this study, due to its ability to adeptly learn from various local topologies and effectively generalize to novel structures. Specifically, GraphSage consists of two main operations: sampling and aggregation. Firstly, it samples neighboring nodes based on information regarding the connections between nodes. Then, it continuously integrates the information of neighboring nodes through a multi-layer aggregation function. Finally, the integrated information is utilized to predict the labels of unlabeled nodes, as depicted in Figure 3. Equations (5) and (6) depict this process:
h N ( v ) l = m e a n ( { h u l 1 , u N ( v ) } )
h v l = σ ( W l C O N C A T ( h v l 1 , h N ( u ) l ) )
where l represents the number of network layers, N ( v ) represents the set of neighboring nodes of node v , W l is the weight matrix, h v l represents the node’s embedded representation in layer l , σ · represents the activation function, and C O N C A T represents the fusion of the two representations. In detail, the embedding representations of the neighboring nodes linked to node v are combined using the aggregation function C O N C A T at layer l 1 to produce the layer l neighbor aggregation feature and then merged with the embedding representation of node v at layer l 1 . The merged vectors undergo nonlinear transformation through the fully connected layer, and then activation functions σ · are applied to obtain the final embedded representation of node v at layer l .

4.3. Generation of New Sample Nodes

After obtaining the representation of each node in the embedding space constructed by the GNN feature extractor, we further represent the intraclass similarity and interclass dissimilarity between the sample nodes. This allows us to conduct oversampling operations on the minority class sample nodes, resulting in embedding representations that are more likely to represent new samples belonging to the same minority class. In this study, we selected the widely used MeanRadius-SMOTE algorithm as the primary method for this purpose. The specific procedure is as follows:
(1)
First, the geometric center of each minority class sample, denoted as sample center Z, is calculated.
(2)
Next, the Euclidean distance between each minority class sample and the sample center is calculated, and the average distance, denoted as the minority class sample radius R, is computed.
(3)
There is a random selection of M minority class samples, and the vector V is computed from the sample center Z to these M samples. The synthetic vector is obtained by synthesizing these M vectors.
(4)
The distance between the new sample and the sample center is determined using a normal distribution (mean r , variance r θ ), and the new sample is generated according to Equation (7):
z n e w = z c + λ i = 0 m v i λ ~ N ( r , r θ )
(5)
The above steps are repeated until the number of samples in the minority and majority classes is balanced.
Using the MeanRadius-SMOTE algorithm, we can generate new minority class samples based on the embedding representations of the nodes, thereby increasing the distribution of minority class samples in the embedding space. The pseudo-code of the algorithmic flow is shown in Algorithm 1. This contributes to enhancing the classification performance of the minority class model. Concurrently, the MeanRadius-SMOTE algorithm effectively tackles class imbalance in a scientifically efficient manner. This is achieved by ensuring sample diversity, reducing the generation of noisy samples, and preserving decision boundaries. Furthermore, the algorithm is prone to inheriting characteristic information from the original samples, which is why we opted to employ it as an oversampling method. In the case of a class imbalanced dataset, we iteratively apply the MeanRadius-SMOTE algorithm to each minority class to generate new sample nodes. Through adjusting the hyperparameters m and θ to regulate the number of new sample nodes generated for each minority class, we can attain a balanced distribution of various class sizes. Consequently, the trained classifier can exhibit an improved performance on the minority classes initially suffering from an inadequate sample size.
Algorithm 1: MeanRadius-SMOTE
Input: x n n = 1 N minority , a dataset of minority class samples.
Output: x n n = 1 N n e w , the new generated minority class samples.
Hyperparameters:   r , θ
1. Z mean ( x n n = 1 N minority )
2. R mean ( euclidean _ distance x n , Z n = 1 N minority )
3. while N new < N majority do
4.    x i i = 1 M random _ select x n n = 1 N minority , M
5.    V sum x i Z i = 1 M
6.     λ random _ normal r , r θ
7.     x Z + λ · V
8.     x n x n x
9. end
10. return x n

4.4. Edge Generator

Following the acquisition of a freshly constructed spatial domain using the GNN feature extractor and the interpolation of certain samples within this domain, new node samples can be acquired to rectify class imbalances. Nonetheless, it is imperative to acknowledge that these newly generated node samples lack connectivity with the original input graph data g , thereby forming isolated “islands” within the graph. This hinders the GNN’s capacity to propagate, aggregate, and update the node representations through edge connectivity. Consequently, an edge generator must be introduced to establish the edge relationships between the synthetic nodes and the original graph G. The edge generator generates new edges based on the embedded representations and topological information of the nodes. These newly generated edges facilitate the integration of new nodes into the original graph while preserving its topological properties, thereby enhancing the training of GNN-based classifiers. Specifically, the edge generator is trained using a model trained on existing real node and edge connections and is then applied to predict the neighborhood information of the new sample nodes. The predicted new edge relationships, along with the sample nodes, are appended to the original neighborhood matrix A to derive the augmented neighborhood matrix A ^ . The augmented neighborhood matrix A ^ serves as the input for the classifier based on the GNN model. Thus, through the introduction of the edge generator and the utilization of the augmented neighborhood matrix A ^ , we can address the connectivity issue between the newly generated nodes and the original graph while preserving the graph’s topological properties, thereby effectively training the GNN-based classifier.
To simplify the analysis and make the model more concise, a weighted vanilla design is used to implement this edge generator:
E i , j = s o f t m a x ( σ ( u i k W u j k ) )
where E i , j represents the predictive relationship information between nodes i and j , specifically, the edge weights; W denotes the parameter matrix capturing the node interactions; u i k signifies the minority class of node embeddings labeled L k ; and u j k is the closest similar generating node embedding to u i k with a label. Thus, the loss function of the edge generator can be defined as follows:
F l o s s = E A F 2
where E represents the predicted connectivity relationship between the nodes in V . Based on the aforementioned analysis, it can be inferred that the node edge generator obtained through learning can proficiently utilize the node representations to reconstruct the adjacency matrix, thereby accurately predicting the edge connectivity relationships among the newly generated sample nodes.
To enhance the rigor and comprehensiveness of this study, two generation strategies are explored. These strategies involve inserting the edge predictions of the newly generated sample nodes, obtained from the edge generator, into the adjacency matrix A to produce the augmented adjacency matrix B. The first strategy employs the soft edge generation mechanism for the synthesized new sample nodes:
A ^ u j , u i = E u j , u i
The soft edge value ranges continuously between 0 and 1, denoting the connection strength or probability between two nodes. This representation captures the node relationship in a more nuanced manner. In this strategy, the gradient loss of the augmented adjacency matrix B can be the output by the classifier module during training. This is because both the node classification loss and the edge prediction loss can be utilized to optimize the edge generator. The second-generation strategy solely employs the edge reconstruction method to optimize the generator. Specifically, the edge generation involves setting a threshold D to determine if an edge is generated for a new sample node V:
A ^ u j , u i = 1 ,   if   E u j , u i > ε 0 ,   otherwise .
If the connection strength between two nodes exceeds the set threshold, it signifies an edge connection relationship between the nodes. The subsequent experimental section thoroughly compares the performance of these two edge generation strategies.

4.5. Classifier Design

Let H ^ l represent the enhanced node representation obtained by concatenating the real node embedding H l with the newly generated node embedding. Similarly, V ^ denotes the enhanced node label set resulting from the addition of the newly generated nodes to V . Consequently, the aforementioned operations, including feature extraction, oversampling, and edge generation, yield an augmented graph data G ^ = A ^ , H ^ with node labels V ^ . This process ensures a balanced distribution of the sample data across different classes within G, enabling the training of a GNN classifier that achieves improved node classification results. Specifically, following feature extraction and embedding representation, a linear layer is incorporated for node classification as follows:
H v l = σ ( W l C O N C A T ( H v l 1 , H N ( u ) l ) )
P v = s o f t m a x σ ( W l C O N C A T ( H v l , H N ( u ) l ) )
where P v represents the probability distribution of the class labels of node v . The classifier is optimized using the cross-entropy loss. During testing, the label prediction v for node v is determined as the class with the highest probability; that is,
v = argmax k P v , k

4.6. Overall Framework

In response to the challenges of class imbalanced datasets in intelligent diagnosis, we propose a framework named MRS-GNN, as depicted in Figure 4. The MRS-GNN cleverly combines node interpolation and policy edge generation approaches to achieve class balance. The key innovation of the MRS-GNN is to synthesize the embedding space obtained with a GNN-based feature extractor through the interpolation of class nodes. The framework is further complemented by an edge generator, which subtly weaves these newly created nodes into the existing graph structure, ensuring fair representation across different classes. These methodologically enhanced graph data serve as the foundation of the GNN classifier, benefiting from a rich dataset that enhances node classification accuracy. The framework progresses through a series of well-designed steps: firstly, graph construction entails the meticulous assembly of the adjacency matrix using the Pearson correlation coefficient; next, feature extraction converts the vibration signal data into a comprehensive graph-based representation; and, finally, new sample nodes are introduced using the MeanRadius-SMOTE algorithm, expanding category representation while preserving the essence of the original sample. Subsequently, these nodes are seamlessly integrated into the graph using an edge generator, while preserving topological fidelity. Finally, the framework develops advanced classifiers that leverage rich graph data for detailed node classification, effectively tackling the class imbalance problem and promoting intelligent diagnosis. Through enhancing the data representation of the graph simply and effectively, the MRS-GNN not only resolves the complex class distribution problem but also preserves the graph’s topological properties, enhancing the interpretability of the classification results.

5. Experimental Results and Comparisons

This section assesses the MRS-GNN’s performance in addressing the class imbalance issue using three public datasets on bearings. Specifically, we begin with a succinct introduction to the employed datasets and a depiction of the relevant experimental parameter settings, followed by a detailed account of the experiments.

5.1. Experimental Settings

5.1.1. Dataset Descriptions

(a)
CWRU dataset [63]: Provided by Case Western Reserve University, the CRWU dataset is a widely used public dataset in the field of fault diagnosis. The dataset contains bearing test data obtained from a test rig, which includes a torque transducer, a power test meter, an electric motor, and an electronic controller, under both normal and various fault conditions. Each file in the dataset includes the data corresponding to different fault conditions, including the following: normal, inner ring fault (IF), outer ring fault (OF), and ball fault (BF).
(b)
JNU dataset [64]: In recent years, the open-source bearing dataset from Jiangnan University has also been popular with many researchers and scholars in the field of fault diagnosis. The JNU Bearing Dataset was created and is maintained by a research team at the School of Mechanical Engineering at JNU to provide a standardized and rich data resource for research on the fault diagnosis and predictive maintenance of bearings. The dataset contains data on the operation of rolling bearings under various operating conditions, including normal operating conditions and multiple fault conditions. The dataset includes several typical bearing faults, including inner ring faults, outer ring faults, and rolling element faults. Each type of fault has different levels of damage to simulate different fault conditions that may occur in real applications. Meanwhile, the bearing data were collected at different rotational speeds, including 600 rpm, 800 rpm, and 1000 rpm, to simulate different operating conditions, where the sampling rate is 48 kHz. In this experiment, as with the CWRU dataset, the four types of faults were selected as follows: normal, inner ring fault (IF), outer ring fault (OF), and ball fault (BF) under the rotational speed of 800 rpm for the experiment.
(c)
PU dataset [65]: Published by the University of Paderborn, the PU dataset aims to facilitate the application of data-driven classification methods for monitoring bearing damage in electromechanical drive systems using motor current signals. The dataset includes three damage categories: real damage, artificial damage, and no damage. The experimental process involves three main operating parameters: speed, load torque, and radial force. During each bearing test, 20 datasets were collected with a vibration signal sampling frequency of 64 kHz. The experimental process involved healthy bearings, artificial outer ring damage (electrical discharge machining, ORD), artificial inner ring damage (electrical discharge machining, IRD), real outer ring damage (fatigue pitting, ROD), and real inner and outer ring composite damage (fatigue pitting, RCD). These five different types of faulty bearings were tested under the following conditions: a rotational speed of 900 rpm, a load torque of 0.7 Nm, and a radial force of 1000 N. The vibration signal is used for the model performance verification. Table 1 shows the specific design of the working conditions for the above three datasets.

5.1.2. Dataset Preprocessing

In this study, multi-step imbalance datasets were designed for the experiments. Specifically, the raw signal data were segmented into sample points for each fault type n using a sliding time window of length 256. A graph of scale m × n was constructed by calculating the Pearson correlation coefficient between pairs of nodes. To ensure a balanced number of samples, 70% of the signal data in each fault type were randomly selected as the training set, while the remaining data were used as the test set. Additionally, multiple imbalanced datasets were constructed by adjusting two metrics: the imbalance rate (IMR) and the number of imbalance classes. The performance of the MRS-GNN model was then analyzed under different imbalance scenarios. Please refer to Table 2 for detailed information. Throughout the experimental process, all the baseline models and oversampling methods were employed using the same learning strategies and environments. These methods were implemented within the same GNN-based experimental framework to ensure a fair comparison. Finally, all models were executed on an NVIDIA GTX 4060 GPU (Nvidia Corporation, Santa Clara, CA, USA) using the PyTorch framework.

5.1.3. Comparison to Some Popular Methods

In order to establish the superiority of the proposed framework, we compared it with some representative and popular methods used for addressing class imbalanced data problems, as follows:
(1)
Oversampling: A frequently employed technique for addressing class imbalanced data. It aims to balance the sample distribution across different classes through increasing the number of minority class samples. In this study, the dataset is balanced by replicating a substantial number of minority class nodes along their edges in the original space.
(2)
SMOTE: A classical oversampling method that addresses class imbalance through synthesizing new minority class samples. The SMOTE algorithm generates new samples with similar characteristics through interpolation between minority class samples. Through randomly selecting a minority class sample and its nearest neighbor, the SMOTE interpolates between the two samples to create synthetic samples. These synthetic samples provide additional information and assist the classifier in better capturing the features of the minority class.
(3)
Reweight [66]: A technique used to address class imbalance through adjusting the sample weights. It achieves dataset balance by increasing the weight of the minority class samples or decreasing the weight of the majority class samples. Through assigning different weights to the samples, the reweighting method enables the classifier to focus more on the minority class samples, thereby enhancing the classifier’s performance on the minority class.
(4)
GraphSMOTE [67]: An enhanced method derived from the SMOTE and specifically designed to address class imbalances in graphical data. While the traditional SMOTE measures sample similarity using Euclidean distance in the feature space, the GraphSMOTE leverages graph structures to identify similarities and to generate synthetic samples. It creates new minority class samples through selecting suitable nodes for interpolation based on neighborhood and similarity measures within the graph data.
(5)
MRS-GNNS: In this variant, the predicted edges are represented as continuous values, employing a soft edge design that enables gradient computation and propagation by the GNN-based classifier. Training encompasses other components and utilizes data from both the node classification task and the edge task.
(6)
MRS-GNNT: In this variant, the edges generated for predicting new nodes are transformed into binary values through thresholding, before being inputted to the classifier. Meanwhile, the edge generator is solely trained using losses from the edge prediction task.

5.2. Experimental Results and Analysis

5.2.1. Performance Validation of the MRS-GNN Model

In the initial experiment, we compared two variants of MRS-GNN with some previously mentioned popular methods. These variants were evaluated on three publicly available bearing datasets to validate the efficacy of the proposed method in addressing the challenges associated with imbalanced data in the field of intelligent diagnosis. The specific results are presented in Figure 5, indicating that the MRS-GNN variant consistently outperformed the conventional method in nearly all cases. Particularly, the MRS-GNNS and MRS-GNNT demonstrated significant improvements when the class imbalance ratio was at its highest, showcasing their robustness in extreme imbalance scenarios. For instance, on the CWRU dataset with a class imbalance ratio of 0.4, the performance of the MRS-GNNS was improved by over 18 percentage points, compared to the baseline oversampling method. Furthermore, the MRS-GNN variants exhibited relatively stable performance as the number of imbalanced classes increases, indicating their suitability for complex imbalance situations. In contrast, traditional methods such as the SMOTE and reweighting exhibited more pronounced performance degradation with an increasing number of imbalanced classes. The GraphSMOTE exhibited a noteworthy improvement over the standard SMOTE, potentially attributed to its graph-based approach that considers the underlying data structure. This highlights the potential of graph-based data methods in addressing imbalanced data, particularly in datasets with complex class relationships. Additionally, the observed trends across different datasets suggest that the proposed MRS-GNN approach can be effectively applied to various domains with varying levels of imbalance, demonstrating an excellent performance in tackling class imbalance.
Building upon the previous comprehensive analysis of accuracy metrics, we further investigated the use of AUC-ROC as a principal performance metric for evaluating class imbalance issues. In the CWRU dataset, we observed that different rates of class imbalance and the number of imbalanced categories significantly affected the performance of various methods. AUC-ROC, as a comprehensive performance metric, can better assess the model’s ability to handle imbalanced data, particularly its discriminative power when positive categories are scarce. The specific experimental results are depicted in Figure 6, where the bar graph illustrates the AUC-ROC values with a single imbalance class, while the line graph represents the metrics when there are two imbalance classes.
It is important to note that, when IMR = 1.0, the sample sizes of different classes are equal, indicating a balanced dataset and, therefore, the absence of imbalance classes.
Notably, at a class imbalance rate of 0.4, both the MRS-GNNs and MRS-GNNT methods outperformed the other comparative methods, achieving AUC-ROC values of 0.904 and 0.8953, respectively. This outcome demonstrates the effectiveness of both methods in addressing imbalance issues. Despite a decline in performance as the imbalance rate increased, the MRS-GNNS and MRS-GNNT consistently maintained relatively high AUC-ROC values. It is important to highlight that most methods experienced a decreased performance as the number of imbalance classes increased from 1 to 2, indicating the heightened difficulty in discriminating between classes in the presence of multiple imbalanced classes. However, the GraphSMOTE exhibited a relatively stable performance across all imbalance rates when there were two imbalance classes. This may be attributed to its ability to better preserve class boundaries during the generation of synthetic samples. When comparing the oversampling and SMOTE methods, the latter generally demonstrated lower AUC-ROC values, which could be due to the introduction of additional noise during sample generation. Conversely, the reweighting method exhibited a greater robustness at an imbalance rate of 1, although its performance gradually declined with an increasing number of imbalanced classes.
In summary, the MRS-GNNs and MRS-GNNT exhibited a superior performance compared to the other methods, showcasing the potential of graph neural network-based approaches in addressing class imbalance problems. Our study emphasizes the importance of evaluating multiple metrics, including accuracy, as well as metrics such as AUC-ROC, to comprehensively assess the model’s performance when dealing with imbalanced datasets.

5.2.2. Exploring the Effect of Different Base Models

A previous section of this paper extensively explored the theoretical foundations of GNN-based processing for imbalanced datasets and its promising applications in fault diagnosis. Our experimental data demonstrate the effectiveness of generating new samples for the minority category using specific techniques under various imbalance rate conditions. This section focuses on evaluating the performance of three GNN variants—GCN, GAT, and GraphSage—in addressing the issue of sample class imbalance in heterogeneous graph-based fault diagnosis problems. We evaluate the models’ performance at different imbalance rates through constructing generators that generate new samples for small sample classes. The experimental results not only demonstrate the effectiveness of various techniques in addressing imbalance but also highlight the performance differences among different GNN variants, thereby reinforcing the significance of selecting an appropriate model for a specific task, as depicted in Figure 7.
The GCN exhibited a notable improvement compared to the baseline model (I), especially when utilizing the two advanced methods, MRS-GNNs and MRS-GNNT. This is particularly significant, as it emphasizes the capability of GCNs to capture local structural information and their benefits when integrated with advanced sampling techniques. However, this advantage was not consistently observed in heterogeneous graph datasets, particularly in the case of highly imbalanced heterogeneous graphs, where the GCN did not perform as effectively as the other variants. This could be attributed to the GCN’s lack of consideration for internode variabilities during the information propagation, as well as its limitations in handling diverse node and edge types. Conversely, the GAT offered flexibility in learning node importance weights through the introduction of the attention mechanism, resulting in an enhanced capability to handle imbalanced data and a superior performance compared to the GCN and GraphSage across all imbalance rates. Notably, the performance improvement of the GAT was particularly remarkable when employing the MRS-GNNS approach, underscoring the significance of the attention mechanism in identifying and enhancing the effectiveness of critical information transmission. Moreover, its performance showcases its potential in addressing complex and imbalanced problems. However, it is undeniable that the GAT exhibits higher computational complexity when handling large graphs, necessitating more tuning parameters and placing greater demands on computer performance. In this study, GraphSage demonstrated remarkable scalability and adaptability to node variability, particularly as it approached the equilibrium state (IMR = 1), and its performance was comparable to that of the GAT and GCN.
This suggests that GraphSage can partially address internode variability through sampling neighboring nodes without compromising its ability to process large graphs. However, GraphSage’s performance may be hindered by its localization strategy in certain imbalanced scenarios, resulting in limited global awareness. This limitation can lead to inadequate information propagation in some cases, resulting in inferior performance compared to GAT.
In summary, the choice of GNN variants should be guided by specific application scenarios and dataset characteristics. Our findings indicate that, although the GAT is advantageous for handling imbalanced data, the GCN and GraphSage can also offer valuable insights in certain situations. The findings presented in this section serve as an experimental foundation for our troubleshooting investigation and provide guidance for future directions. In our ongoing exploration of enhancing GNN models to address increasingly complex imbalance problems, we will also investigate ways to leverage their capacity to capture comprehensive information about heterogeneous graphs, thus enhancing the accuracy and efficiency of fault diagnosis.

6. Conclusions

This research introduced the MRS-GNN framework as a substantial advancement in the use of graph neural networks for fault diagnosis in mechanical systems, specifically addressing class imbalances. The incorporation of the MeanRadius-SMOTE technique into graph-structured data enables the MRS-GNN framework to effectively maintain node features and connectivity, thus enhancing its diagnostic accuracy and robustness.
Rigorous testing on standard datasets demonstrated the superiority of the MRS-GNN framework, which excels in terms of classification accuracy and handling class imbalances. These results underscore the framework’s potential to revolutionize equipment diagnosis and its versatility across various complex systems, including bearings, power grids, and transport networks.
Future integration of unsupervised learning techniques will enhance the MRS-GNN framework’s ability to process unlabeled data, broadening its industrial applicability. This research significantly advances the development of reliable and efficient diagnostic health management systems, transforming maintenance strategies and enhancing the operational reliability of critical infrastructure.

Author Contributions

Writing—review and editing, writing—original draft, validation, software, methodology, and conceptualization, W.L.; writing—review and editing, supervision, and data curation, W.W.; writing—review and editing, X.Q.; and writing—review and editing, supervision, resources, and funding acquisition, Z.C. All authors have read and agreed to the published version of the manuscript.

Funding

This research was funded by the National Natural Science Foundation of China [72271200 and 72231008], the Distinguished Young Scholar Program of Shaanxi Province [2023-JQ-JC-10], the Natural Science Basic Research Program of Shaanxi Province [2022JQ-734], and the Science and Technology Innovation Team of Shaanxi Province [2024RS-CXTD-28].

Data Availability Statement

The data that support the findings of this study are available on request from the corresponding author, upon reasonable request.

Conflicts of Interest

The authors declare no conflicts of interest.

References

  1. Zhou, P.; Chen, S.; He, Q.; Wang, D.; Peng, Z. Rotating machinery fault-induced vibration signal modulation effects: A review with mechanisms, extraction methods and applications for diagnosis. Mech. Syst. Signal Process. 2023, 200, 110489. [Google Scholar] [CrossRef]
  2. Xu, J.; Liang, S.; Ding, X.; Yan, R. A zero-shot fault semantics learning model for compound fault diagnosis. Expert Syst. Appl. 2023, 221, 119642. [Google Scholar] [CrossRef]
  3. Han, T.; Xie, W.; Pei, Z. Semi-supervised adversarial discriminative learning approach for intelligent fault diagnosis of wind turbine. Inf. Sci. 2023, 648, 119496. [Google Scholar] [CrossRef]
  4. He, C.; Shi, H.; Liu, X.; Li, J. Interpretable physics-informed domain adaptation paradigm for cross-machine transfer diagnosis. Knowl. Based Syst. 2024, 288, 111499. [Google Scholar] [CrossRef]
  5. Yu, X.; Yang, Y.; Du, M.; He, Q.; Peng, Z. Dynamic model-embedded intelligent machine fault diagnosis without fault data. IEEE Trans. Ind. Inform. 2023, 19, 11466–11476. [Google Scholar] [CrossRef]
  6. Han, T.; Li, Y.F. Out-of-distribution detection-assisted trustworthy machinery fault diagnosis approach with uncertainty-aware deep ensembles. Reliab. Eng. Syst. Saf. 2022, 226, 108648. [Google Scholar] [CrossRef]
  7. Wang, D.; Dong, Y.; Wang, H.; Tang, G. Limited fault data augmentation with compressed sensing for bearing fault diagnosis. IEEE Sens. J. 2023, 23, 14499–14511. [Google Scholar] [CrossRef]
  8. Zheng, J.; Wang, H.; Kumar, A.; Xiang, J. Dynamic model-driven intelligent fault diagnosis method for rotary vector reducers. Eng. Appl. Artif. Intell. 2023, 124, 106648. [Google Scholar] [CrossRef]
  9. Niu, D.; Song, D. Model-based robust fault diagnosis of incipient ITSC for PMSM in elevator traction system. IEEE Trans. Instrum. Meas. 2023, 72, 1–12. [Google Scholar] [CrossRef]
  10. Fan, C.; Wu, Q.; Zhao, Y.; Mo, L. Integrating active learning and semi-supervised learning for improved data-driven HVAC fault diagnosis performance. Appl. Energy 2024, 356, 122356. [Google Scholar] [CrossRef]
  11. Irani, F.N.; Yadegar, M.; Meskin, N. Koopman-based deep iISS bilinear parity approach for data-driven fault diagnosis: Experimental demonstration using three-tank system. Control. Eng. Pract. 2024, 142, 105744. [Google Scholar] [CrossRef]
  12. Liu, H. Application of industrial Internet of things technology in fault diagnosis of food machinery equipment based on neural network. Soft Comput. 2023, 27, 9001–9018. [Google Scholar] [CrossRef]
  13. Wan, W.; Chen, J.; Xie, J. Graph-Based Model Compression for HSR Bogies Fault Diagnosis at IoT Edge via Adversarial Knowledge Distillation. IEEE Trans. Intell. Transp. Syst. 2023, 25, 1787–1796. [Google Scholar] [CrossRef]
  14. Kumar, U.; Mishra, S.; Dash, K. An IoT and semi-supervised learning-based sensorless technique for panel level solar photovoltaic array fault diagnosis. IEEE Trans. Instrum. Meas. 2023, 72, 1–12. [Google Scholar] [CrossRef]
  15. Wang, Y.; Wei, Z.; Yang, J. Feature trend extraction and adaptive density peaks search for intelligent fault diagnosis of machines. IEEE Trans. Ind. Inform. 2018, 15, 105–115. [Google Scholar] [CrossRef]
  16. Yang, C.; Cai, B.; Zhang, R.; Zou, Z.; Kong, X.; Shao, X.; Liu, Y.; Shao, H.; Khan, J.A. Cross-validation enhanced digital twin driven fault diagnosis methodology for minor faults of subsea production control system. Mech. Syst. Signal Process. 2023, 204, 110813. [Google Scholar] [CrossRef]
  17. Vo, T.T.; Liu, M.K.; Tran, M.Q. Harnessing attention mechanisms in a comprehensive deep learning approach for induction motor fault diagnosis using raw electrical signals. Eng. Appl. Artif. Intell. 2024, 129, 107643. [Google Scholar] [CrossRef]
  18. Zhang, J.; He, X. Compound-Fault Diagnosis of Integrated Energy Systems Based on Graph Embedded Recurrent Neural Networks. IEEE Trans. Ind. Inform. 2023, 20, 3478–3486. [Google Scholar] [CrossRef]
  19. Li, X.; Wang, Y.; Yao, J.; Li, M.; Gai, Z. Multi-sensor fusion fault diagnosis method of wind turbine bearing based on adaptive convergent viewable neural networks. Reliab. Eng. Syst. Saf. 2024, 245, 109980. [Google Scholar] [CrossRef]
  20. Li, T.; Zhou, Z.; Li, S.; Sun, C.; Yan, R.; Chen, X. The emerging graph neural networks for intelligent fault diagnostics and prognostics: A guideline and a benchmark study. Mech. Syst. Signal Process. 2022, 168, 108653. [Google Scholar] [CrossRef]
  21. Revathy, V.R.; Pillai, A.S.; Daneshfar, F. LyEmoBERT: Classification of lyrics’ emotion and recommendation using a pre-trained model. Procedia Comput. Sci. 2023, 218, 1196–1208. [Google Scholar] [CrossRef]
  22. Peng, X.; Xu, H.; Wang, J.; Liu, Z.; He, C. Ensemble multiple distinct ResNet networks with channel-attention mechanism for multi-sensor fault diagnosis of hydraulic systems. IEEE Sens. J. 2023, 23, 10706–10717. [Google Scholar] [CrossRef]
  23. Wei, Z.; He, D.; Jin, Z.; Liu, B.; Shan, S.; Chen, Y.; Miao, J. Density-based affinity propagation tensor clustering for intelligent fault diagnosis of train bogie bearing. IEEE Trans. Intell. Transp. Syst. 2023, 24, 6053–6064. [Google Scholar] [CrossRef]
  24. Li, H.; Liu, F.; Kong, X.; Zhang, J.; Jiang, Z.; Mao, Z. Knowledge features enhanced intelligent fault detection with progressive adaptive sparse attention learning for high-power diesel engine. Meas. Sci. Technol. 2023, 34, 105906. [Google Scholar] [CrossRef]
  25. Tian, J.; Jiang, Y.; Zhang, J.; Luo, H.; Yin, S. A novel data augmentation approach to fault diagnosis with class-imbalance problem. Reliab. Eng. Syst. Saf. 2024, 243, 109832. [Google Scholar] [CrossRef]
  26. Lee, J.; Ko, J.U.; Kim, T.; Kim, Y.; Jung, J.; Youn, B. Domain adaptation with label-aligned sampling (DALAS) for cross-domain fault diagnosis of rotating machinery under class imbalance. Expert Syst. Appl. 2024, 243, 122910. [Google Scholar] [CrossRef]
  27. Liu, Z.; Yang, J.; Zhong, X.; Wang, W.; Chen, H.; Chang, Y. A Novel Composite Graph Neural Network. IEEE Trans. Neural Netw. Learn. Syst. 2023, 1–15. [Google Scholar] [CrossRef] [PubMed]
  28. Li, R.; Yuan, X.; Radfar, M.; Marendy, P.; Ni, W.; Brien, T.; Casillas-Espinosa, P. Graph signal processing, graph neural network and graph learning on biological data: A systematic review. IEEE Rev. Biomed. Eng. 2021, 16, 109–135. [Google Scholar] [CrossRef] [PubMed]
  29. Qiu, Z.; Li, W.; Tang, T.; Wang, D.; Wang, Q. Denoising graph neural network based hydraulic component fault diagnosis method. Mech. Syst. Signal Process. 2023, 204, 110828. [Google Scholar] [CrossRef]
  30. Liu, R.; Wang, X.; Kumar, A.; Sun, B.; Zhou, Y. WPD-Enhanced Deep Graph Contrastive Learning Data Fusion for Fault Diagnosis of Rolling Bearing. Micromachines 2023, 14, 1467. [Google Scholar] [CrossRef]
  31. Tao, H.; Shi, H.; Qiu, J.; Jin, G. Planetary gearbox fault diagnosis based on FDKNN-DGAT with few labeled data. Meas. Sci. Technol. 2023, 35, 025036. [Google Scholar] [CrossRef]
  32. Han, S.; Zhu, K.; Zhou, M.C.; Liu, X. Evolutionary weighted broad learning and its application to fault diagnosis in self-organizing cellular networks. IEEE Trans. Cybern. 2022, 53, 3035–3047. [Google Scholar] [CrossRef] [PubMed]
  33. Ganaie, M.A.; Sajid, M.; Malik, A.K.; Tanveer, M. Graph Embedded Intuitionistic Fuzzy Random Vector Functional Link Neural Network for Class Imbalance Learning. IEEE Trans. Neural Netw. Learn. Syst. 2024, 1–10. [Google Scholar] [CrossRef] [PubMed]
  34. Raeisi, K.; Khazaei, M.; Tamburro, G.; Croce, P.; Comani, S.; Zappasodi, F. A class-imbalance aware and explainable spatio-temporal graph attention network for neonatal seizure detection. Int. J. Neural Syst. 2023, 33, 2350046. [Google Scholar] [CrossRef] [PubMed]
  35. Tsai, C.F.; Chen, K.C.; Lin, W.C. Feature selection and its combination with data over-sampling for multi-class imbalanced datasets. Appl. Soft Comput. 2024, 153, 111267. [Google Scholar] [CrossRef]
  36. Elreedy, D.; Atiya, A.F.; Kamalov, F. A theoretical distribution analysis of synthetic minority oversampling technique (SMOTE) for imbalanced learning. Mach. Learn. 2023, 113, 4903–4923. [Google Scholar] [CrossRef]
  37. Xie, Y.; Huang, X.; Qin, F.; Li, F.; Ding, X. A majority affiliation based under-sampling method for class imbalance problem. Inf. Sci. 2024, 662, 120263. [Google Scholar] [CrossRef]
  38. Soltanzadeh, P.; Feizi-Derakhshi, M.R.; Hashemzadeh, M. Addressing the class-imbalance and class-overlap problems by a metaheuristic-based under-sampling approach. Pattern Recognit. 2023, 143, 109721. [Google Scholar] [CrossRef]
  39. Rezvani, S.; Wang, X. A broad review on class imbalance learning techniques. Appl. Soft Comput. 2023, 143, 110415. [Google Scholar] [CrossRef]
  40. Fonseca, J.; Bacao, F. Geometric SMOTE for imbalanced datasets with nominal and continuous features. Expert Syst. Appl. 2023, 234, 121053. [Google Scholar] [CrossRef]
  41. Abhisheka, B.; Biswas, S.K.; Purkayastha, B. HBNet: An integrated approach for resolving class imbalance and global local feature fusion for accurate breast cancer classification. Neural Comput. Appl. 2024, 36, 8455–8472. [Google Scholar] [CrossRef]
  42. Dixit, A.; Mani, A. Sampling technique for noisy and borderline examples problem in imbalanced classification. Appl. Soft Comput. 2023, 142, 110361. [Google Scholar] [CrossRef]
  43. Ren, Z.; Lin, T.; Feng, K.; Zhu, Y.; Liu, Z.; Yan, K. A systematic review on imbalanced learning methods in intelligent fault diagnosis. IEEE Trans. Instrum. Meas. 2023, 72, 1–35. [Google Scholar] [CrossRef]
  44. Chawla, N.V.; Bowyer, K.W.; Hall, L.O.; Kegelmeyer, W. SMOTE: Synthetic minority over-sampling technique. J. Artif. Intell. Res. 2002, 16, 321–357. [Google Scholar] [CrossRef]
  45. Liang, X.; Jiang, A.; Li, T.; Xue, Y.; Wang, G. LR-SMOTE—An improved unbalanced data set oversampling based on K-means and SVM. Knowl. Based System. 2020, 196, 105845. [Google Scholar] [CrossRef]
  46. Mostafaei, S.; Ahmadi, A.; Shahrabi, J. USWAVG-BS: Under-Sampled Weighted AVeraGed BorderlineSMOTE to handle data intrinsic difficulties. Expert Syst. Appl. 2023, 227, 120379. [Google Scholar] [CrossRef]
  47. Guan, S.; Yang, H.; Wu, T. Transformer fault diagnosis method based on TLR-ADASYN balanced dataset. Sci. Rep. 2023, 13, 23010. [Google Scholar] [CrossRef]
  48. He, C.; Cao, Y.; Yang, Y.; Liu, Y.; Liu, X.; Cao, Z. Fault diagnosis of rotating machinery based on the improved multidimensional normalization ResNet. IEEE Trans. Instrum. Meas. 2023, 72, 3524311. [Google Scholar] [CrossRef]
  49. Wu, Z.; Zhang, H.; Guo, J.; Ji, Y.; Pecht, M. Imbalanced bearing fault diagnosis under variant working conditions using cost-sensitive deep domain adaptation network. Expert Syst. Appl. 2022, 193, 116459. [Google Scholar] [CrossRef]
  50. Liu, H.; Yang, Y.; Hu, N.; Chen, Z.; Cheng, J. Soft-margin hyperdisk tensor machine and its application to the intelligent fault diagnosis of rotating machinery. Meas. Sci. Technol. 2022, 33, 125902. [Google Scholar] [CrossRef]
  51. Liu, C.; She, W.; Chen, M.; Li, X.; Yang, S. Consistent penalizing field loss for zero-shot image retrieval. Expert Syst. Appl. 2024, 236, 121287. [Google Scholar] [CrossRef]
  52. Hwang, S.; Choi, J.; Choi, J. Uncertainty-Based Selective Clustering for Active Learning. IEEE Access 2022, 10, 110983–110991. [Google Scholar] [CrossRef]
  53. Duan, F.; Zhang, S.; Yan, Y.; Cai, Z. An oversampling method of unbalanced data for mechanical fault diagnosis based on MeanRadius-SMOTE. Sensors 2022, 22, 5166. [Google Scholar] [CrossRef]
  54. Chen, M.; Wei, Z.; Huang, Z.; Ding, B.; Li, Y. Simple and deep graph convolutional networks. In Proceedings of the 37th International Conference on Machine Learning, PMLR, Virtual, 13–18 July 2020; pp. 1725–1735. [Google Scholar]
  55. Wu, F.; Zhang, T.; Souza, A.; Fifty, C.; Yu, T.; Weinberger, K. Simplifying graph convolutional networks. In Proceedings of the 36th International Conference on Machine Learning, PMLR, Long Beach, CA, USA, 9–15 June 2019; pp. 6861–6871. [Google Scholar]
  56. Veličković, P.; Cucurull, G.; Casanova, A.; Romero, A.; Lio, P.; Bengio, Y. Graph attention networks. arXiv 2017, arXiv:1710.10903. [Google Scholar]
  57. Xu, K.; Hu, W.; Leskovec, J.; Jegelka, S. How powerful are graph neural networks? arXiv 2018, arXiv:1810.00826. [Google Scholar]
  58. Bouritsas, G.; Frasca, F.; Zafeiriou, S.; Bronstein, M. Improving graph neural network expressivity via subgraph isomorphism counting. IEEE Trans. Pattern Anal. Mach. Intell. 2022, 45, 657–668. [Google Scholar] [CrossRef]
  59. Li, M.; Cai, X.; Xu, S.; Ji, H. Metapath-aggregated heterogeneous graph neural network for drug–target interaction prediction. Brief. Bioinform. 2023, 24, bbac578. [Google Scholar] [CrossRef]
  60. Wu, S.; Zhang, W.; Sun, F.; Cui, B. Graph neural networks in recommender systems: A survey. ACM Comput. Surv. 2022, 55, 1–37. [Google Scholar] [CrossRef]
  61. Chen, D.; Liu, R.; Hu, Q.; Ding, S. Interaction-aware graph neural networks for fault diagnosis of complex industrial processes. IEEE Trans. Neural Netw. Learn. Syst. 2021, 34, 6015–6028. [Google Scholar] [CrossRef]
  62. Xu, Y.; Ji, J.; Ni, Q.; Feng, K.; Beer, M.; Chen, H. A graph-guided collaborative convolutional neural network for fault diagnosis of electromechanical systems. Mech. Syst. Signal Process. 2023, 200, 110609. [Google Scholar] [CrossRef]
  63. Smith, W.A.; Randall, R.B. Rolling element bearing diagnostics using the Case Western Reserve University data: A benchmark study. Mech. Syst. Signal Process. 2015, 64, 100–131. [Google Scholar] [CrossRef]
  64. Li, K.; Ping, X.; Wang, H.; Chen, P.; Cao, Y. Sequential fuzzy diagnosis method for motor roller bearing in variable operating conditions based on vibration analysis. Sensors 2013, 13, 8013–8041. [Google Scholar] [CrossRef] [PubMed]
  65. Lessmeier, C.; Kimotho, J.K.; Zimmer, D.; Sextro, W. Condition monitoring of bearing damage in electromechanical drive systems by using motor current signals of electric motors: A benchmark data set for data-driven classification. In Proceedings of the PHM Society European Conference, Bilbao, Spain, 5–8 July 2016; Volume 3. [Google Scholar]
  66. Yuan, B.; Ma, X. Sampling+ reweighting: Boosting the performance of AdaBoost on imbalanced datasets. In Proceedings of the 2012 International Joint Conference on Neural Networks (IJCNN), Brisbane, Australia, 10–15 June 2012; pp. 1–6. [Google Scholar]
  67. Zhao, T.; Zhang, X.; Wang, S. Graphsmote: Imbalanced node classification on graphs with graph neural networks. In Proceedings of the 14th ACM International Conference on Web Search and Data Mining, Jerusalem, Israel, 8–12 March 2021; pp. 833–841. [Google Scholar]
Figure 1. Node imbalance scenario in (a) the fault classification task and (b) after oversampling operation.
Mathematics 12 02064 g001
Figure 2. Schematic diagram of graph data generation based on Pearson correlation coefficient.
Mathematics 12 02064 g002
Figure 3. GraphSage working steps.
Mathematics 12 02064 g003
Figure 4. MRS-GNN intelligent diagnostic framework flowchart.
Mathematics 12 02064 g004
Figure 5. The classification accuracy of different methods in handling different imbalanced datasets when IMR is equal to: (a) 0.4, (b) 0.6, (c) 0.8, and (d) 1.0.
Mathematics 12 02064 g005
Figure 6. AUC-ROC values for different methods in the CWRU dataset.
Mathematics 12 02064 g006
Figure 7. Performance of different base models in handling imbalanced datasets when IMR is equal to: (a) 0.4, (b) 0.6, (c) 0.8, and (d) 1.0.
Mathematics 12 02064 g007
Table 1. Specific working condition design of the dataset used during the experiments.
DatasetType of FaultDescription
CWRU/JNUNormal (N)bearings with normal conditions.
Outer Fault (OF)bearings with an outer ring fault condition. In the CWRU dataset, the size of the outer ring fault is 0.5334 mm.
Inner Fault (IF)bearings with an inner ring fault condition. In the CWRU dataset, the size of the outer ring fault is 0.5334 mm.
Ball Fault (BF)bearings with a ball fault condition.
PUNormal (N)bearings with normal conditions.
Artificial Outer Damage (AOF)bearings with an outer ring damage fault formed through artificial electrical discharge machining.
Artificial Inner Damage (AIF)bearings with an inner ring damage fault formed through artificial electrical discharge machining.
Real Outer Damage (ROF)bearings with an outer ring damage fault formed by fatigue spalling in real operating conditions.
Real Combined Damage (RCF)bearings with a composite inner and outer ring damage fault formed by fatigue spalling in real operating conditions.
Table 2. Description of imbalanced datasets.
DatasetsNodeThe Number of SamplesIMRIC
NOF (AOF)IF (AIF)BF (ROF)(RCF)
450450450450 1
450450450360 1
450450360360 2
CWRU/JNU 4 × 450 450450450270 0.61
450450270270 2
450450450180 0.41
450450180180 2
4504504504504501
4504504503603600.82
450450360360360 3
PU 5 × 450 4504504502702700.62
450450270270270 3
4504504501801800.42
450450180180180 3
Disclaimer/Publisher’s Note: The statements, opinions and data contained in all publications are solely those of the individual author(s) and contributor(s) and not of MDPI and/or the editor(s). MDPI and/or the editor(s) disclaim responsibility for any injury to people or property resulting from any ideas, methods, instructions or products referred to in the content.

