

Enhancing Decision-Making Processes in the Complex Landscape of the Taiwanese Electronics Manufacturing Industry through a Fuzzy MCDM Approach


Abstract
:1. Introduction
2. Literature Review
2.1. FDM
2.2. ISM
2.3. FANP
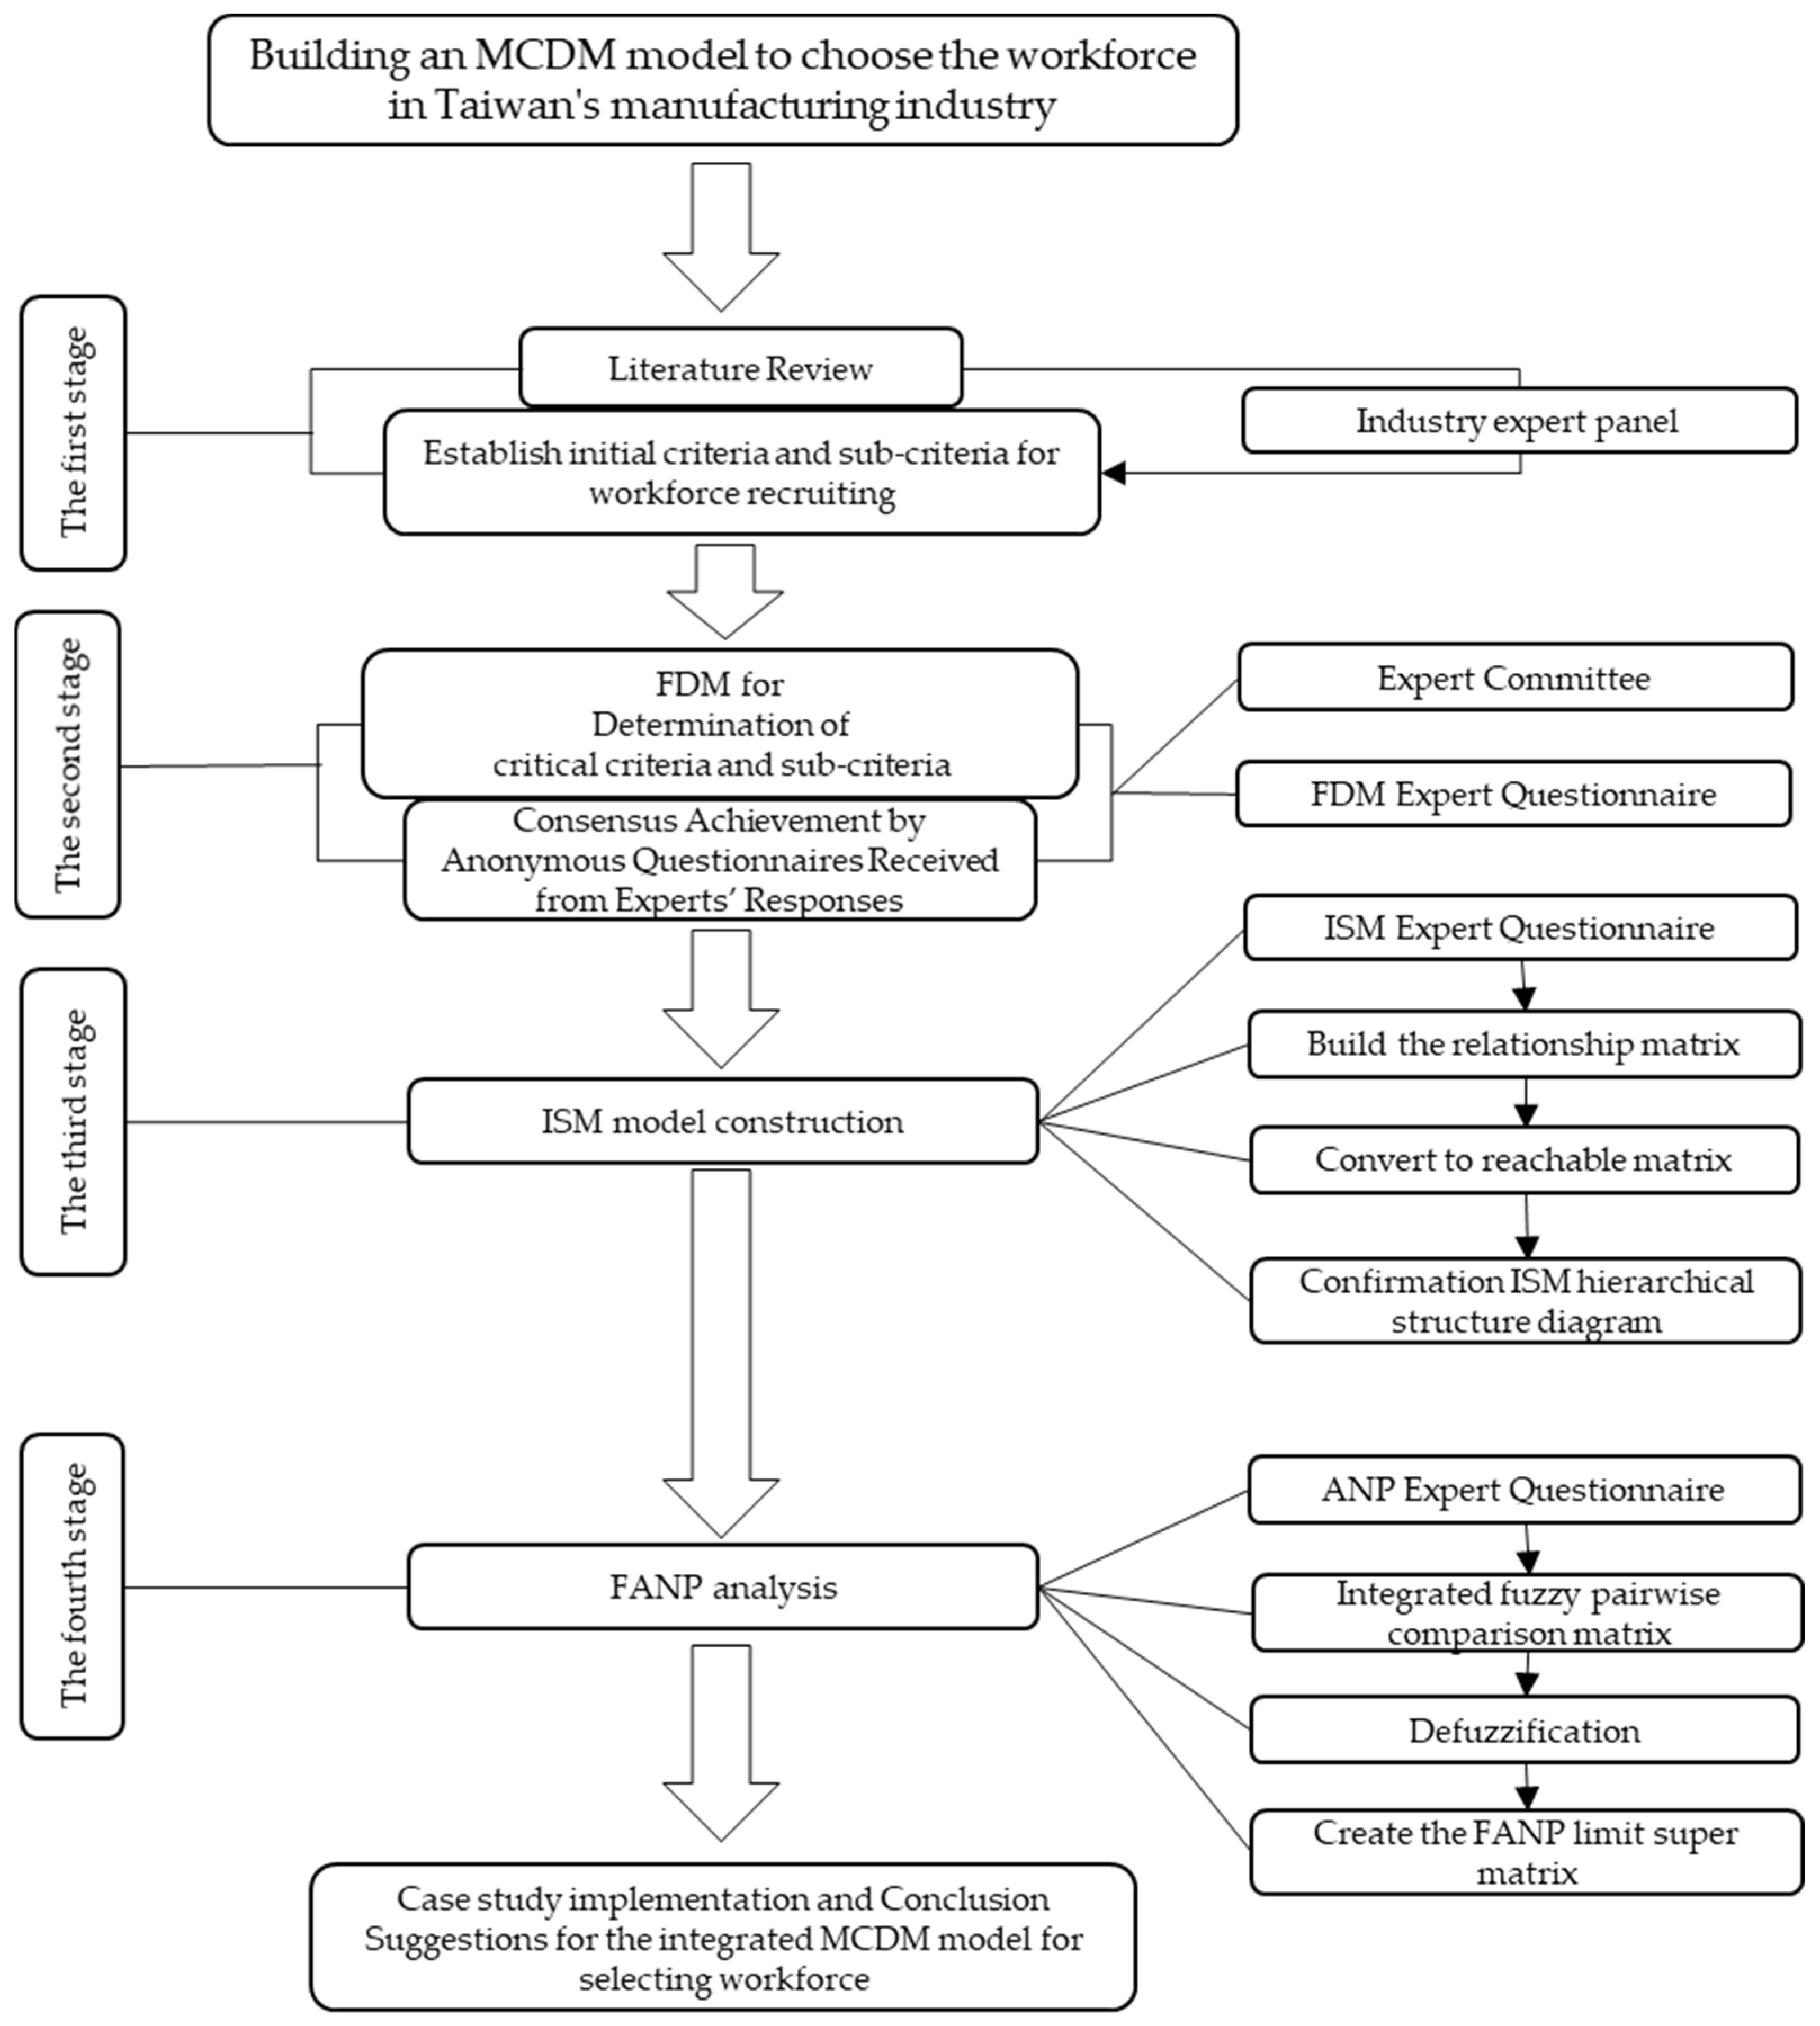
3. Methodology
3.1. Identify Recruitment Criteria in Taiwan’s Electronics Manufacturing Industry
3.2. Define Initial Criteria and Sub-Criteria: Constituting an Expert Committee and Analyzing Survey Responses Using FDM
3.2.1. Conduct the Questionnaire and Assigning Values to Criteria
3.2.2. Apply Fuzzy Set Theory
3.2.3. Create Triangular Fuzzy Numbers
3.2.4. Calculate Extreme Values for Criteria
μ + 2σ ≥ Ui > μ − 2σ
3.2.5. Create and Process Triangular Fuzzy Numbers
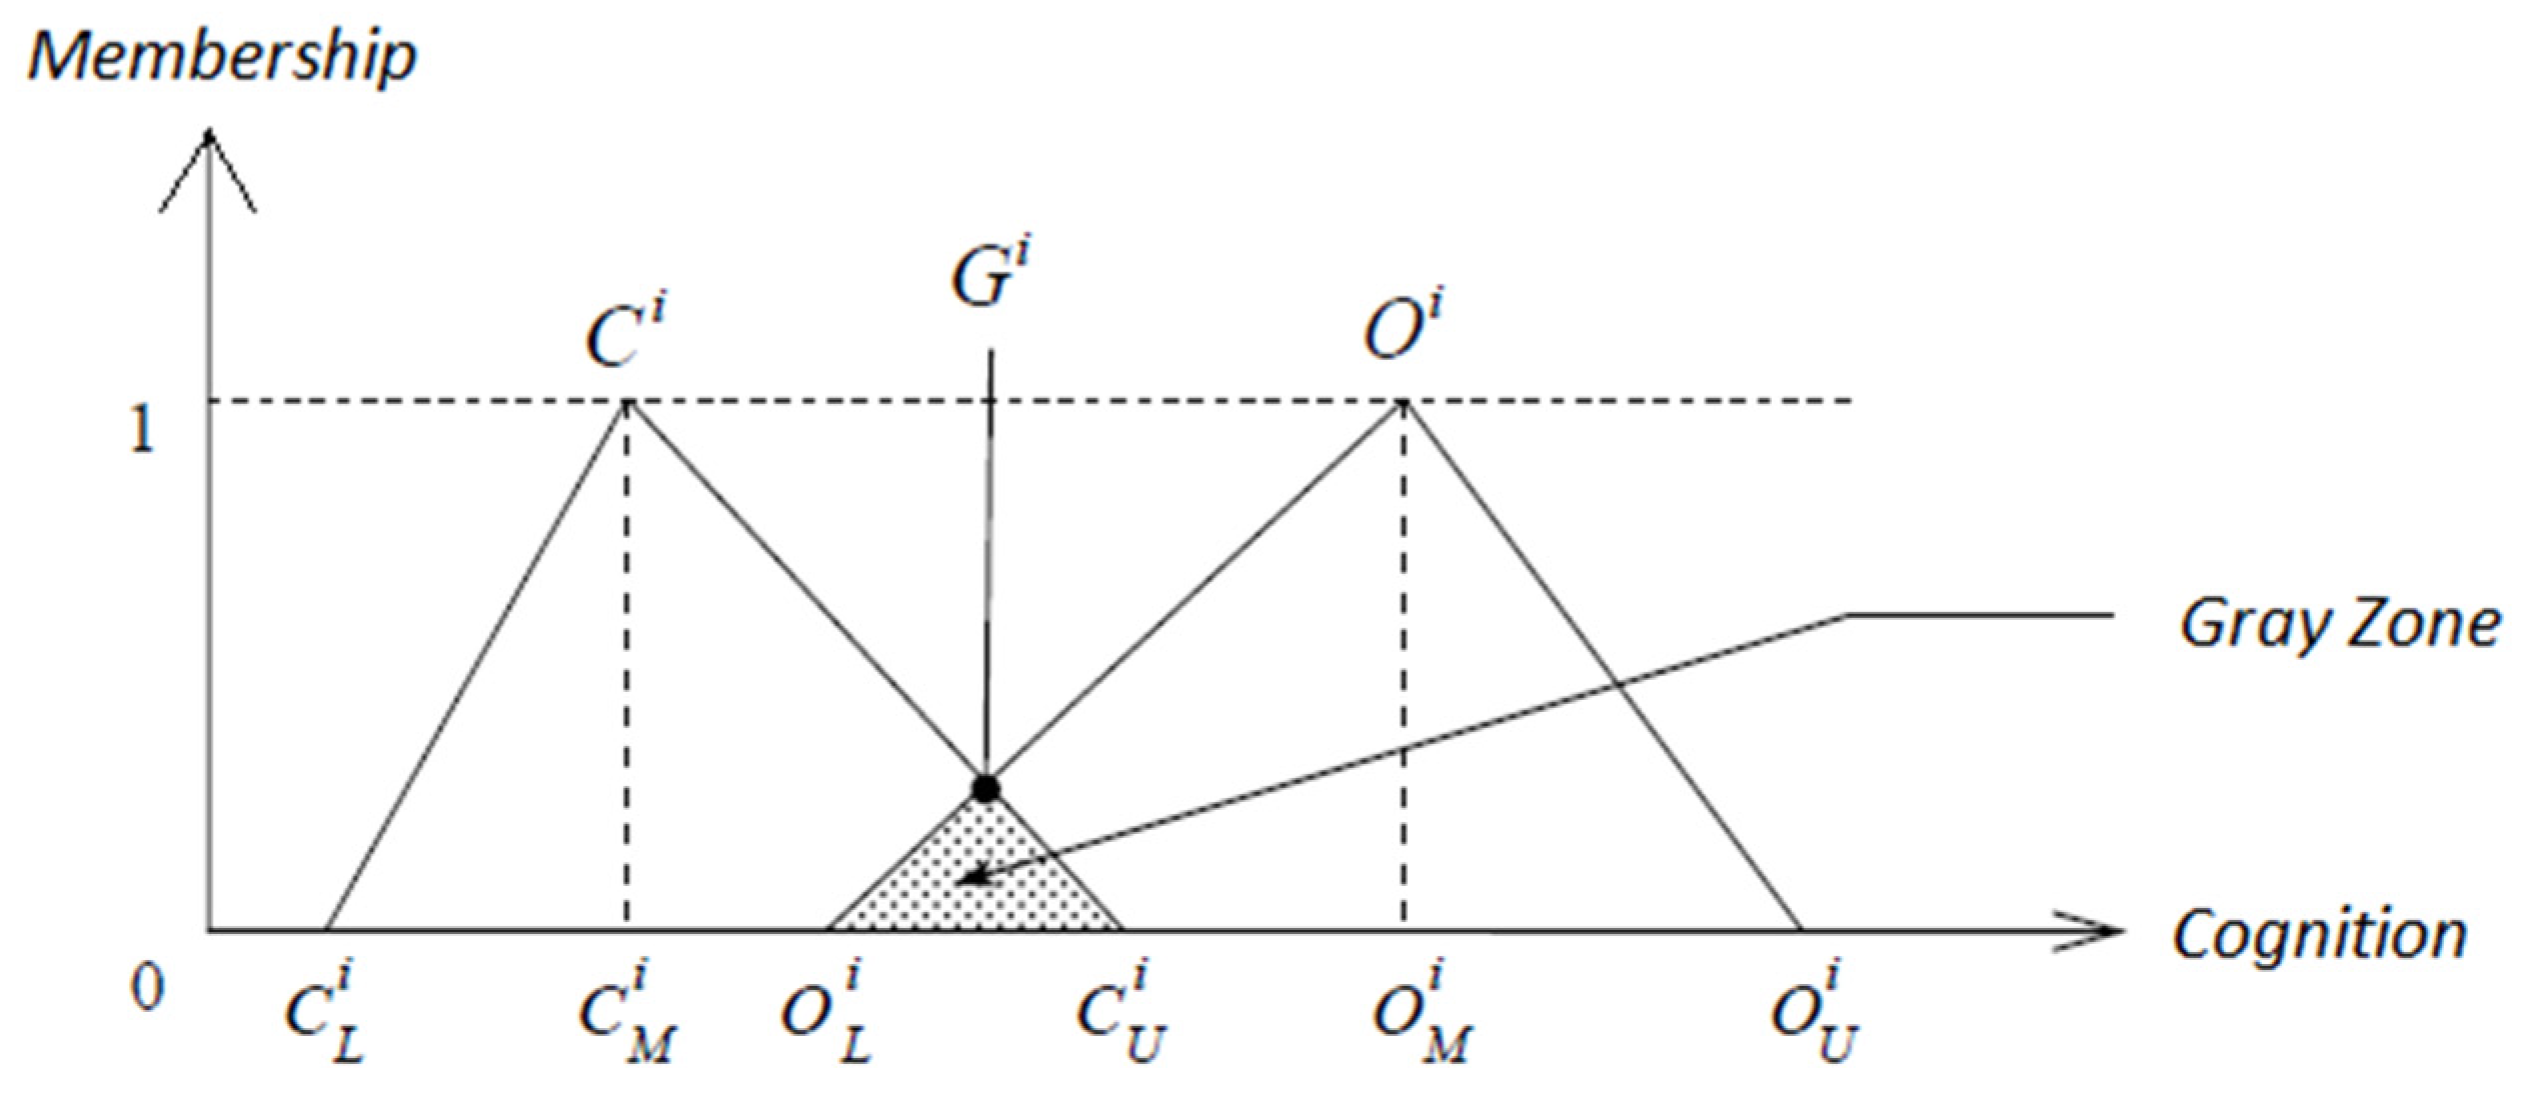
3.2.6. Evaluate Consensus for Criteria
- If the two triangles do not overlap (), indicating consensus among the experts, the consensus important value will be the average of and .
- If the two triangles overlap (), creating a gray zone in the criteria and , and the value between the geometric mean of the most optimistic value and the geometric mean of the most conservative is denoted as . The relationship between and , meanwhile, ought to be identified as follows:
- (1)
- If , indicates no consensus among experts, but the extreme opinions are not significantly different from the others. In this case, the consensus importance of criterion is calculating using the minimum fuzzy relationship to find the fuzzy sets and then obtaining the maximum membership degree [124]. The () represented below is the membership function of the fuzzy triangular number and .Formula (4) is the actual calculation for the consensus value which has a gray zone .
- (2)
- If , it indicates a lack of consensus among experts, with extreme opinions significantly differing from the others. Therefore, the criterion which has not converged, will provide experts with the ranging value for the next questionnaire. All the criteria are expected to converge until the consensus value is reached.
3.2.7. Set a Threshold for Criteria Qualification
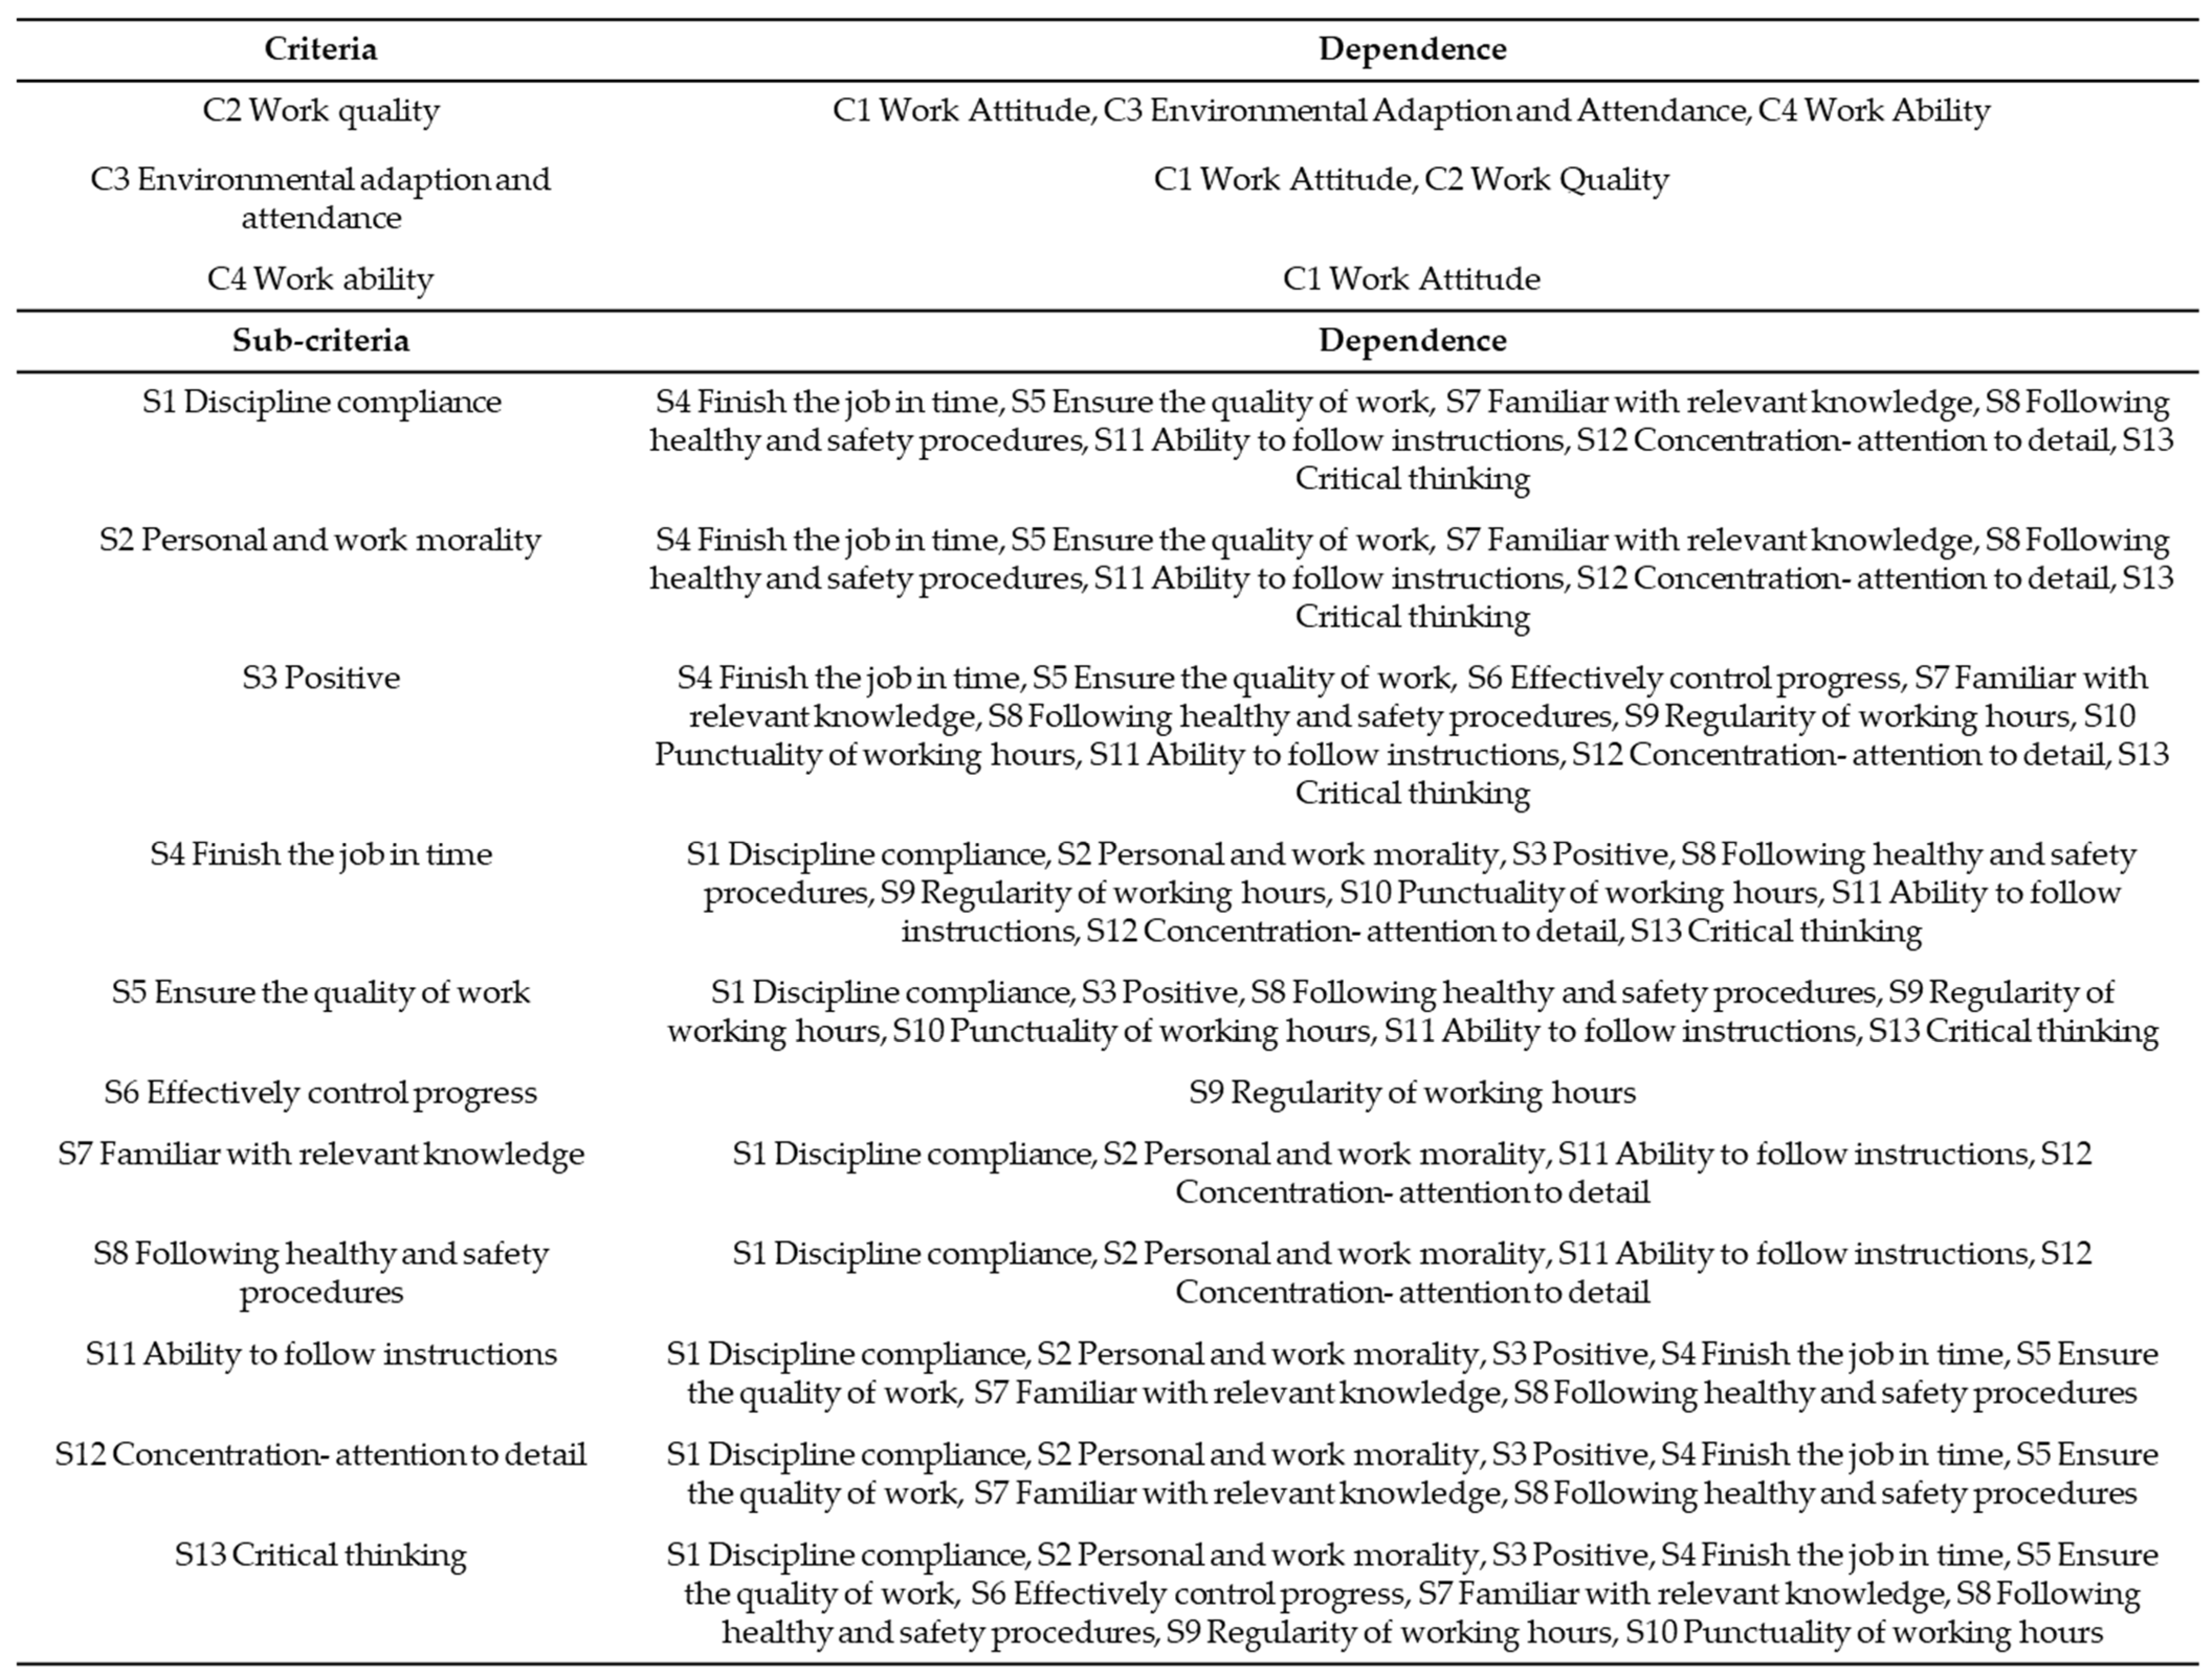
3.3. Utilize the ISM Method to Delineate the Relationships among the Criteria and Sub-Criteria
3.3.1. Create the Adjacency Matrix
3.3.2. Create the Reachability Matrix
3.4. Determine the Weights of Criteria and Sub-Criteria in Workforce Recruitment Using FANP
3.4.1. Construction of a Pairwise Comparison Matrix of Expert Opinions
- Design and administration of the FANP expert questionnaire
- 2.
- Creation of pairwise comparison matrix
3.4.2. Apply Fuzzy Theory to Convert Expert Opinions into Fuzzy Sets
- Establish a Fuzzy Pairwise Comparison Matrix
- 2.
- Integration of expert opinions
- 3.
- Convert fuzzy values into crisp values
3.4.3. Priority Vector Algorithm
- Step 1. Calculate the independent weights of each aspect under the research objective;
- Step 2. Calculate the relationship weights between dependent aspects;
- Step 3. Calculate the independent weights of elements under each aspect;
- Step 4. Calculate the relationship weights between dependent elements;
- Step 5. Calculate the actual weights of each aspect and each element, as well as the overall weights;
- Step 6. Rank and compare competitive strategies based on the weights of each element.
- Calculation and Consistency Test:
- 2.
- Consistency test:
- a.
- Consistency Index (C.I.)
- b.
- Consistency Ratio (C.R)
- 3.
- Calculate weights:
- The actual weights of each aspect (Wgoal_component) indicate the degree of influence each aspect has on the goal;
- The actual weights of elements under each aspect (Wcomponent_element) can be used to deduce the influence of each element within its respective aspect;
- The overall weight values of each element for the goal (Wgoal_element) ultimately summarize the importance of each element’s impact on the overall goal, leading to corresponding specific recommendations.
3.4.4. Ranking and Identifying Optimal Criteria and Sub-Criteria
4. Findings
4.1. Use FDM to Identify Key Criteria and Sub-Criteria for Workforce Recruitment Decisions
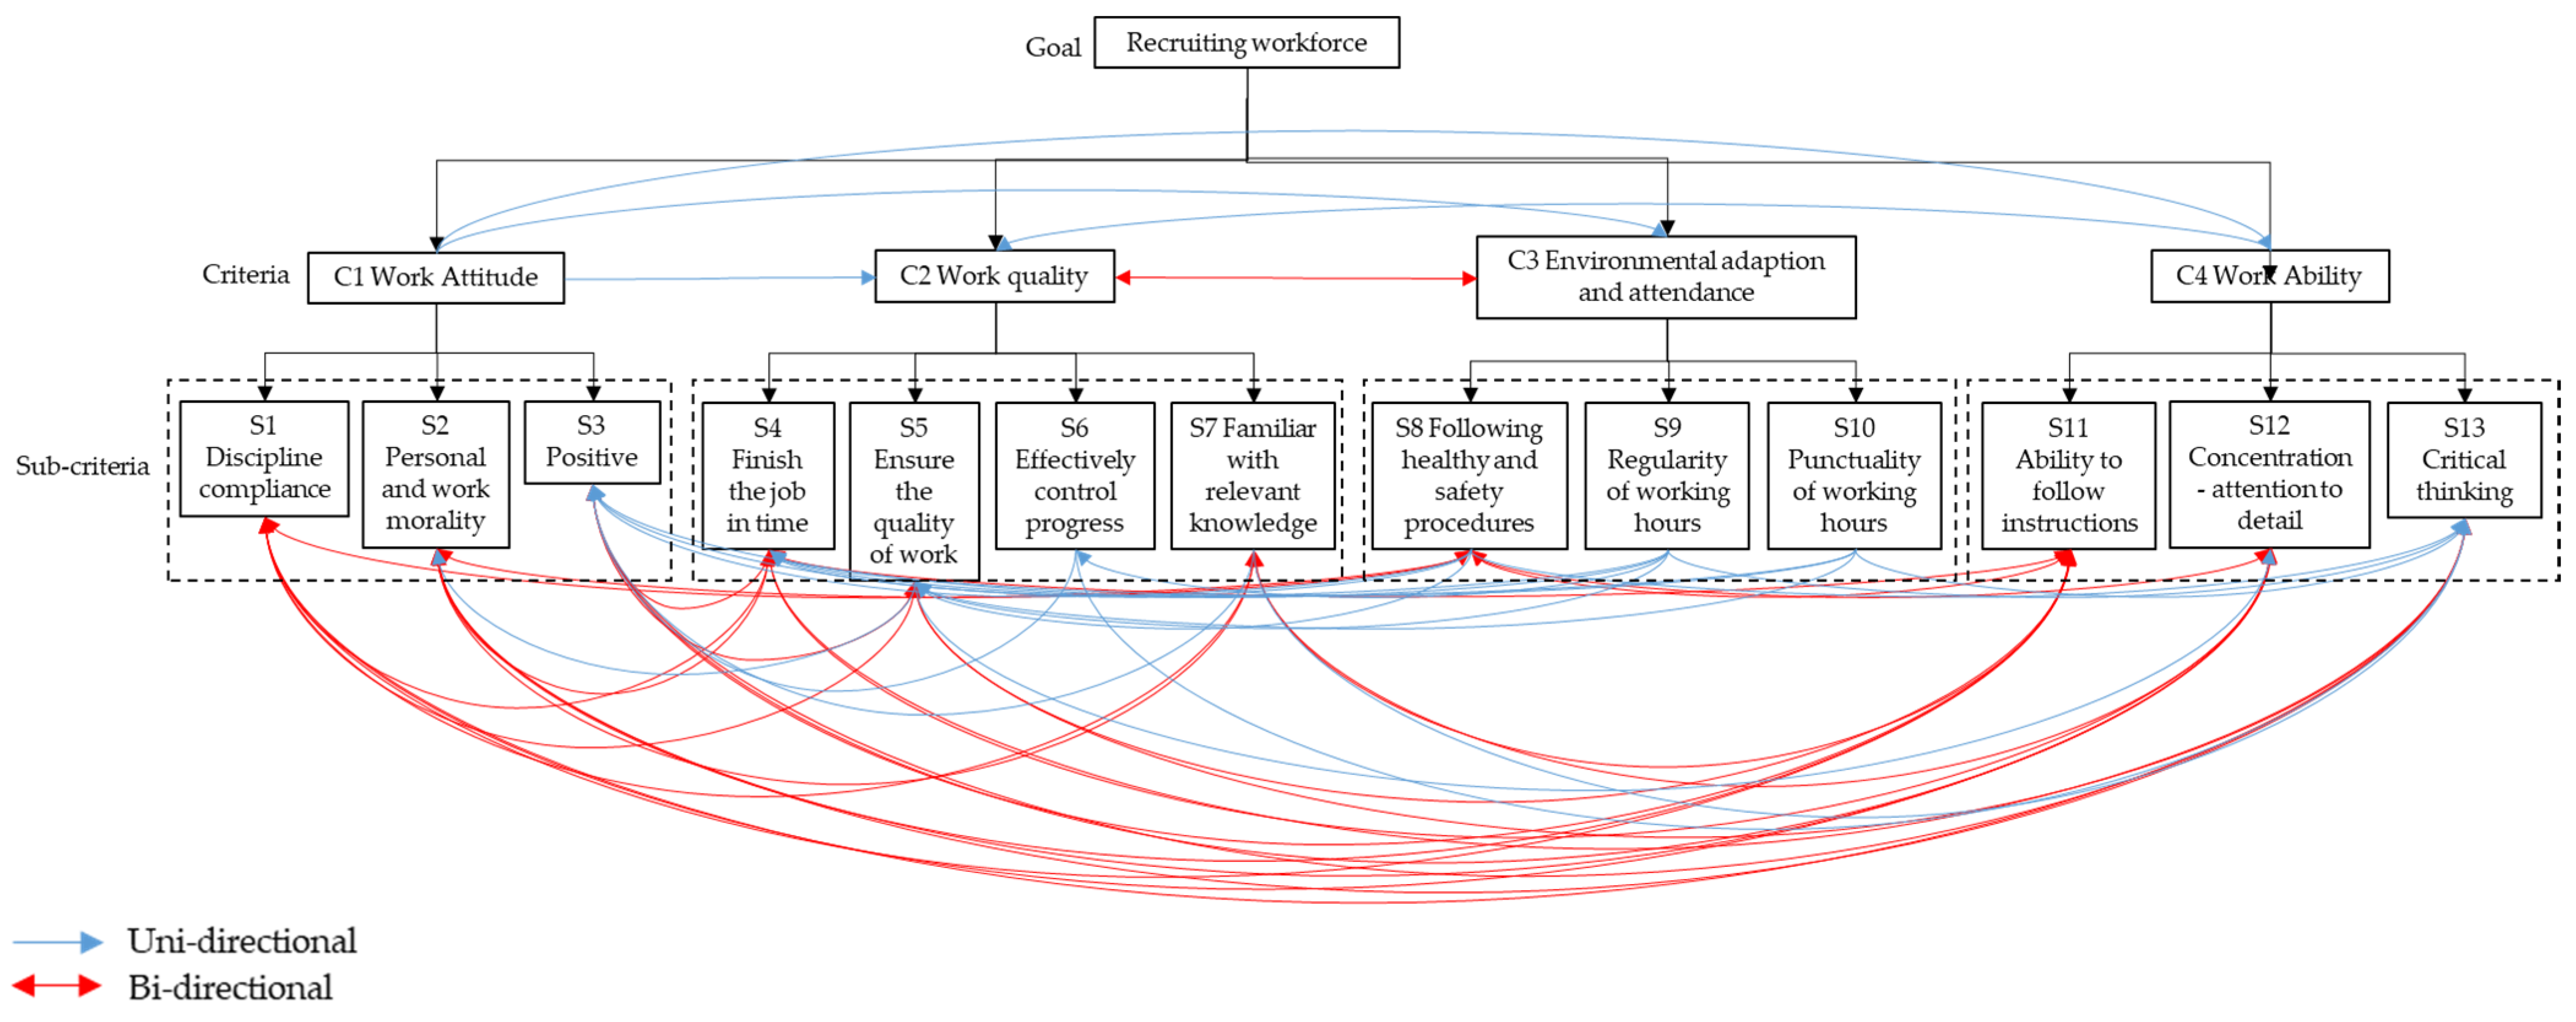
4.2. Assess Interdependencies among Identified Criteria/Sub-Criteria Using ISM
4.3. Determine Relative Weights and Rank of Critical Criteria and Sub-Criteria for Workforce Selection Using FANP
4.3.1. Construct a Pairwise Comparison Matrix of Expert Opinions
4.3.2. Apply Fuzzy Theory to Convert Expert Opinions into Fuzzy Sets
4.3.3. Priority Vector Algorithm
Examine the Consistency
Calculate the Weight of Criteria and Sub-Criteria Relative to the Overall Hierarchy
| Matrix W1: Independent weight matrix of each criterion under the research objective | Matrix W2: Relationship weight matrix between dependent criteria | Matrix W3: Independent weight matrix of the sub-criteria under each criterion |
| S1 | S2 | S3 | S4 | S5 | S6 | S7 | S8 | S9 | S10 | S11 | S12 | S13 | |
| S1 | 0.500 | 0.333 | 0.242 | 0.041 | 0.056 | 0.000 | 0.380 | 0.2886 | 0.000 | 0.000 | 0.000 | 0.000 | 0.000 |
| S2 | 0.000 | 0.333 | 0.242 | 0.016 | 0.000 | 0.000 | 0.119 | 0.1388 | 0.000 | 0.000 | 0.000 | 0.000 | 0.000 |
| S3 | 0.000 | 0.000 | 0.242 | 0.022 | 0.029 | 0.128 | 0.000 | 0.000 | 0.000 | 0.000 | 0.000 | 0.000 | 0.000 |
| S4 | 0.062 | 0.040 | 0.000 | 0.377 | 0.000 | 0.000 | 0.000 | 0.000 | 0.000 | 0.000 | 0.000 | 0.000 | 0.000 |
| S5 | 0.124 | 0.087 | 0.071 | 0.000 | 0.500 | 0.000 | 0.000 | 0.000 | 0.000 | 0.000 | 0.000 | 0.000 | 0.000 |
| S6 | 0.048 | 0.044 | 0.065 | 0.000 | 0.000 | 0.500 | 0.000 | 0.000 | 0.000 | 0.000 | 0.000 | 0.000 | 0.000 |
| S7 | 0.000 | 0.000 | 0.037 | 0.000 | 0.000 | 0.000 | 0.500 | 0.000 | 0.000 | 0.000 | 0.000 | 0.000 | 0.000 |
| S8 | 0.106 | 0.070 | 0.000 | 0.000 | 0.112 | 0.000 | 0.000 | 0.500 | 0.000 | 0.000 | 0.000 | 0.000 | 0.000 |
| S9 | 0.000 | 0.000 | 0.000 | 0.000 | 0.051 | 0.148 | 0.000 | 0.000 | 0.000 | 0.000 | 0.000 | 0.000 | 0.000 |
| S10 | 0.076 | 0.397 | 0.026 | 0.0695 | 0.054 | 0.000 | 0.000 | 0.000 | 0.000 | 0.000 | 0.000 | 0.000 | 0.000 |
| S11 | 0.081 | 0.051 | 0.018 | 0.0783 | 0.106 | 0.000 | 0.000 | 0.000 | 0.000 | 0.000 | 0.000 | 0.000 | 0.000 |
| S12 | 0.000 | 0.000 | 0.023 | 0.1488 | 0.083 | 0.223 | 0.000 | 0.000 | 0.000 | 0.000 | 0.000 | 0.000 | 0.000 |
| S13 | 0.000 | 0.000 | 0.028 | 0.244 | 0.007 | 0.000 | 0.000 | 0.072 | 0.000 | 0.000 | 0.000 | 0.000 | 0.000 |
5. Discussion
- Advance Manpower Planning
- 2.
- Align Staffing with Capacity Cycles
- Evaluate Job Compatibility
- 2.
- Optimize Workforce Allocation
6. Conclusions and Recommendations
Author Contributions
Funding
Data Availability Statement
Conflicts of Interest
References
- Soong, J.J. Empowering the Elderly to Promote Active Ageing in the Labour Market: A New Strategic Scheme to Improve Ageing Human Resource and to Solve Shortage of Labour Force in Taiwan. Malays. J. Hist. Politics Strateg. Stud. 2020, 47, 198–224. [Google Scholar]
- Kazemzadeh, E.; Fuinhas, J.A.; Salehnia, N.; Osmani, F. The Effect of Economic Complexity, Fertility Rate, and Information and Communication Technology on Ecological Footprint in the Emerging Economies: A Two-Step Stirpat Model and Panel Quantile Regression. Qual. Quant. 2023, 57, 737–763. [Google Scholar] [CrossRef]
- Hu, Q.; Lei, X.; Zhao, B. Demographic Changes and Economic Growth: Impact and Mechanisms. China Econ. J. 2021, 14, 223–242. [Google Scholar] [CrossRef]
- Maestas, N.; Mullen, K.J.; Powell, D. The Effect of Population Aging on Economic Growth, the Labor Force, and Productivity. Am. Econ. J. Macroecon. 2023, 15, 306–332. [Google Scholar] [CrossRef]
- Jones, C.I. The End of Economic Growth? Unintended Consequences of a Declining Population. Am. Econ. Rev. 2022, 112, 3489–3527. [Google Scholar] [CrossRef]
- Nguyen, H.N. Confronting the Competition in the Labor Market: An Interview Study about Vietnamese Workers versus Questionnaire Responses from Taiwanese Workers in Taiwan; Cambridge Open Engage: Cambridge, UK, 2023. [Google Scholar] [CrossRef]
- Bannikova, K.; Mykhaylyova, K. Effective Global Recruitment Strategy: Cultural Competence. Rev. Econ. Financ. 2023, 21, 592–598. [Google Scholar]
- Kamberaj, J.; Aebi, S.; Hauri, A.; Gajos, W. Trend Analysis Civil Protection 2035 Uncertainties, Challenges and Opportunities; ETH Zurich: Zürich, Switzerland, 2024. [Google Scholar] [CrossRef]
- Gibson, A. Agile Workforce Planning: How to Align People with Organizational Strategy for Improved Performance; Kogan Page Publishers: London, UK, 2021. [Google Scholar]
- Lai, Y.C.; Sarkar, S. Impact of Labour Unrest and Skilled Workforce in Host Country on Inflow of Foreign Direct Investment—A Case of Taiwan, ROC. Int. J. Manpow. 2022, 43, 1469–1484. [Google Scholar] [CrossRef]
- Tien, C.T.; Hsu, K.C.; Hsing, Y.H. The Mediated Effect of Workforce Agility on the Relationship of IT Leveraging Competence and Entrepreneurship. In Proceedings of the 2020 the 4th International Conference on E-Society, E-Education and E-Technology, Taipei, Taiwan, 15–17 August 2020; pp. 110–113. [Google Scholar] [CrossRef]
- Chen, M.Y.C.; Lam, L.W.; Zhu, J.N.Y. Should Companies Invest in Human Resource Development Practices? The Role of Intellectual Capital and Organizational Performance Improvements. Pers. Rev. 2020, 50, 460–477. [Google Scholar] [CrossRef]
- Huang, W.H.; Lin, Y.J.; Lee, H.F. Impact of Population and Workforce Aging on Economic Growth: Case Study of Taiwan. Sustainability 2019, 11, 6301. [Google Scholar] [CrossRef]
- Chou, Y.C.; Yen, H.Y.; Dang, V.T.; Sun, C.C. Assessing the Human Resource in Science and Technology for Asian Countries: Application of Fuzzy AHP and Fuzzy TOPSIS. Symmetry 2019, 11, 251. [Google Scholar] [CrossRef]
- Mensah, R.D. Principles of Human Resource Management, 2nd ed.; Author House: Bloomington, IN, USA, 2020. [Google Scholar]
- Pourkhodabakhsh, N.; Mamoudan, M.M.; Bozorgi-Amiri, A. Effective Machine Learning, Meta-Heuristic Algorithms and Multi-Criteria Decision Making to Minimizing Human Resource Turnover. Appl. Intell. 2023, 53, 16309–16331. [Google Scholar] [CrossRef] [PubMed]
- Abdalla Hamza, P.; Jabbar Othman, B.; Gardi, B.; Sorguli, S.; Mahmood Aziz, H.; Ali Ahmed, S.; Sabir, B.Y.; Burhan Ismael, N.; Ali, B.J.; Anwar, G. Recruitment and Selection: The Relationship between Recruitment and Selection with Organizational Performance. Int. J.Eng. Bus. Manag. 2021, 5, 1–13. [Google Scholar] [CrossRef]
- Jamil, S.; Zaman, S.I.; Kayikci, Y.; Khan, S.A. The Role of Green Recruitment on Organizational Sustainability Performance: A Study within the Context of Green Human Resource Management. Sustainability 2023, 15, 15567. [Google Scholar] [CrossRef]
- Phillips, J. Strategic Staffing; SAGE Publications: Washington DC, USA, 2023. [Google Scholar]
- Herowati, E.; Parung, J.; Santoso, J. The Assessment Model to Rank Applicants for Research and Development Job Position in PT ABC. In Proceedings of the First Australian International Conference on Industrial Engineering and Operations Management, Sydney, Australia, 20–21 December 2022; pp. 1–13. [Google Scholar]
- Cho, W.; Choi, S.; Choi, H. Human Resources Analytics for Public Personnel Management: Concepts, Cases, and Caveats. Adm. Sci. 2023, 13, 41. [Google Scholar] [CrossRef]
- Okolie, U.C. Effect of Diversity Management On Human Resource Management: Recruitment And Selection In Focus. Econ. Ser. 2020, 20, 63–86. [Google Scholar]
- Pessach, D.; Singer, G.; Avrahami, D.; Chalutz Ben-Gal, H.; Shmueli, E.; Ben-Gal, I. Employees Recruitment: A Prescriptive Analytics Approach via Machine Learning and Mathematical Programming. Decis. Support Syst. 2020, 134, 113290. [Google Scholar] [CrossRef] [PubMed]
- Autor, D.H.; Mindell, D.A.; Reynolds, E. The Work of the Future: Building Better Jobs in an Age of Intelligent Machines; MIT Press: Cambridge, MA, USA, 2023. [Google Scholar]
- Uslu, Y.D.; Yılmaz, E.; Yiğit, P. Developing Qualified Personnel Selection Strategies Using MCDM Approach: A University Hospital Practice. In Strategic Outlook in Business and Finance Innovation: Multidimensional Policies for Emerging Economies; Hasan Dinçer, H., Yüksel, S., Eds.; Emerald Publishing: Leeds, UK, 2021. [Google Scholar]
- Ezell, B.; Lynch, C.J.; Hester, P.T. Methods for Weighting Decisions to Assist Modelers and Decision Analysts: A Review of Ratio Assignment and Approximate Techniques. Appl. Sci. 2021, 11, 10397. [Google Scholar] [CrossRef]
- Hiebl, M.R.W. Sample Selection in Systematic Literature Reviews of Management Research. Organ. Res. Methods 2023, 26, 229–261. [Google Scholar] [CrossRef]
- Sackett, P.R.; Zhang, C.; Berry, C.M.; Lievens, F. Revisiting Meta-Analytic Estimates of Validity in Personnel Selection: Addressing Systematic Overcorrection for Restriction of Range. J. Appl. Psychol. 2022, 107, 2040–2068. [Google Scholar] [CrossRef]
- Rojon, C.; Okupe, A.; McDowall, A. Utilization and Development of Systematic Reviews in Management Research: What Do We Know and Where Do We Go from Here? Int. J. Manag. Rev. 2021, 23, 191–223. [Google Scholar] [CrossRef]
- Kreshpaj, B.; Orellana, C.; Burström, B.; Davis, L.; Hemmingsson, T.; Johansson, G.; Kjellberg, K.; Jonsson, J.; Wegman, D.H.; Bodin, T. What Is Precarious Employment? A Systematic Review of Definitions and Operationalizations from Quantitative and Qualitative Studies. Scand. J. Work. Environ. Health 2020, 46, 235–247. [Google Scholar] [CrossRef] [PubMed]
- Ajayi, F.A.; Udeh, C.A. Review of Workforce Upskilling Initiatives for Emerging Technologies in It. Int. J. Manag. Entrep. Res. 2024, 6, 1119–1137. [Google Scholar] [CrossRef]
- Ozkan-Ozen, Y.D.; Kazancoglu, Y. Analysing Workforce Development Challenges in the Industry 4.0. Int. J. Manpow. 2021, 43, 310–333. [Google Scholar] [CrossRef]
- Shet, S.V.; Poddar, T.; Wamba Samuel, F.; Dwivedi, Y.K. Examining the Determinants of Successful Adoption of Data Analytics in Human Resource Management—A Framework for Implications. J. Bus. Res. 2021, 131, 311–326. [Google Scholar] [CrossRef]
- Öztürk, F.; Kaya, G. Personnel Selection with Fuzzy VIKOR: An Application in Automotive Supply Industry. Gazi Üniversitesi Fen. Bilim. Derg. Part C Tasarım Teknol. 2020, 8, 94–108. [Google Scholar] [CrossRef]
- Hsu, I.C.; Shih, Y.J.; Pai, F.Y. Applying the Modified Delphi Method and DANP to Determine the Critical Selection Criteria for Local Middle and Top Management in Multinational Enterprises. Mathematics 2020, 8, 1396. [Google Scholar] [CrossRef]
- Karakhan, A.A.; Gambatese, J.; Simmons, D.R. Development of Assessment Tool for Workforce Sustainability. J. Constr. Eng. Manag. 2020, 146, 04020017. [Google Scholar] [CrossRef]
- Newman, M.; Gough, D. Systematic Reviews in Educational Research: Methodology, Perspectives and Application. In Systematic Reviews in Educational Research; Springer Fachmedien Wiesbaden GmbH: Wiesbaden, Germany, 2020; pp. 3–22. [Google Scholar]
- Zawacki-Richter, O.; Kerres, M.; Bedenlier, S.; Bond, M.; Buntins, K. Systematic Reviews in Educational Research. Springer Fachmedien Wiesbaden: Wiesbaden, Germany, 2020; pp. 3–22. [Google Scholar] [CrossRef]
- Karam, S.; Nagahi, M.; Dayarathna (Nick), V.L.; Ma, J.; Jaradat, R.; Hamilton, M. Integrating Systems Thinking Skills with Multi-Criteria Decision-Making Technology to Recruit Employee Candidates. Expert Syst. Appl. 2020, 160, 113585. [Google Scholar] [CrossRef]
- Ajoi, T.A.; Sinatra Gran, S.; Kanyan, A.; Lajim, S.F. An Enhanced Systematic Student Performance Evaluation Based on Fuzzy Logic Approach for Selection of Best Student Award. AJUE 2021, 16, 10. [Google Scholar] [CrossRef]
- Raja, S.; Rajan, A.J.; Gupta, P. A Decision-Making Model for Selection of the Suitable FDM Machine Using Fuzzy TOPSIS. Math. Probl. Eng. 2022, 2022, 1–15. [Google Scholar] [CrossRef]
- Alsanousi, A.T.; Alqahtani, A.Y.; Makki, A.A.; Baghdadi, M.A. A Hybrid MCDM Approach Using the BWM and the TOPSIS for a Financial Performance-Based Evaluation of Saudi Stocks. Information 2024, 15, 258. [Google Scholar] [CrossRef]
- Sahoo, S.K.; Goswami, S.S. A Comprehensive Review of Multiple Criteria Decision-Making (MCDM) Methods: Advancements, Applications, and Future Directions. Decis. Mak. Adv. 2023, 1, 25–48. [Google Scholar] [CrossRef]
- Fan, Y.; Potočnik, K.; Chaudhry, S. A Process-Oriented, Multilevel, Multidimensional Conceptual Framework of Work–Life Balance Support: A Multidisciplinary Systematic Literature Review and Future Research Agenda. Int. J. Manag. Rev. 2021, 23, 486–515. [Google Scholar] [CrossRef]
- Manca, C. Tensions as a Framework for Managing Work in Collaborative Workplaces: A Review of the Empirical Studies. Int. J. Manag. Rev. 2022, 24, 333–351. [Google Scholar] [CrossRef]
- Yuruten, S.Y.; Ozen, C.; Yildirim, F.; Daim, T.; Shaygan, A. Proposing an Application Model for Personnel Recruitment by Using a Multi-Criteria Decision-Making (MCDM) Approach: A Case of Blue-Collar Cashier Personnel Recruitment. In The Routledge Companion to Technology Management; Routledge: London, UK, 2022. [Google Scholar]
- Shrimali, A.K. Interpretive Structural Modeling of Identified Success Factors to Lean Implementation in SMEs. Qual. Prod. Improv. QPI 2019, 1, 69–77. [Google Scholar] [CrossRef]
- Agrawal, N. Modeling Enablers of Knowledge Management Process Using Multi Criteria Decision Making Approach. VINE J. Inf. Knowl. Manag. Syst. 2020, 51, 389–417. [Google Scholar] [CrossRef]
- Bahri, M.S.S.; Shariff, S.S.R.; Yahya, N. Comparative Analysis on Decision Criteria for Port Personnel Using Hybrid Analytical Hierarchy Process (H-AHP). Int. J. Anal. Hierarchy Process 2022, 14, 1–22. [Google Scholar] [CrossRef]
- Mohammadi, N.; Heidary Dahooie, J.; Khajevand, M. A Hybrid Approach for Identifying and Prioritizing Critical Success Factors in Technology Transfer Projects (Case Study: Diesel Locomotive Manufacturing). J. Eng. Des. Technol. 2021, 21, 1389–1413. [Google Scholar] [CrossRef]
- Munier, N.; Hontoria, E. Shortcomings of the AHP Method. In Uses and Limitations of the AHP Method. Management for Professionals; Springer: New York, NY, USA, 2021. [Google Scholar] [CrossRef]
- Nalbant, K.G. A Methodology for Personnel Selection in Business Development: An Interval Type 2-Based Fuzzy DEMATEL-ANP Approach. Heliyon 2024, 10, e23698. [Google Scholar] [CrossRef]
- Biswas, J. Optimizing Decision Accuracy in Supplier Selection: A Mathematical Framework Employing Triangular Fuzzy Logic. Eur. J. Adv. Eng. Technol. 2024, 11, 88–98. [Google Scholar] [CrossRef]
- Wey, W.M.; Wu, K.Y. Using ANP Priorities with Goal Programming in Resource Allocation in Transportation. Math. Comput. Model. 2007, 46, 985–1000. [Google Scholar] [CrossRef]
- Shen, Y.C.; Lin, G.T.R.; Tzeng, G.H. Combined DEMATEL Techniques with Novel MCDM for the Organic Light Emitting Diode Technology Selection. Expert Syst. Appl. 2011, 38, 1468–1481. [Google Scholar] [CrossRef]
- Bui, T.D.; Tsai, F.M.; Tseng, M.L.; Ali, M.H. Identifying Sustainable Solid Waste Management Barriers in Practice Using the Fuzzy Delphi Method. Resour. Conserv. Recycl. 2020, 154, 104625. [Google Scholar] [CrossRef]
- Pourabdollah, A.; Mendel, J.M.; John, R.I. Alpha-Cut Representation Used for Defuzzification in Rule-Based Systems. Fuzzy Sets Syst. 2020, 399, 110–132. [Google Scholar] [CrossRef]
- Murray, T.J.; Pipino, L.L.; Van, G.J.P. A pilot study of fuzzy set modification of Delphi. Hum. Syst. Manag. 1985, 5, 76–80. [Google Scholar] [CrossRef]
- Abdullah, J.B.B. A Fuzzy Delphi Method-Developing High-Performance Leadership Standard For Malaysian School Leaders. J. Educ. Soc. Sci. 2018, 9, 1–10. [Google Scholar]
- Tahriri, F.; Mousavi, M.; Galavi, H.; Sorooshian, S. A Decision-Making Model for Predicting Technology Adoption Success. Processes 2022, 10, 2261. [Google Scholar] [CrossRef]
- Torres Vergara, J.I.; Saucedo Martínez, J.A.; Olivo Lucio, D. Resilient and Sustainable Supply Chain Criteria for Performance Evaluation: Selection and Ranking through Fuzzy Delphi. Benchmarking Int. J. 2023, 31, 799–823. [Google Scholar] [CrossRef]
- Huang, T.Y.; Chen, W.K.; Nalluri, V.; Huynh-Cam, T.T. Evaluating E-Teaching Adoption Criteria for Indian Educational Organizations Using Fuzzy Delphi-TOPSIS Approach. Mathematics 2022, 10, 2175. [Google Scholar] [CrossRef]
- Yao, K.C.; Lai, J.-Y.; Huang, W.T.; Tu, J.-C. Utilize Fuzzy Delphi and Analytic Network Process to Construct Consumer Product Design Evaluation Indicators. Mathematics 2022, 10, 397. [Google Scholar] [CrossRef]
- Ruano, M.; Huang, C.Y.; Nguyen, P.H.; Nguyen, L.A.T.; Le, H.Q.; Tran, L.C. Enhancing Sustainability in Belize’s Ecotourism Sector: A Fuzzy Delphi and Fuzzy DEMATEL Investigation of Key Indicators. Mathematics 2023, 11, 2816. [Google Scholar] [CrossRef]
- Sarfaraz, A.; Karbassi Yazdi, A.; Hanne, T.; Hosseini, R.; Mazhari, M. A Decision Support System for Evaluating Success Factors of Projects in the Oil and Gas Industry. Math. Probl. Eng. 2022, 2022, 1–18. [Google Scholar] [CrossRef]
- Singh, R.; Bhanot, N. An Integrated DEMATEL-MMDE-ISM Based Approach for Analysing the Barriers of IoT Implementation in the Manufacturing Industry. Int. J. Prod. Res. 2020, 58, 2454–2476. [Google Scholar] [CrossRef]
- Guo, X.; Yang, Z.; Sun, J.; Zhang, Y. Impact Pathways of Emerging ITs to Mitigate Supply Chain Vulnerability: A Novel DEMATEL-ISM Approach Based on Grounded Theory. Expert Syst. Appl. 2024, 239, 122398. [Google Scholar] [CrossRef]
- Balamuralitharan, D.S. Enhancing Remanufacturability of Automotive Product Design through Driver Prioritization Using Interpretive Structural Modelling. Int. J. Mech. Eng. 2022, 7, 400–410. [Google Scholar]
- Xu, X.; Zou, P.X.W. Analysis of Factors and Their Hierarchical Relationships Influencing Building Energy Performance Using Interpretive Structural Modelling (ISM) Approach. J. Clean. Prod. 2020, 272, 122650. [Google Scholar] [CrossRef]
- Singh, S.; Gupta, A. An ISM Modeling for Factors Affecting the Purchase of Green Products. J. Model. Manag. 2020, 16, 103–123. [Google Scholar] [CrossRef]
- Yang, Z.; Lin, Y. The Effects of Supply Chain Collaboration on Green Innovation Performance:An Interpretive Structural Modeling Analysis. Sustain. Prod. Consum. 2020, 23, 1–10. [Google Scholar] [CrossRef]
- Marak, Z.R.; Pillai, D. Supply chain finance factors: An interpretive structural modeling approach. Cent. Eur. Manag. J. 2021, 29, 88–111. [Google Scholar] [CrossRef]
- Sandoughi, A.; Yadavar, H.; Raheli, H. Designing a process model for developing the market for organic agricultural products in Iran: Using interpretive structural modeling approach. J. Agric. Econ. Res. 2021, 13, 89–120. [Google Scholar]
- Sindhu, S. Cause-Related Marketing—An Interpretive Structural Model Approach. J. Nonprofit Public Sect. Mark. 2020, 34, 1–27. [Google Scholar] [CrossRef]
- Kumar Jain, V.; Arya, V.; Sharma, P. Social Media and Sustainable Behavior: A Decision Making Framework Using Interpretive Structural Modeling (Ism). J. Content Community Commun. 2021, 14, 68–80. [Google Scholar] [CrossRef]
- Sun, C.; Xu, H.; Jiang, S. Understanding the Risk Factors of BIM Technology Implementation in the Construction Industry: An Interpretive Structural Modeling (ISM) Approach. Eng. Constr. Archit. Manag. 2020, 27, 3289–3308. [Google Scholar] [CrossRef]
- Yenugula, M.; Goswami, S.S.; Kaliappan, S.; Saravanakumar, R.; Alasiry, A.; Marzougui, M.; AlMohimeed, A.; Elaraby, A. Analyzing the Critical Parameters for Implementing Sustainable AI Cloud System in an IT Industry Using AHP-ISM-MICMAC Integrated Hybrid MCDM Model. Mathematics 2023, 11, 3367. [Google Scholar] [CrossRef]
- Yu, V.F.; Bahauddin, A.; Ferdinant, P.F.; Fatmawati, A.; Lin, S.-W. The ISM Method to Analyze the Relationship between Blockchain Adoption Criteria in University: An Indonesian Case. Mathematics 2023, 11, 239. [Google Scholar] [CrossRef]
- Shoar, S.; Chileshe, N. Exploring the Causes of Design Changes in Building Construction Projects: An Interpretive Structural Modeling Approach. Sustainability 2021, 13, 9578. [Google Scholar] [CrossRef]
- Sarikhani, Y.; Shojaei, P.; Rafiee, M.; Delavari, S. Analyzing the Interaction of Main Components of Hidden Curriculum in Medical Education Using Interpretive Structural Modeling Method. BMC Med. Educ. 2020, 20, 176. [Google Scholar] [CrossRef] [PubMed]
- Saaty, T.L.; Takizawa, M. Dependence and Independence: From Linear Hierarchies to Nonlinear Networks. Eur. J. Oper. Res. 1986, 26, 229–237. [Google Scholar] [CrossRef]
- Saaty, T.L. Decision Making with Dependence and Feedback: The Analytic Network Process: The Organization and Prioritization of Complexity; RWS Publications: Pittsburgh, PA, USA, 1996. [Google Scholar]
- Sorourkhah, A.; Edalatpanah, S.A. Considering the Criteria interdependency in the Matrix Approach to Robustness Analysis with Applying Fuzzy ANP. Fuzzy Optim. Model. J. 2021, 2, 22. [Google Scholar] [CrossRef]
- Vajari, S.M.; Asl, I.M.; Hajinabi, K.; Riahi, L. A hybrid SWOT-FANP approach to planning medical equipment replacement. ESSENCE Int. J. Environ. Rehabil. Conserv. 2020, 1, 40–65. [Google Scholar]
- Li, C.; Negnevitsky, M.; Wang, X. Prospective Assessment of Methanol Vehicles in China Using FANP-SWOT Analysis. Transp. Policy 2020, 96, 60–75. [Google Scholar] [CrossRef]
- Mistarihi, M.Z.; Okour, R.A.; Mumani, A.A. An Integration of a QFD Model with Fuzzy-ANP Approach for Determining the Importance Weights for Engineering Characteristics of the Proposed Wheelchair Design. Appl. Soft Comput. 2020, 90, 106136. [Google Scholar] [CrossRef]
- Galankashi, M.R.; Rafiei, F.M.; Ghezelbash, M. Portfolio selection: A fuzzy-ANP approach. Financ. Innov. 2020, 6, 1–34. [Google Scholar]
- Ozdemir, Y.; Ozdemir, S.; Nalbant, K. A Hybrid Methodology for Prioritizing of Store Plan Alternatives Produced with Rule-Based Design. Int. J. Inf. Technol. Decis. Mak. 2021, 20, 1685–1709. [Google Scholar] [CrossRef]
- Kilic, H.; Kabak, Ö. Analysis of relation between human development and competitiveness using fuzzy ANP and DEA. Intell. Fuzzy Tech. Big Data Anal. Decis. Mak. 2020, 1029, 859–866. [Google Scholar]
- Sindhwani, R.; Saddikuti, V.; Vaidya, O.S. Evaluation of Enablers of Supply Chain Resilience and Responsibility in India during Large-Scale Disruptions: An ISM-ANP Approach. Int. J. Oper. Res. 2023, 48, 178–220. [Google Scholar] [CrossRef]
- Sangari, M.S.; Dashtpeyma, M. An Integrated Framework of Supply Chain Resilience Enablers: A Hybrid ISM-FANP Approach. Int. J. Bus. Excell. 2019, 18, 242–268. [Google Scholar] [CrossRef]
- Amrina, E.; Yulianto, A.; Kamil, I. Fuzzy Multi Criteria Approach for Sustainable Maintenance Evaluation in Rubber Industry. Procedia Manuf. 2019, 33, 538–545. [Google Scholar] [CrossRef]
- Chen, W.C.; Lin, P.W.; Deng, W.J. An Integrated Multiple-Criteria Decision-Making Model for New Product Development: The Case of Taiwan Organic Light-Emitting Diode Industry. Processes 2022, 10, 1205. [Google Scholar] [CrossRef]
- Han, Y.; Zhou, R.; Geng, Z.; Bai, J.; Ma, B.; Fan, J. A Novel Data Envelopment Analysis Cross-Model Integrating Interpretative Structural Model and Analytic Hierarchy Process for Energy Efficiency Evaluation and Optimization Modeling: Application to Ethylene Industries. J. Clean. Prod. 2020, 246, 118965. [Google Scholar] [CrossRef]
- Alamdari, A.M.; Jabarzaden, Y.; Adams, B.; Samson, D.; Khanmohammadi, S. An analytic network process model to prioritize supply chain risks in green residential megaprojects. Oper. Manag. Res. 2022, 16, 141–163. [Google Scholar] [CrossRef]
- Lee, A.H.I.; Kang, H.Y. A Three-Phased Fuzzy Logic Multi-Criteria Decision-Making Model for Evaluating Operation Systems for Smart TVs. Appl. Sci. 2023, 13, 7869. [Google Scholar] [CrossRef]
- Iskamto, D.; Yapentra, A.; Ansori, P.B.; Jupri, M. Effect of Working Discipline toward Performance: An Empirical Investigation; KnE Social Sciences: Malang, Indonesia, 2020; pp. 492–501. [Google Scholar] [CrossRef]
- Berlin, C.; Wollter Bergman, M.; Babapour, M.; Falck, A.-C.; Örtengren, R. A Systemic Overview of Factors Affecting the Cognitive Performance of Industrial Manual Assembly Workers. In Proceedings of the 21st Congress of the International Ergonomics Association, Online, 13–18 June 2021; pp. 371–381. [Google Scholar] [CrossRef]
- Kaasinen, E.; Schmalfuß, F.; Özturk, C.; Aromaa, S.; Boubekeur, M.; Heilala, J.; Heikkilä, P.; Kuula, T.; Liinasuo, M.; Mach, S.; et al. Empowering and Engaging Industrial Workers with Operator 4.0 Solutions. Comput. Ind. Eng. 2020, 139, 105678. [Google Scholar] [CrossRef]
- Alam, M.; Gul, F.; Imran, D.M. The Impact of Ethical Leadership & Civility on Organizational Commitment: The Mediating Role of Work Engagement. J. Arts Soc. Sci. 2021, 8, 173–188. [Google Scholar] [CrossRef]
- Gajdzik, B.; Wolniak, R. Smart Production Workers in Terms of Creativity and Innovation: The Implication for Open Innovation. J. Open Innov. Technol. Mark. Complex. 2022, 8, 68. [Google Scholar] [CrossRef]
- Kustiawan, U.; Marpaung, P.; Lestari, U.D.; Andiyana, E. The Effect of Affective Organizational Commitment, Job Satisfaction, and Employee Engagement on Job Happiness and Job Performance on Manufacturing Company in Indonesia. Wseas Trans. Bus. Econ. 2022, 19, 573–591. [Google Scholar] [CrossRef]
- Dutta, T.; Dhir, S. Employee Loyalty: Measurement and Validation. Glob. Bus. Rev. 2021, 19, 097215092199080. [Google Scholar] [CrossRef]
- Lynch, R. Preliminary Evaluation for Lean Implementation in a Small Manufacturing Company. Master’s Thesis, University of Kentucky, Frankfort, KY, USA, 2023. [Google Scholar]
- Bilan, Y.; Mishchuk, H.; Roshchyk, I.; Joshi, O. Hiring and Retaining Skilled Employees in SMEs: Problems in Human Resource Practices and Links with Organizational Success. Bus. Theory Pract. 2020, 21, 780–791. [Google Scholar] [CrossRef]
- Santhanam, N.; Srinivas, S. Modeling the Impact of Employee Engagement and Happiness on Burnout and Turnover Intention among Blue-Collar Workers at a Manufacturing Company. Benchmarking Int. J. 2019, 27, 499–516. [Google Scholar] [CrossRef]
- Anderson, D.M. Design for Manufacturability: How to Use Concurrent Engineering to Rapidly Develop Low-Cost, High-Quality Products for Lean Production, 2nd ed.; Productivity Press: New York, NY, USA, 2020. [Google Scholar] [CrossRef]
- Li, G. The Impact of Supply Chain Relationship Quality on Knowledge Sharing and Innovation Performance: Evidence from Chinese Manufacturing Industry. J. Bus. Ind. Mark. 2020, 36, 834–848. [Google Scholar] [CrossRef]
- Jaeger, B.; Upadhyay, A. Understanding Barriers to Circular Economy: Cases from the Manufacturing Industry. J. Enterp. Inf. Manag. 2020, 33, 729–745. [Google Scholar] [CrossRef]
- Romero, D.; Stahre, J. Towards The Resilient Operator 5.0: The Future of Work in Smart Resilient Manufacturing Systems. Procedia CIRP 2021, 104, 1089–1094. [Google Scholar] [CrossRef]
- Javaid, M.; Haleem, A.; Singh, R.P.; Suman, R.; Gonzalez, E.S. Understanding the Adoption of Industry 4.0 Technologies in Improving Environmental Sustainability. Sustain. Oper. Comput. 2022, 3, 203–217. [Google Scholar] [CrossRef]
- Chwialkowska, A.; Bhatti, W.A.; Glowik, M. The Influence of Cultural Values on Pro-Environmental Behavior. J. Clean. Prod. 2020, 268, 122305. [Google Scholar] [CrossRef]
- Del Giudice, M.; Scuotto, V.; Papa, A.; Tarba, S.Y.; Bresciani, S.; Warkentin, M. A Self-Tuning Model for Smart Manufacturing SMEs: Effects on Digital Innovation. J. Prod. Innov. Manag. 2021, 38, 68–89. [Google Scholar] [CrossRef]
- Sari, D.L.; Storyna, H.; Intan, R.; Sinaga, P.; Gunawan, F.E.; Asrol, M.; Redi, A.A.N.P. The Effect of Job Stress to Employee Performance: Case Study of Manufacturing Industry in Indonesia. IOP Conf. Ser. Earth Environ. Sci. 2021, 794, 012085. [Google Scholar] [CrossRef]
- Fernando, Y.; Wulansari, P. Perceived Understanding of Supply Chain Integration, Communication and Teamwork Competency in the Global Manufacturing Companies. Eur. J. Manag. Bus. Econ. 2020, 30, 191–210. [Google Scholar] [CrossRef]
- Veile, J.W.; Kiel, D.; Müller, J.M.; Voigt, K.I. Lessons Learned from Industry 4.0 Implementation in the German Manufacturing Industry. J. Manuf. Technol. Manag. 2019, 31, 977–997. [Google Scholar] [CrossRef]
- Brussevich, M.; Dabla-Norris, M.E.; Khalid, S. Who Will Bear the Brunt of Lockdown Policies? Evidence from Tele-Workability Measures Across Countries; International Monetary Fund: Washington, DC, USA, 2020. [Google Scholar]
- Marisa, J.; Sitepu, S.A. Relationship Analysis between Production Factors with Business Production of Beef Cattle Livestock in Binjai Barat District, Indonesia. Asian J. Adv. Res. Rep. 2020, 9, 1–7. [Google Scholar] [CrossRef]
- Ngoc, V.T.B.; Thang, N.M.; Du, N.C. The Adaptability of Vietnamese Worker to the Industry 4.0. In Contemporary Economic Issues in Asian Countries: Proceeding of CEIAC 2022; Springer Nature Singapore Books: Singapore, Singapore, 2023; Volume 1, pp. 175–184. [Google Scholar]
- McGunagle, D.; Zizka, L. Employability Skills for 21st-Century STEM Students: The Employers’ Perspective. High. Educ. Ski. Work. -Based Learn. 2020, 10, 591–606. [Google Scholar] [CrossRef]
- Stephen, O.O.; Festus, O.O. Utilization of Work-Based Learning Program to Develop Employability Skill of Workforce (Craftsmen) In Construction Industry Towards Industrial Development. Indones. J. Educ. Res. Technol. 2022, 2, 179–188. [Google Scholar] [CrossRef]
- Chen, W.C.; Lin, Y.F.; Liu, K.P.; Chang, H.P.; Wang, L.Y.; Tai, P.H. A Complete MCDM Model for NPD Performance Assessment in an LED-Based Lighting Plant Factory. Math. Probl. Eng. 2018, 2018, e7049208. [Google Scholar] [CrossRef]
- Kuo, Y.F.; Chen, P.C. Constructing Performance Appraisal Indicators for Mobility of the Service Industries Using Fuzzy Delphi Method. Expert Syst. Appl. 2008, 35, 1930–1939. [Google Scholar] [CrossRef]
- Lee, A.; Wang, W.-M.; Lin, T.-Y. An Evaluation Framework for Technology Transfer of New Equipment in High Technology Industry. Technol. Forecast. Soc. Change 2010, 77, 135–150. [Google Scholar] [CrossRef]
- Dzeng, R.J.; Wen, K.S. Evaluating Project Teaming Strategies for Construction of Taipei 101 Using Resource-Based Theory. Int. J. Proj. Manag. 2005, 23, 483–491. [Google Scholar] [CrossRef]
- Huang, J.J.; Tzeng, G.H.; Ong, C.S. Multidimensional Data in Multidimensional Scaling Using the Analytic Network Process. Pattern Recognit. Lett. 2005, 26, 755–767. [Google Scholar] [CrossRef]
- Saaty, T. Decision Making—The Analytic Hierarchy and Network Processes (AHP/ANP). J. Syst. Syst. Eng. 2004, 13, 1–35. [Google Scholar] [CrossRef]
- Lee, A.; Chen, W.C.; Chang, C.J. A Fuzzy AHP and BSC Approach for Evaluating Performance of IT Department in the Manufacturing Industry in Taiwan. Expert. Syst. Appl. 2008, 34, 96–107. [Google Scholar] [CrossRef]
- Buckley, J.J. Fuzzy Hierarchical Analysis. Fuzzy Sets Syst. 1985, 17, 233–247. [Google Scholar] [CrossRef]
- Saaty, T.L. The Analytic Hierarchy Process: Planning, Priority Setting, Resource Allocation; McGraw-Hill International Book Company: New York, NY, USA, 1980. [Google Scholar]
- Csutora, R.; Buckley, J.J. Fuzzy Hierarchical Analysis: The Lambda-Max Method. Fuzzy Sets Syst. 2001, 120, 181–195. [Google Scholar] [CrossRef]
- Lee, A.; Kang, H.Y.; Wang, W.P. Analysis of Priority Mix Planning for the Fabrication of Semiconductors under Uncertainty. Int. J. Adv. Manuf. Technol. 2006, 28, 351–361. [Google Scholar] [CrossRef]
- Chen, C.T. Extensions of the TOPSIS for Group Decision-Making under Fuzzy Environment. Fuzzy Sets Syst. 2000, 114, 1–9. [Google Scholar] [CrossRef]


| Criteria | Sub-Criteria | References |
|---|---|---|
| C1 Work attitude | S1 Willingness to engage in night shift | [11,96,97,98] |
| S2 Overtime cooperation | [96] | |
| S3 Discipline compliance | [96] | |
| S4 Willingness to engage in shifts | [11,96,97,98,99] | |
| S5 Personal and work morality | [7,96,99] | |
| S6 Patience and calm | [96,100] | |
| S7 Flexible and open to change | [11,96,97,98,100] | |
| S8 Positive | [96,101] | |
| S9 Loyalty | [7,96,102] | |
| S10 Docility | [96,103] | |
| C2 Recruitment difficulty | S11 Recruitment lead time | [7,23,98] |
| S12 Recruitment competitiveness in the industry | [7,98,104] | |
| S13 Turnover rate | [7,20,98,104,105] | |
| S14 Recruitment fee | [7,23,98,104] | |
| C3 Work quality | S15 Finish the job in time | [11,96,100,106] |
| S16 Ensure the quality of work | [11,96,100,106] | |
| S17 Effectively control progress | [11,96,100,106] | |
| S18 Familiarity of relevant knowledge | [7,11,96,107] | |
| S19 Close residence to the company | [7,11,108] | |
| C4 Environmental adaptation and attendance | S20 Maintaining and protecting work area | [96,109] |
| S21 Following healthy and safety procedures | [7,96,97,110] | |
| S22 Language communication | [96,111] | |
| S23 Cultural difference | [96,112] | |
| S24 Regularity of working hours | [96,113] | |
| S25 Punctuality of working hours | [96,114] | |
| S26 Teamwork | [96,115] | |
| C5 Work ability | S27 Operating machinery | [7,14,96,97,98,99] |
| S28 Ability to follow instructions | [7,96,97,116] | |
| S29 Concentration—attention to detail | [7,96,97,117] | |
| S30 Experience | [7,96,118] | |
| S31 Education | [96,119] | |
| S32 Critical thinking | [7,96,120] | |
| S33 Interest and aptitude for technology | [7,14,96,99] | |
| S34 Ability to be cross-trained | [11,14,96,97,100] | |
| S35 Basic math | [96,120] | |
| S36 Basic computer skills | [7,96,121] |
| No | Company | Department | Job Title |
|---|---|---|---|
| 1 | Hsingwu university of science and technology | Applied English | Acting director |
| 2 | Hsingwu university of science and technology | Business Administration | Professor |
| 3 | Hsingwu university of science and technology | Audit office | Director |
| 4 | Wistron Information Technology & Services Corporation | Human resource | Manager |
| 5 | Wistron Information Technology & Services Corporation | Talent Recruitment Department | Director |
| 6 | Hsingwu university of science and technology | Tourism | Dean |
| 7 | International Trust Machines Corporation | Strategy | Advisor |
| 8 | LifeOS Genomics | Administration | Director |
| 9 | GWC Group, Taisil branch | Human Resource | Admin |
| 10 | Wistron Information Technology & Services Corporation | Human Resource | Manager |
| 11 | GWC Group, Sino-German Branch | Human Resource | Director |
| 12 | GWC Group, Sino-German Branch | Human Resource | Manager |
| Criteria/Sub Criteria | Most Possible Range | ||
|---|---|---|---|
| Degree of Importance | Acceptable Maximum Value | Acceptable Minimum Value | |
| Flexible to change | 6 | 7 | 4 |
| Teamwork | 7 | 8 | 5 |
| Experience | 8 | 9 | 6 |
| Critical thinking | 9 | 10 | 8 |
| Boolean Logic | Operator | Operator | Operand |
|---|---|---|---|
| Intersect | AND | + | 0, 1 |
| Union | OR | | | 0, 1 |
| Except | NOT | - | 0, 1 |
| Traditional ANP | Linguistic Variables | Triangular Fuzzy Number | Triangular Fuzzy Number Reciprocal Value |
|---|---|---|---|
| 1 | Equally important | (1, 1, 2) | (1/2, 1, 1) |
| 2 | ~ | (1, 2, 3) | (1/3, 1/2, 1) |
| 3 | Slightly important | (2, 3, 4) | (1/4, 1/3, 1/2) |
| 4 | ~ | (3, 4, 5) | (1/5, 1/4, 1/3) |
| 5 | Important | (4, 5, 6) | (1/6, 1/5, 1/4) |
| 6 | ~ | (5, 6, 7) | (1/7, 1/6, 1/5) |
| 7 | More important | (6, 7, 8) | (1/8, 1/7, 1/6) |
| 8 | ~ | (7, 8, 9) | (1/9, 1/8, 1/7) |
| 9 | Very important | (8, 9, 9) | (1/9, 1/9, 1/8) |
| n | 1 | 2 | 3 | 4 | 5 | 6 | 7 | 8 | 9 | 10 |
| R.I. | 0 | 0 | 0.52 | 0.89 | 1.11 | 1.25 | 1.35 | 1.40 | 1.45 | 1.49 |
| Criteria | Sub Criteria | ||||
|---|---|---|---|---|---|
| Work attitude | Positive (S8) | 6.333 | 9.417 | 7.875 | 0.000 |
| Work quality | Effectively control progress (S17) | 6.583 | 9.417 | 8 | 0.000 |
| Criteria/Sub-Criteria | G | ||||||
|---|---|---|---|---|---|---|---|
| Work attitude (C1) | 5 | 2.757 | 10 | 8 | 9.75 | 10 | 10.393 |
| Recruitment difficulty (C2) | 2 | 2.933 | 7 | 4 | 7.583 | 10 | 6.522 |
| Work quality (C3) | 4 | 2.088 | 8 | 7 | 8.833 | 10 | 7.050 |
| Work ability (C5) | 4 | 2.558 | 8 | 7 | 9.166 | 10 | 6.622 |
| Willingness to engage in night shift (S1) | 1 | 4.000 | 7 | 3 | 7.333 | 10 | NO |
| Overtime cooperation (S2) | 3 | 5.583 | 7 | 3 | 8.583 | 10 | NO |
| Discipline compliance (S3) | 5 | 7.000 | 10 | 9 | 9.750 | 10 | 9.200 |
| Willingness to engage in shifts (S4) | 1 | 5.333 | 7 | 3 | 8.083 | 10 | NO |
| Personal and work morality (S5) | 5 | 6.667 | 9 | 8 | 9.500 | 10 | 8.391 |
| Patience and calm (S6) | 4 | 6.083 | 8 | 7 | 8.833 | 10 | 7.489 |
| Flexible and open to change (S7) | 3 | 6.000 | 8 | 7 | 8.917 | 10 | 7.489 |
| Loyalty (S9) | 5 | 6.417 | 8 | 7 | 9.250 | 10 | 7.587 |
| Docility (S10) | 3 | 6.000 | 10 | 6 | 8.833 | 10 | NO |
| Recruitment lead time (S11) | 3 | 5.250 | 7 | 5 | 7.917 | 10 | NO |
| Recruitment competitiveness in the industry (S12) | 1 | 5.250 | 7 | 1 | 7.833 | 10 | NO |
| Turnover rate (S13) | 1 | 5.250 | 7 | 1 | 8.083 | 10 | NO |
| Recruitment fee (S14) | 1 | 5.250 | 7 | 1 | 7.417 | 10 | NO |
| Finish job in time (S15) | 5 | 6.583 | 8 | 7 | 9.250 | 10 | 7.614 |
| Ensure the quality of work (S16) | 5 | 6.667 | 9 | 8 | 9.333 | 10 | 8.364 |
| Effectively control progress (S17) | 4 | 6.583 | 8 | 8 | 9.417 | 10 | 8 |
| Familiarity of relevant knowledge (S18) | 3 | 6.500 | 10 | 8 | 9.250 | 10 | 8.526 |
| Close residence to the company (S19) | 1 | 4.333 | 7 | 1 | 7.000 | 10 | NO |
| Maintaining and protecting work area (S20) | 3 | 9.455 | 8 | 3 | 8.167 | 10 | NO |
| Following healthy and safety procedures (S21) | 4 | 6.250 | 8 | 5 | 8.500 | 10 | 7.361 |
| Language communication (S22) | 3 | 5.583 | 8 | 3 | 8.083 | 10 | 7.125 |
| Cultural difference (S23) | 1 | 4.833 | 7 | 1 | 7.750 | 10 | NO |
| Regularity of working hours (S24) | 3 | 6.000 | 8 | 6 | 8.833 | 10 | 7.346 |
| Punctuality of working hours (S25) | 5 | 6.583 | 8 | 6 | 9.000 | 7.358 | |
| Teamwork (S26) | 5 | 6.750 | 9 | 5 | 9.333 | 10 | NO |
| Operating machinery (S27) | 1 | 5.167 | 7 | 5 | 8.417 | 10 | 6.302 |
| Ability to follow instructions (S28) | 4 | 6.167 | 8 | 6 | 8.750 | 10 | 7.200 |
| Concentration—attention to detail (S29) | 4 | 6.083 | 8 | 6 | 8.750 | 10 | 7.179 |
| Experience (S30) | 2 | 5.000 | 7 | 5 | 8.083 | 10 | 6.213 |
| Education (S31) | 2 | 5.083 | 10 | 5 | 7.917 | 10 | NO |
| Critical thinking (S32) | 4 | 5.667 | 8 | 7 | 8.750 | 10 | 7.429 |
| Interest and aptitude for technology (S33) | 4 | 5.833 | 10 | 6 | 8.417 | 10 | NO |
| Ability to be cross-trained (S34) | 5 | 6.083 | 10 | 6 | 9.000 | 10 | NO |
| Basic math (S35) | 1 | 4.333 | 7 | 1 | 7.333 | 10 | NO |
| Basic computer skills (S36) | 3 | 5.000 | 8 | 5 | 8.083 | 10 | 6.521 |
| S1 | S2 | S3 | S4 | S5 | S6 | S7 | S8 | S9 | S10 | S11 | S12 | S13 | |
|---|---|---|---|---|---|---|---|---|---|---|---|---|---|
| S1 | 1 | 1 | 1 | 1 | 1 | 0 | 1 | 1 | 0 | 0 | 1 | 1 | 1 |
| S2 | 1 | 1 | 1 | 1 | 0 | 0 | 1 | 1 | 0 | 0 | 1 | 1 | 1 |
| S3 | 1 | 1 | 1 | 1 | 1 | 0 | 0 | 0 | 0 | 0 | 1 | 1 | 1 |
| S4 | 1 | 1 | 1 | 1 | 1 | 0 | 0 | 0 | 0 | 0 | 1 | 1 | 1 |
| S5 | 1 | 1 | 1 | 1 | 1 | 0 | 0 | 0 | 0 | 0 | 1 | 1 | 1 |
| S6 | 0 | 0 | 1 | 1 | 1 | 1 | 0 | 0 | 0 | 0 | 0 | 0 | 1 |
| S7 | 1 | 1 | 1 | 1 | 1 | 0 | 1 | 0 | 0 | 0 | 1 | 1 | 1 |
| S8 | 1 | 1 | 1 | 1 | 1 | 0 | 0 | 1 | 0 | 1 | 1 | 1 | 1 |
| S9 | 0 | 0 | 1 | 1 | 1 | 1 | 0 | 0 | 1 | 0 | 0 | 0 | 1 |
| S10 | 0 | 0 | 1 | 1 | 1 | 0 | 0 | 1 | 0 | 1 | 0 | 0 | 1 |
| S11 | 1 | 1 | 1 | 1 | 1 | 0 | 1 | 1 | 0 | 0 | 1 | 1 | 1 |
| S12 | 1 | 1 | 1 | 1 | 0 | 0 | 1 | 1 | 0 | 0 | 1 | 1 | 1 |
| S13 | 1 | 1 | 1 | 1 | 1 | 0 | 0 | 0 | 0 | 0 | 1 | 1 | 1 |
| Recruiting Workforce | C1 | C2 | C3 | C4 |
|---|---|---|---|---|
| C1 | 1 | 1/4 | 1/3 | 1/2 |
| C2 | 4 | 1 | 1/4 | 1/3 |
| C3 | 3 | 4 | 1 | 3 |
| C4 | 1/2 | 3 | 1/3 | 1 |
| Recruiting Workforce | C1 | C2 | C3 | C4 |
|---|---|---|---|---|
| C1 | (1·1·1) | (2.285·3.333·4.333) | (1·1.600·2.500) | (1.600·2.625·3.625) |
| C2 | (0.250·0.333·0.428) | (1·1·1) | (1.400·2·2.889) | (1·1.444·2) |
| C3 | (0.400·0.625·1) | (0.333·0.500·0.714) | (1·1·1) | (1.111·1.666·1.500) |
| C4 | (0.285·0.375·0.625) | (0.500 0.666 1) | (0.400·0.600·1) | (1·1·1) |
| Recruiting Workforce | C1 | C2 | C3 | C4 |
|---|---|---|---|---|
| C1 | 1.000 | 3.300 | 1.685 | 2.614 |
| C2 | 0.324 | 1.000 | 2.076 | 1.481 |
| C3 | 0.678 | 0.526 | 1.000 | 1.757 |
| C4 | 0.429 | 0.731 | 0.637 | 1.000 |
| Recruiting Workforce | C1 | C2 | C3 | C4 | Weights |
|---|---|---|---|---|---|
| C1 | 1.000 | 3.300 | 1.685 | 2.614 | 0.433 |
| C2 | 0.324 | 1.000 | 2.076 | 1.481 | 0.222 |
| C3 | 0.678 | 0.526 | 1.000 | 1.757 | 0.197 |
| C4 | 0.429 | 0.731 | 0.637 | 1.000 | 0.148 |
| Criteria | Sub-Criteria | ||||
|---|---|---|---|---|---|
| Criteria | Weight | Criteria Ranking | Sub-Criteria Independent Weight | Weight | Sub-Criteria Ranking |
| C1 Work attitude | 1 | S1 Discipline compliance | 0.227 | 1 | |
| S2 Personal and work morality | 0.129 | 4 | |||
| S3 Positive | 0.139 | 2 | |||
| C2 Work quality | 4 | S4 Finish the job in time | 0.006 | 13 | |
| S5 Ensure the quality of work | 0.028 | 10 | |||
| S6 Effectively control progress | 0.023 | 11 | |||
| S7 Familiar with relevant knowledge | 0.014 | 12 | |||
| C3 Environmental adaption and attendance | 2 | S8 Following healthy and safety procedures | 0.137 | 3 | |
| S9 Regularity of working hours | 0.064 | 6 | |||
| S10 Punctuality of working hours | 0.037 | 8 | |||
| C4 Work ability | 3 | S11 Ability to follow instructions | 0.110 | 5 | |
| S12 Concentration—attention to detail | 0.048 | 7 | |||
| S13 Critical Thinking | 0.032 | 9 | |||
| Criteria | Sub Criteria |
|---|---|
| Work attitude (C1) | Discipline compliance (S1) Personal and work morality (S2) Positive (S3) |
| Work quality (C2) | Finish the job in time (S4) Ensure the quality of work (S5) Effectively control progress (S6) Familiarity of relevant knowledge (S7) |
| Environmental adaptation and attendance (C3) | Following healthy and safety procedures (S8) Regularity of working hours (S9) Punctuality of working hours (S10) |
| Work ability (C4) | Ability to follow instructions (S11) Concentration—attention to detail (S12) Critical thinking (S13) |
| Criteria | Criteria Ranking |
|---|---|
| C1 Work attitude | 1 |
| C3 Environmental adaption and attendance | 2 |
| C4 Work ability | 3 |
| C2 Work quality | 4 |
| Sub-Criteria | Sub-Criteria Ranking |
|---|---|
| S1 Discipline compliance | 1 |
| S3 Positive | 2 |
| S8 Following healthy and safety procedures | 3 |
| S2 Personal and work morality | 4 |
| S11 Ability to follow instructions | 5 |
| S9 Regularity of working hours | 6 |
| S12 Concentration—attention to detail | 7 |
| S10 Punctuality of working hours | 8 |
| S13 Critical Thinking | 9 |
| S5 Ensure the quality of work | 10 |
| S6 Effectively control progress | 11 |
| S7 Familiar with relevant knowledge | 12 |
| S4 Finish the job in time | 13 |
Disclaimer/Publisher’s Note: The statements, opinions and data contained in all publications are solely those of the individual author(s) and contributor(s) and not of MDPI and/or the editor(s). MDPI and/or the editor(s) disclaim responsibility for any injury to people or property resulting from any ideas, methods, instructions or products referred to in the content. |
© 2024 by the authors. Licensee MDPI, Basel, Switzerland. This article is an open access article distributed under the terms and conditions of the Creative Commons Attribution (CC BY) license (https://creativecommons.org/licenses/by/4.0/).
Share and Cite
Chen, W.-C.; Ngo, A.-X.; Chang, H.-P. Enhancing Decision-Making Processes in the Complex Landscape of the Taiwanese Electronics Manufacturing Industry through a Fuzzy MCDM Approach. Mathematics 2024, 12, 2094. https://doi.org/10.3390/math12132094
Chen W-C, Ngo A-X, Chang H-P. Enhancing Decision-Making Processes in the Complex Landscape of the Taiwanese Electronics Manufacturing Industry through a Fuzzy MCDM Approach. Mathematics. 2024; 12(13):2094. https://doi.org/10.3390/math12132094
Chicago/Turabian StyleChen, Wen-Chin, An-Xuan Ngo, and Hui-Pin Chang. 2024. "Enhancing Decision-Making Processes in the Complex Landscape of the Taiwanese Electronics Manufacturing Industry through a Fuzzy MCDM Approach" Mathematics 12, no. 13: 2094. https://doi.org/10.3390/math12132094
APA StyleChen, W.-C., Ngo, A.-X., & Chang, H.-P. (2024). Enhancing Decision-Making Processes in the Complex Landscape of the Taiwanese Electronics Manufacturing Industry through a Fuzzy MCDM Approach. Mathematics, 12(13), 2094. https://doi.org/10.3390/math12132094