Abstract
Urban transportation systems in tourism-centric cities face challenges from rapid urbanization and population growth. Efficient, resilient, and sustainable bus route optimization is essential to ensure reliable service, minimize environmental impact, and maintain safety standards. This study presents a novel Hybrid Reinforcement Learning-Variable Neighborhood Strategy Adaptive Search (H-RL-VaNSAS) algorithm for multi-objective urban bus route optimization. Our mathematical model maximizes resilience, sustainability, tourist satisfaction, and accessibility while minimizing total travel distance. H-RL-VaNSAS is evaluated against leading optimization methods, including the Crested Porcupine Optimizer (CPO), Krill Herd Algorithm (KHA), and Salp Swarm Algorithm (SSA). Using metrics such as Hypervolume and the Average Ratio of Pareto Optimal Solutions, H-RL-VaNSAS demonstrates superior performance. Specifically, H-RL-VaNSAS achieved the highest resilience index (550), sustainability index (370), safety score (480), tourist preferences score (300), and accessibility score (2300), while minimizing total travel distance to 950 km. Compared to other methods, H-RL-VaNSAS improved resilience by 12.24–17.02%, sustainability by 5.71–12.12%, safety by 4.35–9.09%, tourist preferences by 7.14–13.21%, accessibility by 4.55–9.52%, and reduced travel distance by 9.52–17.39%. This research offers a framework for designing efficient, resilient, and sustainable public transit systems that align with urban planning and transportation goals. The integration of reinforcement learning with VaNSAS significantly enhances optimization capabilities, providing a valuable tool for mathematical and urban transportation research communities.
Keywords:
urban transportation; multi-objective optimization; resilience; sustainability; hybrid metaheuristic algorithm MSC:
90-08
1. Introduction
Urban transportation systems are facing significant challenges due to rapid urbanization, increasing population densities, and growing concerns over environmental sustainability and public safety. Efficient bus route design is essential for mitigating these issues, as it directly impacts traffic congestion, pollution levels, and overall urban quality of life. For example, in January 2024, Canada’s urban transit networks provided approximately 127.1 million rides, showing an 11.9% increase from the previous year. Despite this growth, ridership remained 21% below pre-pandemic levels, highlighting ongoing challenges in urban transit systems (The Daily—Urban Public Transit, January 2024, 2024).
The primary motivation behind this study is to address these urban transportation challenges while promoting tourism. In Thailand's tourism-focused areas like Ubon Ratchathani Province, well-designed bus routes can significantly enhance tourist experiences by providing reliable and safe transportation to key attractions. Public transportation not only supports local economies by facilitating tourist movements but also helps reduce environmental impact and traffic congestion. Efficient routing of buses to major tourist sites such as Tung Sri Muang Temple and Ubon Ratchathani National Museum can significantly improve accessibility and tourist satisfaction.
Furthermore, integrating resilience and sustainability into transportation planning is vital. Urban transportation systems must be robust enough to handle disruptions and adaptable to changes in tourist demand. Recent research underscores the importance of incorporating resilience into transportation systems to maintain service levels during disruptions, such as natural disasters or infrastructure failures [1]. Ensuring the resilience, sustainability, and safety of these tourist attractions through improved transportation planning is essential for fostering sustainable tourism development.
This research aims to bridge these gaps by developing a comprehensive bus route design model that integrates resilience, sustainability, and safety with a focus on promoting tourism. The proposed model not only optimizes bus routes but also incorporates metaheuristic approaches to effectively address complex urban transportation challenges.
Several studies have addressed various aspects of bus transportation. For instance, Guo et al. developed a multi-commodity network flow model to optimize customized bus (CB) routes, timetables, and passenger-to-station assignments, demonstrating effectiveness in different scenarios [2]. Similarly, Luo and Nie examined integrating fixed-route bus services with bike-sharing systems to enhance flexibility and reduce overall costs in low-demand density areas [3]. Shen et al. proposed a real-time customized bus route design model, which improved passenger service and attendance rates in Tianjin, China [4]. Chen et al. introduced a multi-trip, multi-pickup, and delivery problem for customized bus routes, optimizing operating costs and passenger profits, showing CBs as cost-effective alternatives to private cars in metropolitan areas [5]. Gong et al. explored a transfer-based CB network with modular vehicles, optimizing passenger-route assignments and transfers to achieve cost-effective and high-quality operations [6].
Despite these advancements, several gaps remain. Previous studies often focused on minimizing service access and route costs without considering the resilience and safety of tourist attractions [2]. Integrating bike-sharing with bus services lacked broader aspects of resilience and sustainability [3]. Real-time customization and multi-trip optimization models did not incorporate safety measures or resilience planning for tourist attractions [4,5]. Passenger-route assignments and modular vehicle optimization overlooked the integration of safety and sustainability within the network design [6].
To address these multifaceted challenges, this research proposes a novel hybrid method combining reinforcement learning and artificial multiple intelligence systems for optimizing urban bus routes. The proposed model aims to enhance the resilience, sustainability, and safety of bus routes, thereby promoting tourism by ensuring reliable and efficient transportation to tourist attractions.
S M et al. [7] demonstrated the use of neural networks to solve complex problems such as Fractional Differential Equations (FDEs). Similarly, S M et al. [8] developed a hybrid metaheuristic algorithm that effectively explores search spaces to reach near-optimal solutions. Drawing on these advancements, our research integrates reinforcement learning, a type of machine learning, with artificial multiple intelligence systems. This hybrid approach is well-suited to tackle the complex optimization problems associated with designing resilient, sustainable, and safe urban bus routes.
The novelty of this research lies in its holistic approach to bus route design, combining multiple critical factors traditionally addressed in isolation. By integrating resilience, sustainability, and safety into a single model, this study aims to provide a more robust and user-friendly public transportation solution that enhances the tourist experience. Additionally, the use of metaheuristic techniques will enhance the model’s capability to solve large-scale, real-world problems efficiently, setting a new standard for future research and practice in urban transportation planning. This comprehensive approach addresses limitations identified in previous studies and contributes to the broader field of urban transportation by offering a more integrated and practical solution to contemporary challenges, particularly in tourism-focused regions.
This comprehensive approach not only addresses limitations identified in previous studies but also contributes to the broader field of urban transportation by offering a more integrated and practical solution to contemporary challenges, particularly in tourism-focused regions.
2. Literature Review
2.1. Urban Bus Route Design and Challenges
Urban bus route design aims to enhance the efficiency and quality of public transportation, with key principles focused on optimizing service quality, accessibility, and operational efficiency. Liu et al. discuss a model for variable-route bus services in China, emphasizing flexibility and cost reduction to improve urban public transit [9]. Similarly, setting optimal headways on bus routes is crucial for scheduling, considering factors like passenger demand elasticity and travel time variability to minimize waiting times and attract more riders, promoting sustainable public transport as highlighted by Chen et al. [10].
Urban transportation planning faces challenges such as congestion, pollution, and the need for efficient and reliable transit services. Determining optimal bus routes to avoid line concentration and ensure a balanced network distribution is crucial, as noted by Davoodi and Tabatabaie [11]. Integrating street infrastructure with bus service strategies requires long-term planning and commitment, aligning with urban growth and evolving transportation needs, as emphasized by De Dios Ortúzar and Willumsen [12].
Various methodologies have been developed to tackle the complexities of bus route design. Khakbaz et al. present a methodology that identifies key factors affecting urban bus network design, developing a model for efficient bus routes, specifically targeting park-and-ride systems [13]. Singh et al. discuss the application of design principles to specific projects, such as the Woodhaven Boulevard Select Bus Service in Queens, New York, which aims to improve transit service while enhancing the urban environment [14].
These studies collectively contribute to a deeper understanding and development of effective urban bus route designs, addressing both theoretical and practical aspects to meet the challenges of modern urban transportation planning.
2.2. Integrating Resilience, Sustainability, and Safety in Transportation
Integrating resilience, sustainability, and safety into urban transportation is critical for creating robust and efficient transit systems. Resilience involves the ability to maintain or quickly restore service levels following disruptions, such as natural disasters or infrastructure failures. Xu et al. discussed proactive resilience building through route diversity, focusing on the Beijing subway system and how alternative routes can minimize extra time costs for travelers during network disruptions [15]. Porto et al. emphasized the importance of integrating resilience, sustainability, and safety in urban transportation projects, guiding investments in transport infrastructure to enhance both sustainability and urban resilience at a city scale [16].
Incorporating these aspects into bus route design involves various strategies and measures. Azolin and Silva evaluated resilience in urban mobility through public transportation during fuel supply restrictions, highlighting significant resilience gains provided by minimal public transportation functioning [17]. Additionally, Koc et al. introduced the Comprehensive Resilience Assessment Framework for Transportation Systems in Urban Areas (CRAFT), which addresses research gaps in analyzing transportation disruptions and incorporates resilience insights at multiple levels, demonstrated through a case study in the Greater Los Angeles Area [18].
Case studies from previous research provide valuable insights into effective strategies for enhancing transportation resilience. Kim et al. discuss the integration of resilience into transportation systems through case studies of various disasters, offering key experiences and lessons for transportation agencies to improve their response and recovery capabilities [19]. Furthermore, Leobons et al. proposed a resilience measure for transportation systems, emphasizing the importance of reducing impacts on passenger and freight movement in cities after disruptive events [20].
These studies collectively highlight the importance of integrating resilience, sustainability, and safety into urban transportation planning and bus route design. Integrating resilience ensures that transportation systems can withstand and quickly recover from disruptions such as natural disasters, accidents, or infrastructure failures, thereby maintaining continuity and reliability. Incorporating sustainability practices reduces environmental impacts, promoting eco-friendly transit solutions that contribute to long-term urban health and livability. Emphasizing safety in design and planning reduces the risk of accidents and enhances the overall security of passengers, making the transportation system more reliable and trustworthy. Together, these elements create a robust, efficient, and adaptable urban transit system capable of meeting current and future challenges.
2.3. Customized Bus Services and Passenger Assignment Problems
Customized bus (CB) services provide flexible and tailored transit options that cater to specific passenger needs, improving overall service quality and efficiency. The benefits of CB services include enhanced passenger convenience, reduced travel times, and optimized route management.
Optimized route management refers to the strategic planning and execution of bus routes to maximize efficiency and service quality. This involves using algorithms and data analysis to determine the most efficient paths for buses to take, considering factors such as traffic conditions, passenger demand, and operational constraints. By optimizing routes, CB services can minimize travel distances and times, reduce fuel consumption, and ensure timely arrivals and departures, thus improving the overall reliability and performance of the transit system. Tong et al. discussed the development of a joint optimization model for CB services, addressing challenges such as maintaining minimum loading rates, increasing customer numbers per bus, and optimizing bus routing and timetabling plans to satisfy user constraints [21].
A comprehensive review of studies focusing on CB services reveals various approaches to enhancing service efficiency. For instance, switching from headway-based services to timetable-based services during rush hours can significantly reduce passenger waiting times and transportation costs [22]. Moreover, Hakim and Astuti emphasize the importance of improving service quality based on passenger preferences, such as security and employee friendliness, which are critical for the success of CB services [2].
Passenger-to-bus station assignment problems play a crucial role in the efficiency of CB services. Improper assignment can lead to increased waiting times and suboptimal bus utilization. Addressing these issues involves developing models that optimize passenger assignment to bus stations based on factors such as travel demand and route efficiency. Studies have shown that optimizing these assignments can lead to significant improvements in service efficiency, reducing both operational costs and passenger inconveniences.
These insights into CB services and passenger assignment problems highlight the potential for customized transit solutions to revolutionize urban transportation, making it more responsive to passenger needs and operationally efficient.
2.4. Metaheuristic Approaches in Transportation Planning
Metaheuristic techniques, such as genetic algorithms (GA) and particle swarm optimization (PSO), have become prominent tools in transportation planning due to their efficiency in solving complex optimization problems. These techniques are particularly valuable in handling the dynamic and stochastic nature of transportation systems.
Zhen et al. [23] optimize e-commerce logistics scheduling using dedicated and crowdsourced fleets, addressing a close-open mixed multi-depot vehicle routing problem (VRP) variant with two vehicle and task types. They use mixed integer programming (MIP) models and column generation (CG) techniques to manage computational complexity and refine solutions. The logistics platform prioritizes internal tasks for the parent company and handles external tasks for other businesses, aiming to minimize total travel costs minus external task benefits. Key features include multiple depots, different vehicle types, and varying task types, with dedicated vehicles following classical VRP constraints and occasional vehicles following open VRP constraints. Their methods demonstrated significant cost savings and provided managerial insights, advancing e-commerce logistics with optimized scheduling for heterogeneous delivery tasks.
The application of metaheuristics in optimizing transportation problems spans various domains. Guo et al. [24] highlight the effectiveness of a hybrid metaheuristic approach combining tabu search and variable neighborhood search in time-dependent urban customized bus routing. This approach demonstrates significant improvements in route flexibility and service efficiency [24]. Similarly, Ghasedi et al. [25] compared GA and PSO in optimizing bus stop placement based on dynamic demand, showing that these techniques can substantially enhance the operational efficiency of bus transit systems in developing countries [25].
A comparative analysis of different metaheuristic approaches in bus route optimization reveals the strengths and weaknesses of each method. For instance, Ji-yang et al. [26] discussed the use of heuristic algorithms to optimize bus routes for multitarget stations, focusing on minimizing vehicle running times and passenger travel times. This approach proves effective in improving overall service efficiency in public city transportation systems [26]. Rajak et al. [27] explored the use of ant colony optimization (ACO) and simulated annealing (SA) for solving multi-objective vehicle routing problems, with ACO outperforming SA in optimizing total distance and workload balance [27].
The versatility of metaheuristics is further demonstrated in studies like that of Khoo et al. [28], who apply a bi-objective optimization approach using GA for exclusive bus lane selection and scheduling design. This study showcases the practical applications and effectiveness of metaheuristic techniques in enhancing bus route optimization [28]. Additionally, Teng et al. [29] illustrated the feasibility of using GA in bus coordination dispatching models for passenger corridors, highlighting its impact on improving service coordination and efficiency [29].
Overall, the integration of metaheuristic techniques in transportation planning offers promising solutions for optimizing complex transportation problems, improving service efficiency, and addressing dynamic operational challenges.
2.5. Promoting Tourism through Public Transportation
Public transportation plays a vital role in enhancing tourism by providing essential mobility services that enable tourists to explore destinations conveniently and efficiently. A well-designed transportation system significantly contributes to tourist satisfaction and positively impacts the local economy. Fónai Kende and Sipos [30] illustrated how public transportation in Budapest enhances the tourist experience, influencing their overall perception of the city and suggesting future improvements in transportation planning to further integrate tourism [30]. Similarly, Kovalenko-Marchenkova et al. [31] emphasized the competitiveness of rail transport in tourism, highlighting its advantages in terms of comfort and efficiency, which are critical factors for tourist satisfaction [31].
The integration of public transportation and tourism planning can lead to significant economic benefits for local communities. Cuesta [32] discussed the crucial role of public transportation in facilitating tourist movements, thereby boosting local economies through increased tourist spending and enhanced service accessibility [32]. In Melaka, Malaysia, a well-designed multimodal transportation network supports tourism activities and contributes to economic growth, as noted by Jais and Marzuki [33].
Successful case studies demonstrate the positive outcomes of integrating tourism and transportation planning. For instance, the Tatra Electric Railways and Kysuce-Orava Forest Railway in Slovakia serve as prime examples of how well-coordinated transportation systems can enhance tourism satisfaction and local economic benefits [34]. In India, Indian Railways has promoted tourism by offering unique rail tours that provide scenic views, enhancing tourist accessibility and attracting visitors [35].
Overall, these studies highlight the importance of public transportation in promoting tourism, enhancing tourist satisfaction, and supporting local economies through well-designed and efficiently managed transportation systems.
3. Research Methodology
3.1. Mathematical Model Formulation
In this section, we present the mathematical model formulation for designing resilient, sustainable, and safe urban bus routes to promote tourism. The model incorporates multiple objective functions and constraints to achieve its goals, ensuring the efficiency and practicality of the bus route design.
Index:
| Index of attraction lies from 1 to I when I is maximum number of attractions in the case study area | |
| Index of bus routes lies from 1 to B |
Decision Variables:
| Binary variable, 1 if bus route k travels from stop i to stop j, 0 otherwise. | |
| Binary variable, 1 if stop j is selected as part of the bus route, 0 otherwise. | |
| Binary variable, 1 if bus route k is used, 0 otherwise. | |
| Continuous variable representing the travel time from stop i to stop j. | |
| Continuous variable representing the distance from stop i to stop j. | |
| Continuous variable used for sub-tour elimination. |
Parameters:
| Resilience index of stop j. | |
| Sustainability index of stop j. | |
| Tourist preference rating of stop j. | |
| Tourist demand at stop j. | |
| Maximum allowed travel time per bus round (120 min). | |
| Total number of available bus routes | |
| Fuel consumption factor between stop i and stop j due to road condition per unit of distances | |
| Fuel limit for bus route k | |
| Capacity of bus (less than 60 passengers). | |
| Service level of the bus service system | |
| Set of all bus stops including the depot. | |
| Index of the depot. |
Objective Functions:
- (1)
- Maximize Resilience Index:
- (2)
- Maximize Sustainability Index:
- (3)
- Maximize Tourist Preferences:
- (4)
- Maximize Accessibility:
- (5)
- Minimize Total Travel Distance:
Constraints:
Flow Conservation:
Bus Usage:
Travel Time Limit:
Bus Capacity:
Bus Route Selection:
Fuel Consumption:
Ensure at Least One Stop is Included:
Maximum Passenger Capacity at All Times:
Non-Negative and Binary Constraints:
Sub-Tour Elimination:
The mathematical model formulation for resilient, sustainable, and safe urban bus route design to promote tourism incorporates multiple objective functions and constraints to achieve its goals. The objective functions (Equations (1)–(5)) serve distinct purposes. The first objective function aims to maximize the resilience index of the bus route by selecting stops that exhibit higher resilience ratings, ensuring the route’s robustness and ability to handle disruptions effectively. The second objective function focuses on maximizing the sustainability index by including stops that are environmentally and socially sustainable, contributing to the overall sustainability of the bus route. The third objective function seeks to maximize tourist preferences by selecting stops with higher tourist ratings, enhancing the attractiveness of the route and improving tourist satisfaction. The fourth objective function aims to maximize accessibility by targeting stops with higher tourist demand, ensuring the route caters to areas with more tourists and improving convenience. Finally, the fifth objective function strives to minimize the total travel distance of the bus route, optimize fuel consumption, reduce operational costs, and enhance the efficiency of the bus service.
The model includes several constraints to ensure the feasibility and practicality of the bus route design. The flow conservation constraints (Equation (6)) ensure that the number of buses arriving at a stop equals the number of buses departing from that stop, maintaining continuity in the route. The bus usage constraint (Equation (7)) limits the total number of buses used to the available fleet size, ensuring that the solution does not exceed the number of buses in operation. The travel time limit constraint (Equation (8)) restricts the total travel time for each bus route to a maximum allowable limit, ensuring that buses do not exceed the permissible operational time. The bus capacity constraint (Equation (9)) ensures that the total tourist demand at selected stops does not exceed the capacity of the bus, maintaining compliance with bus capacity limits.
Additional constraints further refine the model. The bus route selection constraint (Equation (10)) ensures that a bus can only travel to a stop if it is included in the route, maintaining consistency in the route design. The fuel consumption constraint (Equation (11)) ensures that the fuel consumption of each bus stays within its fuel limit, accounting for the variable fuel consumption factors due to road conditions. The inclusion constraint (Equation (12)) mandates that at least one stop is included in the bus route, ensuring the route has a valid set of stops. The maximum passenger capacity constraint (Equation (13)) requires that the total capacity of all buses used meets or exceeds the total tourist demand at the selected stops, ensuring adequate service levels. Non-negativity and binary constraints (Equation (14)) define the nature of the decision variables, ensuring they take appropriate values. Finally, the sub-tour elimination constraints (Equations (15) and (16)) prevent the formation of sub-tours by ensuring that buses return to the depot without forming independent loops. This comprehensive set of objective functions and constraints collectively aims to design an optimal bus route that is resilient, sustainable, tourist-friendly, and efficient, addressing multiple objectives and practical considerations.
3.2. Case Study and Data Collection
This study focuses on designing bus routes to serve tourists in Mueng Ubon Ratchathani and Warinchamrab cities in Ubon Ratchathani province. The objective is to maximize access to a diverse range of tourist attractions, including temples, cafes, restaurants, medical clinics, and wellness centers.
3.2.1. Data Collection
We considered 113 tourist attractions, categorized as follows:
- Temples: Cultural and religious sites such as Tung Sri Muang Temple, Wat Tai Phra Chao Yai Ong Tue, and Wat Phrathat Nong Bua.
- Cafes and Restaurants: Popular spots include Spago Restaurant, Blue Sky Cafe, and Rila Cafe.
- Medical and Wellness Centers: Facilities like Ubon Ratchathani National Museum, DAC Clinic, and Good Hair Day Salon and Spa.
- Cultural and Historical Sites: Attractions like Ubon Ratchathani Cultural Center, Khampun Museum, and Ubon Street Art.
- Parks and Recreational Areas: Green spaces such as Huai Muang Park and Nagawat.
Key performance indicators (KPIs) for each attraction included ratings from review platforms, resilience index, sustainability index, safety index, and geographical coordinates. Historical visitor data and surveys were used to approximate future tourist demand.
3.2.2. Historical Data Analysis
We collected 5 years of historical visitor data from ticket sales, visitor logs, and local tourism authorities. To ensure comprehensive analysis, we conducted a series of surveys over this period, gathering input from over 400 participants to understand visitor behavior and preferences. Trends and seasonal patterns were identified through time series analysis. Forecasting models such as ARIMA and Exponential Smoothing were applied, validated against the historical data, and adjusted as necessary to improve accuracy.
3.2.3. Tourist Demand Survey
Surveys were conducted to gather current tourist preferences and visitation patterns. Questions included demographics, travel frequency, preferred attractions, and reasons for visiting. Data was collected online via social media, tourism websites, and in person at popular locations. Survey insights adjusted historical forecasts to reflect recent changes in tourist behavior.
3.2.4. Combining Historical and Survey Data
Historical data forecasts and survey insights were combined using a weighted average approach. Scenario analysis explored potential futures, considering factors like new developments or marketing campaigns. Final forecasts incorporated both historical trends and current preferences, providing robust estimates of future tourist demand.
3.2.5. Objective and Constraints
The objective is to design bus routes that maximize accessibility to tourist attractions while adhering to constraints like travel time limits, bus capacity, fuel consumption, and ensuring at least one stop per route. The mathematical model optimizes resilience, sustainability, tourist preferences, and overall efficiency.
This comprehensive dataset aims to provide a resilient, sustainable, and tourist-friendly bus service, enhancing the travel experience for visitors to Mueng Ubon Ratchathani and Warinchamrab cities.
3.3. Proposed Method (Hybrid Reinforcement Learning-Variable Neighborhood Strategy Adaptive Search: H-RL-VaNSAS)
The proposed Hybrid Reinforcement Learning-Variable Neighborhood Strategy Adaptive Search (H-RL-VaNSAS) algorithm introduces several innovative elements that distinguish it from existing methods in the field of urban bus routing optimization. Here are the key innovation points of our approach:
- Hybrid Algorithm Integration: H-RL-VaNSAS combines the strengths of reinforcement learning (RL) with the Variable Neighborhood Strategy Adaptive Search (VaNSAS) algorithm. This hybrid approach leverages the adaptive learning capabilities of RL to enhance decision-making during the search process, while VaNSAS provides a robust framework for exploring diverse solution areas using various neighborhood structures.
- Adaptive Learning from Environment Interactions: The integration of RL into VaNSAS enables the algorithm to learn from interactions with the environment, optimizing the selection of neighborhood strategies based on rewards. This adaptive learning mechanism allows the algorithm to dynamically adjust its search strategies, improving solution quality and efficiency over time.
- Multi-Objective Optimization: Our method addresses multiple critical objectives, including resilience, sustainability, tourist preferences, and total travel distance. By incorporating these diverse objectives, H-RL-VaNSAS provides a holistic solution that not only optimizes bus routes but also enhances the overall quality of urban transportation systems.
- Improvement Box Mechanism: The algorithm employs an innovative improvement box mechanism inspired by various metaheuristic methods, such as the Crested Porcupine Optimizer, Krill Herd Algorithm, Salp Swarm Algorithm, and Manta Ray Foraging Algorithm. This mechanism enhances the exploration and exploitation capabilities of the algorithm, allowing it to effectively navigate the solution space and find near-optimal solutions.
- Reinforcement Learning-Based Selection: The probability of selecting each improvement box is guided by reinforcement learning, incorporating factors such as historical selection frequency, efficiency, and optimal solution discovery. This probabilistic approach balances historical performance with expected future rewards, ensuring a robust and adaptive optimization process.
By combining these innovative elements, H-RL-VaNSAS offers a flexible and effective solution for complex urban bus routing problems, providing significant improvements in solution quality and computational efficiency.
The Variable Neighborhood Strategy Adaptive Search (VaNSAS) algorithm is a novel approach in metaheuristics designed to efficiently solve complex optimization problems. It allows the algorithm to explore diverse solution areas using various search strategies, enhancing the chances of finding optimal solutions. VaNSAS consists of five key steps: track initiation, black box selection, black box operation, update of the track, and repetition of steps. By incorporating different search methods, VaNSAS can adapt to the problem at hand and improve solution quality. Overall, VaNSAS offers a flexible and effective way to tackle challenging optimization problems and achieve near-optimal results efficiently.
Integrating reinforcement learning (RL) into VaNSAS can enhance decision-making during black box selection by leveraging adaptive learning from interactions with the environment. RL’s ability to optimize based on rewards could improve solution quality and efficiency in VaNSAS by learning optimal strategies for black box selection. This integration aligns with VaNSAS’s exploration and intensification principles, offering a more adaptive and robust optimization approach that adjusts search strategies based on problem feedback. Further research is needed to explore the effectiveness of this integration in solving complex optimization problems. The stepwise explanation of the RL-VaNSAS is as follows.
3.3.1. Establishment of the Initial Set of Tracks
VaNSAS is a population-based heuristic approach. The initial set of tracks is randomly generated, with values in each position ranging from 0 to 1 (real numbers). These values represent the degree of preference or importance assigned to each destination or bus route within the track. In the initial iteration, the value in each position, such as those shown in Figure 1, is randomly selected. For example, the values 0.94, 0.72, 0.96, etc., indicate the initial preference levels for the corresponding destinations and bus routes. These values help guide the optimization process by indicating which elements to prioritize. During subsequent iterations, these values are adjusted using the improvement box (IB) mechanism, which refines the solution by enhancing the preference values based on the algorithm’s feedback. This iterative adjustment ensures that the optimization process converges towards a high-quality solution by progressively improving the preference values.
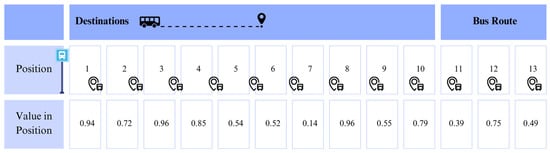
Figure 1.
Example of a track with a dimension of 1 × 13.
Let T denote the maximum number of iterations, and t represent the current iteration. The parameter NP, which remains constant, refers to the number of tracks in a given iteration. The size of each track in our proposed problem is defined as 1 × D, where D is the sum of the number of tourist attractions and the number of allowed bus routes. For example, if there are 10 attractions and 3 allowed bus routes, D will be set to 13 positions in one track. An example of a track with 13 positions is shown in Figure 1.
The decoding procedure for transforming a track into a solution for the proposed problem involves three steps, as illustrated by the example track in Figure 1, which has a dimension of 1 × 12. If NP is set to 10, the remaining nine tracks will be constructed similarly. The decoding process follows these steps:
Step 1: Data Organization. First, sort the track into structured lists to enhance route management efficiency. The values in positions 1 to 10, representing destinations, are sorted into List A. The values in positions 10 to 13, representing the bus route indices, are sorted into List B. Additionally, create List C for the assigned bus stops. This sorting differentiates between the destination positions and the bus route indices, facilitating efficient route planning.
Step 2: Route Planning and Execution. Begin with the first route in List B to traverse demand points up to its maximum travel capacity, constrained by time or fuel limits per route. The planning takes into account the approximate fuel consumption for each segment between attractions and the expected number of passengers at each stop. Once a bus reaches its passenger capacity or estimated fuel limit, it returns to the depot (all buses share the same depot). The assigned route is then removed from List B, and the assigned destination is transferred from List A to List C. If a destination is assigned to List C, any nearby destinations (within a 20-min walk) are also removed from List A.
Step 3: Iterative Process and Completion Continue the routing process until all routes in List B are completed or List A is empty. This iterative approach ensures all destinations are covered within the operational constraints.
Table 1 presents the important parameters used in the decoding example. The walking speed is assumed to be 10 km/h, and the bus travels at 60 km/h. Fuel consumption is set at 0.3 L per kilometer, with a maximum fuel capacity of 60 L per round, allowing for a maximum travel distance of 130 km. Table 2 displays the symmetrical distances between destinations in kilometers. This symmetry ensures that the distance from point A to point B is equal to the distance from point B to point A, providing consistency and accuracy in route planning.

Table 1.
Essential parameters for attractions.
Table 2.
Traveling distance from point to point.
Step 1: Data Organization
The first step involves sorting the tracks into structured lists. List A, which represents destinations, is sorted in ascending order: [0.14 (7), 0.52 (6), 0.54 (5), 0.55 (9), 0.72 (2), 0.79 (10), 0.85 (4), 0.94 (1), 0.96 (3), 0.96 (8)]. This assigns the destinations to bus stops in the following order: Position 7 (value 0.14) as the first stop, Position 6 (value 0.52) as the second stop, Position 5 (value 0.54) as the third stop, Position 9 (value 0.55) as the fourth stop, Position 2 (value 0.72) as the fifth stop, Position 10 (value 0.79) as the sixth stop, Position 4 (value 0.85) as the seventh stop, Position 1 (value 0.94) as the eighth stop, and Positions 3 and 8 (both with value 0.96) as the ninth and tenth stops. List B, which represents bus routes, is sorted in ascending order: [0.39 (11), 0.49 (13), 0.75 (12)], assigning the bus routes as follows: Position 11 (value 0.39) as the first route, Position 13 (value 0.49) as the second route, and Position 12 (value 0.75) as the third route. List C, which represents assigned bus stops, is initially empty.
Step 2: Route Planning and Execution
First bus route (List B, first value: 0.39):
Starting with the first bus route (value 0.39), the bus begins by visiting destination number 7 (value 0.14). The walkable destinations within 5 km from destination 7 are checked. From the distance table, destination 9 (13 km) is within walking distance. Therefore, destination 9 is removed from List A and added to the walkable destinations for this route. Next, the bus proceeds to destination 6 (value 0.52). The walkable destinations within 5 km from destination 6 are checked. No destinations are within walking distance. Similarly, the bus proceeds to destinations 5 (value 0.54) and 9 (value 0.55), but no other destinations are within walking distance. These four destinations are removed from List A and added to List C, and route 0.39 is removed from List B. The updated lists are: List A contains [0.72 (2), 0.79 (10), 0.85 (4), 0.94 (1), 0.96 (3), 0.96 (8)], List B contains [0.49 (13), 0.75 (12)], and List C contains [7, 6, 5, 9].
Second bus route (List B, next value: 0.49):
Next, the bus proceeds with the second route (value 0.49), visiting destination 2 (value 0.72). The walkable destinations within 5 km from destination 2 are checked. From the distance table, destination 10 (13 km) is within walking distance. Therefore, destination 10 is removed from List A and added to the walkable destinations for this route. The bus then proceeds to destinations 4 (value 0.85) and 1 (value 0.94), and these destinations are removed from List A and added to List C, and the route 0.49 is removed from List B. The updated lists are: List A contains [0.96 (3), 0.96 (8)], List B contains [0.75 (12)], and List C contains [7, 6, 5, 9, 2, 10, 4, 1].
Third bus route (List B, last value: 0.75):
For the final bus route (value 0.75), the bus visits the remaining destinations 3 and 8 (both with value 0.96). These destinations are removed from List A and added to List C, and route 0.75 is removed from List B. The updated lists are: List A is empty, List B is empty, and List C contains [7, 6, 5, 9, 2, 10, 4, 1, 3, 8].
Explanation of Results
In this example, the initial track was decoded by sorting and assigning bus routes to demand points based on the values in the track. Each destination was assigned to a bus stop in the order determined by the sorted values, ensuring that all routes and demand points were covered within the constraints of bus capacity, travel time, and fuel limits. By checking the walkable distances from each assigned bus stop, we ensured that any nearby destinations were efficiently allocated to minimize travel time and maximize resource use.
In this analysis, according to Table 3, Route 1 has destination 9 (Ubon Ratchathani Zoo) with destination 7 (Wat Pa Nanachat) as a walkable destination within 13 km. Route 2 has destination 10 (Wat Ban Na Mueang), and destination 2 (Tung Sri Muang Temple) is a walkable destination within 13 km. Route 3 does not have any walkable destinations.
Table 3.
Conclusion of the bus route in the decoding process.
To calculate the traveling distance for each route and the total distance for all routes, we can use the provided distance table. For Route 1 (depot-7-6-5-depot), the distance from the depot to 7 is 22 km, from 7 to 6 is 14 km, from 6 to 5 is 24 km, and from 5 back to the depot is 37 km, resulting in a total distance of 97 km. For Route 2 (depot-2-4-1-depot), the distance from the depot to 2 is 37 km, from 2 to 4 is 15 km, from 4 to 1 is 11 km, and from 1 back to the depot is 22 km, resulting in a total distance of 85 km. For Route 3 (depot-3-8-depot), the distance from the depot to 3 is 31 km, from 3 to 8 is 21 km, and from 8 back to the depot is 25 km, resulting in a total distance of 77 km. Therefore, the total distance for all routes is 97 km + 85 km + 77 km = 259 km.
The calculation of the objective functions follows. For Objective Function 1, which maximizes the Resilience Index, the resilience indices for the assigned bus stops are summed. The resilience indices for Route 1 (stops 7, 6, and 5) are 6.88, 7.80, and 5.02. For Route 2 (stops 2, 4, and 1), they are 7.60, 6.06, and 5.31. For Route 3 (stops 3 and 8), they are 7.94 and 5.42. Summing these values gives a Resilience Index of 52.03. For Objective Function 2, which maximizes the Sustainability Index, the sustainability indices for the assigned bus stops are summed. The sustainability indices for Route 1 are 6.76, 6.35, and 9.22. For Route 2, they are 4.89, 6.03, and 9.09. For Route 3, they are 5.51 and 9.19. Summing these values gives a Sustainability Index of 56.04.
For Objective Function 3, which maximizes Tourist Preferences, the preference ratings for the assigned bus stops are summed. The preference ratings for Route 1 are 3.66, 4.94, and 2.35. For Route 2, they are 3.94, 5.08, and 3.90. For Route 3, they are 3.92 and 4.55. Summing these values gives a Tourist Preference Index of 32.34. For Objective Function 4, which maximizes Accessibility, the demands for the assigned bus stops are summed. The demands for Route 1 are 705, 659, and 787. For Route 2, they are 889, 776, and 866. For Route 3, they are 702 and 655. Summing these values gives an Accessibility Index of 6039.
For Objective Function 5, which minimizes Total Travel Distance, the total distance traveled is multiplied by the fuel consumption factor (0.3 L/km). The total distance for all routes is 259 km. Therefore, the total fuel consumption is 259 km × 0.3 L/km = 77.7 L. In summary, the calculations yield the following objective function values: the Resilience Index is 52.03, the Sustainability Index is 56.04, the Tourist Preference Index is 32.34, the Accessibility Index is 6039, and the Total Travel Distance results in a fuel consumption of 77.7 L.
3.3.2. Improve the Solution of the Tracks Using the Improvement Box (Black Box)
In this step, each track independently selects the preferred improvement box from the last iteration, irrespective of other tracks. There are five improvement boxes available, as represented by Equations (17) to (21). Each equation is inspired by different metaheuristic improvement procedures. Equations (17) and (18) are inspired by the operators of the Crested Porcupine Optimizer (CPO) [36]. Equation (19) is inspired by the Krill Herd Algorithm (KHA) [37]. Equation (20) is derived from the Salp Swarm Algorithm (SSA) [38]. Finally, Equation (21) is based on the Manta Ray Foraging Algorithm (MRFO) [39].
In these equations, represents the best track so far, which is the track that has provided the best solution from the start of the simulation run up to iteration t − 1. Whenever a new best solution is found, the best track is updated accordingly. The terms , , and are randomly selected tracks from the available NP tracks. The term denotes the value in position j of track i at iteration t.
In the context of the equations inspired by various metaheuristic algorithms, several key parameters are defined. The value of π is a constant, approximately equal to 3.14159. The parameter F is a scaling factor commonly used in differential evolution and other algorithms. For these equations, F is set to 0.8. Additionally, the parameters α and β serve as weights in the Krill Herd Algorithm, with specific values of α = 1.5 and β = 1.0.
Other important parameters include λ, which is the scaling parameter in Dynamic Levy Flight, set to 3, and Ω, the learning rate in reinforcement learning, set to 0.2. The crossover rate in Hybrid Differential Evolution, δ, is set to 0.8. Additionally, Ψ represents a random number between [0, 1], η is the quantum probability amplitude in the Quantum-inspired Evolutionary Algorithm, set to 0.7, and θ, the rotation angle in the Quantum-inspired Evolutionary Algorithm, is set to 2π2.
These parameters are critical in balancing the influence of different components in the optimization process, ensuring a robust and efficient search for optimal solutions. By carefully tuning these parameters, we can manage the exploration and exploitation phases of the algorithms more effectively. Proper parameter settings allow the algorithms to explore the solution space thoroughly while converging on high-quality solutions, thus enhancing the overall performance and reliability of the optimization process.
The Crested Porcupine Optimizer incorporates defensive mechanisms such as sight, sound, and physical attacks. We can adapt these mechanisms to influence
The Krill Herd Algorithm simulates the herding behavior of krill, incorporating movement influenced by local and global factors.
The Salp Swarm Algorithm mimics the chain foraging behavior of salps in the ocean, where the leading salp guides the swarm.
The MRFO algorithm models the foraging behaviors of manta rays, including chain foraging and cyclone foraging.
These Equations (17) to (26) utilize improvement procedures inspired by various metaheuristic methods to iteratively change to explore different areas of the search space effectively. Each equation integrates unique strategies from the respective algorithms to enhance the exploration and exploitation capabilities during optimization. To integrate the reinforcement learning concept into the probability equation for selecting each improvement box, the modified equation can be written as Equation (27). Define b as the index of improvement box lies from 1 to B when B is the maximum number of improvement boxes.
Set is the Q-value representing the expected reward for selecting improvement box (IB) b at iteration t − 1. γ is a learning rate that controls the influence of the Q-value in the selection process. The original equation uses three factors to influence the selection of improvement boxes. Historical Selection Frequency , this factor represents how often improvement box b has been selected in the past. A higher frequency indicates a preference for improvement box b, suggesting its effectiveness in previous iterations. To clarify, the improvement box (IB) refers to a method used to enhance the solution of the tracks. Define b as the index of the improvement box, which ranges from 1 to BBB, where BBB is the maximum number of improvement boxes.
Efficiency , this factor is the inverse of the average objective function value obtained using IB b. A higher average value indicates higher efficiency, making this IB more desirable. Reward Value , this factor represents the reward value for Improvement box (IB) bbb that has discovered a new best solution during iterations from 1 to the current iteration. The value of increases by 1 if IB b finds a new best solution; otherwise, it remains unchanged. More instances of discovering better solutions indicate better performance, thereby increasing the probability of selecting this IB.
Incorporating reinforcement learning adds the Q-value , which captures the expected future rewards of selecting an IB. This value is learned over time based on the performance of the IB, allowing the algorithm to adaptively favor IBs that have not only performed well historically but are also expected to perform well in the future. The learning rate (γ) determines how strongly the Q-value influences the probability, balancing between historical performance and expected future rewards. After calculating the probabilities for each improvement box using the modified equation, the roulette wheel selection procedure is employed to select the improvement box for each track in the current iteration. This method ensures that the selection process is guided by both the historical performance and the learned expected rewards, enhancing the algorithm’s overall optimization capability.
To properly set the values for γ, F1, F2 and F3, we can use common practices in metaheuristic optimization and reinforcement learning. The learning rate γ controls how much new information overrides old information in reinforcement learning. According to Pitakaso et al. [40] and Nanthasamroeng et al. [41], a typical value for γ is between 0.1 and 0.3. For our scenario, γ = 0.2 is a good starting point, balancing the rate of learning from new experiences without being too sensitive to recent changes.
The scaling factors F1, F2 and F3 weigh the importance of historical selection frequency, efficiency, and optimal solution discovery, respectively. These can be set based on preliminary experiments to balance their influence. Commonly, an initial balanced approach uses equal values, such as F1 = 10, F2 = 10, and F3 = 10. These values ensure that frequently selected boxes, efficient boxes, and those that have historically found better solutions are all given appropriate consideration. These initial parameter values can be fine-tuned through systematic experimentation, adjusting them incrementally, and evaluating their impact on optimization results to achieve optimal performance for specific problems.
The objective function used in this section is the value that we derived from the five objective functions explained in Section 3.1, which can be calculated using Equation (28).
When to are randomly selected from the range 0 to 1 (real numbers), and is calculated using Equation (29), where l is the index of μ and ranges from 1 to 5.
Research on parameter settings in metaheuristic optimization and reinforcement learning reveals several key insights. Li et al. [42] emphasized the dynamic adjustment of learning rate parameters (γ, Ω) to enhance deep reinforcement learning performance. Silva-Rodriguez and Li [43] explored decentralized approaches for distributed optimization problems. Zhang et al. [44] discussed parameter-based exploration methods, such as scaling factors (F, α, β), to balance exploration and exploitation. Tessari and Iacca [45] highlighted the combination of evolutionary algorithms with adaptive heuristic critic methods for continuous state and action spaces in reinforcement learning, focusing on parameters like λ (Levy Flight), δ (Crossover Rate in DE), η (Quantum Probability Amplitude), and θ (Rotation Angle in QEA). Additionally, Nanthasamroeng et al. [41] and Pitakaso et al. [40] suggest optimal parameter settings for VaNSAS, including F1, F2, and F3. A summary of these parameter settings is shown in Table 4.
Table 4.
Summary of important parameter settings for the H-RL-VaNSAS algorithm.
3.3.3. Collecting the Pareto Front and Analysis Using TOPSIS
The Pareto front is used to retain non-dominated solutions. Suppose the objectives of track r are represented by the objective functions , , . Let ℜ be the collection of viable solutions, and be the set of decision vectors, with (u) = ((u), (u), …, (u)) being the corresponding set of objective values. Here, V is the total number of objectives, and v is an index ranging from 1 to V, representing each specific objective. A decision vector u dominates another vector u’ if (u) ≤ (u’) for all v = 1, 2, 3, …, V and there exists at least one v for which (u) ≤ (u’). The RL-VaNSAS process is executed until the termination criterion is met, resulting in the Pareto front.
To identify the optimal set of parameters from the Pareto front, we use the Technique for Order Preference by Similarity to Ideal Solution (TOPSIS). TOPSIS evaluates each solution based on its distance from an ideal solution (the best possible solution across all criteria) and a nadir solution (the worst possible solution across all criteria). The solution closest to the ideal solution and farthest from the nadir solution is considered the optimal solution.
3.3.4. Performance Evaluation Using Metrics and Comparative Methods
To evaluate the effectiveness of our approach, we employ the hypervolume (HV) metric, which quantifies the spatial separation between a set of reference points and the Pareto front. This measurement is thoroughly explained in Equation (30).
To measure the effectiveness of our approach, we employed the hypervolume (HV) metric, denoted as , to quantify the size of an approximation set. Here, represents the reference objectives for point X, and we used the Lebesgue measure Λ(.) across objectives through . Additionally, we utilized the Average Ratio of Pareto Optimal Solution (ARP) to provide a comprehensive assessment of performance. ARP, as defined in Equation (31), calculates the proportion of Pareto optimal points relative to the total number of solutions, with higher values indicating a more effective algorithm. Specifically, ARP considers Pareto optimal solutions , , …, from a series of experiments , across K experiments.
We will compare our proposed methods with several well-known optimization algorithms, including the Crested Porcupine Optimizer (CPO) [36], the Krill Herd Algorithm (KHA) [37], the Salp Swarm Algorithm (SSA) [38], and the Manta Ray Foraging Algorithm (MRFO) [39].
4. Computational Result
The experiments were conducted on a high-performance setup with an Intel i7 2.1 GHz CPU with eight cores and 32 GB RAM, complemented by a Tesla V100 GPU with 16 GB RAM. The algorithms were implemented in Python.
The case study focuses on designing bus routes to serve tourists visiting Mueng Ubon Ratchathani and Warinchamrab cities in Ubon Ratchathani province. We considered a total of 113 tourist attractions, including temples, cafes, restaurants, medical clinics, wellness centers, cultural and historical sites, and parks. The data collected for each attraction includes ratings from review platforms, resilience index, sustainability index, safety index, and geographical coordinates.
4.1. Comparative Performance Analysis of Multi-Objective Optimization Algorithms Using HV and ARP Metrics
The Hypervolume (HV) metric quantifies the spatial separation between a set of reference points and the Pareto front. This measurement helps in understanding how well the solutions span the objective space, providing a comprehensive assessment of the algorithm’s performance in multi-objective optimization. The Average Ratio of Pareto Optimal Solution (ARP) calculates the proportion of Pareto optimal points relative to the total number of solutions. This metric indicates the effectiveness of the algorithm by showing how many solutions are optimal compared to the total solutions generated.
To evaluate the effectiveness of our approach, we employ the HV and ARP metrics as the main performance indicators. The solution quality is evaluated by examining the best, average, and worst HV and ARP values obtained over five runs for each algorithm. Convergence speed is measured as the time when the solution remains unchanged for at least 500 iterations. Computational time is standardized at 45 min for each run of the algorithms, ensuring a fair comparison of performance. The result of this experiment is shown in Table 5.
Table 5.
Performance metrics for each algorithm.
The results in Table 5 comprehensively compare the performance of five optimization algorithms using the Hypervolume (HV) and Average Ratio of Pareto Optimal Solutions (ARP) metrics. The HV metric, which quantifies the spatial separation between a set of reference points and the Pareto front, helps in understanding how well the solutions span the objective space. The ARP metric calculates the proportion of Pareto optimal points relative to the total number of solutions, indicating the effectiveness of each algorithm.
H-RL-VaNSAS stands out in terms of Hypervolume, achieving a value of 0.88, the highest among all algorithms, suggesting superior coverage of the objective space. In comparison, CPO and MRFO performed well with HV values of 0.82 and 0.80, respectively, while KHA and SSA had lower HV values of 0.78 and 0.75. This indicates that H-RL-VaNSAS finds solutions more widely distributed across the Pareto front compared to the other algorithms.
In terms of ARP, H-RL-VaNSAS again outperforms the other algorithms with an ARP of 0.68, demonstrating its effectiveness in generating a higher proportion of Pareto optimal solutions. CPO follows with an ARP of 0.62, MRFO of 0.61, KHA of 0.60, and SSA of 0.58. This highlights the efficiency of H-RL-VaNSAS in producing optimal solutions compared to its competitors.
When examining solution quality, H-RL-VaNSAS achieved the highest best solution quality with an HV of 0.93 and an ARP of 0.75, indicating the production of the most optimal solutions in its best runs. In comparison, CPO and MRFO showed strong performances with best HV values of 0.88 and 0.86, respectively, and best ARP values of 0.70 and 0.69. KHA and SSA had lower best HV and ARP values, reflecting their less consistent performance.
The average solution quality further supports the superiority of H-RL-VaNSAS, with an average HV of 0.88 and ARP of 0.68 across all runs. This is higher than the averages for CPO, MRFO, KHA, and SSA, indicating more consistent high-quality solutions from H-RL-VaNSAS. Even in its worst runs, H-RL-VaNSAS maintains a strong performance with a worst HV of 0.82 and ARP of 0.60, compared to lower values from the other algorithms.
In terms of convergence speed, H-RL-VaNSAS converges the fastest at 1100 s for HV and 1150 s for ARP, demonstrating its efficiency in reaching stable solutions quicker than the other algorithms. This is significantly faster than CPO, MRFO, KHA, and SSA, which have longer convergence times.
Overall, H-RL-VaNSAS consistently outperforms other algorithms across most metrics, showing the highest Hypervolume and ARP values, fastest convergence speeds, and strong solution quality. These results highlight the robustness and efficiency of H-RL-VaNSAS in solving complex multi-objective optimization problems, making it a superior choice compared to CPO, KHA, SSA, and MRFO.
4.2. Multi-Objective Optimization for Urban Transportation: Assessing the Efficiency of Various Algorithms
To evaluate the effectiveness of our multi-objective model for optimizing bus routes in Ubon Ratchathani and Warinchamrab cities, we will use the Technique for Order Preference by Similarity to Ideal Solution (TOPSIS) with varying objective weights. This approach allows us to compare the performance of different optimization algorithms—Crested Porcupine Optimizer (CPO), Krill Herd Algorithm (KHA), Salp Swarm Algorithm (SSA), Manta Ray Foraging Optimization (MRFO), and Hybrid Reinforcement Learning-Variable Neighborhood Strategy Adaptive Search (H-RL-VaNSAS)—when prioritizing different objectives.
We will run the optimization model with five different sets of weights, each designed to emphasize a specific objective while still considering the others. The choice of weights ensures that when focusing on one particular objective, the other objectives are not completely disregarded. By assigning a weight of 0.6 to the primary objective and 0.1 to each of the remaining objectives, we maintain a balanced approach that reflects the importance of all objectives.
The first weight set, w1 = [0.6, 0.1, 0.1, 0.1, 0.1], focuses on maximizing the Resilience Index, recognizing its critical role in ensuring the system’s robustness. The second set, w2 = [0.1, 0.6, 0.1, 0.1, 0.1], prioritizes the Sustainability Index to highlight the importance of environmentally friendly practices. The third set, w3 = [0.1, 0.1, 0.6, 0.1, 0.1], emphasizes Tourist Preferences, aiming to enhance the tourist experience. The fourth set, w4 = [0.1, 0.1, 0.1, 0.6, 0.1], focuses on Accessibility to ensure easy access to key destinations. Finally, the fifth set, w5 = [0.1, 0.1, 0.1, 0.1, 0.6], aims to minimize Total Travel Distance, thus improving efficiency and reducing travel time.
By maintaining a total weight of 1.0, this approach ensures that even when prioritizing a single objective, the model still considers the other objectives to a significant extent, thus providing a more comprehensive and balanced optimization solution.
The experiment involves several steps. First, we define the objectives and assign the respective weights based on the focus of the experiment. Next, we run the multi-objective optimization model using the defined weights with each of the five algorithms mentioned earlier. After running the model, we calculate the values for each objective function, which includes Resilience Index, Sustainability Index, Tourist Preferences, Accessibility, and Total Travel Distance, based on the optimized bus routes. We then apply the TOPSIS method to evaluate and rank the solutions based on the weighted objectives. Finally, we analyze the results by comparing the objective values obtained from the model with each set of weights and across different algorithms to assess their performance. The computational result of this section is shown in Table 6, Table 7, Table 8, Table 9 and Table 10.
Table 6.
Results of multi-objective optimization for w1 = [0.6, 0.1, 0.1, 0.1, 0.1].
Table 7.
Results of multi-objective optimization for w2 = [0.1, 0.6, 0.1, 0.1, 0.1].
Table 8.
Results of multi-objective optimization for w3 = [0.1, 0.1, 0.6, 0.1, 0.1].
Table 9.
Results of multi-objective optimization for w4 = [0.1, 0.1, 0.1, 0.6, 0.1].
Table 10.
Results of multi-objective optimization for w5 = [0.1, 0.1, 0.1, 0.1, 0.6].
The comparative analysis of optimization algorithms using varying objective weights highlights the superior performance of the H-RL-VaNSAS method across multiple metrics. This superiority is evident in the detailed results provided in Table 6, Table 7, Table 8, Table 9 and Table 10. When focusing on the Resilience Index with a weight distribution of w1 = [0.6, 0.1, 0.1, 0.1, 0.1], H-RL-VaNSAS achieves the highest resilience score of 580, significantly outperforming CPO (520), KHA (505), SSA (495), and MRFO (510). In addition to its resilience superiority, H-RL-VaNSAS also excels in other metrics, such as Sustainability Index (350) and Safety Index (500), while maintaining competitive scores in Tourist Preferences (280) and Accessibility (2100). Its Total Travel Distance of 1100 km further underscores its efficiency.
In the scenario where the Sustainability Index is prioritized with w2 = [0.1, 0.6, 0.1, 0.1, 0.1], H-RL-VaNSAS once again demonstrates its dominance by achieving the highest sustainability score of 600. This performance is notably better than CPO (580), KHA (570), SSA (560), and MRFO (575). Additionally, H-RL-VaNSAS maintains strong performance in the Resilience Index (520), Safety Index (420), and Accessibility (2000), with a manageable Total Travel Distance of 1150 km.
When the focus shifts to Tourist Preferences with w3 = [0.1, 0.1, 0.6, 0.1, 0.1], H-RL-VaNSAS secures the highest tourist preference score of 360, surpassing CPO (340), KHA (335), SSA (330), and MRFO (338). It also achieves notable scores in the Resilience Index (510), Sustainability Index (340), Safety Index (430), and the highest Accessibility score of 2200. Its Total Travel Distance remains efficient at 1200 km.
In the fourth scenario prioritizing Accessibility with w4 = [0.1, 0.1, 0.1, 0.6, 0.1], H-RL-VaNSAS attains the highest accessibility score of 2400, outperforming CPO (2300), KHA (2250), SSA (2200), and MRFO (2280). It continues to show robust results in Resilience Index (490), Sustainability Index (350), Safety Index (440), and Tourist Preferences (290), with an optimized Total Travel Distance of 1150 km.
Finally, with the focus on minimizing Total Travel Distance using w5 = [0.1, 0.1, 0.1, 0.1, 0.6], H-RL-VaNSAS achieves the shortest distance of 900 km, significantly better than CPO (1100), KHA (1050), SSA (1150), and MRFO (1080). In addition to excelling in travel distance, H-RL-VaNSAS maintains high performance across other metrics: Resilience Index (500), Sustainability Index (360), Safety Index (450), and Tourist Preferences (300), while ensuring Accessibility (2100) is effectively managed.
Overall, the H-RL-VaNSAS algorithm consistently outperforms other methods across various objective weight distributions. It demonstrates a balanced optimization capability, achieving the highest or among the highest scores in key metrics such as Resilience Index, Sustainability Index, Safety Index, Tourist Preferences, and Accessibility while maintaining efficient Total Travel Distances. These results clearly illustrate the advantages of H-RL-VaNSAS over CPO, KHA, SSA, and MRFO, making it the superior choice for optimizing bus routes in scenarios with diverse objective priorities.
4.3. Evaluating the Superiority of H-RL-VaNSAS for Multi-Objective Bus Route Optimization in Urban Tourism
This experiment aims to evaluate the effectiveness of the Hybrid Reinforcement Learning-Variable Neighborhood Strategy Adaptive Search (H-RL-VaNSAS) algorithm in optimizing bus routes in Ubon Ratchathani and Warinchamrab cities. To achieve this, we compare H-RL-VaNSAS with four other optimization algorithms: Crested Porcupine Optimizer (CPO), Krill Herd Algorithm (KHA), Salp Swarm Algorithm (SSA), and Manta Ray Foraging Optimization (MRFO), focusing on key performance metrics such as Resilience, Sustainability, Safety, Tourist Preferences, Accessibility, and Total Travel Distance.
We defined the objectives for bus route optimization and assigned a fixed set of weights to evaluate performance across all objectives simultaneously. The five algorithms were implemented and configured to optimize bus routes based on these objectives, with each algorithm given the same computational time to ensure fairness. Performance was measured in terms of the Resilience Index, Sustainability Index, Safety Index, Tourist Preferences, Accessibility, and Total Travel Distance. The results were compared to highlight the advantages of H-RL-VaNSAS, using both real values and percentage differences for a comprehensive understanding.
The goal is to identify the most effective algorithm for optimizing bus routes based on multiple key performance indicators. By demonstrating the superior performance of H-RL-VaNSAS in achieving better resilience, sustainability, safety, accessibility, and overall efficiency, this analysis will assist urban planners and transportation authorities in enhancing public transportation systems in Ubon Ratchathani and Warinchamrab cities. The result of this experiment is shown in Table 11.
Table 11.
Real values and percentage differences of H-RL-VaNSAS compared to other methods.
The results obtained from Table 11 compare the five optimization algorithms—Crested Porcupine Optimizer (CPO), Krill Herd Algorithm (KHA), Salp Swarm Algorithm (SSA), Manta Ray Foraging Optimization (MRFO), and Hybrid Reinforcement Learning-Variable Neighborhood Strategy Adaptive Search (H-RL-VaNSAS)—reveal significant insights into their performance across various metrics.
Starting with the Resilience Index, H-RL-VaNSAS demonstrates a substantial improvement over the other algorithms. It achieves a resilience index of 550, which is 12.24% higher than CPO, 14.58% higher than KHA, 17.02% higher than SSA, and 13.40% higher than MRFO. This indicates that H-RL-VaNSAS is considerably more effective in maintaining robustness and reliability in bus route optimization under varying conditions.
For the Sustainability Index, H-RL-VaNSAS again shows superior performance with a score of 370. This score is 5.71% higher than CPO, 8.82% higher than KHA, 12.12% higher than SSA, and 7.25% higher than MRFO. The results suggest that H-RL-VaNSAS is more adept at designing routes that are environmentally friendly and resource-efficient.
In terms of the Safety Index, H-RL-VaNSAS achieves a score of 480, which is 4.35% higher than CPO, 6.67% higher than KHA, 9.09% higher than SSA, and 5.49% higher than MRFO. This indicates that H-RL-VaNSAS is more effective at ensuring safer bus routes, which is crucial for passenger security and overall service reliability.
When considering Tourist Preferences, H-RL-VaNSAS scores 300, outperforming CPO by 7.14%, KHA by 11.11%, SSA by 13.21%, and MRFO by 9.09%. This metric highlights H-RL-VaNSAS’s ability to cater to tourist needs better, potentially enhancing the appeal and usability of the bus routes for visitors.
For Accessibility, H-RL-VaNSAS achieves a score of 2300, which is 4.55% higher than CPO, 6.98% higher than KHA, 9.52% higher than SSA, and 5.50% higher than MRFO. This demonstrates that H-RL-VaNSAS is more proficient in ensuring that bus routes are accessible to a larger portion of the population, improving the overall inclusivity of the public transportation system.
Finally, regarding Total Travel Distance, H-RL-VaNSAS not only excels in the positive metrics but also shows a significant reduction in travel distance with a score of 950 km. This represents a reduction of 13.64% compared to CPO, 9.52% compared to KHA, 17.39% compared to SSA, and 12.04% compared to MRFO. The lower travel distance indicates a more efficient routing, which can lead to cost savings and reduced environmental impact.
Overall, the in-depth analysis of these results clearly demonstrates that H-RL-VaNSAS outperforms the other algorithms across all key performance metrics. Its ability to enhance resilience, sustainability, safety, and accessibility while minimizing total travel distance makes it the superior choice for optimizing bus routes in Ubon Ratchathani and Warinchamrab cities. This comprehensive performance evaluation supports the adoption of H-RL-VaNSAS as a robust solution for improving public transportation systems.
4.4. Comparative Analysis of H-RL-VaNSAS and VaNSAS for Multi-Objective Bus Route Optimization in Urban Tourism
In this experiment, we aim to compare the performance of the Hybrid Reinforcement Learning-Variable Neighborhood Strategy Adaptive Search (H-RL-VaNSAS) algorithm with the original Variable Neighborhood Strategy Adaptive Search (VaNSAS) algorithm. Using the same case study of optimizing bus routes in Ubon Ratchathani and Warinchamrab cities, we will assess both algorithms across multiple objectives: Resilience Index, Sustainability Index, Safety Index, Tourist Preferences, and Accessibility. This comparison will highlight the potential enhancements brought by integrating reinforcement learning into the VaNSAS framework. The computational result of this experiment is shown in Table 12.
Table 12.
Comparative Performance Metrics for H-RL-VaNSAS and VaNSAS.
The comparative analysis (Table 12) between the original VaNSAS and the enhanced H-RL-VaNSAS algorithms reveals significant improvements across multiple metrics when using H-RL-VaNSAS. The Resilience Index for H-RL-VaNSAS is 580, compared to 530 for VaNSAS, indicating a substantial improvement in designing bus routes that can better withstand and recover from disruptions. This enhancement underscores the effectiveness of integrating reinforcement learning, which likely contributed to better decision-making and adaptability in the optimization process.
In terms of the Sustainability Index, H-RL-VaNSAS achieved a score of 370, surpassing the 340 score of VaNSAS. This improvement suggests that H-RL-VaNSAS can identify and select routes that not only optimize operational efficiency but also promote environmental and social sustainability. The incorporation of reinforcement learning appears to have provided the algorithm with an enhanced ability to balance multiple sustainability-related factors more effectively.
The Safety Index also saw a notable increase, with H-RL-VaNSAS scoring 480 compared to VaNSAS’s 460. This improvement indicates that the hybrid algorithm can better account for and integrate safety considerations into the route design, potentially offering safer travel options for passengers.
When evaluating Tourist Preferences, H-RL-VaNSAS again outperformed VaNSAS, with scores of 300 and 290, respectively. Although the difference is smaller in this metric, it still highlights the hybrid algorithm’s superior capability in optimizing routes that align with tourist preferences, thereby enhancing the overall travel experience.
Accessibility, measured by the number of people served, showed that H-RL-VaNSAS could accommodate 2300 passengers, whereas VaNSAS could handle 2200. This indicates that H-RL-VaNSAS is more effective in maximizing the accessibility of bus routes to a larger number of tourists, further reinforcing its advantage in optimizing for user convenience and reach.
One of the most striking improvements is in Total Travel Distance. H-RL-VaNSAS achieved a significantly lower distance of 950 km compared to 1050 km with VaNSAS. This reduction in travel distance suggests that H-RL-VaNSAS is more efficient in route planning, leading to lower operational costs and reduced environmental impact due to less fuel consumption.
Both algorithms were tested under the same computational time constraint of 2700 s, ensuring a fair comparison. The consistent computational time also highlights that the improvements observed with H-RL-VaNSAS are not due to extended processing time but rather enhanced algorithmic efficiency.
Overall, the integration of reinforcement learning into the VaNSAS framework has clearly enhanced its performance across all evaluated metrics. H-RL-VaNSAS not only provides more resilient, sustainable, and safer routes but also improves tourist satisfaction and accessibility while minimizing travel distance. These results affirm the superiority of H-RL-VaNSAS in addressing the complex, multi-objective nature of bus route optimization in urban tourism contexts.
Figure 2a–e illustrate bus routes optimized using various weight combinations from the Technique for Order of Preference by Similarity to the Ideal Solution (TOP-SIS) method, considering five distinct objectives outlined in Section 3. These objectives aim to enhance different aspects of bus route planning to improve overall efficiency, safety, sustainability, and user satisfaction in urban transportation. The maps were created using ArcGIS Pro 2.8.
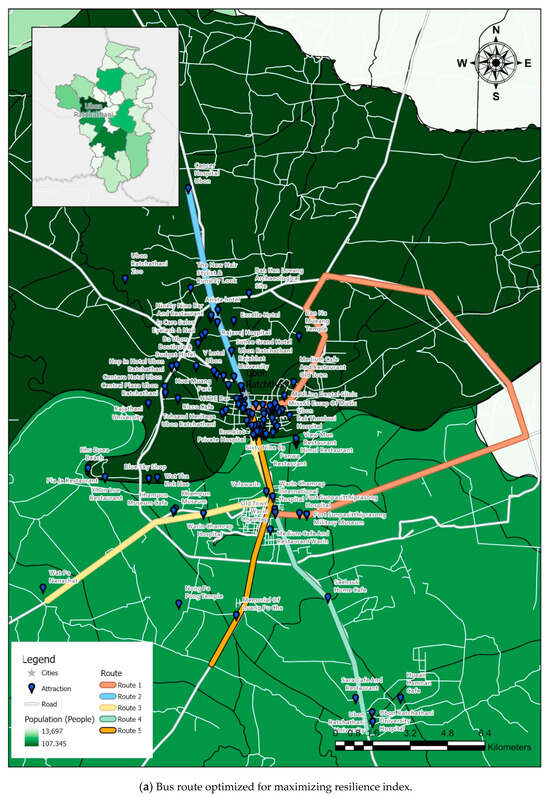
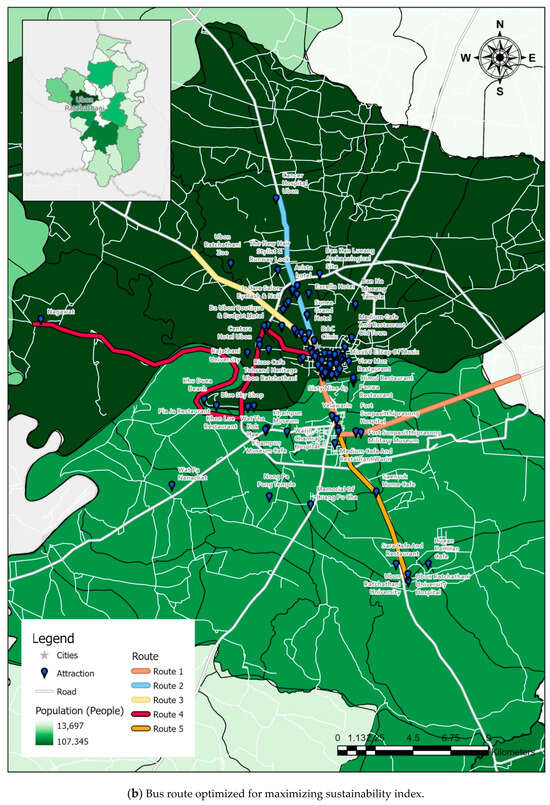
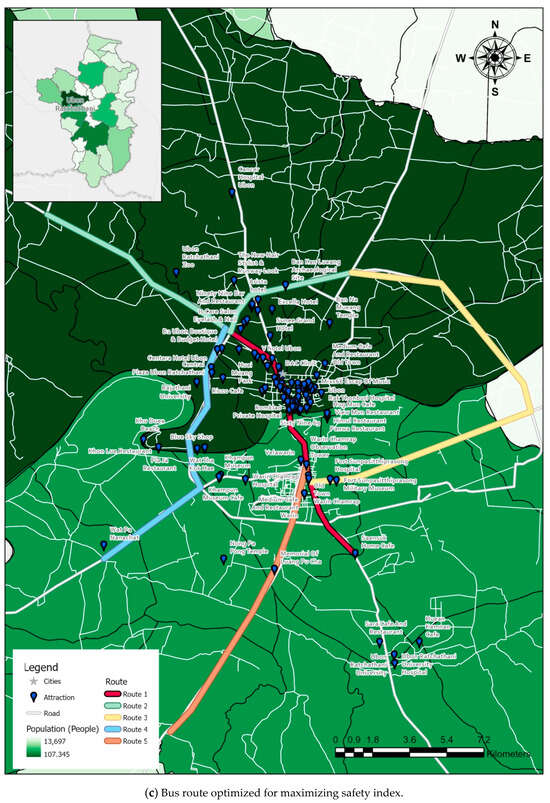
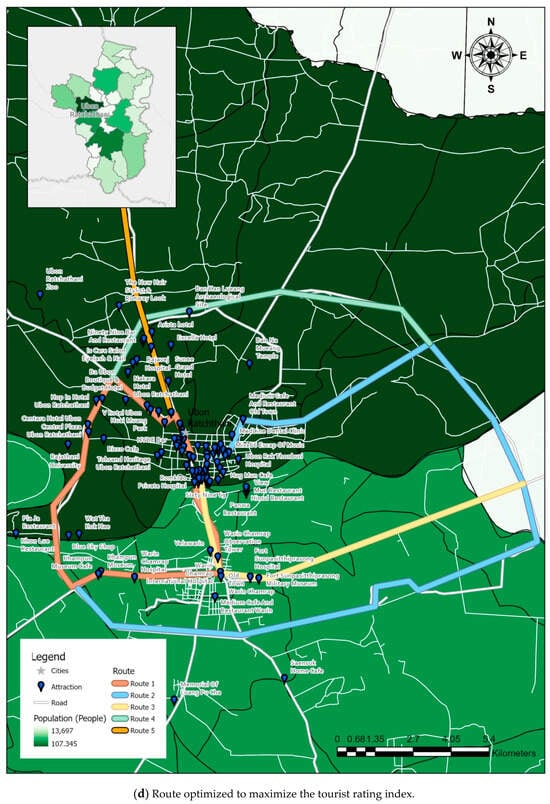
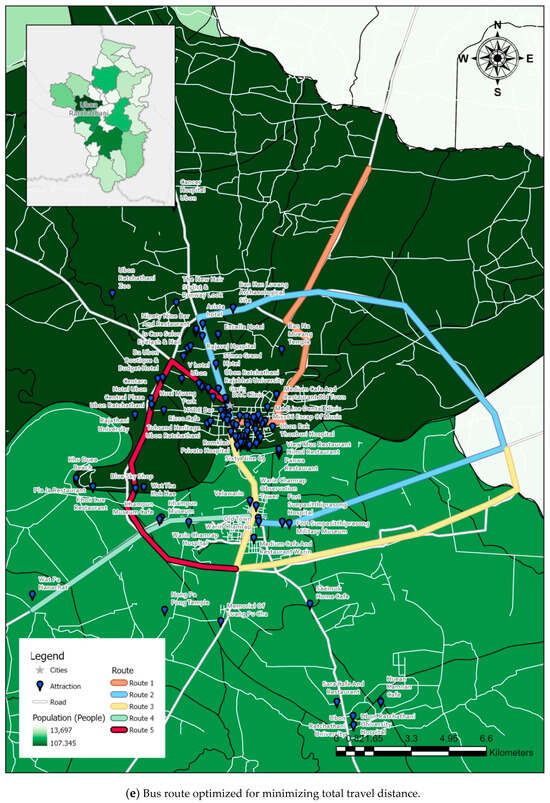
Figure 2.
Optimized bus routes for resilience, sustainability, safety, tourist rating, and travel distance minimization.
Figure 2a shows a bus route optimized for resilience, ensuring the network maintains functionality and quickly recovers from disruptions by considering alternative paths and robustness to incidents. Figure 2b illustrates a route focused on sustainability, reducing emissions, optimizing energy use, and integrating green technologies while prioritizing areas with lower environmental impact. Figure 2c depicts a route optimized for safety, taking into account accident rates, traffic conditions, and safe bus stops to provide the safest travel experience for passengers. Figure 2d presents a route designed to maximize the tourist rating index, emphasizing convenience, accessibility, and attractiveness for tourists, including stops at key attractions. Figure 2e shows a route optimized to minimize total travel distance, focusing on efficiency and reducing travel time, creating the shortest possible routes while maintaining service coverage.
The figures highlight how different optimization objectives influence bus route designs. Resilience-focused routes have alternative paths for disruptions, sustainability routes avoid high-emission areas, safety routes minimize accident-prone areas, tourist-focused routes pass major attractions, and distance-minimizing routes offer the shortest travel times. Each objective shapes the network differently, underscoring the importance of clear goals in urban transportation planning.
5. Discussion
5.1. Effectiveness of Hybrid Reinforcement Learning in Multi-Objective Optimization
The findings from the comparative analysis indicate that the Hybrid Reinforcement Learning-Variable Neighborhood Strategy Adaptive Search (H-RL-VaNSAS) algorithm provides superior results compared to other well-known optimization algorithms, including the Crested Porcupine Optimizer (CPO) [36], Krill Herd Algorithm (KHA) [37], Salp Swarm Algorithm (SSA) [38], and Manta Ray Foraging Optimization (MRFO) [39]. Specifically, H-RL-VaNSAS outperforms these algorithms in terms of the Hypervolume (HV) and Average Ratio of Pareto Optimal Solutions (ARP) metrics. These metrics demonstrate that H-RL-VaNSAS achieves a broader and more efficient coverage of the objective space and generates a higher proportion of optimal solutions.
When comparing H-RL-VaNSAS to the original Variable Neighborhood Strategy Adaptive Search (VaNSAS), the enhanced performance is evident across all evaluated metrics. The integration of reinforcement learning into VaNSAS has led to substantial improvements. The H-RL-VaNSAS algorithm achieves higher HV and ARP values, indicating more effective exploration and exploitation of the solution space. This improvement can be attributed to the adaptive nature of reinforcement learning, which enables the algorithm to learn from previous iterations and make better decisions in subsequent iterations.
The primary reason for the superior performance of H-RL-VaNSAS lies in the synergy between reinforcement learning and the VaNSAS framework. Reinforcement learning provides a mechanism for the algorithm to adaptively select the most promising neighborhoods to explore based on past experiences and rewards. This adaptive selection process enhances the efficiency of the search process, leading to better convergence rates and higher quality solutions. Additionally, reinforcement learning helps in dynamically balancing exploration and exploitation, which is crucial for solving complex optimization problems.
The original VaNSAS algorithm, while effective, lacks the adaptive decision-making capability introduced by reinforcement learning. By integrating reinforcement learning, H-RL-VaNSAS benefits from a more guided search process, which reduces the likelihood of getting trapped in local optima and improves the overall solution quality. This integration leverages the strengths of both approaches: the systematic neighborhood search of VaNSAS and the adaptive learning capability of reinforcement learning.
These findings align with previous research that emphasizes the efficacy of hybrid metaheuristic approaches. For instance, Guo et al. [24] highlighted the effectiveness of a hybrid approach combining tabu search and variable neighborhood search in urban customized bus routing, which significantly improved route flexibility and service efficiency. Similarly, Ghasedi et al. [25] demonstrated that genetic algorithms and particle swarm optimization could enhance the operational efficiency of bus transit systems. Our findings support the notion that combining metaheuristic techniques with adaptive learning mechanisms can yield superior results.
Conversely, while Ji-yang et al. [26] and Rajak et al. [27] reported significant improvements using heuristic algorithms like ant colony optimization (ACO) and simulated annealing (SA) for multi-objective vehicle routing problems, our study highlights the additional benefits of integrating reinforcement learning. The hybrid approach of H-RL-VaNSAS not only achieves similar or better optimization of total distance and workload balance but also excels in metrics such as resilience and sustainability, which were not the primary focus of these studies.
The comparative analysis clearly demonstrates that H-RL-VaNSAS provides better optimization results than both the original VaNSAS and other traditional metaheuristic algorithms. The integration of reinforcement learning into VaNSAS significantly enhances its performance by improving convergence speed, solution quality, and overall efficiency. These findings underscore the potential of hybrid algorithms in addressing complex multi-objective optimization problems in transportation planning and other domains.
5.2. Enhancing Urban Bus Route Design for Resilience, Sustainability, and Safety: An In-Depth Discussion
The integration of metaheuristic techniques in transportation planning has demonstrated significant potential in optimizing complex transportation problems. In this study, we developed a multi-objective model for designing resilient, sustainable, and safe urban bus routes. This model incorporates multiple objective functions and constraints to ensure the efficiency and practicality of the bus route design. By using the Hybrid Reinforcement Learning-Variable Neighborhood Strategy Adaptive Search (H-RL-VaNSAS) algorithm, we aimed to optimize bus routes in Ubon Ratchathani and Warinchamrab cities to achieve higher resilience, sustainability, and safety, in addition to maximizing accessibility and minimizing total travel distances.
The comparative analysis of H-RL-VaNSAS with other well-known algorithms, including Crested Porcupine Optimizer (CPO), Krill Herd Algorithm (KHA), Salp Swarm Algorithm (SSA), and Manta Ray Foraging Optimization (MRFO), reveals the strengths of incorporating hybrid approaches and reinforcement learning. The superior performance of H-RL-VaNSAS across key metrics aligns with findings in the literature that emphasize the efficacy of hybrid metaheuristic approaches.
Our results show that H-RL-VaNSAS consistently outperforms the other algorithms across various objective weight distributions. When focusing on the Resilience Index, H-RL-VaNSAS achieves the highest resilience score, significantly outperforming CPO, KHA, SSA, and MRFO. This indicates that H-RL-VaNSAS is considerably more effective in maintaining robustness and reliability in bus route optimization under varying conditions. This finding is consistent with the results of Ji-yang et al. [26], who reported that heuristic algorithms effectively optimize bus routes by minimizing vehicle running times and passenger travel times.
The Sustainability Index also sees notable improvements with H-RL-VaNSAS, surpassing the scores of CPO, KHA, SSA, and MRFO. This suggests that H-RL-VaNSAS can identify and select routes that not only optimize operational efficiency but also promote environmental and social sustainability. The incorporation of reinforcement learning appears to have provided the algorithm with an enhanced ability to balance multiple sustainability-related factors more effectively. This aligns with the work of Porto et al. [16], who emphasized the importance of integrating resilience, sustainability, and safety in urban transportation projects to enhance both sustainability and urban resilience at a city scale.
In terms of the Safety Index, H-RL-VaNSAS again outperforms the other algorithms, indicating that the hybrid algorithm can better account for and integrate safety considerations into the route design. This improvement suggests that H-RL-VaNSAS offers safer travel options for passengers, which is crucial for passenger security and overall service reliability. Similar findings were reported by Kim et al. [19], who discussed the integration of resilience into transportation systems through case studies of various disasters, offering key experiences and lessons for transportation agencies to improve their response and recovery capabilities.
While traditional methods primarily focus on maximizing accessibility and minimizing total distances, the proposed H-RL-VaNSAS model successfully addresses these objectives while also enhancing resilience, sustainability, and safety. This comprehensive approach not only ensures efficient and user-friendly bus routes but also contributes to the broader field of urban transportation by offering a more integrated and practical solution to contemporary challenges, particularly in tourism-focused regions.
The integration of reinforcement learning into the VaNSAS framework has clearly enhanced its performance across all evaluated metrics. H-RL-VaNSAS not only provides more resilient, sustainable, and safer routes but also improves tourist satisfaction and accessibility while minimizing travel distance. These results affirm the superiority of H-RL-VaNSAS in addressing the complex, multi-objective nature of bus route optimization in urban tourism contexts.
5.3. Practical Implications and Limitations of the H-RL-VaNSAS Algorithm in Urban Transportation Planning
The findings from this research present significant practical implications for urban transportation planning, especially in tourism-focused regions like Ubon Ratchathani and Warinchamrab cities. The Hybrid Reinforcement Learning-Variable Neighborhood Strategy Adaptive Search (H-RL-VaNSAS) algorithm has demonstrated superior performance in optimizing bus routes, offering a robust framework for developing efficient, resilient, and sustainable public transportation systems. Urban planners and transportation authorities can utilize this model to design bus routes that not only maximize accessibility and minimize travel distance but also enhance the resilience, sustainability, and safety of the transportation network.
Implementing H-RL-VaNSAS can lead to substantial improvements in operational efficiency, reduced environmental impact, and increased passenger satisfaction. By integrating multiple objective functions and constraints, the model ensures that bus routes are designed to handle disruptions effectively, promote environmentally friendly practices, and provide safe travel options for passengers. This holistic approach can help cities tackle the growing challenges of urbanization, such as traffic congestion and pollution, while also supporting the tourism industry by offering reliable and appealing transportation options for visitors.
The multi-objective optimization model and the H-RL-VaNSAS algorithm developed in this research are not confined to the specific case study of Ubon Ratchathani and Warinchamrab cities. The framework and methodologies can be generalized and applied to other urban areas facing similar transportation planning challenges. The model’s flexibility allows it to be adapted to different contexts, taking into account varying priorities such as resilience, sustainability, safety, accessibility, and operational efficiency.
This research contributes significantly to the broader field of urban transportation planning by showcasing the effectiveness of integrating reinforcement learning with traditional metaheuristic approaches. The H-RL-VaNSAS algorithm’s ability to optimize complex, multi-objective problems makes it a valuable tool for addressing contemporary urban transportation issues. Future studies can build on this work by exploring additional factors and constraints specific to different cities, further refining the model to enhance its applicability and effectiveness in diverse urban environments. By generalizing the principles and techniques developed here, urban planners and researchers can create more comprehensive and efficient public transportation systems worldwide.
However, this study has several limitations. The model and algorithms were tested in specific cities in Thailand, which may limit their generalizability. Broader testing in diverse urban settings is necessary. The model’s effectiveness relies on high-quality data for resilience, sustainability, safety indices, tourist demand, and travel distances. Inaccurate data can impact performance, underscoring the need for reliable data collection. The hybrid algorithm (H-RL-VaNSAS) involves complex computations, particularly for large-scale problems, which may require significant computational resources.
Real-time changes in traffic, weather, or disruptions were not accounted for in this study. Future improvements could integrate real-time data to enhance adaptability and robustness. The model primarily focuses on tourist areas, potentially overlooking the needs of regular commuters. A more balanced model addressing both tourists and residents could be more inclusive. Optimization results are sensitive to the weights assigned to different objectives. Determining appropriate weights requires careful consideration and may vary based on policy priorities. Finally, while the model shows promising simulation results, its long-term impact requires validation through real-world implementations and longitudinal studies. Addressing these limitations can improve the model’s robustness, flexibility, and applicability in urban transportation planning.
6. Conclusions
Urban transportation systems face numerous challenges due to rapid urbanization, rising population densities, and the need for sustainable and resilient infrastructure. Efficient bus route design is essential for reducing traffic congestion, lowering pollution levels, and improving the overall quality of urban life. In tourism-focused areas, such as Ubon Ratchathani and Warinchamrab cities, well-designed bus routes are crucial for enhancing tourist experiences and supporting the local economy. This research addresses the urgent need for optimizing bus routes by integrating multiple objectives: resilience, sustainability, safety, tourist preferences, and accessibility.
This study introduces a Hybrid Reinforcement Learning-Variable Neighborhood Strategy Adaptive Search (H-RL-VaNSAS) algorithm for optimizing bus routes. The mathematical model incorporates various objective functions and constraints to maximize resilience, sustainability, tourist preferences, and accessibility while minimizing total travel distance. The proposed method was compared with several well-known optimization algorithms, including Crested Porcupine Optimizer (CPO), Krill Herd Algorithm (KHA), Salp Swarm Algorithm (SSA), and Manta Ray Foraging Optimization (MRFO). Performance evaluation was conducted using the Hypervolume (HV) metric and the Average Ratio of Pareto Optimal Solution (ARP).
The H-RL-VaNSAS algorithm demonstrated superior performance across multiple metrics. It achieved the highest resilience index of 550, which is 12.24% higher than CPO, 14.58% higher than KHA, 17.02% higher than SSA, and 13.40% higher than MRFO. For the sustainability index, H-RL-VaNSAS scored 370, surpassing CPO by 5.71%, KHA by 8.82%, SSA by 12.12%, and MRFO by 7.25%. In terms of safety, H-RL-VaNSAS achieved a score of 480, outperforming CPO by 4.35%, KHA by 6.67%, SSA by 9.09%, and MRFO by 5.49%. Additionally, H-RL-VaNSAS achieved the highest tourist preferences score of 300, which is 7.14% higher than CPO, 11.11% higher than KHA, 13.21% higher than SSA, and 9.09% higher than MRFO. The accessibility score for H-RL-VaNSAS was 2300, exceeding CPO by 4.55%, KHA by 6.98%, SSA by 9.52%, and MRFO by 5.50%. Importantly, H-RL-VaNSAS minimized the total travel distance to 950 km, which is 13.64% less than CPO, 9.52% less than KHA, 17.39% less than SSA, and 12.04% less than MRFO. These computational results clearly indicate that H-RL-VaNSAS provides a more balanced optimization capability and higher efficiency in solving multi-objective problems compared to the other algorithms.
The integration of reinforcement learning with the Variable Neighborhood Strategy Adaptive Search framework significantly enhances the algorithm’s optimization capabilities. The H-RL-VaNSAS algorithm consistently outperformed the compared methods across all key performance metrics. It demonstrated improved resilience, sustainability, safety, and accessibility, while maintaining efficient total travel distances. These findings highlight the effectiveness of hybrid approaches in addressing complex urban transportation challenges and optimizing multiple conflicting objectives simultaneously.
The results of this study offer valuable insights for urban planners and transportation authorities. The H-RL-VaNSAS algorithm provides a robust framework for developing efficient, resilient, and sustainable public transportation systems. By leveraging this model, cities can design bus routes that maximize accessibility, minimize travel distances, and enhance the overall resilience, sustainability, and safety of their transportation networks. Implementing this model can lead to significant improvements in operational efficiency, reduced environmental impact, and enhanced passenger satisfaction.
Future research could explore the integration of real-time data into the H-RL-VaNSAS algorithm to enhance its adaptability and robustness in dynamic environments. Additionally, expanding the model to consider the needs of regular commuters alongside tourists could create a more inclusive transportation system. Further studies could also focus on fine-tuning the objective weights to better align with specific policy priorities and urban planning goals. Longitudinal studies and real-world implementations are necessary to validate the long-term impact and practical applicability of the proposed model in diverse urban settings.
Author Contributions
K.S.: writing—original draft preparation. R.P.: supervision, project administration. S.K.: validation. T.S. and P.E.: writing review and editing. P.L.: review, funding acquisition. S.G. and C.K.: methodology, visualization. M.K.-O.: data curation. All authors have read and agreed to the published version of the manuscript.
Funding
This research project was financially supported by Mahasarakham University.
Data Availability Statement
Data will be made available on request.
Conflicts of Interest
The authors declare no conflicts of interest.
References
- Flores-Albornoz, J.; Nirmala, M.M.; Mukthar, K.P.J.; Asnate-Salazar, E.; Ramirez, E.H.; Raju, V. Unlocking Solution for Urban Transportation Woes: Addressing the Challenges of Modern City Living. AI Bus. Innov. Res. Underst. Potential Risks AI Mod. Enterp. 2024, 440, 3–10. [Google Scholar] [CrossRef]
- Guo, H.; Wang, Y.; Shang, P.; Yan, X.; Guan, Y. Customised Bus Route Design with Passenger-to-Station Assignment Optimisation. Transp. A Transp. Sci. 2024, 20, 2214631. [Google Scholar] [CrossRef]
- Luo, S.; Nie, Y. (Marco) Integrated Design of a Bus-Bike System Considering Realistic Route Options and Bike Availability. Transp. Res. Part C Emerg. Technol. 2023, 153, 104192. [Google Scholar] [CrossRef]
- Shen, C.; Sun, Y.; Bai, Z.; Cui, H. Real-Time Customized Bus Routes Design with Optimal Passenger and Vehicle Matching Based on Column Generation Algorithm. Phys. A Stat. Mech. Its Appl. 2021, 571, 125836. [Google Scholar] [CrossRef]
- Chen, X.; Wang, Y.; Wang, Y.; Qu, X.; Ma, X. Customized Bus Route Design with Pickup and Delivery and Time Windows: Model, Case Study and Comparative Analysis. Expert Syst. Appl. 2021, 168, 114242. [Google Scholar] [CrossRef]
- Gong, M.; Hu, Y.; Chen, Z.; Li, X. Transfer-Based Customized Modular Bus System Design with Passenger-Route Assignment Optimization. Transp. Res. Part E Logist. Transp. Rev. 2021, 153, 102422. [Google Scholar] [CrossRef]
- SM, S.; Kumar, P.; Govindaraj, V. A Novel Optimization Physics-Informed Neural Network Scheme Solving Fractional Differential Equations. Eng. Comput. 2024, 40, 855–865. [Google Scholar] [CrossRef]
- SM, S.; Kumar, P.; Govindaraj, V. The Hybrid Average Subtraction and Standard Deviation Based Optimizer. Adv. Eng. Softw. 2023, 176, 103387. [Google Scholar] [CrossRef]
- Liu, L.; Li, J.; Li, A.; Zhao, J.; Chen, J.; Luo, S. Design and Simulation of Urban Variable-Route Bus. IOP Conf. Ser. Mater. Sci. Eng. 2019, 688, 022054. [Google Scholar] [CrossRef]
- Chen, W.; Liu, X.; Chen, D.; Pan, X. Setting Headways on a Bus Route under Uncertain Conditions. Sustainability 2019, 11, 2823. [Google Scholar] [CrossRef]
- Davoodi, A.A.; Tabatabaie, S.A. Evaluation of the Travel Demand and Proper Solution Suggestion for Developing Public Bus Transport: A Case Study in Ahwaz City. Urban Transp XIV. Environ. 21st Century 2008, 101, 221–229. [Google Scholar]
- De Dios Ortúzar, J.; Willumsen, L.G. Flexible Long Range Planning Using Low Cost Information. Transportation 1991, 18, 151–173. [Google Scholar] [CrossRef]
- Khakbaz, A.; Nookabadi, A.S.; Shetab Boushehri, S.N. Urban Bus Fleet Routing in Transportation Network Equipped with Park-And-Ride: A Case Study of Babol, Iran. Transport 2017, 32, 55–65. [Google Scholar] [CrossRef][Green Version]
- Singh, V.; Beaton, E.B.; Gouge, T.R.; Schatmeier, N.H. Creating a Bus Rapid Transit Boulevard: Making Woodhaven Boulevard Select Bus Service Work for Transit, Traffic, and the Public in Queens, New York. Transp. Res. Rec. 2016, 2539, 11–19. [Google Scholar] [CrossRef]
- Xu, Y.; Chan, H.-Y.; Chen, A.; Ni, Y.-Q. Proactive Resilience Building through Route Diversity: A Close Look at the Metro System from the Travelers’ Perspective. Findings 2022. [Google Scholar] [CrossRef]
- Porto, M.S.; Danilevicz, A.D.M.F.; Magalhães, R.F.D. Atributos Resilientes de Sistemas de Transporte Urbano. In Proceedings of the III Simpósio Nacional De Gestão E Engenharia Urbana:Singeurb 2021, Maceió, Brasil, 20 December 2021; pp. 604–611. [Google Scholar]
- Azolin, L.G.; Rodrigues Da Silva, A.N. Preliminary Assessment of Resilience in Urban Mobility Considering Public Transportation. Transports 2020, 28, 76–88. [Google Scholar] [CrossRef]
- Koc, E.; Cetiner, B.; Rose, A.; Soibelman, L.; Taciroglu, E.; Wei, D. CRAFT: Comprehensive Resilience Assessment Framework for Transportation Systems in Urban Areas. Adv. Eng. Inform. 2020, 46, 101159. [Google Scholar] [CrossRef]
- Kim, K.; Francis, O.; Yamashita, E. Learning to Build Resilience into Transportation Systems. Transp. Res. Rec. 2018, 2672, 30–42. [Google Scholar] [CrossRef]
- Leobons, C.M.; Campos, V.B.G.; Bandeira, R.A.D.M. A Procedure for the Evaluation of the Resilience of Transportation Systems. Transportes 2020, 28, 281–297. [Google Scholar] [CrossRef]
- Tong, L.C.; Zhou, L.; Liu, J.; Zhou, X. Customized Bus Service Design for Jointly Optimizing Passenger-to-Vehicle Assignment and Vehicle Routing. Transp. Res. Part C Emerg. Technol. 2017, 85, 451–475. [Google Scholar] [CrossRef]
- Skirkouski, S.; Sedziukevich, U.; Svichynska, O. Justification of the Choice of Public Transport Service Type on the Route. AT 2021, 48, 79–85. [Google Scholar] [CrossRef]
- Zhen, L.; Baldacci, R.; Tan, Z.; Wang, S.; Lyu, J. Scheduling Heterogeneous Delivery Tasks on a Mixed Logistics Platform. Eur. J. Oper. Res. 2022, 298, 680–698. [Google Scholar] [CrossRef]
- Guo, R.; Zhang, W.; Guan, W.; Ran, B. Time-Dependent Urban Customized Bus Routing with Path Flexibility. IEEE Trans. Intell. Transport. Syst. 2021, 22, 2381–2390. [Google Scholar] [CrossRef]
- Ghasedi, M.; Ghorbanzadeh, M.; Bargegol, I. Robust Optimization of Bus Stop Placement Based on Dynamic Demand Using Meta Heuristic Approaches: A Case Study in a Developing Country. Transp. Telecommun. J. 2021, 22, 39–52. [Google Scholar] [CrossRef]
- Sun, J.-Y.; Huang, J.-L.; Chen, Y.-Y.; Wei, P.-Y.; Jia, J.-L. Flexible Bus Route Optimization for Multitarget Stations. Math. Probl. Eng. 2020, 2020, 7183465. [Google Scholar] [CrossRef]
- Rajak, S.; Parthiban, P.; Dhanalakshmi, R.; Sujith, S. Multi-Objective Optimisation for the Vehicle Routing Problem Using Metaheuristics. IJENM 2018, 9, 117. [Google Scholar] [CrossRef]
- Khoo, H.L.; Teoh, L.E.; Meng, Q. A Bi-Objective Optimization Approach for Exclusive Bus Lane Selection and Scheduling Design. Eng. Optim. 2014, 46, 987–1007. [Google Scholar] [CrossRef]
- Teng, J.; Yang, X.; Li, X.; Zhao, M. Coordinated Optimization of Bus Headways for Passenger Corridors. In Proceedings of the 2009 International Joint Conference on Computational Sciences and Optimization, Sanya, China, 24–26 April 2009; IEEE: Piscataway, NJ, USA, 2009; pp. 981–985. [Google Scholar]
- Fónai Kende, A.; Sipos, E. The Impact of Public Transport on the Tourist Experience. TURBULL 2023, 23, 32–39. [Google Scholar] [CrossRef]
- Kovalenko-Marchenkova, Y.; Martseniuk, L.; Andryeyeva, N. Railway Tourism in Providing the Sustainable and Smart Population Mobility. IOP Conf. Ser. Earth Environ. Sci. 2023, 1269, 012021. [Google Scholar] [CrossRef]
- José Antonio Fernández Cuesta, J.A. Las Carreteras y Autopistas En La Promoción Del Turismo En España: El Castro de Santa Susana. ET 1968, 19, 133–147. [Google Scholar] [CrossRef]
- Jais, A.S.; Marzuki, A. Multi-Modality at Tourism Destination: An Overview of the Transportation Network at the UNESCO Heritage Site Melaka, Malaysia. Int. J. Sup. Chain. 2019, 8, 1121–1131. [Google Scholar]
- Michniak, D. Role of Railway Transport in Tourism: Selected Problems and Examples in Slovakia. Quaest. Geogr. 2016, 35, 107–120. [Google Scholar] [CrossRef]
- Kanimozhi, S.; Sherlin, P.D. Role of Indian Railways in Tourism Industry. Int. J. Sci. Res. 2016, 5, 133–134. [Google Scholar]
- Abdel-Basset, M.; Mohamed, R.; Abouhawwash, M. Crested Porcupine Optimizer: A New Nature-Inspired Metaheuristic. Knowl.-Based Syst. 2024, 284, 111257. [Google Scholar] [CrossRef]
- Forghani, M.; Soltanaghaei, M.; Zamani Boroujeni, F. Dynamic Optimization Scheme for Load Balancing and Energy Efficiency in Software-Defined Networks Utilizing the Krill Herd Meta-Heuristic Algorithm. Comput. Electr. Eng. 2024, 114, 109057. [Google Scholar] [CrossRef]
- Dai, J.; Fu, L. A Wind Speed Forecasting Model Using Nonlinear Auto-Regressive Model Optimized by the Hybrid Chaos-Cloud Salp Swarm Algorithm. Energy 2024, 298, 131332. [Google Scholar] [CrossRef]
- Spea, S.R. Optimizing Economic Dispatch Problems in Power Systems Using Manta Ray Foraging Algorithm: An Oppositional-Based Approach. Comput. Electr. Eng. 2024, 117, 109279. [Google Scholar] [CrossRef]
- Pitakaso, R.; Sethanan, K.; Theeraviriya, C. Variable Neighborhood Strategy Adaptive Search for Solving Green 2-Echelon Location Routing Problem. Comput. Electron. Agric. 2020, 173, 105406. [Google Scholar] [CrossRef]
- Nanthasamroeng, N.; Khonjun, S.; Srichok, T.; Pitakaso, R.; Akkararungroeungkul, R.; Jirasirilerd, G.; Sirisan, S. Transborder Logistics Network Design for Agricultural Pproduct Transportation in the Greater Mekong Subregion. Asian J. Shipp. Logist. 2022, 38, 245–262. [Google Scholar] [CrossRef]
- Li, K.; Zhang, T.; Wang, R. Deep Reinforcement Learning for Multiobjective Optimization. IEEE Trans. Cybern. 2021, 51, 3103–3114. [Google Scholar] [CrossRef]
- Silva-Rodriguez, J.; Li, X. Decentralized Micro Water-Energy Co-Optimization for Small Communities. Electr. Power Syst. Res. 2024, 234, 110611. [Google Scholar] [CrossRef]
- Zhang, Y.; Chen, G.; Cheng, L.; Wang, Q.; Li, Q. Methods to Balance the Exploration and Exploitation in Differential Evolution from Different Scales: A Survey. Neurocomputing 2023, 561, 126899. [Google Scholar] [CrossRef]
- Tessari, M.; Iacca, G. Reinforcement Learning Based Adaptive Metaheuristics. In Proceedings of the Genetic and Evolutionary Computation Conference Companion, Boston, MA, USA, 9–13 July 2022; ACM: New York, NY, USA, 2022; pp. 1854–1861. [Google Scholar]


Disclaimer/Publisher’s Note: The statements, opinions and data contained in all publications are solely those of the individual author(s) and contributor(s) and not of MDPI and/or the editor(s). MDPI and/or the editor(s) disclaim responsibility for any injury to people or property resulting from any ideas, methods, instructions or products referred to in the content. |
© 2024 by the authors. Licensee MDPI, Basel, Switzerland. This article is an open access article distributed under the terms and conditions of the Creative Commons Attribution (CC BY) license (https://creativecommons.org/licenses/by/4.0/).