Abstract
With the vigorous development of big data and cloud computing, containers are becoming the main platform for running applications due to their flexible and lightweight features. Using a container cluster management system can more effectively manage multiocean containers on multiple machine nodes, and Kubernetes has become a leader in container cluster management systems, with its powerful container orchestration capabilities. However, the current default Kubernetes components and settings have appeared to have a performance bottleneck and are not adaptable to complex usage environments. In particular, the issues are data distribution latency, inefficient cluster backup and restore leading to poor disaster recovery, poor rolling update leading to downtime, inefficiency in load balancing and handling requests, poor autoscaling and scheduling strategy leading to quality of service (QoS) violations and insufficient resource usage, and many others. Aiming at the insufficient performance of the default Kubernetes platform, this paper focuses on reducing the data distribution latency, improving the cluster backup and restore strategies toward better disaster recovery, optimizing zero-downtime rolling updates, incorporating better strategies for load balancing and handling requests, optimizing autoscaling, introducing better scheduling strategy, and so on. At the same time, the relevant experimental analysis is carried out. The experiment results show that compared with the default settings, the optimized Kubernetes platform can handle more than 2000 concurrent requests, reduce the CPU overhead by more than 1.5%, reduce the memory by more than 0.6%, reduce the average request time by an average of 7.6%, and reduce the number of request failures by at least 32.4%, achieving the expected effect.
MSC:
68M10; 68M14; 68M20; 68T07; 68T09; 68T20; 68T37
1. Introduction
In cloud computing, virtual infrastructure based on virtual machines has been widely used to support various businesses. A virtual machine is software that contains an operating system, application program set, and related data. They run on top of the hypervisor, which is located on the basic operating system. In addition to emulating an operating system, a virtual machine can also provide isolation for each operating system [1,2]. In the case of an uncertain service load, this resource management method using traditional virtual machines as resource schedulers is difficult to maintain. To improve the flexibility and efficiency of the cloud, people turn their attention to containerization—an important lightweight virtualization technology that can help developers deploy modern applications faster and more efficiently [3,4,5].
Containerization is a way of running multiple software applications on the same machine. Each program runs in an isolated environment called a container. Each container has all the files and libraries needed for normal operation [3,4,5]. Namespace technology allows multiple containers to be directly deployed on the same machine and share resources, and containers can be created, deployed, and destroyed in a faster way. These advantages make the container lightweight, efficient, and low-cost. As container technology gains more traction among developers, many organizations are starting to use container technology to deploy applications in production. As the number of containers increases, container management and orchestration becomes challenging. To operate and manage multiple containers, a container orchestration platform is required to run and jointly manage multiple container instances. Currently, the most popular containers and container orchestration platforms are Docker [3,6,7] and Kubernetes [3,8,9,10].
Docker works with packaging applications and their dependencies. The containerization scheme employed by Docker allows for the creation of multiple containers using a single image and a shared operating system [3,6,7]. Docker itself cannot automatically schedule and scale containers, a container management system is needed to maximize the capabilities and benefits of containers, and Kubernetes is one of the most iconic of these systems. Kubernetes, K8s in short, is used for managing containers and it is most widely used [3,8,9,10]. Kubernetes, built on container technology, provides simple functions such as resource scheduling, service discovery, high availability management, and elastic scaling for cross-host containerized applications. It provides improved management tools to support development, deployment, operation monitoring, etc. It can realize application development, automatic management of multiplatform transplantation, and other functions. However, we observe that Kubernetes has several areas that need improvement, especially, the performance of native components of Kubernetes cannot cope with complex application requirements, e.g., large-scale services and applications in cloud computing, edge computing, and many others. As stated earlier, Kubernetes with default components and settings encounter issues, such as high data distribution latency [11,12], inefficiency in cluster backup and restore leading to poor disaster recovery [13,14], poor rolling update leading to downtime [15,16,17], inefficiency in load balancing and handling requests [18], poor autoscaling [10,19] and scheduling strategy [20,21,22,23] leading to quality of service (QoS) violations and insufficient resource usage, and many others. To this end, in this study, our goal is to enhance cloud computing systems and services while optimizing Kubernetes. With Kubernetes toward enhancing cloud computing services, the biggest challenge is to choose better-performing components while replacing native components and using appropriate methods to optimize. Our plan is to select different components for testing and perform comparative analysis, modify the underlying architecture at the same time, and finally verify the results through detailed experiments. To this end, we focus on improving the performance of K8s cloud computing by using new components and modifying K8s architecture. In essence, we explore the following areas in great detail:
- Optimizing the data distribution latency, alongside improving the cluster backup and restore strategies toward better disaster recovery.
- Reducing configuration time and optimizing zero-downtime rolling updates while improving the robustness of Kubernetes services.
- Optimizing autoscaling strategies for Kubernetes toward optimizing cloud applications and services.
- Introducing a viable Scheduler for Kubernetes toward optimal load balancing and scheduling.
- Exploring different open-source frameworks toward end-to-end enhancement of Kubernetes.
The rest of this article is organized as follows. Section 2 (Architecture and Principles of Kubernetes) presents the architecture, key features, and the major components of Kubernetes. Section 3 (Default Kubernetes Cluster and Limitations) introduces the various performance problems of Kubernetes and proposes viable optimization strategies. Section 4 (Proposed Approach) demonstrates the approaches we follow, adopt, and propose. Section 5 (Experiments) presents the overall experimental analysis and results. Section 6 (Related Work) presents a literature review in the context of our analysis. The conclusion and future work are in the last section.
2. Architecture and Principles of Kubernetes
Kubernetes was proposed by Google in 2015 as a container orchestration platform that can deploy applications on multiple host servers [3,8,9,10]. As stated earlier, Kubernetes, built on container technology, provides simple functions such as resource scheduling, service discovery, high availability management, and elastic scaling for cross-host containerized applications. It provides improved management tools to support development, deployment, operation monitoring, etc. It can realize application development, automatic management of multiplatform transplantation, and other functions. In this section, we briefly present the architecture, features, and components of Kubernetes related to our study.
2.1. Kubernetes Architecture
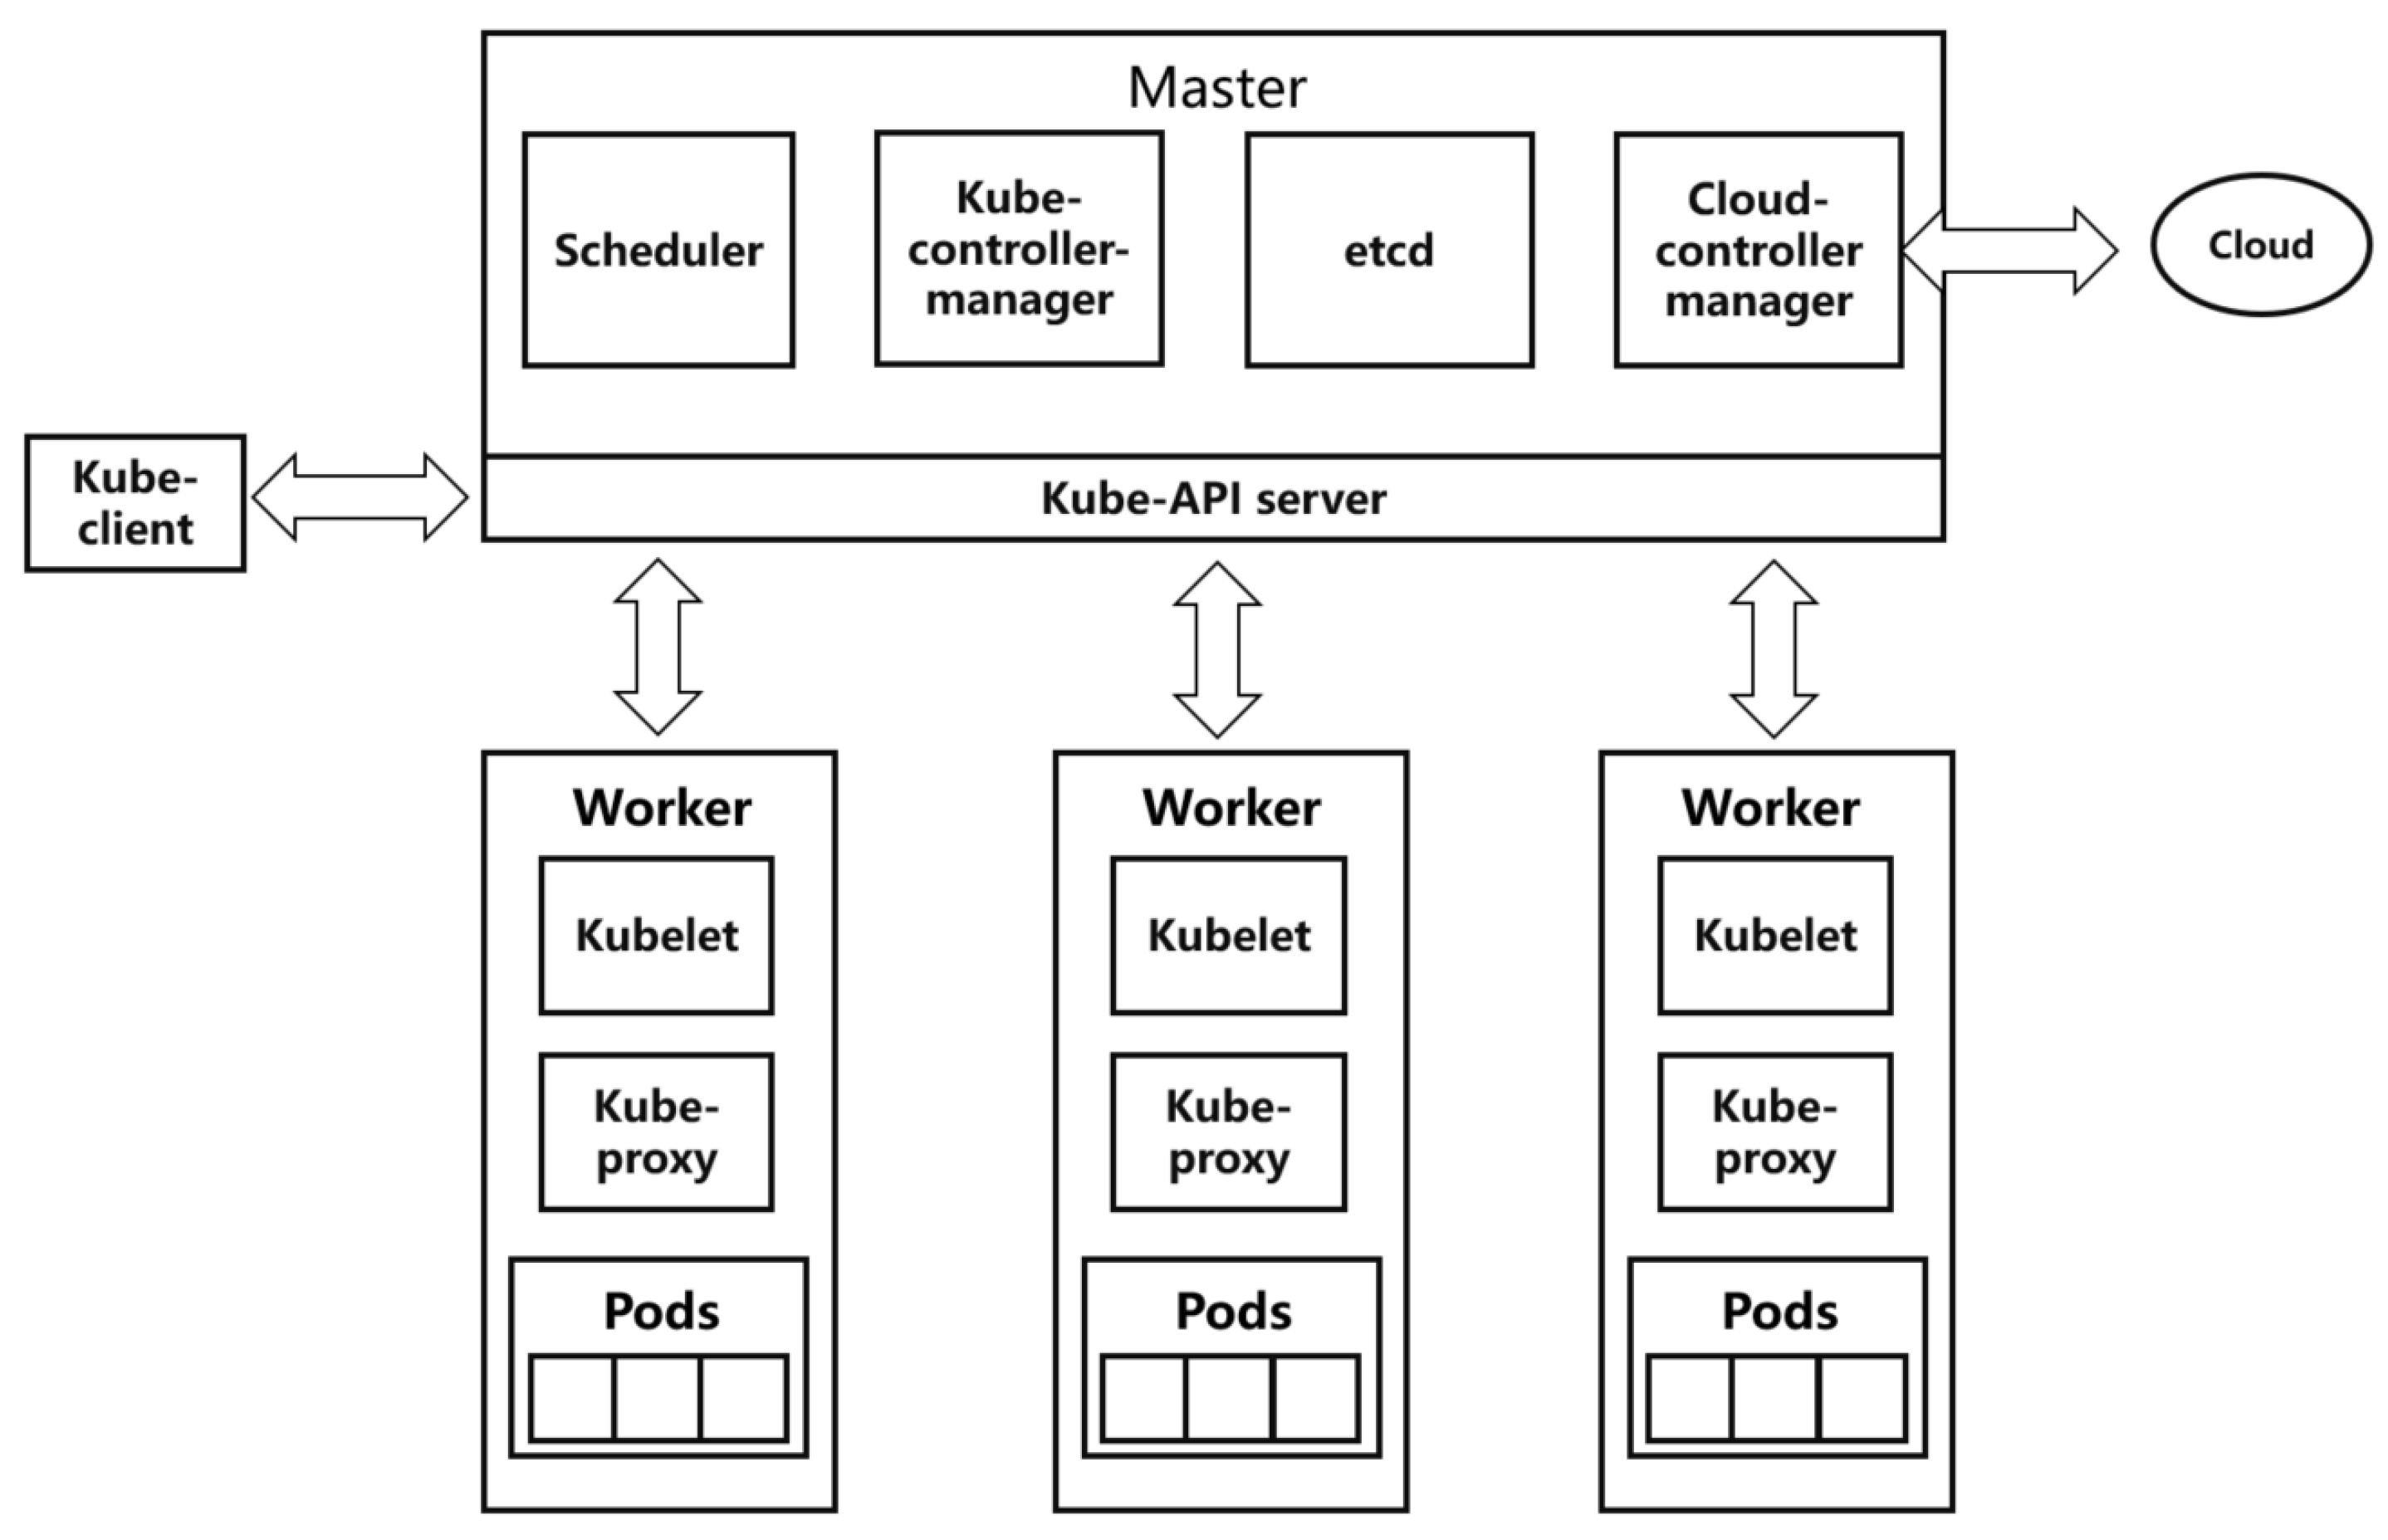
Kubernetes is a master–slave distributed architecture, mainly composed of master nodes, worker (node) nodes, and client command line tools. The specific architecture diagram is shown in Figure 1.
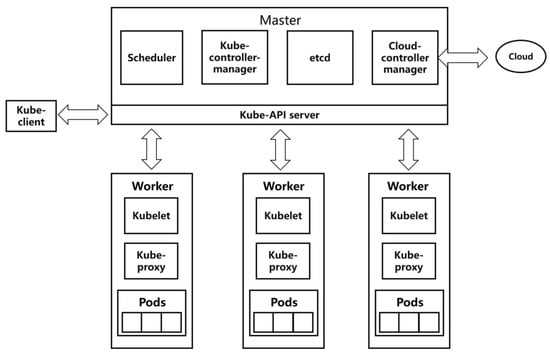
Figure 1.
Kubernetes architecture.
2.1.1. Master Node
The master node is the main control node of the Kubernetes cluster, which is responsible for task allocation, resource scheduling, and application management of the entire cluster. API Server, Controller Manager, Schedule, and ETCD are all important components of master nodes. We demonstrate them briefly, as follows:
- API Server connects various components in the Kubernetes cluster, implements specific operations on each object in the cluster, and provides services such as addition, deletion, modification, and query for resource objects.
- Controller Manager is the administrator and control center in the Kubernetes cluster. If any node is abnormal in the system, Controller Manager detects and handles the abnormality in time.
- Scheduler is the default resource scheduler for the Kubernetes cluster. Scheduler schedules pending Pods to the expected nodes according to the expected policy. The new Pod object created by the Controller Manager is received by Scheduler, which finds a suitable node schedule for it and then writes the binding information to ETCD through the API Server.
- ETCD is a key–value store used to store various information in the cluster, with high availability and persistence, and maintains the stable operation of the Kubernetes cluster.
Now, we jump to the worker node.
2.1.2. Worker Node
The worker node is the working node that executes tasks and consumes resources in the Kubernetes cluster, receives tasks assigned by the master node, and completes the tasks under the control of the master node. A worker node mainly consists of the following two parts:
- The kubelet service process runs on each node of the cluster, executes the tasks delivered by the master node, and manages the entire life cycle of the container. In addition, kubelet also pays attention to the status of the nodes and reports the running status and resource usage of all worker nodes to the master control node in real time.
- The service process of Kube-proxy runs on each worker node and forwards the access request received by Service to the backend.
2.2. Kubernetes Features
Kubernetes comes with the following key features:
- Automation. Kubernetes allows users to automatically expand capacity, automatically update, automatically deploy, and automatically manage resources during use and has a set of default automation mechanisms.
- Service-centric. The design idea of Kubernetes is service-centric, users do not need to care about how to install or run and can focus more on processing business logic.
- High availability. Kubernetes regularly checks the status of each Pod instance, including the number of instances, the health status of the instance, etc. and ensures the high availability of Kubernetes by creating multiple master and ETCD clusters.
- Rolling updates. Kubernetes can complete application updates, replacement, and other operations without stopping its internal program operation and external services, saving a lot of time and resources.
2.3. Kubernetes Components
Users can use the kubectl tool to operate resource objects such as Pod, Label, Replication Controller, ReplicaSet, Deployment, and Service and store the results persistently in ETCD. We demonstrate them briefly, as follows:
- Pod is the basic unit of scheduling in Kubernetes. In addition to the user business container, each Pod also contains a pause container called the “root container”. Each Pod also contains one or more user business containers that are closely related to the business.
- Label in Kubernetes exists as a key–value pair. The key and value in the key–value pair need to be defined by the user. Users can implement multidimensional management of resources in the label.Replication Controller is one of the core components of the Kubernetes system. It can be used to manage a set of Pods defined in the YAML file, ensuring that the number of Pod copies of the application meets the user-defined value throughout the life cycle.
- ReplicaSet helps monitor all the Pods. Particularly, ReplicaSet assists Deployment in maintaining the availability of Pods to a desired level.
- Deployment helps manage ReplicaSet and Pods. In addition, it is used for rolling updates while applications in Pods need to be updated. Moreover, it helps auto-scale Pods with the help of Horizontal Pod Autoscaler (HPA) [24]. Specifically, autoscaling is one of the most important features of Kubernetes. It allows containerized applications and services to run automatically and flexibly.
- Service can provide a common access address for a group of containers with the same function and can also send requested loading tasks to each container. The client requests access to a set of Pod copies through the address provided by the service, and the service successfully connects to the backend Pod copies through the label selector.
- Ingress helps bind requests to the Services, especially used for large-scale demands. It also provides load balancing. Generally, an Ingress controller is needed in the cluster to redirect the incoming requests to the ingress resource, which later is redirected to the appropriate endpoint.
We observe that many other Kubernetes components are useful for application development, deployment, and maintenance. Therefore, we refer to the official documentation of Kubernetes (Kubernetes Official Documentation https://kubernetes.io/docs/home/, accessed on 7 August 2024) for the details.
3. Default Kubernetes Cluster and Limitations
We observe that using the default components and settings of K8s can no longer adapt to increasingly complex usage scenarios. Numerous K8s default components affect the performance of K8s. Components such as Horizontal Pod Autoscaler and Ingress controller can handle limited usage scenarios; however, they cannot handle complex data changes in a timely manner. A set of basic settings including rolling update policy, ETCD backup policy, scheduler algorithm, and others also affects the performance of the K8s platform. In this section, we introduce the capabilities and limitations of Kubernetes’ components, and finally, we propose a system framework for dealing with these issues.
3.1. ETCD Data Distribution and Latency
ETCD, as the backend database for storing all cluster data in Kubernetes, uses the Raft algorithm [11,12] to replicate requests. The Raft algorithm has the ability of consistency and high availability, which can ensure the consistency of data among members. The consensus algorithm is limited by two physical constraints: network IO latency and disk IO latency. The Raft algorithm requires metadata to be stored in a log, and ETCD cluster members need to write each request to disk. If the disk IO delay is too large, the heartbeat in the Raft algorithm may time out and re-elect the leader, thus affecting the performance of ETCD. In addition, the heartbeat is an indispensable part of the Raft algorithm. When the heartbeat sent by a member of the Raft algorithm cannot be received due to network problems, the member may also restart the election of the leader, which affects the performance of ETCD. This means that it also needs to be considered Network IO latency.
3.2. ETCD Backup and Restore and Issue
ETCD saves the state of the entire cluster, which can quickly restore the system in the event of a failure and prevent permanent data loss. Backing up and restoring data by backing up ETCD is an easy and straightforward way. ETCD’s snapshot operation can create a snapshot of the running cluster for replication, backup, or migration to a new cluster. ETCD’s restore operation restores cluster data from a cluster data snapshot. The snapshot and recovery operations of ETCD can be used to back up and migrate clusters, but the backup function of ETCD does not have the ability to back up objects such as Type, Namespace, and Label and cannot meet the needs of users to back up specific resources.
3.3. Rolling Update Performance and Issue
Rolling updates are the default update strategy used by Kubernetes. This strategy ensures that at least a set of Pods are running when an update is performed, preventing application downtime. Old Pods do not shut down until the newly deployed version of the Pod is up and ready to handle traffic. The kubectl drain command of K8s can transfer all Pods and reschedule all Pods to other nodes to realize cluster replacement. First, during the execution of this instruction, the specified node is marked as NoSchedule, and other Pods cannot be (are not) scheduled to this node. The drain operation then starts evicting the Pod from the specified node and shuts down the currently running container on the node by sending the TERM (terminate) signal to the Pod’s underlying container. However, there are still two factors that may cause service interruption during the drain operation:
- The application service needs to be able to handle the TERM signal. If the container cannot handle the signal normally during execution (such as committing a database transaction), the Pod is still closed ungracefully.
- All Pods that provide services to the application are lost. When a new container is started on a new node, the services may be down, or if the Pods are not deployed using the controller, they may never be restarted.
3.4. Ingress and Ingress Controller in Handling Requests and Issue
Ingress [18,25] is one of the standard resource types of the Kubernetes API. It defines many rules for forwarding requests to specified service resources according to the host or URL path and forwarding the request traffic outside the cluster to the corresponding service in the cluster [26]. The Ingress controller [18,27] is a component that realizes dynamic configuration according to the Ingress configuration file and is responsible for specific forwarding. When the Ingress controller starts booting, it uses a couple of load-balancing policy settings that apply to all Ingress. The Ingress controller continuously monitors the changes in Ingress, service, and other objects through the Kube-apiserver, automatically updates the configuration file, and applies the new configuration once a change occurs. Kubernetes Ingress is the Ingress controller recommended by Kubernetes by default. Its main advantages are simplicity and few configuration files. The disadvantage of Kubernetes Ingress is that the time it takes to modify and reload the configuration file becomes longer as the routing configuration file becomes larger, which seriously affects the quality of service and even causes service interruption.
3.5. Horizontal Pod Autoscaler (HPA) and Issue
HPA is the most widely used autoscaling component in Kubernetes. HPA can automatically scale the number of Pods in ReplicationController, Deployment, ReplicaSet, and StatefulSet based on CPU utilization. The status change in the resource triggers the operation of Kube-controller-manager and periodically adjusts the Replication Controller or the number of replications in the deployment, which makes the observed index value of the Pod’s average CPU utilization match the target value set by the user. In each synchronization cycle of HPA, Kube-controller-manager queries data from the metrics server according to the indicators defined in each cycle, and cAdvisor (cAdvisor (Container Advisor) https://github.com/google/cadvisor, accessed on 7 August 2024) [28] is responsible for providing indicators to metrics server. However, because of the autoscaler sync period and the data reporting period, using cAdvisor cannot obtain more timely data, nor can it obtain the average trend of indicators.
3.6. Scheduling Model and Issue
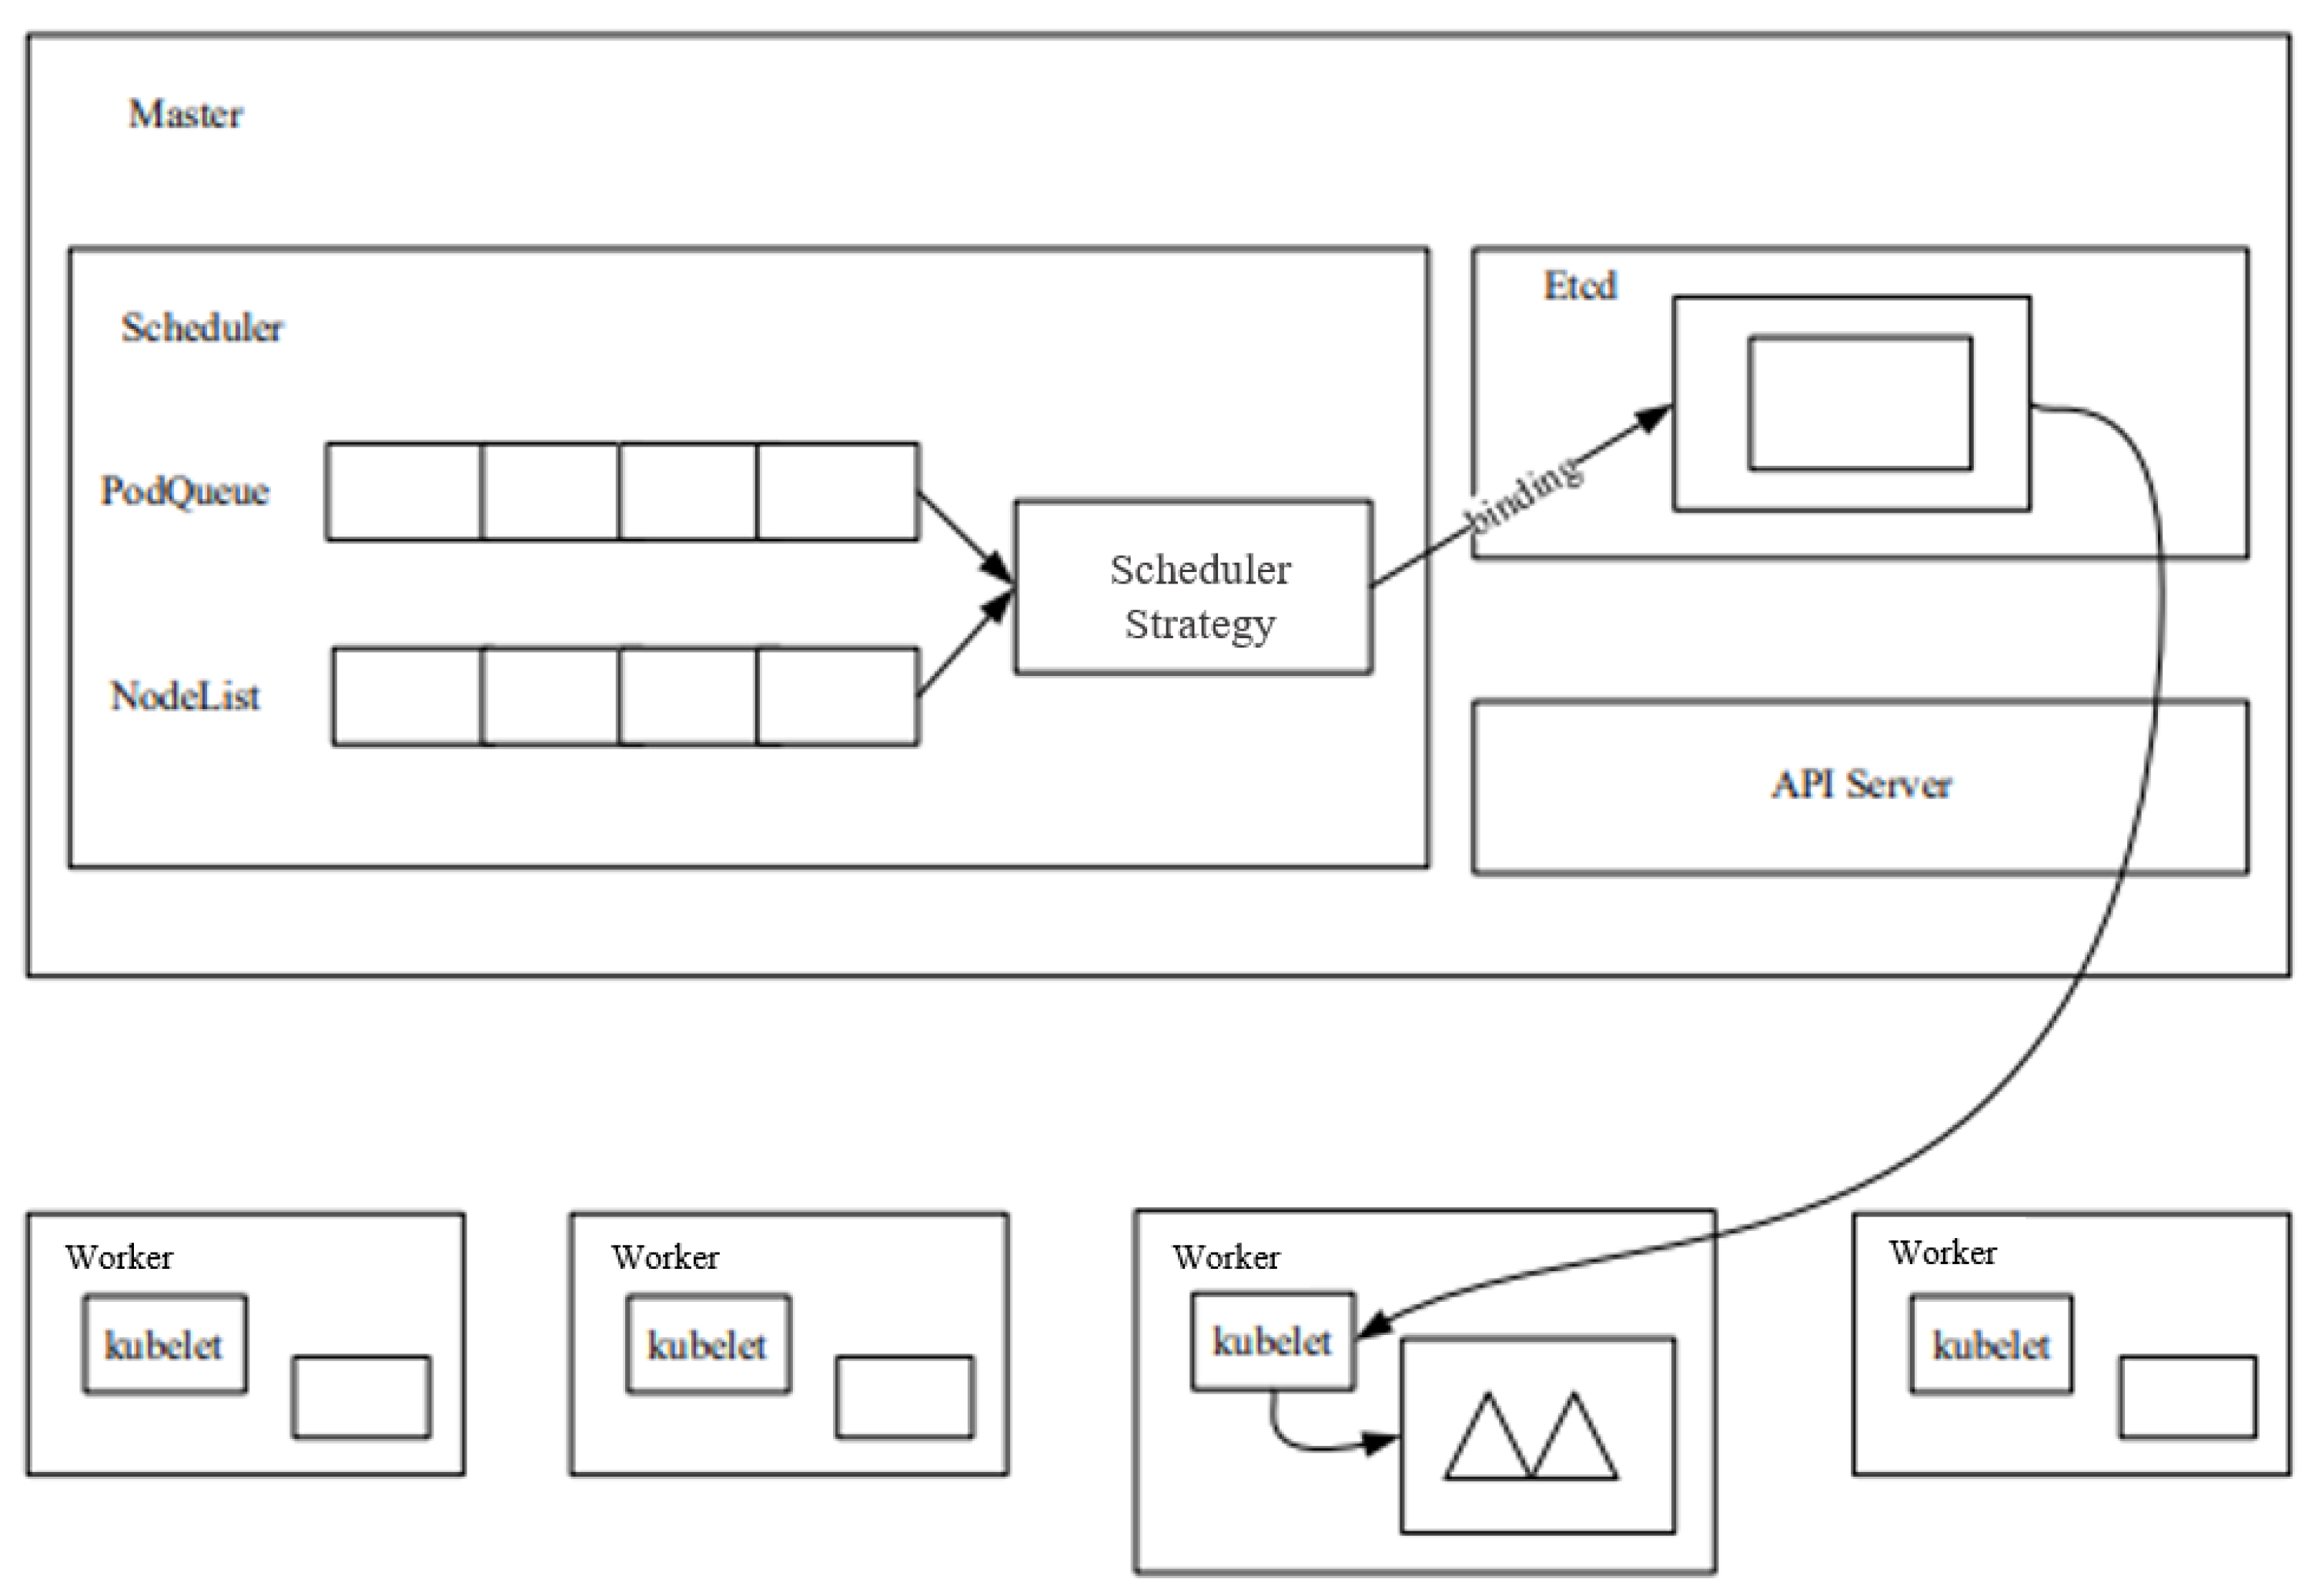
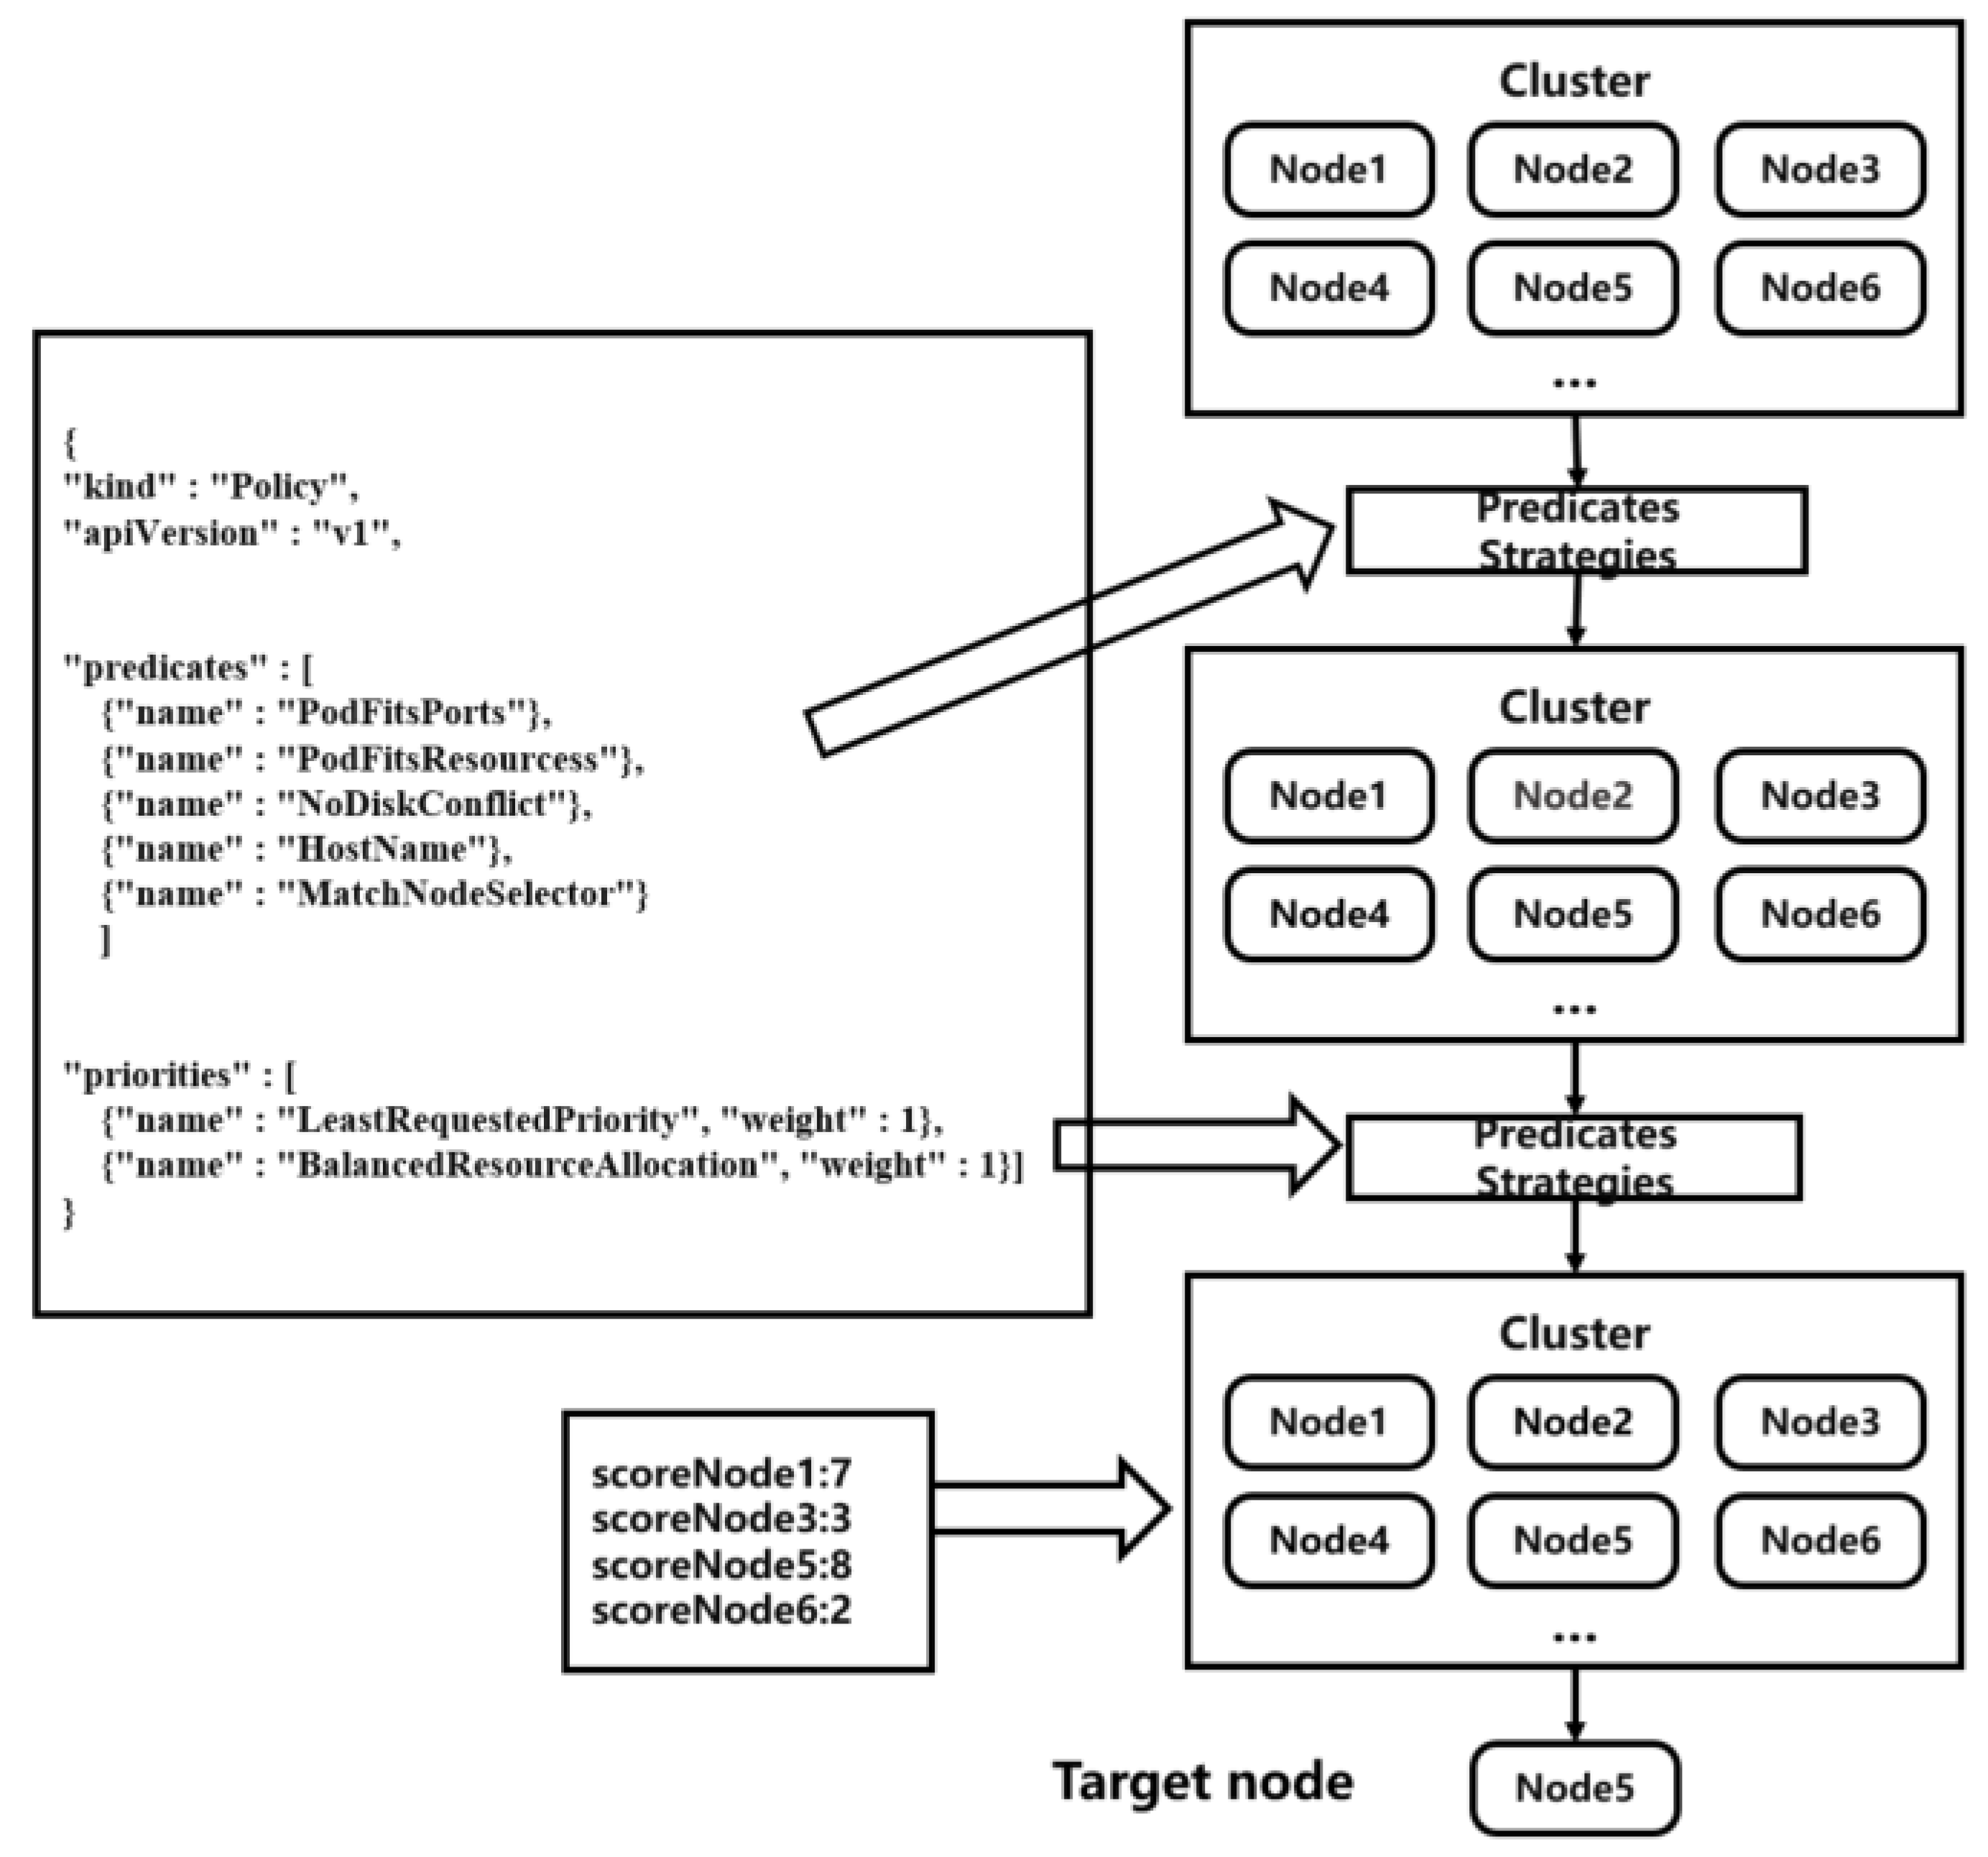
The Kubernetes cluster implements the scheduling of Pod applications through the component Kube-scheduler. First, the Kube-scheduler binds the Pod application to be scheduled to the most appropriate node in the cluster according to Kubernetes’ default (and customisable) scheduling policy, after going through the appropriate preselection and preference phases. Metadata about bindings (including node and Pod applications) are stored in Kubernetes’ ETCD database. The Kubernetes resource scheduling model is shown in Figure 2. We briefly present the execution process of the Kubernetes cluster scheduler, as follows:
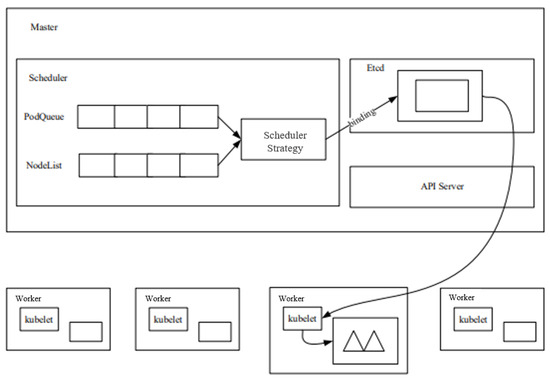
Figure 2.
Kubernetes resource scheduling model, adapted from [29].
- (1)
- The user sends a request to the API Server to create a Pod through the Rest interface of the API Server or the Kubernetes client tool (supported data types include JSON and YAML).
- (2)
- API Server handles user requests and stores Pod data in ETCD. The scheduler looks at unbound Pods through the APIServer. Attempts to allocate a node to the Pod.
- (3)
- Filter nodes: Scheduler screens each node according to the preselection algorithm, and eliminates the nodes that do not meet the requirements.
- (4)
- Host scoring: Scheduler scores the nodes screened out in the preselection algorithm. Each optimization algorithm has a different scoring focus, and each scoring algorithm has a different weight. Finally, the weighted average of the scoring results of each algorithm is the final score of a certain node.
- (5)
- Select node: Scheduler selects the node with the highest score in the optimization algorithm, binds the Pod to this node, and stores the binding information in ETCD.
Figure 3 shows the scheduling process. In the following, we demonstrate the Scheduler Algorithm.
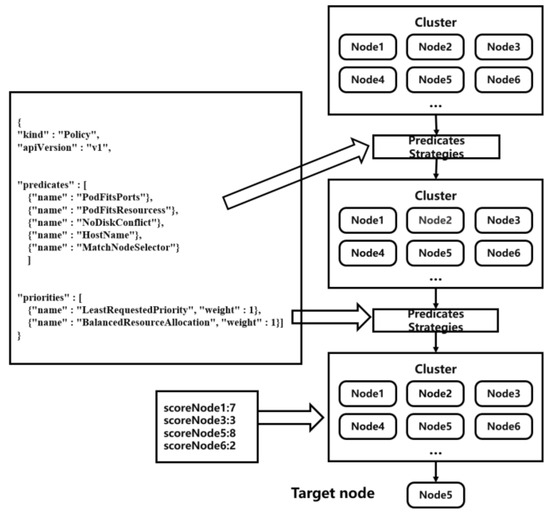
Figure 3.
Scheduler scheduling flowchart, adapted from [30].
Scheduling Algorithm
In Kubernetes, there are a number of built-in Predicate and Priority preference algorithms to choose from, which can be specified by the user at the time of use via the resource description file:
- (1)
- PodFitsHost. This algorithm specifies to run on a node by setting the node name.
- (2)
- PodFitsResources. Checks whether the available resources of the node meet the request amount of the Pod.
- (3)
- PodFitsHostPorts. Checks whether the port requested by the Pod is already occupied by the node.
- (4)
- PodSelectorMatches. Checks whether the node matches the label parameter.
- (5)
- CheckNodeMemoryPressure. Checks whether there is pressure on the memory of the node.
- (6)
- CheckNodeDiskPressure. Checks whether there is pressure on the disk space of the node.
- (7)
- NoDiskConflict. Checks whether the mounted storage volume conflicts with the storage volume in the Pod configuration file.
The Priority optimization algorithm lists the following:
- (1)
- LeastRequestedPriority. Selects the node with the least resource consumption from the node list first, and the resource includes the sum of CPU and memory.
- (2)
- SelectorSpreadPriority. Selects nodes different from the Pod under the same RC from the node list first. The smaller the number of Pod copies, the greater the score.
- (3)
- ImageLocalityPriority. Prioritizes selecting nodes with existing images from the node list to avoid spending time pulling images.
After the optimization process, each set optimization algorithm returns a score. In addition, each function also has a weight when it is set. Based on the two, the total score of each node is calculated, and the node with the highest score is selected for bind and run. Since the scheduler does not use the actual resource usage of the node as the basis for scheduling, the node scores it gives do not reflect the real situation of the node and there are a set of scheduling errors. In addition, in the original scheduling algorithm, the preselection stage mainly focuses on hardware resources such as the CPU, memory, and disk space of the node, without considering the network I/O of the node, which leads to a large gap in the network I/O of each node.
3.7. Our Proposed System Framework
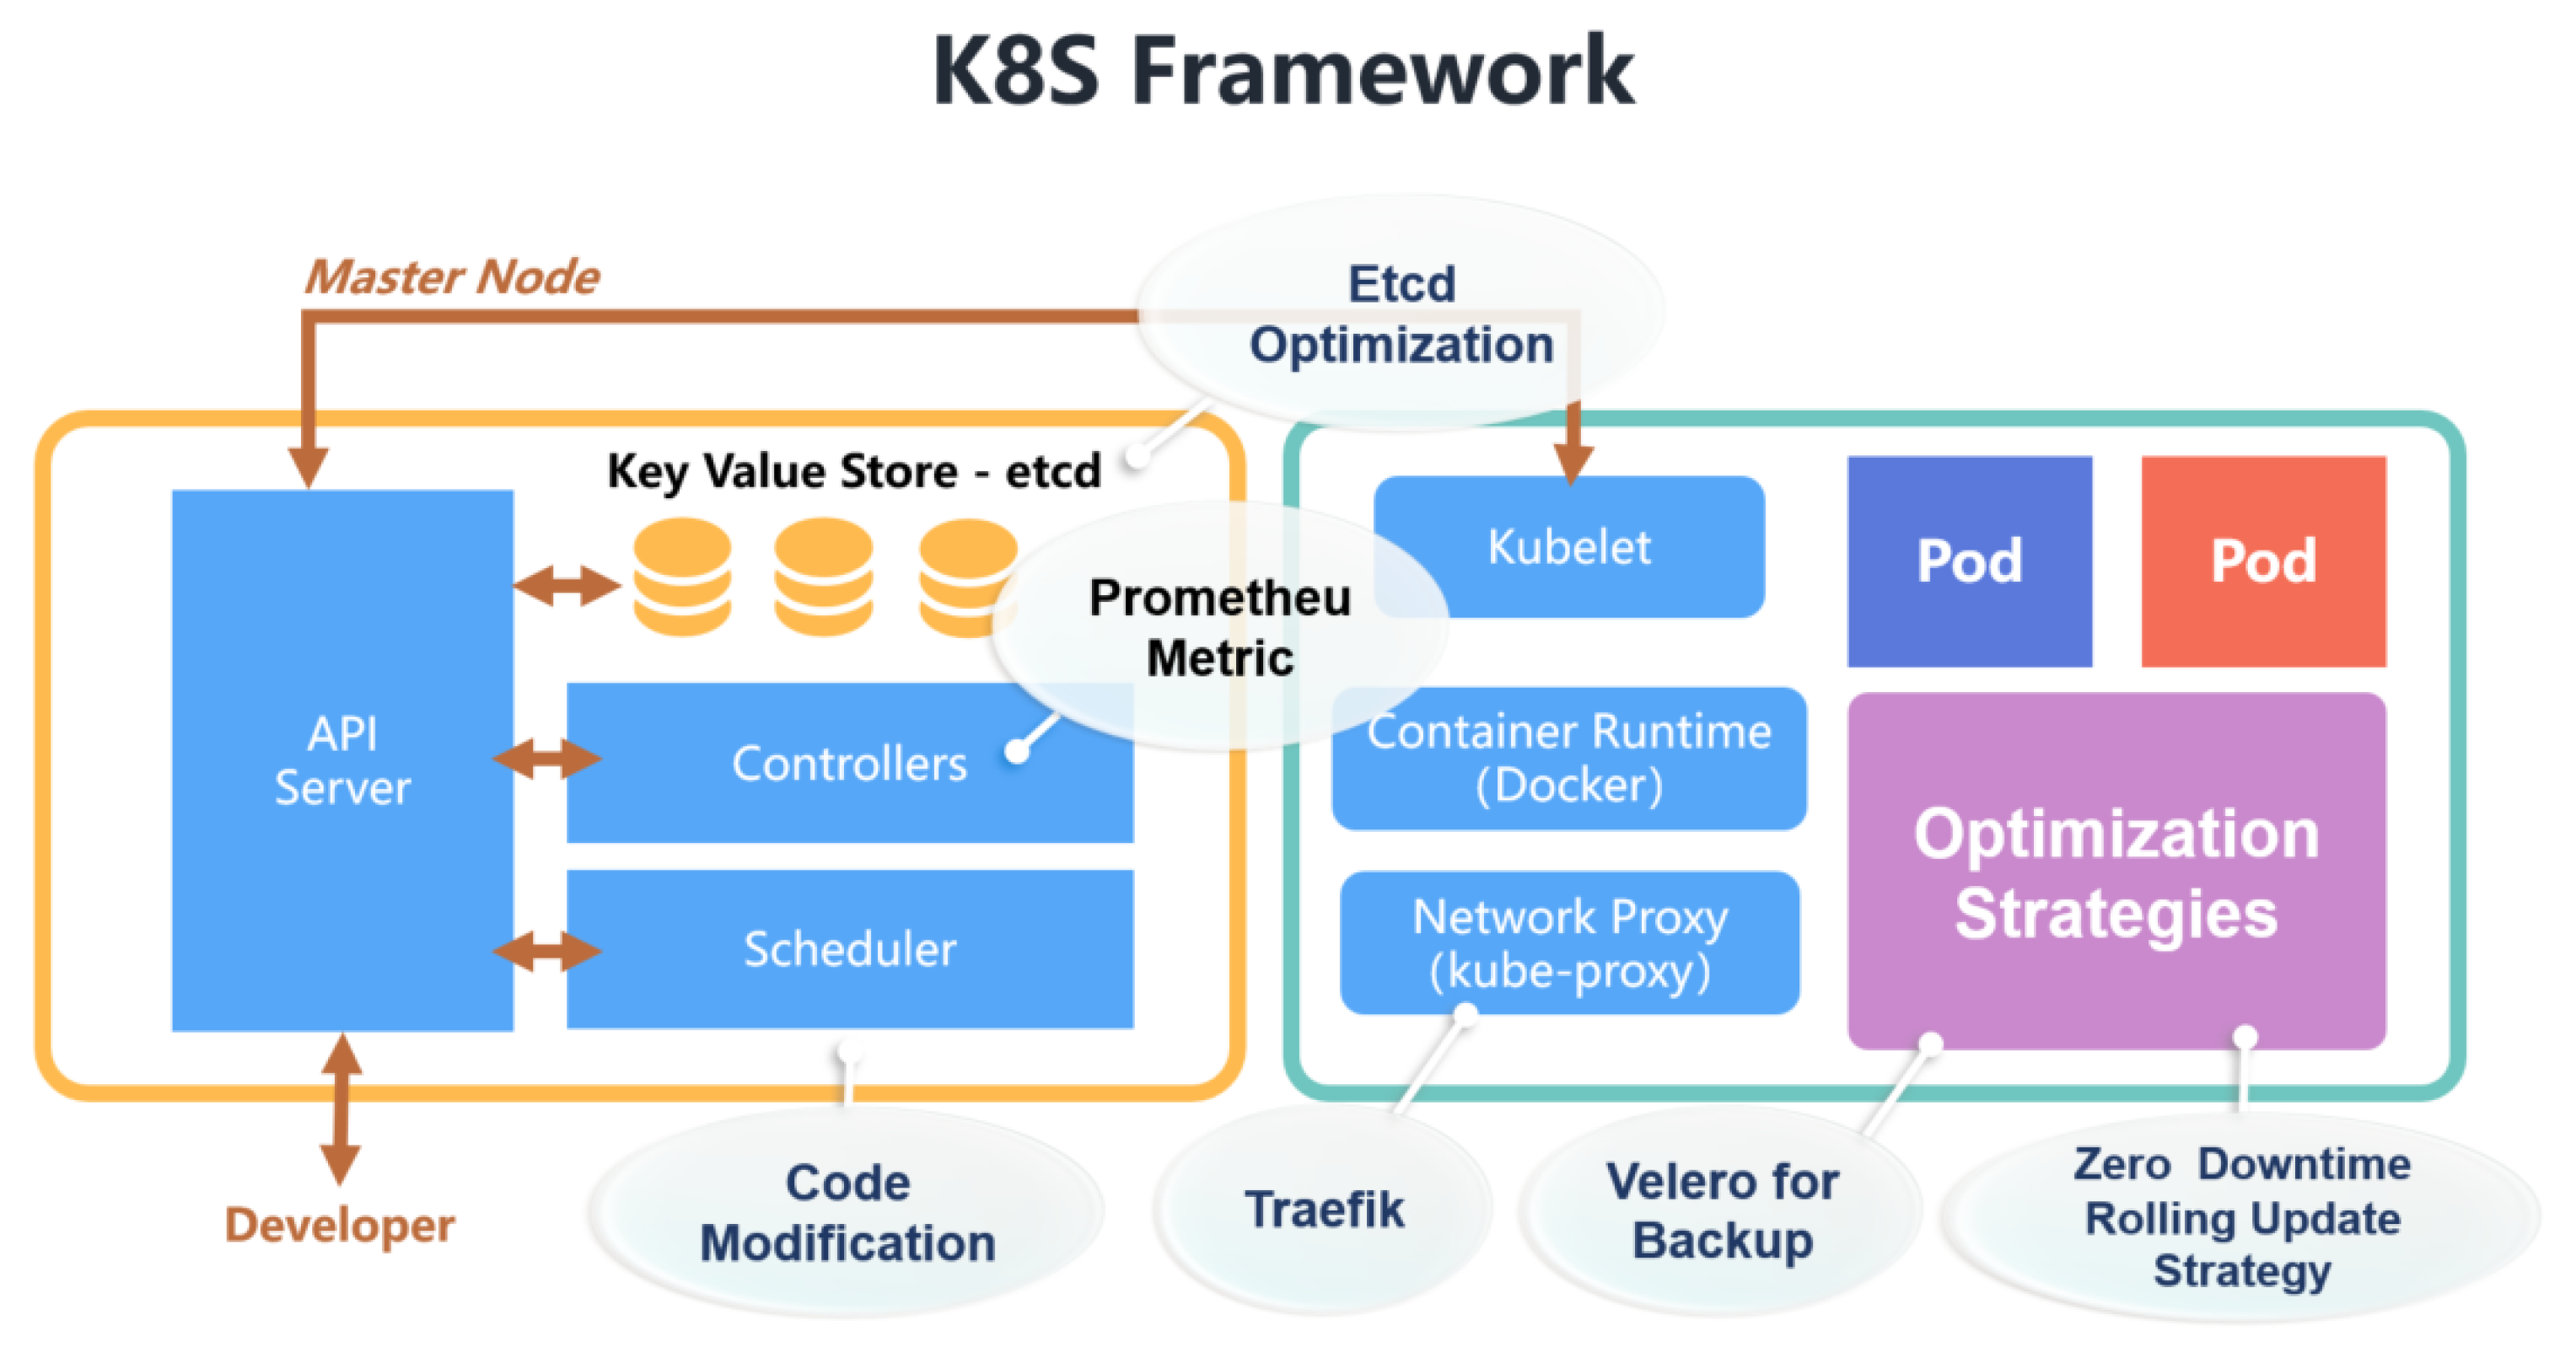
We depict our proposed system framework (our proposed solution) in Figure 4, The idea of our solution is to use a combination of different new components complementing with multiple optimizations, such as scheduling, ETCD, and others, to ultimately improve the performance of K8s. The framework is as follows:

Figure 4.
System framework, adapted from [31].
- Optimizing ETCD operations with the help of optimized disk drives (e.g., SSD) and giving ETCD services higher disk I/O permissions.
- Using Velero [32] components to back up data, and enable a zero-downtime rolling update strategy to improve the robustness of Kubernetes services and reduce downtime.
- Using open-source software Traefik [33] to reduce Ingress update configuration downtime.
- Using Prometheus [34] to obtain more detailed indicators, provide them to Kube-apiserver for HPA and scale Pod accordingly.
- Customising Scheduler Strategies based on Scheduler Extender.
4. Proposed Approach
Kubernetes is a complex tool. As with most complex tools, it can be tricky to obtain the best performance from Kubernetes. Most Kubernetes releases have not been fine-tuned to maximize performance, so it is necessary to take numerous methods to optimize Kubernetes and to address the aforementioned issues. In this section, we demonstrate how to improve the performance of Kubernetes in terms of backup, load balancing, autoscaling, extended scheduling, and many more while following/adopting our proposed system framework depicted in the aforementioned section.
4.1. ETCD Performance Optimization
As mentioned above, the performance of ETCD [35] is limited by network IO latency and disk IO latency, so performance can be improved at the network level and hardware level. However, the performance improvement at the network level needs to be set according to different usage environments, we optimize merely ETCD at the hardware level. Both the persistence of ETCD’s log and the storage of data are inseparable from the support of the underlying hardware. There is no doubt that the IO speed of the underlying hardware affects the speed of ETCD’s reading of data. We can use SSD hard drives as the underlying storage hardware to effectively increase data throughput and reduce IO latency. At the same time, we can appropriately give ETCD services higher disk I/O permissions to make ETCD run more stably.
4.2. Backup and Restore Performance Optimization
Velero [32] is a cloud-native disaster recovery and migration tool. It is an open-source software written in Go language that can safely backup, restore, and migrate Kubernetes cluster resources and persistent volumes. The basic principle of Velero is to back up the data of the cluster to the object storage and pull the data from the object storage when restoring. Therefore, Velero can realize the backup and recovery of multiple object levels in the Kubernetes cluster, including Kubernetes clusters and various objects such as Type, Namespace, Label, etc. It can also realize the cluster configuration including replication and synchronization of development, testing, and production environments, simplifying the environment configuration, etc.
Velero is composed of a client and a server. The server is deployed on the target K8s cluster, and the client is a command line tool that runs locally. It runs in the local environment and needs to be configured on a machine with kubectl and cluster kubeconfig. The Velero client calls the Kubernetes API to create and validate different objects and then uploads a tarball of the copied Kubernetes objects to cloud storage.
4.3. Rolling Update Performance Optimization
The purpose of a zero-downtime rolling update is to release a new version of an application without impacting users. This means developers can make continuous requests to new apps as they are released, and app users never get a response to the dreaded access error. To minimize the downtime caused by rolling updates, we need to achieve zero downtime to reduce downtime. Users can achieve zero-downtime deployment by using lifecycle hooks, ready probes, and Pod interruption budgets.
4.4. Ingress Performance Optimization
Kubernetes Ingress is the Ingress controller recommended by Kubernetes by default. Its main advantages are simplicity and few configuration files. The disadvantage of Kubernetes Ingress is that the time it takes to modify and reload the configuration file becomes longer as the routing configuration file becomes larger, which seriously affects the quality of service and even causes service interruption. Using Traefik [33] Ingress as the Ingress controller is a better way. Traefik Ingress is a full-featured Ingress controller, which supports continuous configuration updates (without restarting), adaptive services, multiple load balancing algorithms, Web UI, support for various protocols, and other functions. Compared with Kubernetes Ingress, it has more advantages.
4.5. Autoscaling Performance Optimization
Prometheus [34] is an open-source monitoring alarm system and time series database (TSDB) developed by SoundCloud. It is an open-source version of the Google BorgMon monitoring system. It can monitor the Kubernetes system and efficiently process the large amount of data generated. In the event of a power failure or shutdown, we can quickly locate the point of failure through Prometheus. The Prometheus Server is the core part of the Prometheus components, responsible for the acquisition, storage, and query of monitoring data. NodeExporter pushes data to Prometheus through Pull/Push. ServerAlert Manager is responsible for processing alarm information.
Prometheus Server periodically obtains the status metrics of the monitored Pod and stores them in the local TSDB. Prometheus Adapter periodically queries the metrics in TSDB and sends the results to Kube-apiserver. Through the Prometheus Adapter, we can use any indicator in Prometheus for HPA, and HPA performs corresponding Pod scaling after obtaining the indicator. Compared with cAdvisor, Prometheus can obtain the average change trend of the indicators, which can better show the changes in services.
4.6. Scheduling and Load Balancing Optimization
In this, we proceed as follows.
4.6.1. Scheduler Design
There are three general ways to add new scheduling algorithms to Kubernetes:
- (1)
- Modify the source code of the default scheduler, add the scheduling algorithm, and then recompile and redeploy the scheduler. This approach intrudes into the source code of the Scheduler component of Kubernetes and is not conducive to version updates and rollbacks.
- (2)
- Develop a new scheduler to run in the cluster at the same time as the default scheduler. With this approach, if different Pods choose different schedulers, scheduling conflicts or scheduling failures may occur as the different scheduling processes cannot communicate with each other synchronously.
- (3)
- Custom algorithms are implemented based on the Kubernetes Scheduler Extender mechanism. This approach is nonintrusive to the source code and the Scheduler Extender runs as a plug-in, enabling flexible custom scheduling by modifying the scheduling policy configuration file.
This article takes a third approach to development, loading and running a custom scheduling policy in the Scheduler Extender component and scoring the nodes in the Post-Scoring loop at the end of the preference phase. Figure 5 shows the scheduler architecture designed in this article. The two core parts of the dynamic scheduling scheme proposed in this paper are the node resource monitoring component and the custom scheduling component. The Node-Exporter component of Prometheus is used to monitor the resources of the node. The custom scheduling component is to expand the process Extender by starting the scheduler and loading a custom scheduling policy to implement scheduling intervention. The Prometheus Server periodically obtains node monitoring data from the Node-Exporter component on the node, and the scheduler extension process Extender loads a custom scheduling strategy as a scheduling plug-in and starts it.
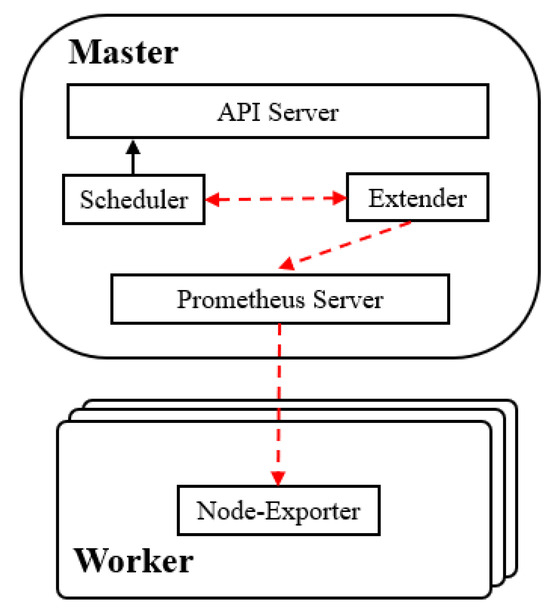
Figure 5.
New scheduler architecture, adapted from [36].
The Kubernetes Scheduler calls the Extender in the Post-Scoring phase, and the Extender process sends corresponding command queries to the HTTP API interface provided by the Prometheus Server to obtain detailed metrics data grouped by nodes. Prometheus Server collects different types of metrics through different types of Node-exporters deployed on different nodes. The custom scheduling algorithm then scores the node based on its resource monitoring data; the higher the score the higher the scheduling priority. The Extender process then sends the node scores for the custom scheduling policy to the default scheduler, Scheduler, which finally calculates the final node scores based on the weight of each scheduling policy.
4.6.2. Algorithm Improvement
With the rapid growth of cloud computing, more and more I/O-intensive applications are being deployed to run on cloud computing platforms. However, because Kubernetes is not aware of network I/O as a resource type, it may schedule multiple I/O-intensive applications to a few duplicate nodes, resulting in long response times for services on the nodes. To improve the network I/O resource balance in the Kubernetes cluster, this paper proposes an algorithm based on the cluster network I/O balance algorithm BalancedNetworkIOPriority (BNIP), which is modified from the Kubernetes default scheduling algorithm BalancedResourceAllocation [37].
4.6.3. Analysis of Algorithm Principles
Assuming that the number of nodes entering the Kubernetes scheduling preference phase is n, then the current network I/O load of node i is and the NIC bandwidth of this node is , the network I/O usage of node i can be calculated according to the expression (1) [38], and the average network I/O usage of these n nodes can be derived according to the expression (2).
Let the network I/O request of the Pod to be scheduled be , and the incremental network IO usage of node j after the Pod is scheduled to node can be calculated according to Equation (3) [38].
Then, according to Equations (4) [38] and (5), one can calculate the network IO usage of the node after Pod scheduling to node j and the average network IO usage of these n nodes.
Calculate the variance of network IO usage for n nodes after Pod is scheduled to node .
The node score is calculated as shown in Equation (7), where and are, respectively, the minimum and maximum values of , which are normalized to take values in the range .
The BNIP algorithm works by calculating the current network I/O between Kubernetes cluster nodes. The larger the network I/O gap between nodes, the more unbalanced the distribution of network I/O in the cluster, the lower the score of the BNIP algorithm, and the lower the scheduling priority of the node.
5. Experiments
In this section, we demonstrate our experimental analysis and evaluate the effectiveness of our proposed solution framework.
5.1. Experimental Setup
The computer equipment used in this experiment is an AMD Ryzen 7 6800H @ 3.2 Ghz, and a Kubernetes cluster with 1 master node and 3 working nodes is established. The master node is allocated 4 core processors and 4 GB RAM memory, and the working nodes are 2 core processors and 2 GB RAM are allocated. The software version used is Kubernetes version 1.24.1, Docker version 20.10.12.
5.2. Experimental Analysis
In the following, we present the experimental analysis with the results of our proposed solution strategies for each specific objective stated earlier.
5.2.1. ETCD IO Operation Analysis
In the ETCD [35] performance experiment, the test condition is to specify different numbers of client connections and key sizes. Two test tasks are set up, one is to test the performance gap between ETCD using HDD and SSD, and the other is to test the performance before and after IO optimization. The size of the key in the test data is 8, and the size of the value is 256. The purpose of the test is to test the write queries per second (QPS) and the latency value of each request before and after the optimization of ETCD performance. We can come up with any other configurations we want.
One of the experimental software uses ETCD version 3.54 and the ETCD benchmark. The HDD used is Seagate ST6000DM003, 5400 rpm, with a read speed of 185 MB/s and a write speed of 185 MB/s. The SSD is a Samsung 960 EVO, with a read speed of 3200 MB/s and a write speed of 1900 MB/s. We can come up with any other settings we want depending on the availability of hardware resources.
In the ETCD performance experiment, we use ETCD’s benchmark tool to obtain the write queries per second (QPS) and the latency of each request. Table 1 and Table 2 show that after deploying ETCD with SSD, the performance of ETCD is improved by about ten times. Table 3 shows that after IO priority optimization is adopted, regardless of whether the access target is a single master or all members, there can be a higher Large Write QPS, and for each request, the latency is also reduced.

Table 1.
Performance of ETCD deployed on HDD.
Table 2.
Performance of ETCD deployed on SSD.
Table 3.
Performance of ETCD deployed on SSD with IO priority optimization.
5.2.2. Velero Backup, Migration, and Restore Operation Analysis
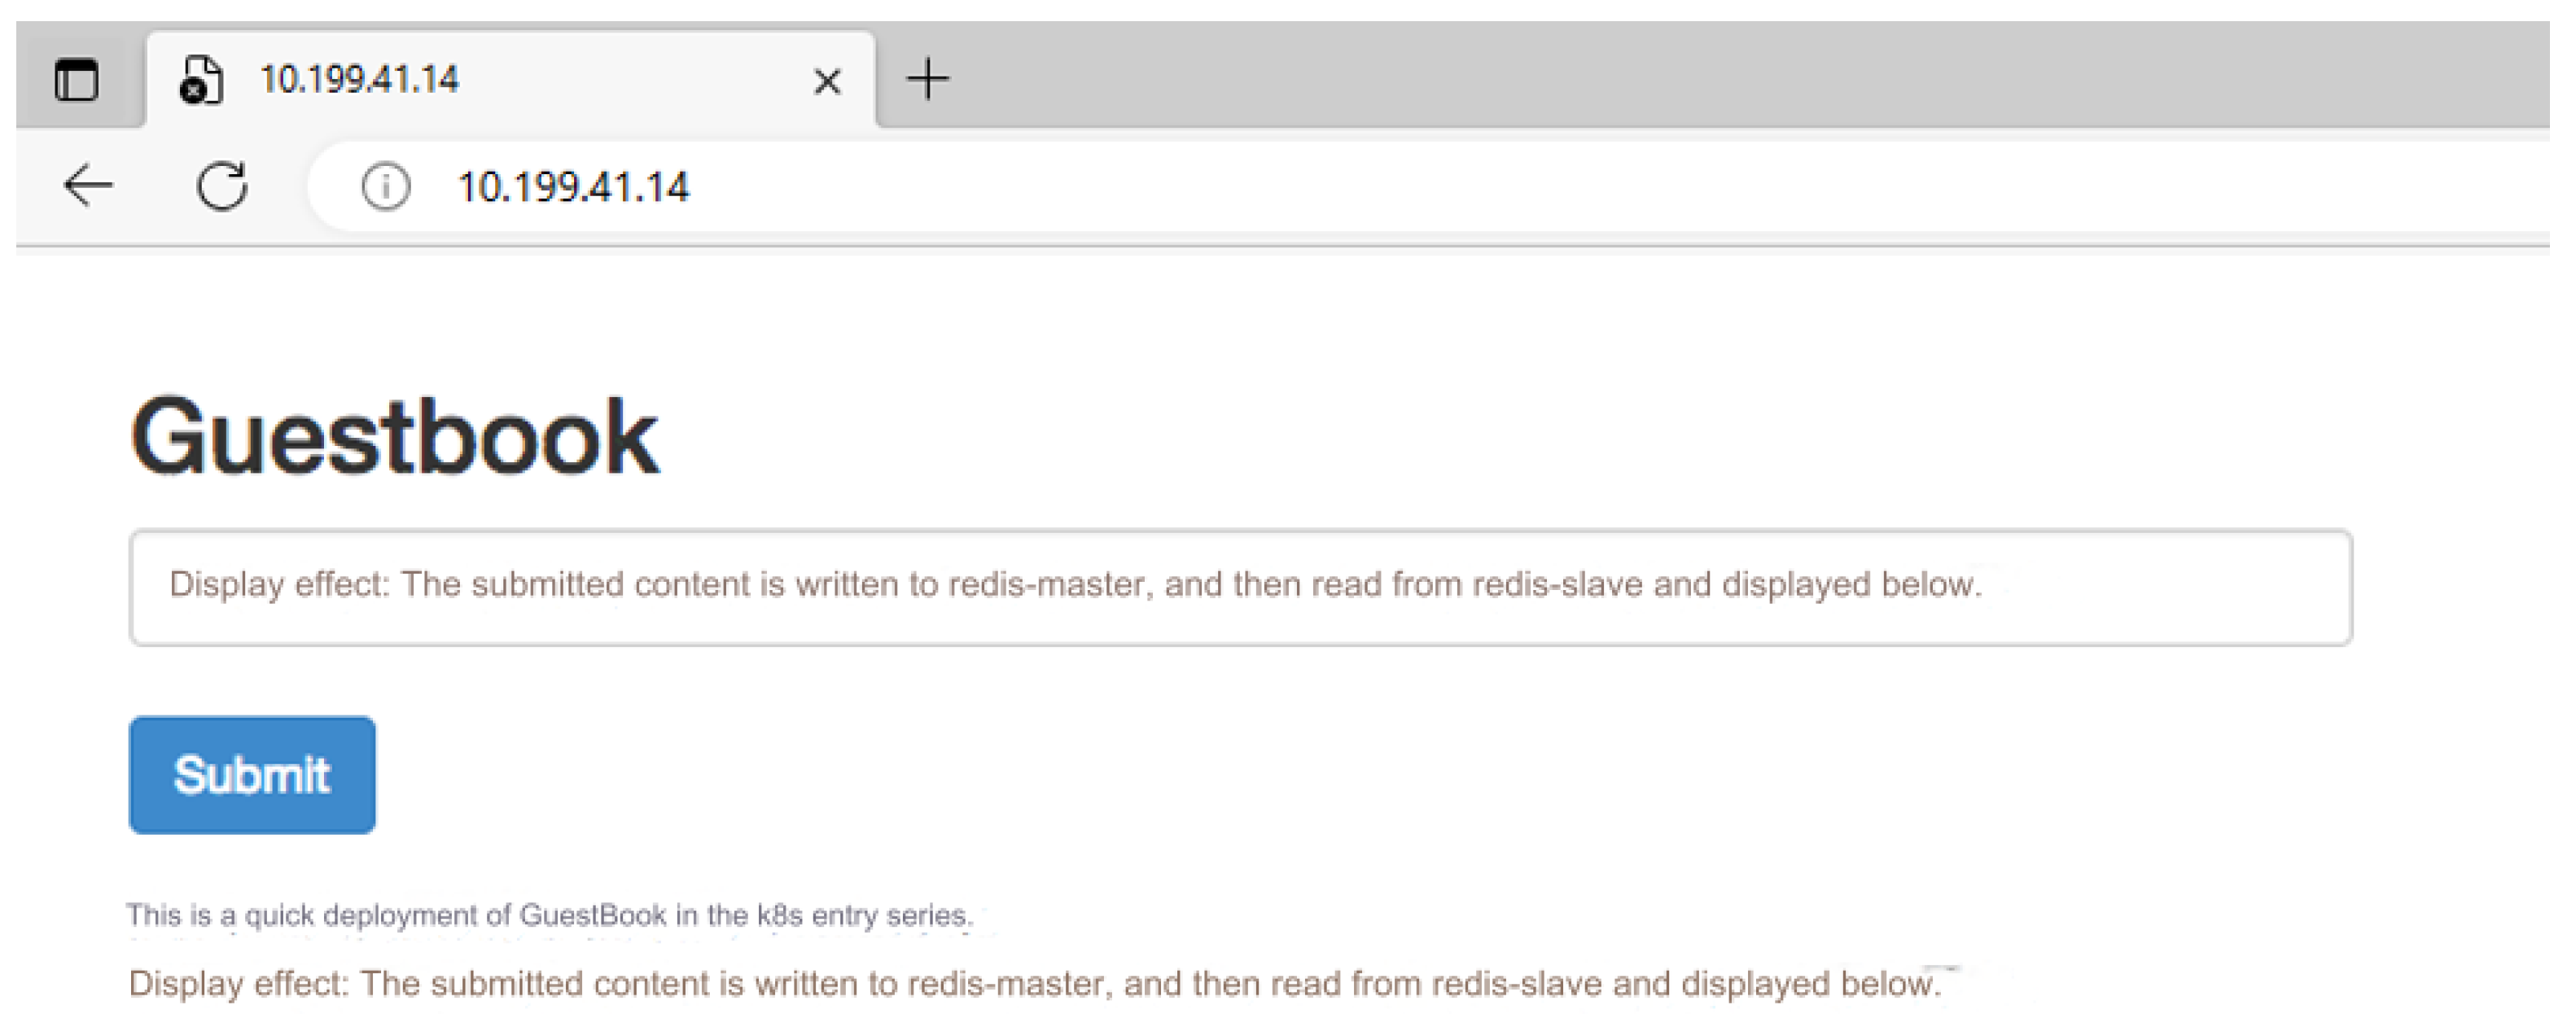
The test task of the Velero [32] experiment is to implement backup and migration in clusters A, B, and C. The purpose of the experiment is to test whether Velero can back up and restore the entire cluster and restore the specified Label. The three clusters deployed have a master and a worker, and Velero is installed at the same time. Among them, the guestbook application is set up in cluster A, and the service is provided normally (Figure 6).
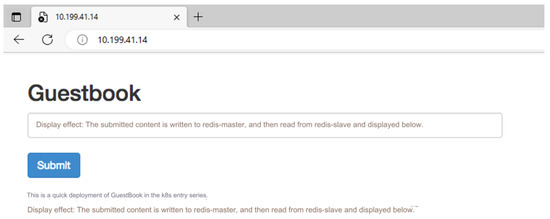
Figure 6.
Successful access to guestbook.
The experimental process is to use Velero to back up the cluster resources of cluster A to cluster B and use Velero to back up specific labels to cluster C. The expected result of the experiment is that cluster B can also provide normal access to the guestbook application because it restores all the resources of cluster A, while cluster C cannot access the guestbook application normally because it only restores a specific Label. Notably, we can have as many clusters as we want; however, three is the minimum for this experimental analysis.
Label is an important concept in the Kubernetes system, as stated earlier. It adds identifiers to resources to distinguish and select resources. An application includes different Labels. When using Velero to migrate the cluster this time, only some Label resources in the cluster are migrated, so the guestbook function of the application cannot be restored, and the guestbook application in cluster C cannot be accessed normally. The result of accessing the guestbook application of cluster C is shown in Figure 7.
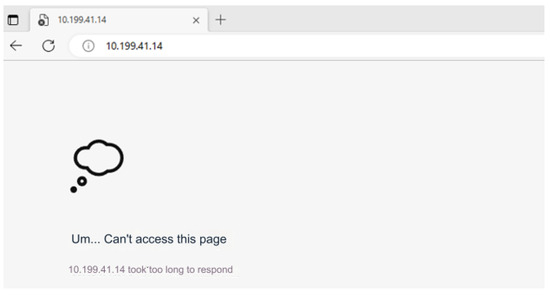
Figure 7.
Unable to access guestbook.
5.2.3. Fortio: Zero-Downtime Rolling Update Analysis
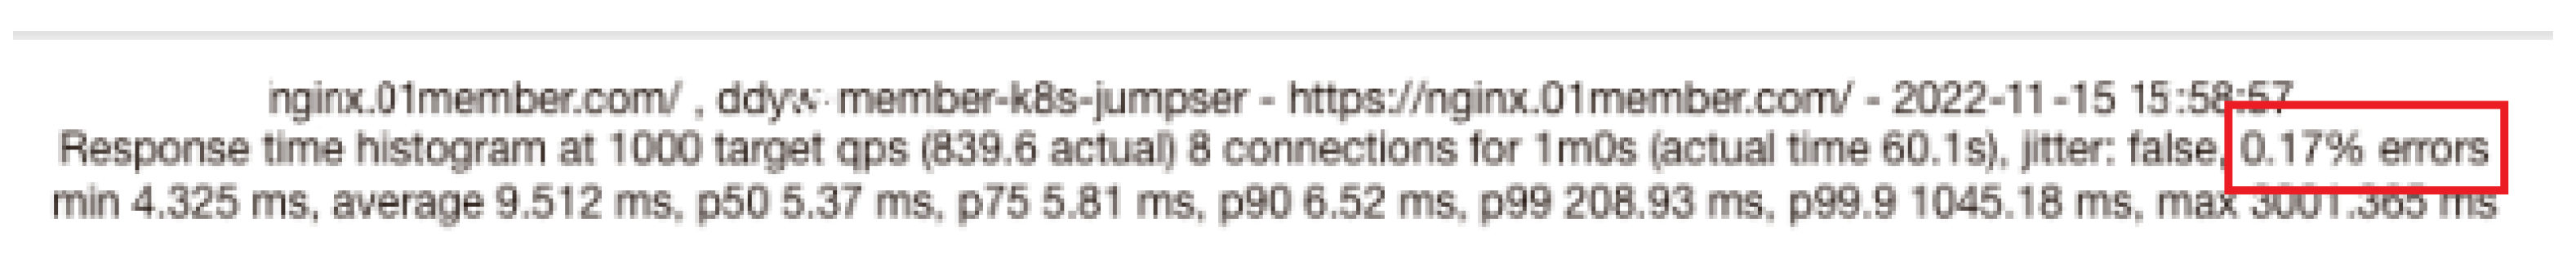
In the test experiment of zero-downtime rolling update, the Kubernetes cluster provides the access service of the Nginx server and actively updates the version. The experiment uses Fortio 1.38.4 version [39], generates 8 concurrent thread connections, and generates 1500 requests per second for 60 s. Notably, we can come up with any other configurations we want. Fortio can obtain the access success rate returned by the Nginx server to determine whether Nginx has been providing services normally.
When using the default rolling update strategy, during the rolling update application process, the Fortio test results are shown in Figure 8, and there is a 0.17 % access failure rate. Figure 9 shows that when the zero-downtime rolling update strategy is enabled, there are no access errors (errors are 0) during the rolling update application.
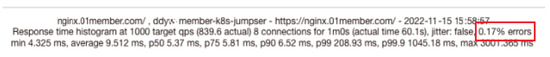
Figure 8.
No zero-downtime rolling updates enabled.

Figure 9.
Enable zero-downtime rolling updates.
5.2.4. Traefik: Ingress Update Configuration Downtime Analysis
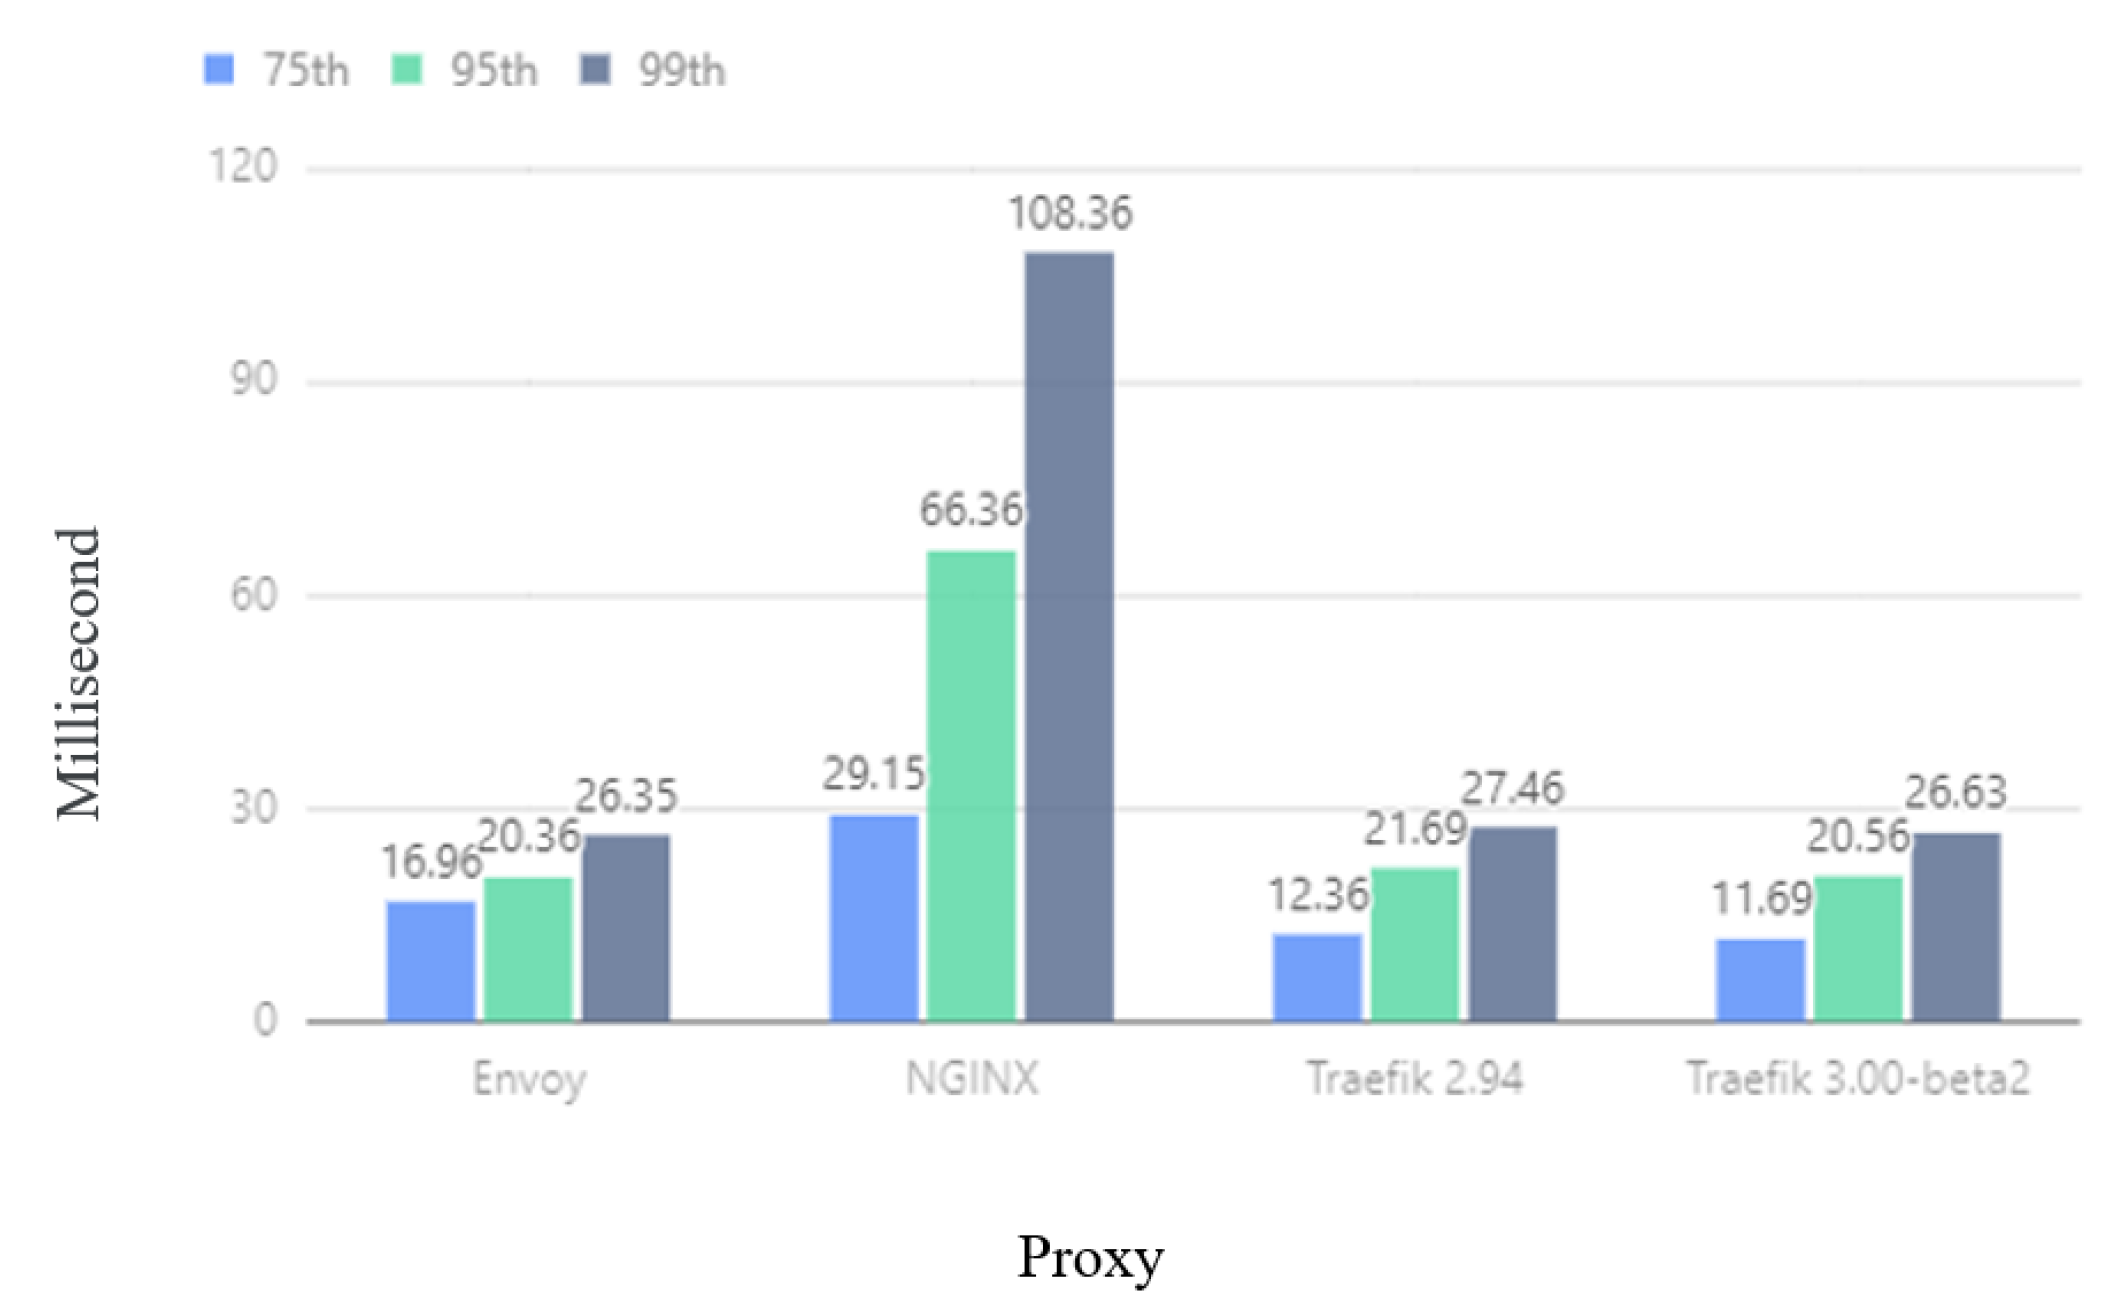
In Traefik’s [33] performance experiment, the software used is Traefik version 2.94, Traefik version 3.0.0-beta2, Envoy version 1.22.8 [40], and Nginx version 1.22.1 [41], respectively, as the Ingress controller is used for testing. The Kubernetes cluster provides the access service of the Nginx server. The experiment uses Fortio version 1.38.4, generates 8 concurrent thread connections, sends 1500 requests per second, and lasts for 6 min. Notably, we can come up with any other configurations we want. At the same time, the shell file is used to change the number of Pods every 30 s within 3 min and the Pod configuration is changed every 30 s to simulate actual usage. The test goal is to use Fortio to obtain the average number of requests per second and latency (percentile) of different Ingress controllers.
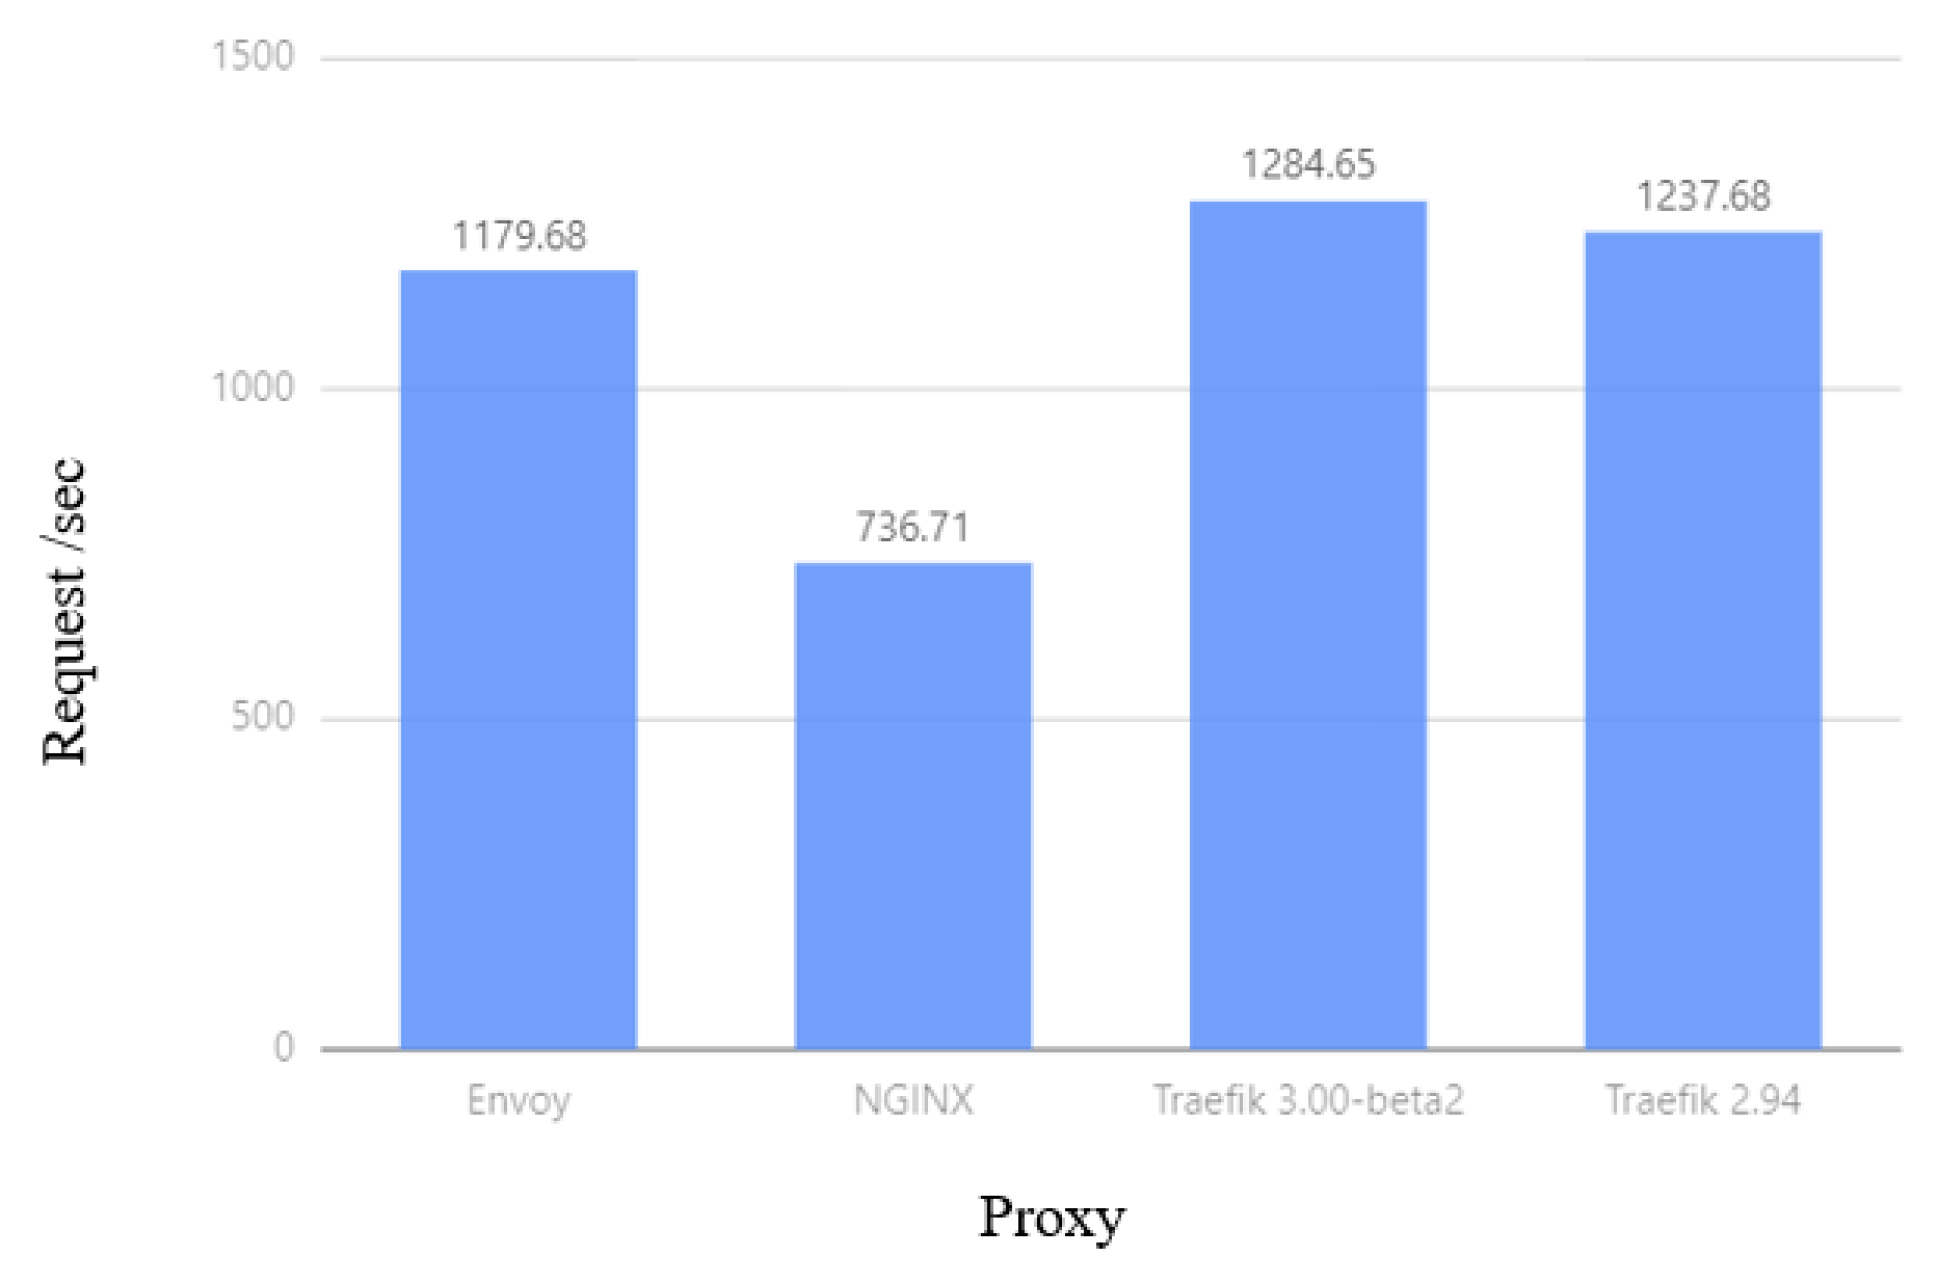
Figure 10 shows that in the experiment, the delay of Traefik at the 75th, 95th, and 99th requests is lower than that of NGINX and Envoy, and Traefik 3.0.0-beta2 is lower than Traefik 2.94. It can be seen from Figure 11 that the average number of requests per second of Traefik is higher than that of NGINX and Envoy, and the performance of Traefik 3.0.0-beta2 is better than that of Traefik 2.94, which can handle more requests per second. This experiment shows that Traefik has better performance in environments where scale-out and configuration changes occur frequently.

Figure 10.
Latency comparison.

Figure 11.
Average requests per second comparison.
5.2.5. Prometheus: HPA Autoscaling Analysis
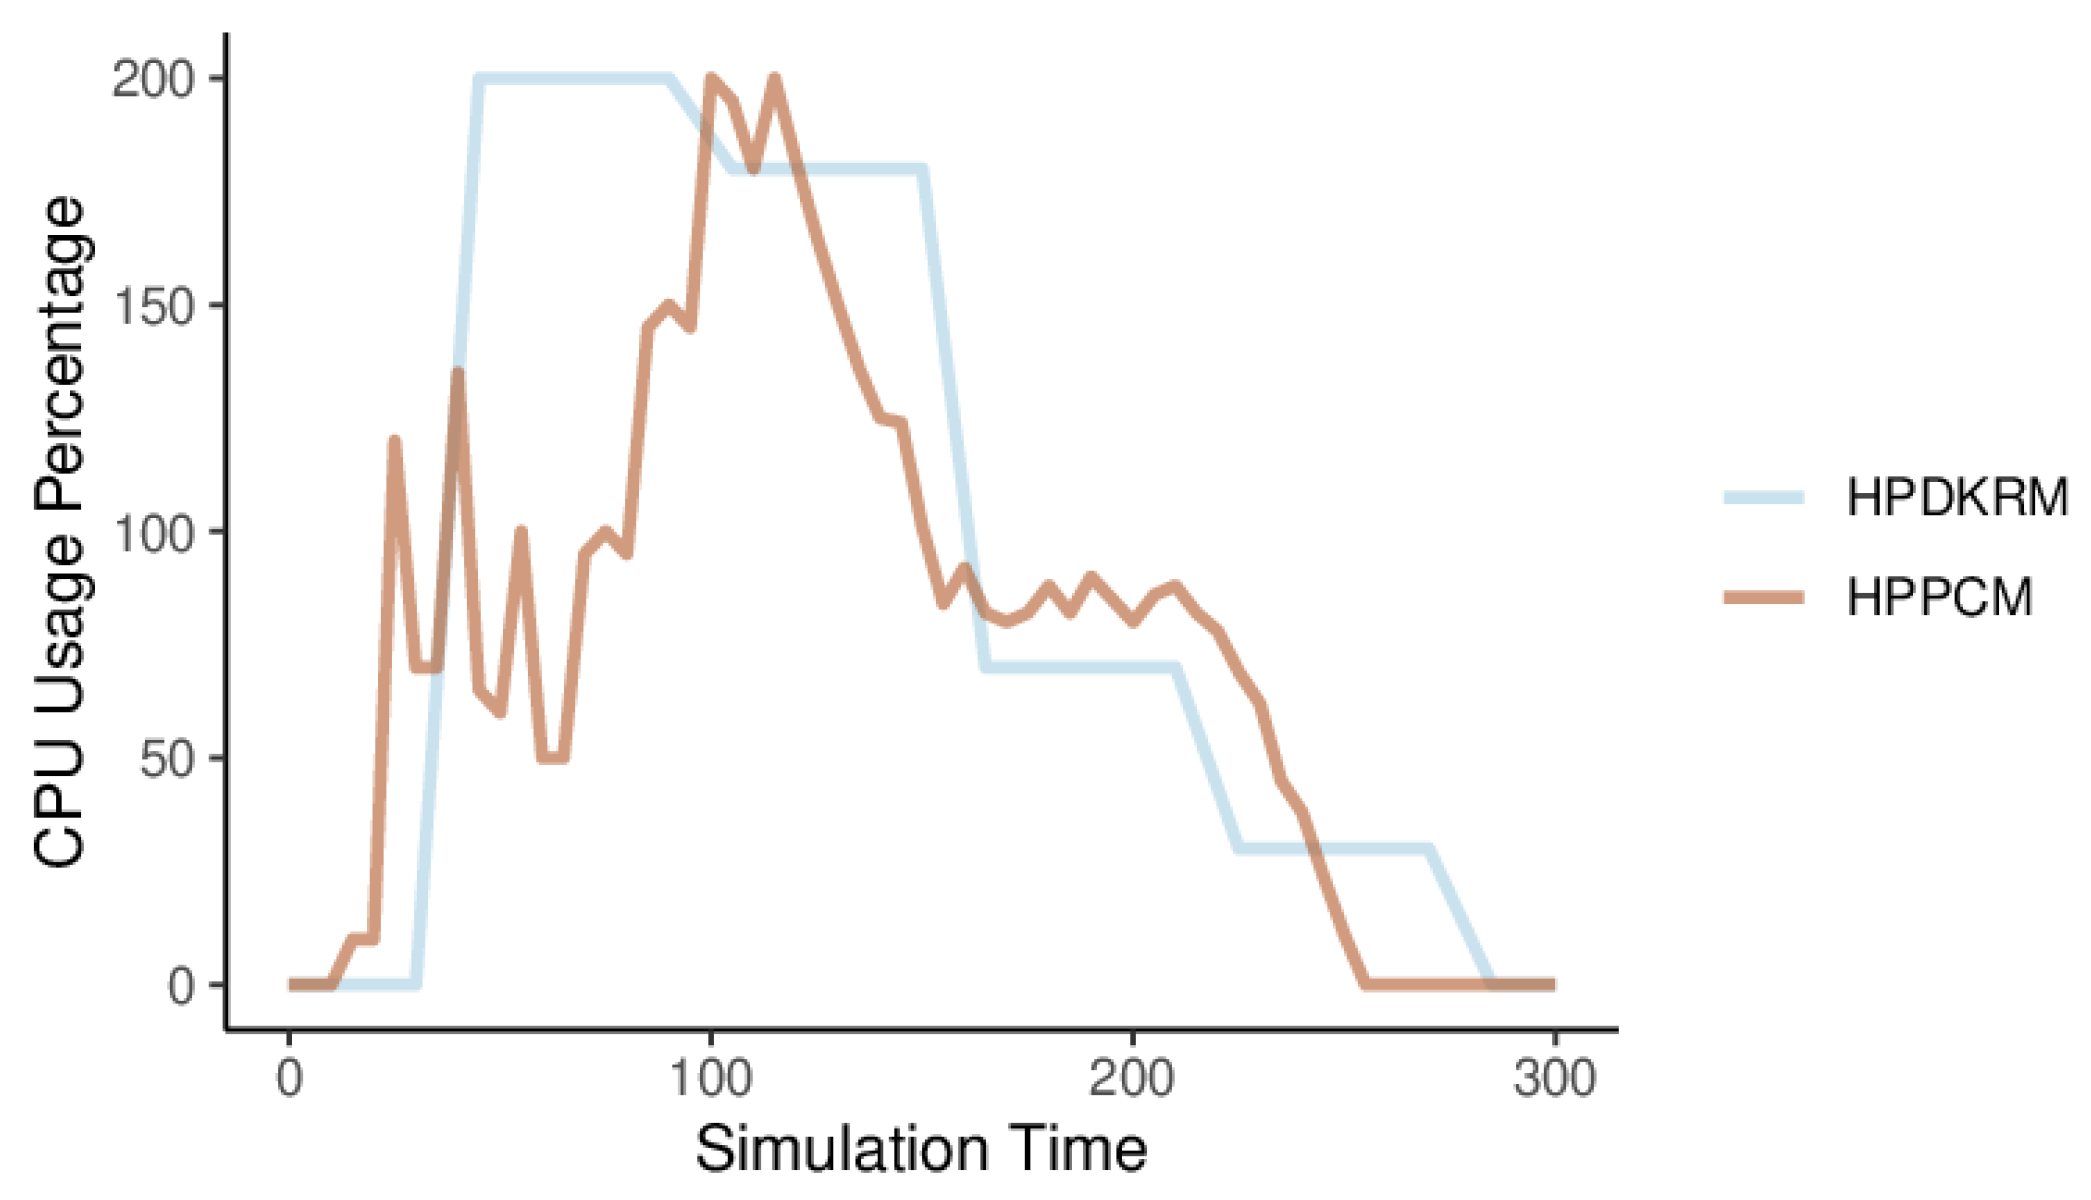
In the test experiment of the Prometheus[34] experiment, the access service of the Nginx server is provided in the Kubernetes cluster. The test condition is to use Gatling 3.9.0 version [42] to send access requests to the Kubernetes cluster within 5 min of the test time, and the number of requests gradually drops from 1800 requests per second to 0 per second. Notably, we can come up with any other configurations we want. The goal of the experiment is to compare the trends of Average CPU usage and number of replicas under two different methods: HPA Performances with Prometheus Custom Metrics (HPPCM) and HPA for Performances with Default Kubernetes Resource Metrics (HPDKRM).
Figure 12 shows the changes in CPU usage percentage of HPPCM and HPDKRM during the experiment. The metric value of CPU usage percentage changes every scraping period (60 s). Due to the large number of requests sent by Gatling, the CPU usage percentage of HPDKRM increases from zero to the highest, then gradually decreases as the number of requests decreases, and finally becomes zero, and the trend of change is relatively flat. The metric value of the CPU usage percentage of HPPCM also changes with the number of requests. It gradually decreases from the highest at the beginning, and finally becomes zero, which changes very frequently. The reason is that when Prometheus grabs the metric in each period, the metric needs to be calculated by the Prometheus Adaptor to obtain the average value per second, and the forecast is made according to the trend of the metric.
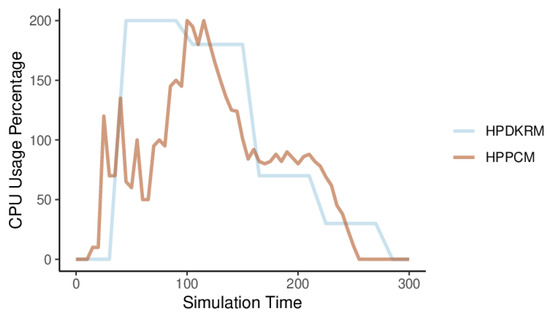
Figure 12.
Average CPU usage for HPPCM and HPDKRM.
By default, Kube-controller-manager compares the collected metrics with the values specified in the HPA configuration every 15 s and makes changes to the number of Pods. The changes in the number of HPDKRM and HPPCM replicas are related to the CPU usage percentage. Figure 13 shows the changes in the number of replicas of HPPCM and HPDKRM. The scaling operation of expanding the number of replicas of HPDKRM to 8 occurs around 60 s, which is the result of increased CPU usage. Similarly, the replicas scale again to 12 at 75 s, and to 21 at 120 s. The CPU usage of HPPCM changes frequently every query period. The number of replicas of HPPCM changes faster than that of HPDKRM, causing HPA to rapidly increase the number of replicas to a maximum of 24, while 21 in the case of HPDKRM. HPPCM has the advantage of responding quickly to frequent changes in metric values, enabling HPA to cope with surges in requests.
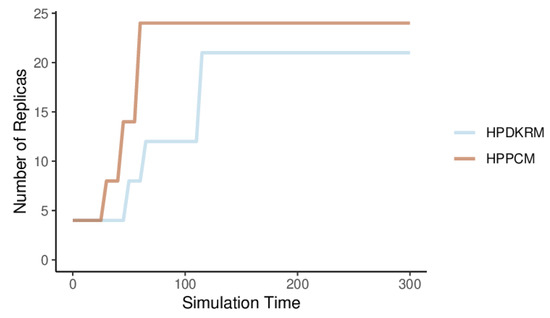
Figure 13.
The number of replicas scaling for HPPCM and HPDKRM.
5.2.6. Custom Scheduler: Scheduling and Load Balancing Analysis
The servers used in this experiment are created through the Alibaba Cloud platform. The configuration of the four nodes is shown in the Table 4.
Table 4.
Algorithm experiment environment server configuration instructions.
To verify the improvement effect of the BNIP (our proposed algorithm based on BalancedNetworkIOPriority, BNIP for short, which is a cluster network I/O balancing algorithm) algorithm on the network I/O balance level among cluster nodes by the default scheduling algorithm (DSA), this paper adopts a comparative experiment to reflect the performance of the BNIP algorithm and the test condition is whether to enable the BNIP algorithm. There are nine Pods with different network IO requirements, which are deployed in sequence according to the number and are scheduled by the scheduler to different nodes. The specific Pod information is shown in Table 5. Notably, we can come up with any other configuration we want. An Nginx server is also deployed on each working node, providing a very simple service for testing network access response times. Every time a Pod is deployed, the network bandwidth of all nodes is collected to calculate the network bandwidth usage and integrated network bandwidth usage variance.
Table 5.
Pod resource request information in BNIP algorithm experiment.
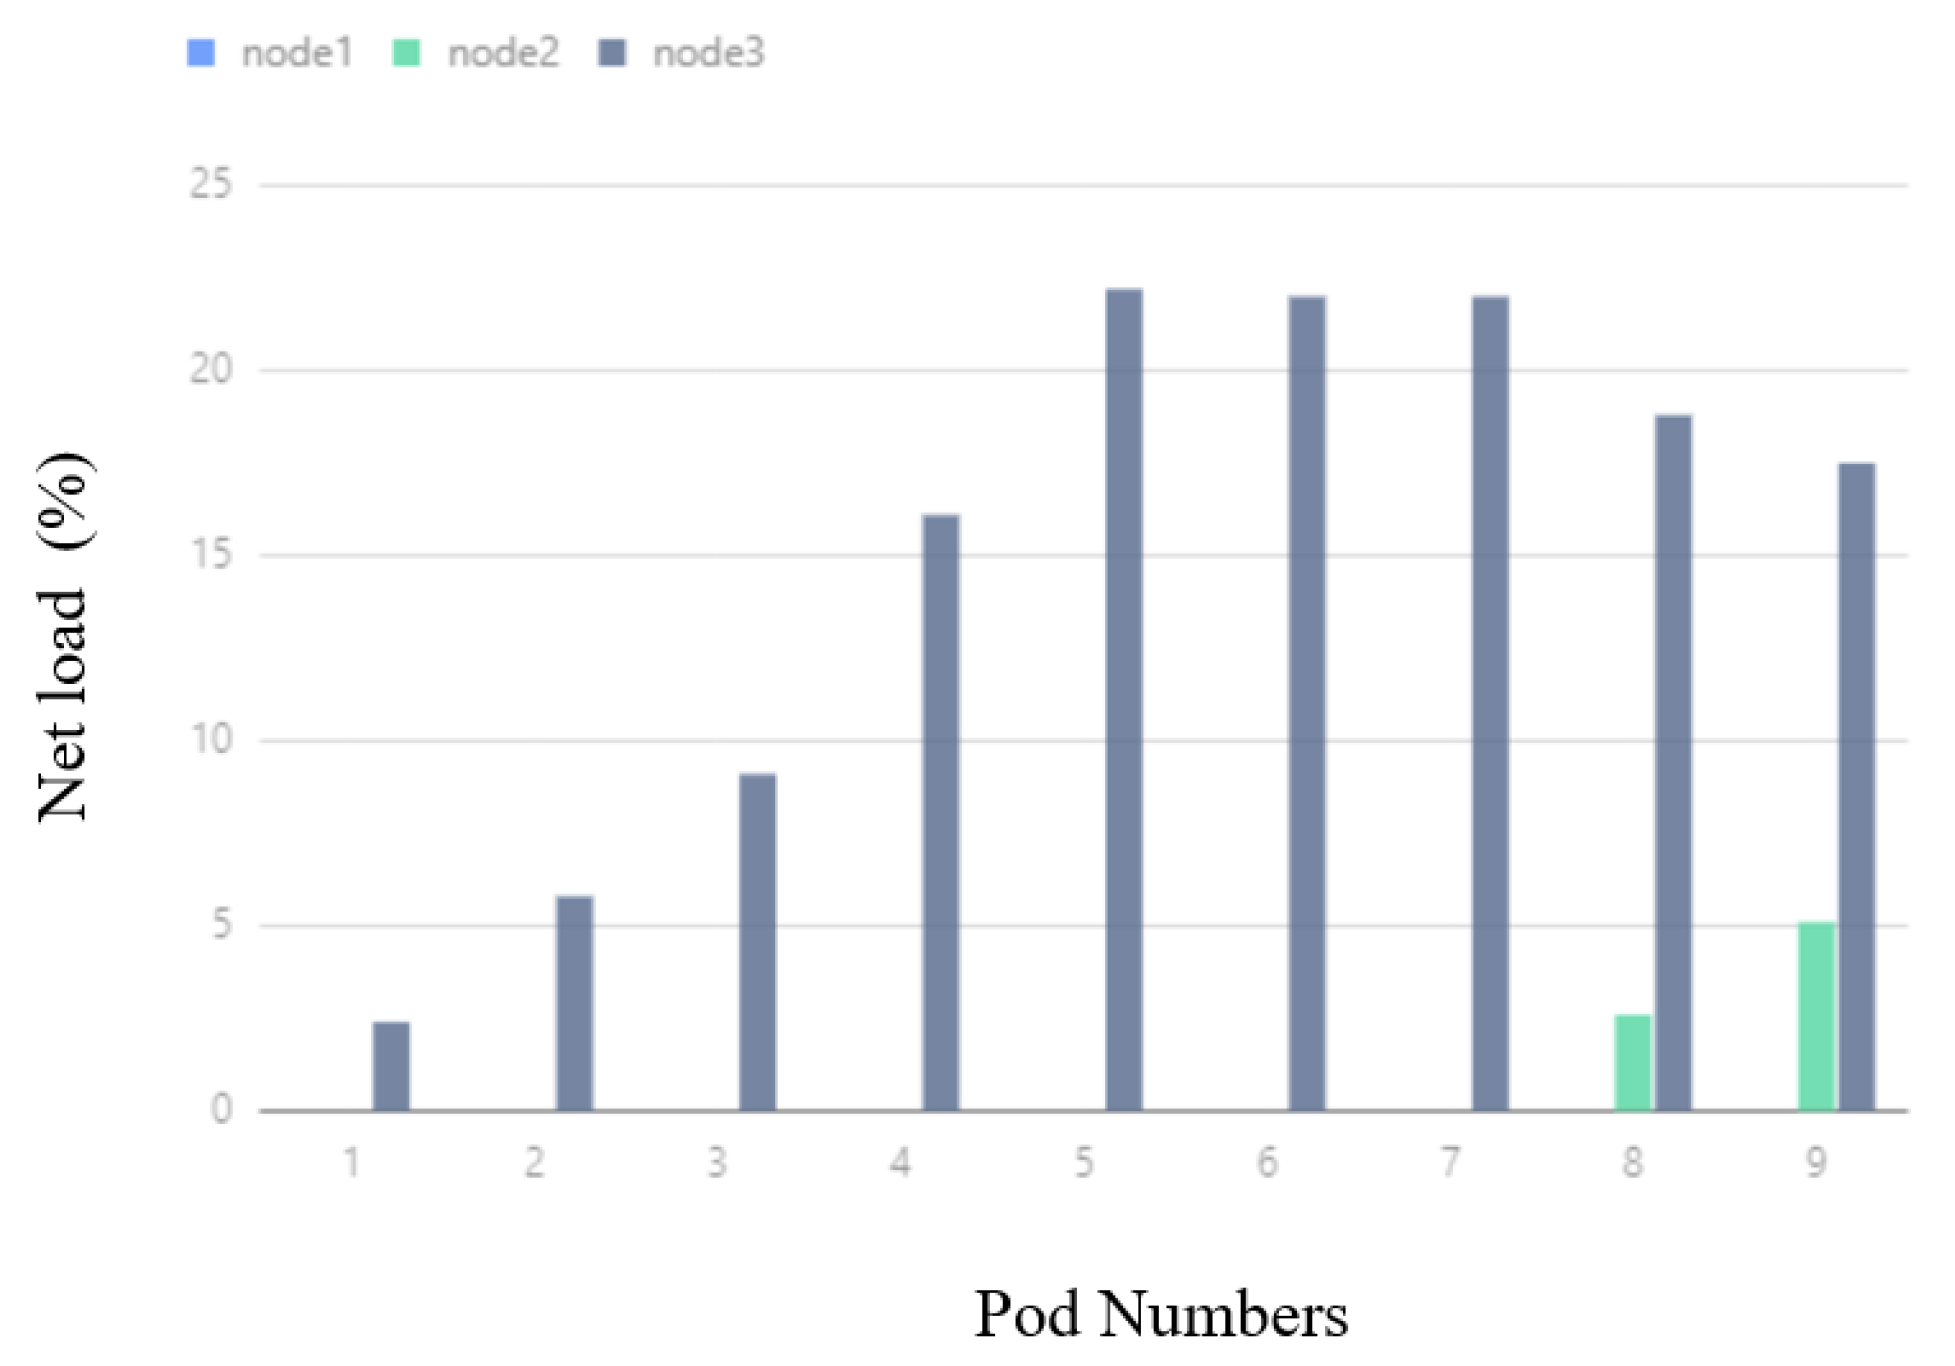
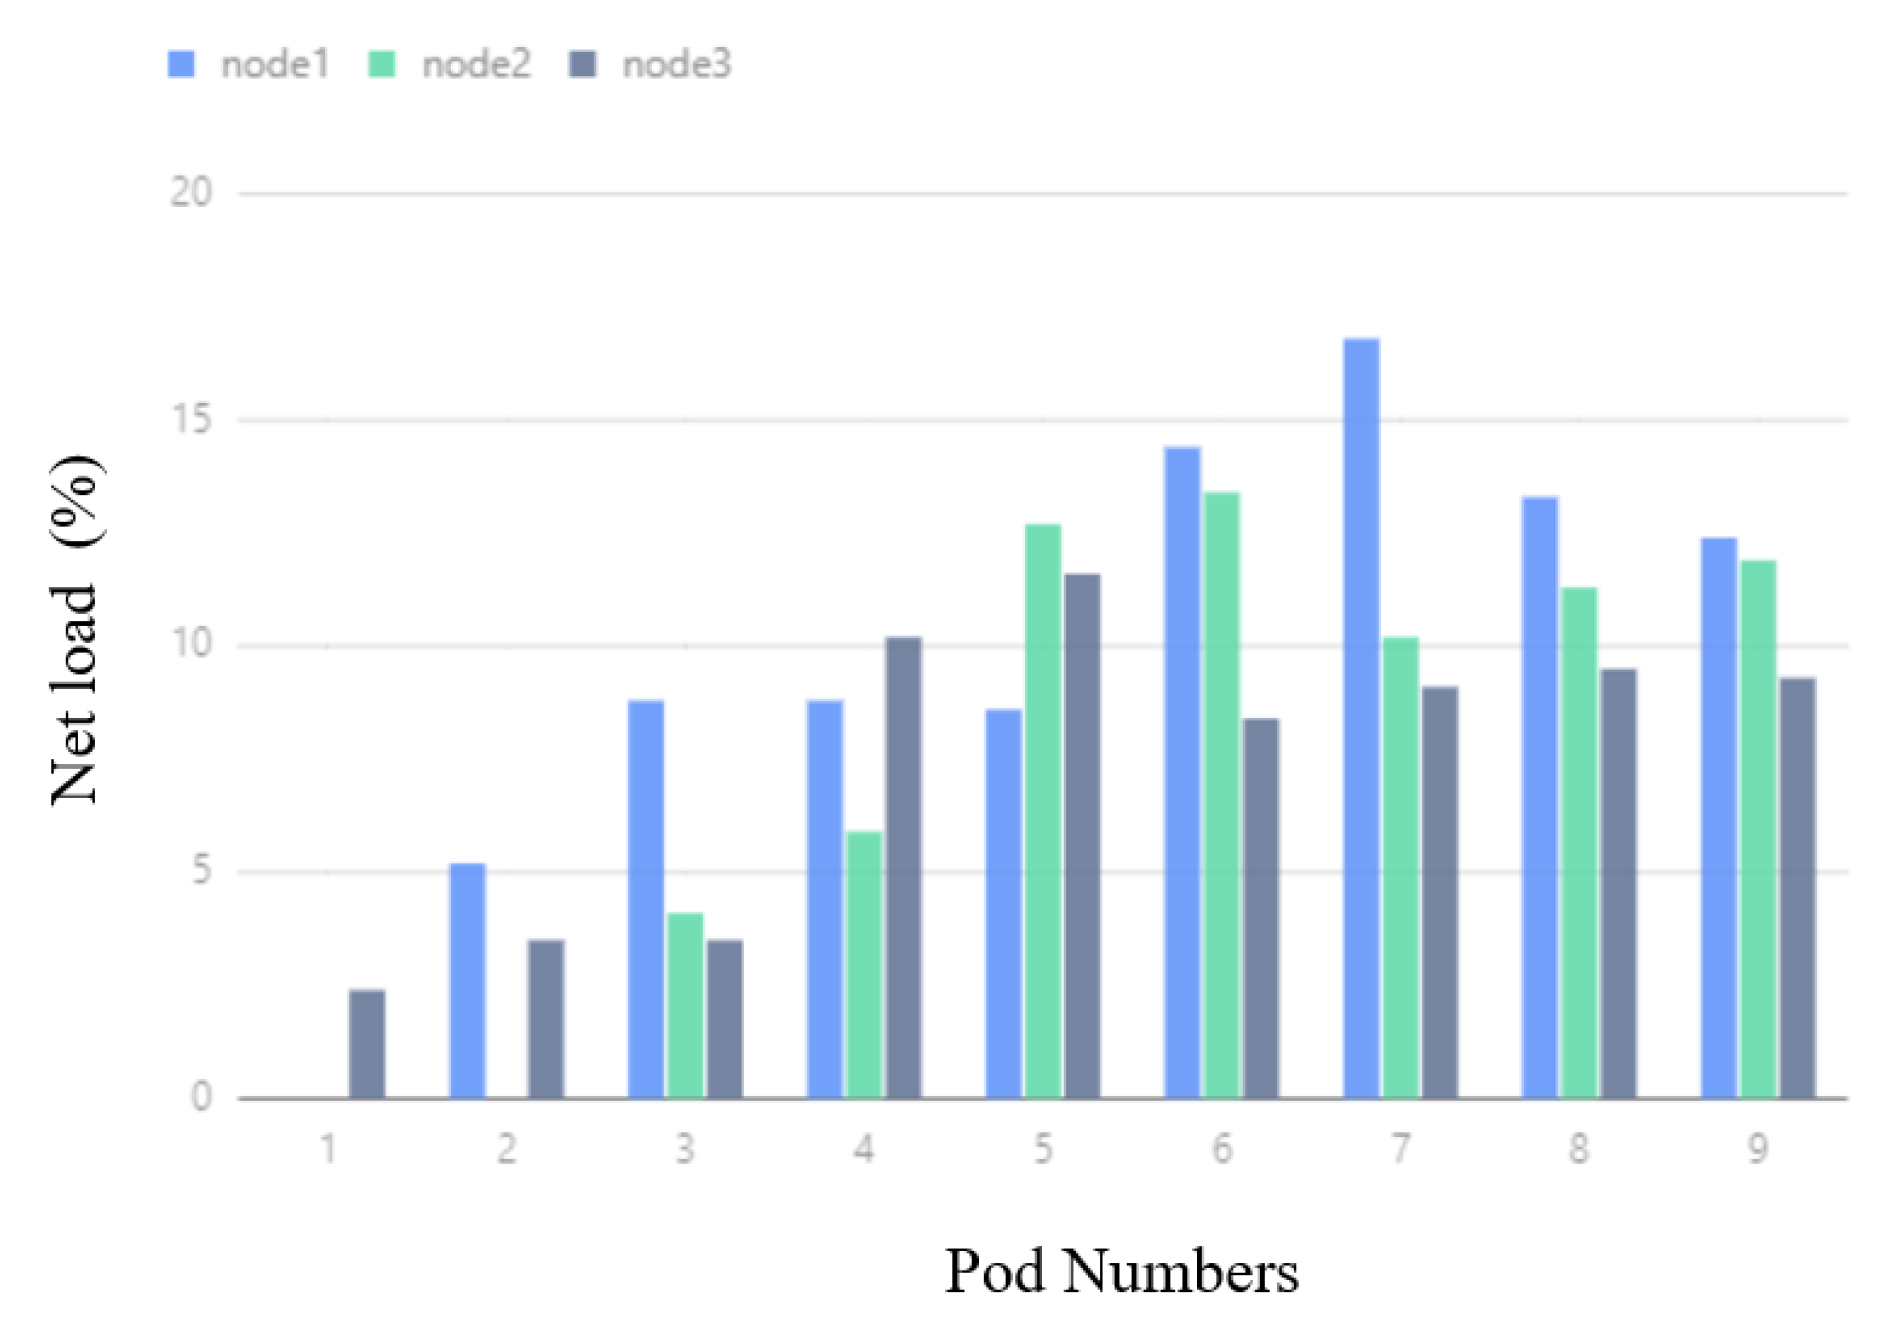
In Figure 14, corresponding to the DSA experiment, when the number of deployed Pods varies from 1 to 7, the network IO usage of Node3 keeps increasing, and the network IO usage of Node1 and Node2 is always small and close to 0. When the number of Pods changes from 8 to 9, the network IO usage of Node2 starts to increase, because Node2 shares a part of the Pods, and the network IO usage of Node3 starts to decrease.
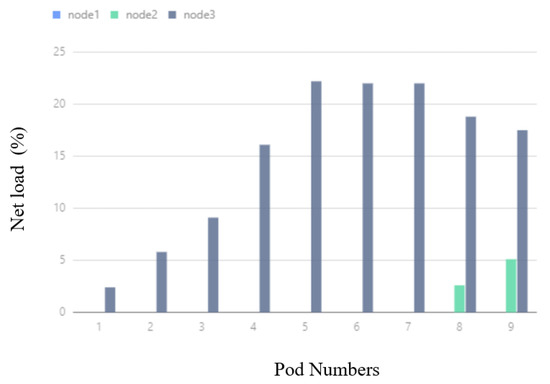
Figure 14.
DSA network IO usage.
In Figure 15, corresponding to the BNIP experiment, when the number of Pods changes from 1 to 3, the node network IO usage rates of Node1 and Node3 increase respectively. In the process of changing the number of Pods from 4 to 9, the network IO usage of the three nodes increases at the same time, but the increase is lower than that in the DSA experiment, and the gap between the network IO usage of the three nodes is much smaller than that in the DSA.
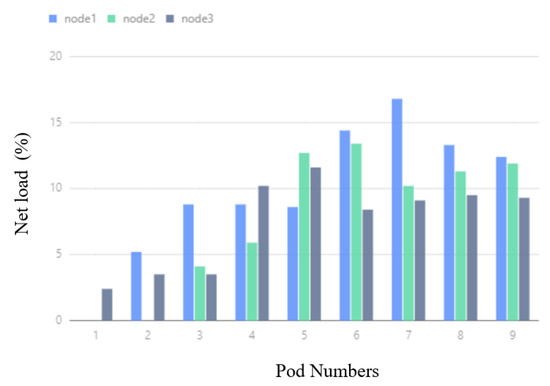
Figure 15.
BNIP network IO usage.
Table 6 shows the distribution of Pods in Nodes in the default scheduling algorithm and BNIP scheduling algorithm. In DSA, no Pod is assigned to Node1, and 1 Pod is assigned to Node2. On the other hand, 8 Pods are allocated to Node 3 and the Pods are centrally scheduled to Node 3. In the experiment BNIP, 2 Pods were allocated on Node1, 3 Pods were allocated on Node2, and 4 Pods were allocated on Node3. The distribution of Pods on the three nodes was much more even than that in the default experiment, and they were not centrally scheduled to a certain condition on the node.
Table 6.
BNIP experiment Pod internode distribution table.
After the experiment, the comprehensive utilization rate of cluster node network IO and the variance of the comprehensive utilization rate of network IO in the DSA and BNIP experiments were calculated, respectively, and the results are shown in Table 7. In the experimental results using the BNIP scheduling algorithm, the network IO utilization and variance are smaller than the experimental results of the DSA.
Table 7.
Comparison of indicators of DSA and BNIP experiments.
5.2.7. Default Configured K8s vs. Opitmized K8s: Overall Comparative Analysis
This experiment tests the performance of the Kubernetes cluster before and after optimization. The servers used in this experiment are created through the Alibaba Cloud platform, and there are a total of four. One is used as the master node and the other three are used as worker nodes. The configuration of the four nodes is shown in Table 8.
Table 8.
Kubernetes cluster configuration details.
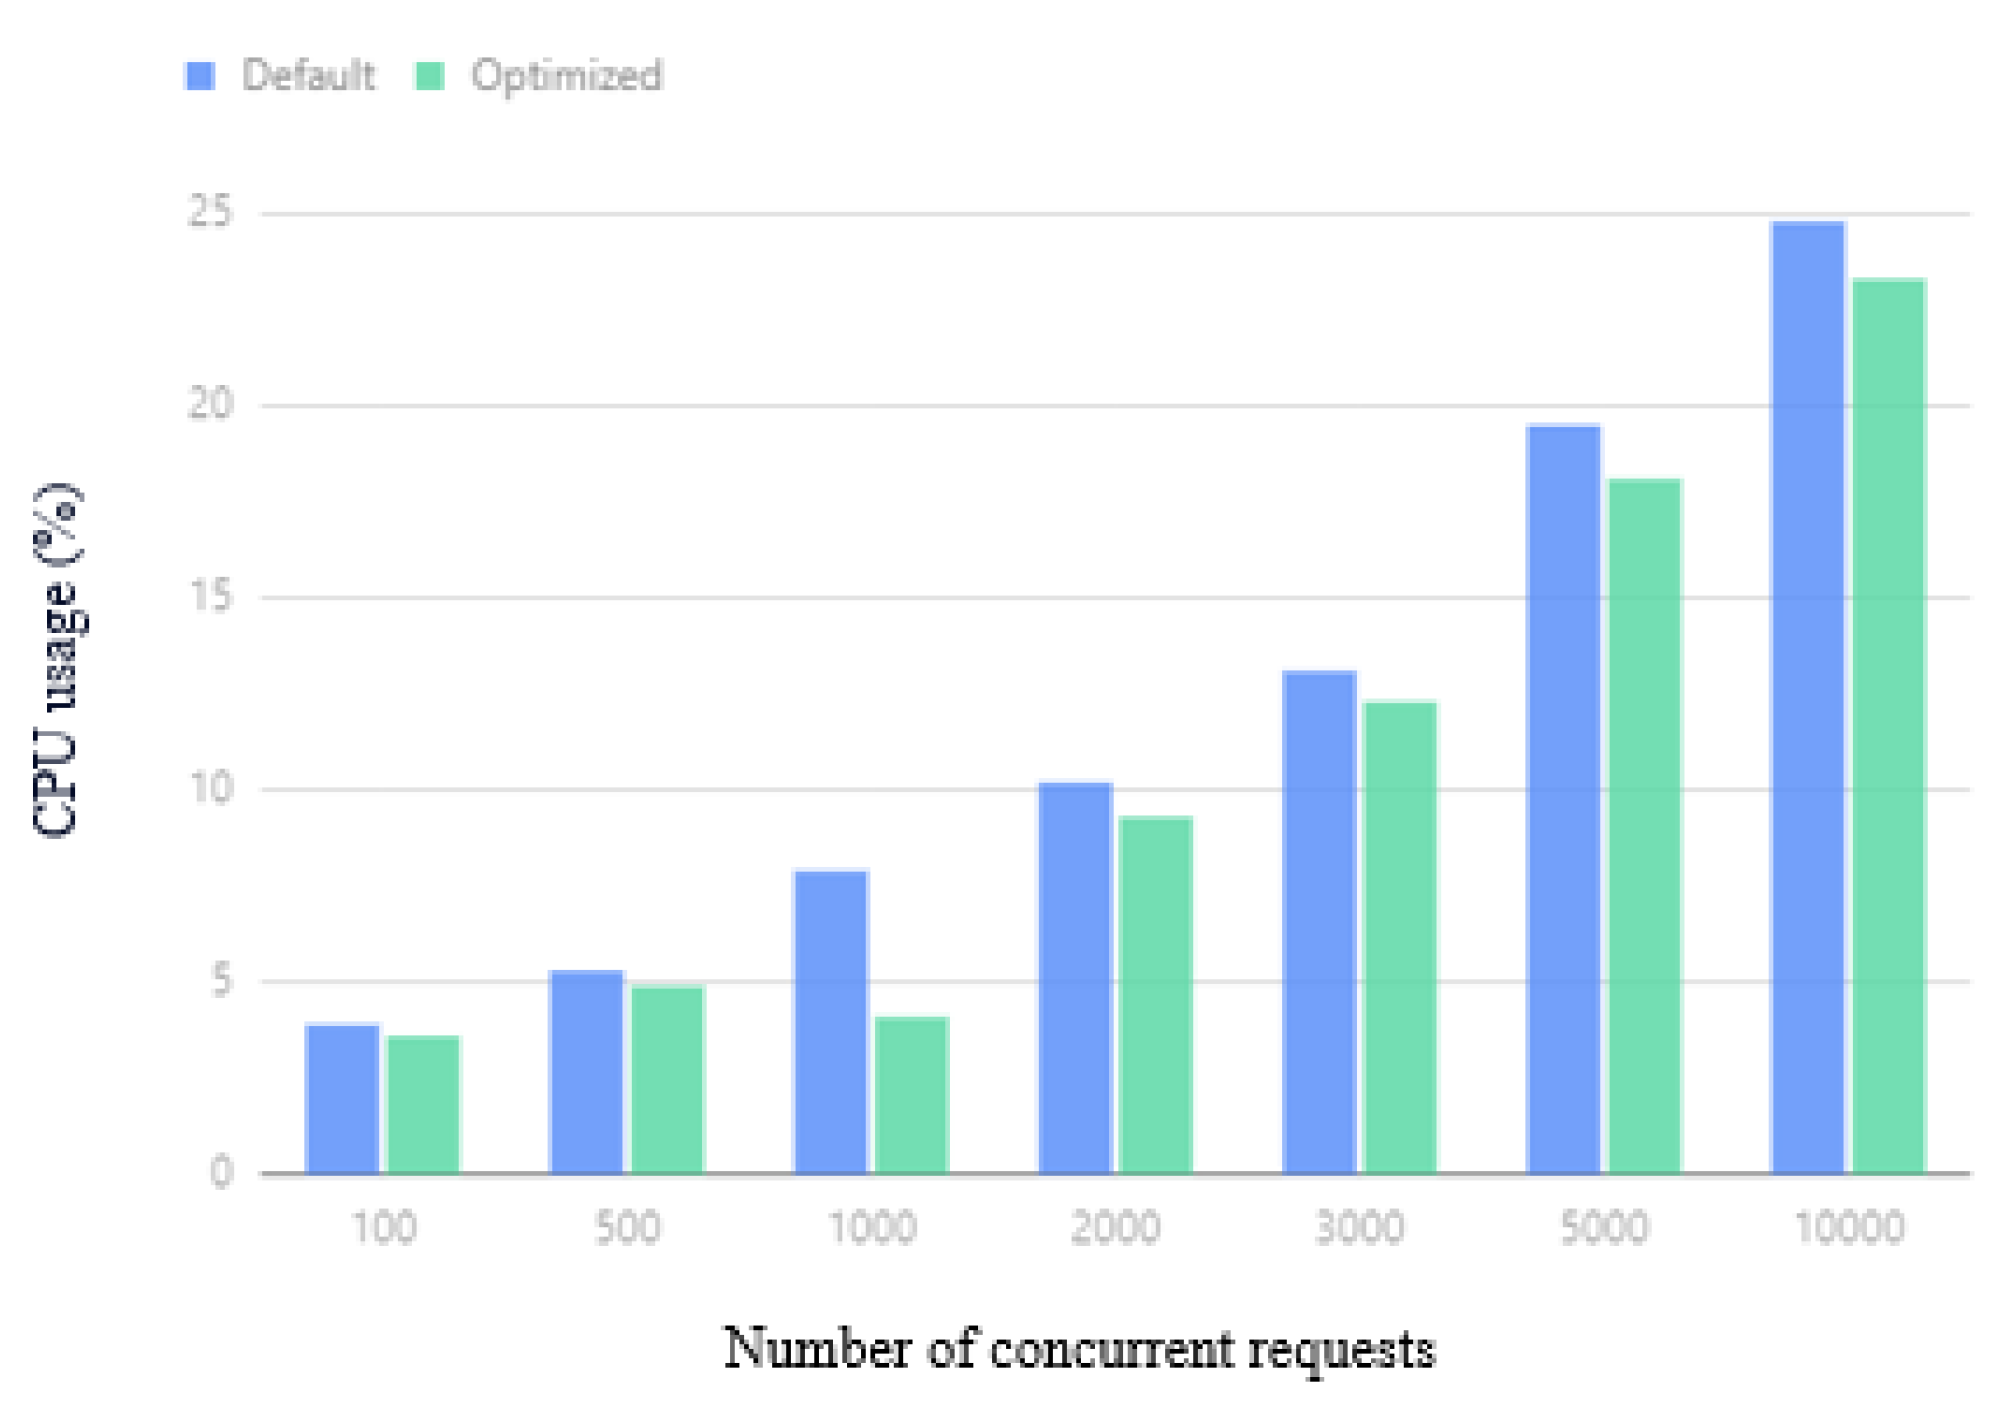
In the comparison experiment, the default Kubernetes cluster (default) is a Kubernetes cluster with native settings and components, and the other cluster is a Kubernetes cluster (optimized) using the optimization method in this paper. The software versions used are Kubernetes version 1.24.1 and Docker version 20.10.12. The container used is the NGINX server [43]. The test condition is to use the default settings of Kubernetes and the improved method proposed in this paper to conduct 100, 500, 1000, 2000, 3000, 5000, and 10,000 concurrent accesses to the Webserver for 30 s. We conduct 10 experiments for each request and count the average CPU usage, average memory usage, average request time, and number of failed requests.
The average CPU usage of the cluster under different concurrent requests is shown in Figure 16. When the number of concurrent requests is 100, 300, or 1000, the difference in effect is not obvious, because the number of concurrent requests is not very high at this time, and the overall CPU consumption is not large. The performance gap is relatively small. As the number of concurrent requests increases, the optimized Kubernetes cluster performance can save up to of the CPU overhead compared with the default Kubernetes performance.
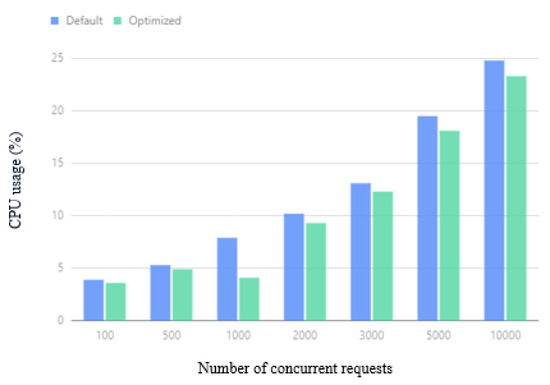
Figure 16.
Average CPU usage.
The average memory usage of the cluster under different concurrent requests is shown in Figure 17. When the number of concurrent requests is 100, 300, or 1000, the difference in effect is not obvious. Compared with the performance of the default Kubernetes cluster, the optimized Kubernetes cluster performance saves an average of memory overhead and can save a minimum of memory overhead. As the number of concurrent requests increases, due to the BNIP algorithm used by the optimized scheduler, Pods with relatively high network traffic are scheduled to one node, reducing the data sent to another node, thereby reducing the use of memory buffers, saving up to memory usage.
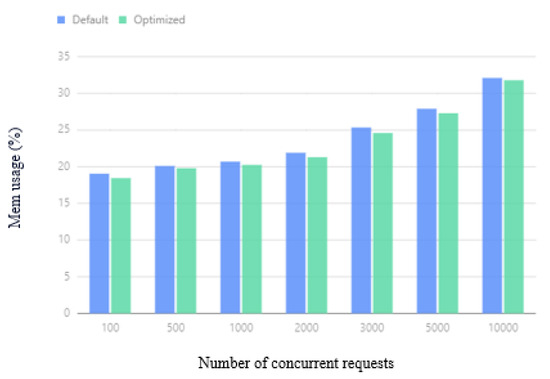
Figure 17.
Average memory usage.
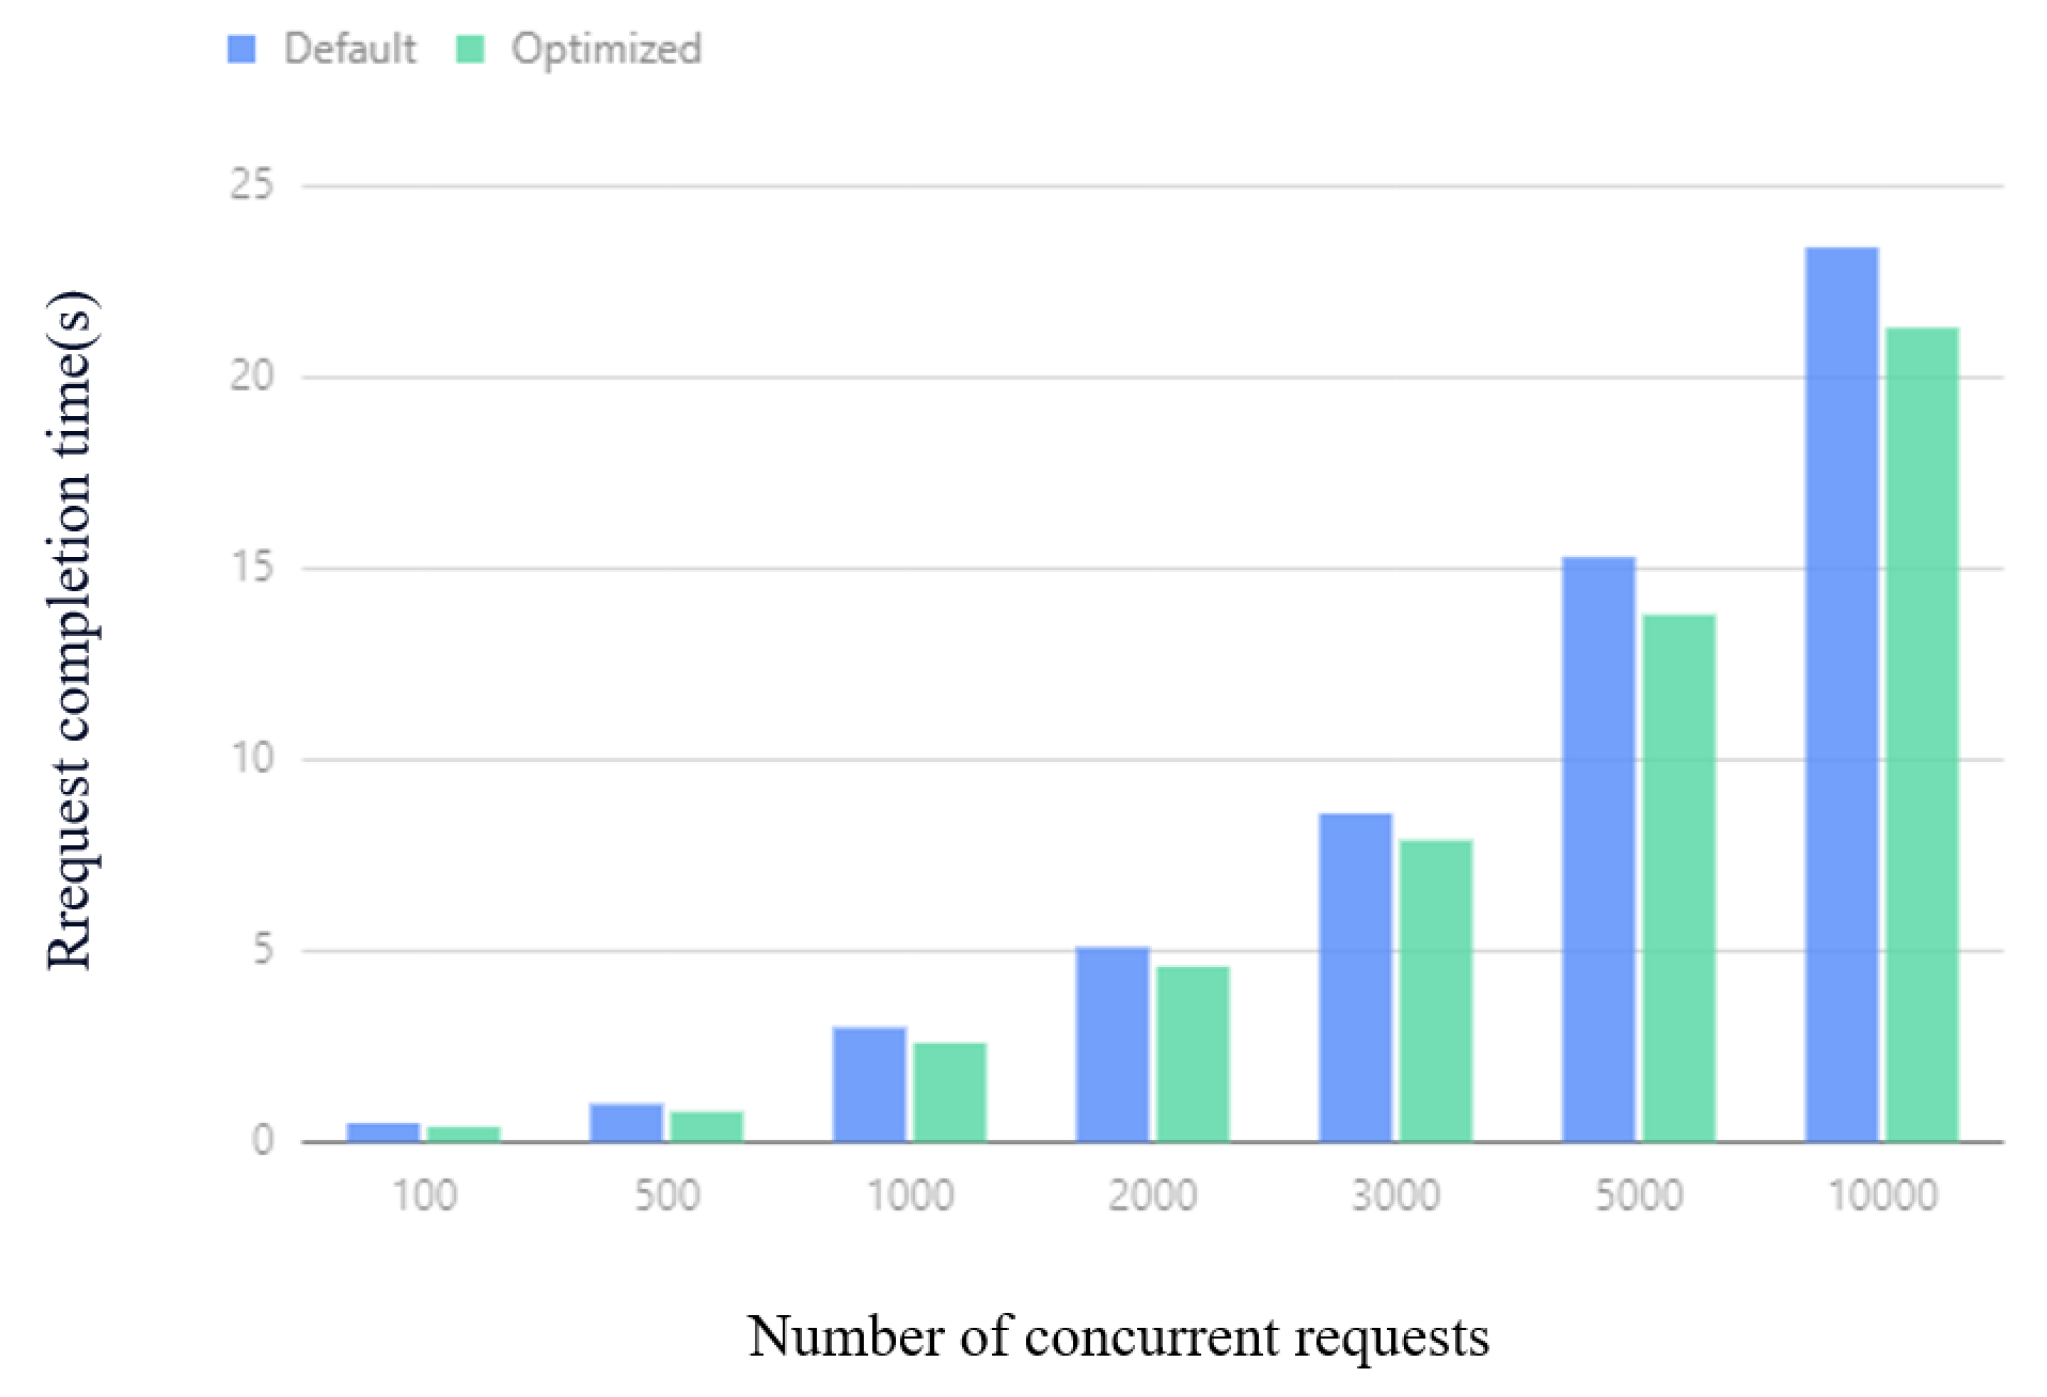
The average request time of the cluster under different concurrent request amounts is shown in Figure 18. It can be observed from Figure 18 that the optimized Kubernetes cluster can complete the specified number of concurrent requests in a shorter time than the default Kubernetes cluster. When the number of concurrent requests is more than 2000, the average request time is reduced by .
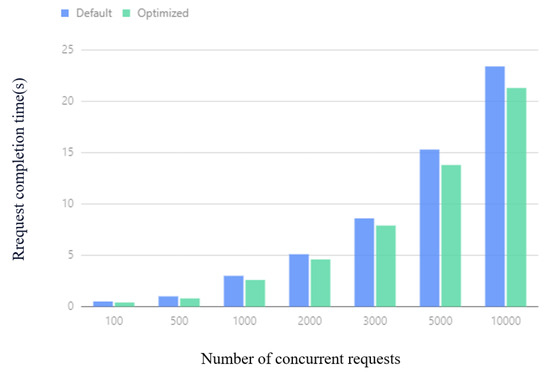
Figure 18.
Average request completion time.
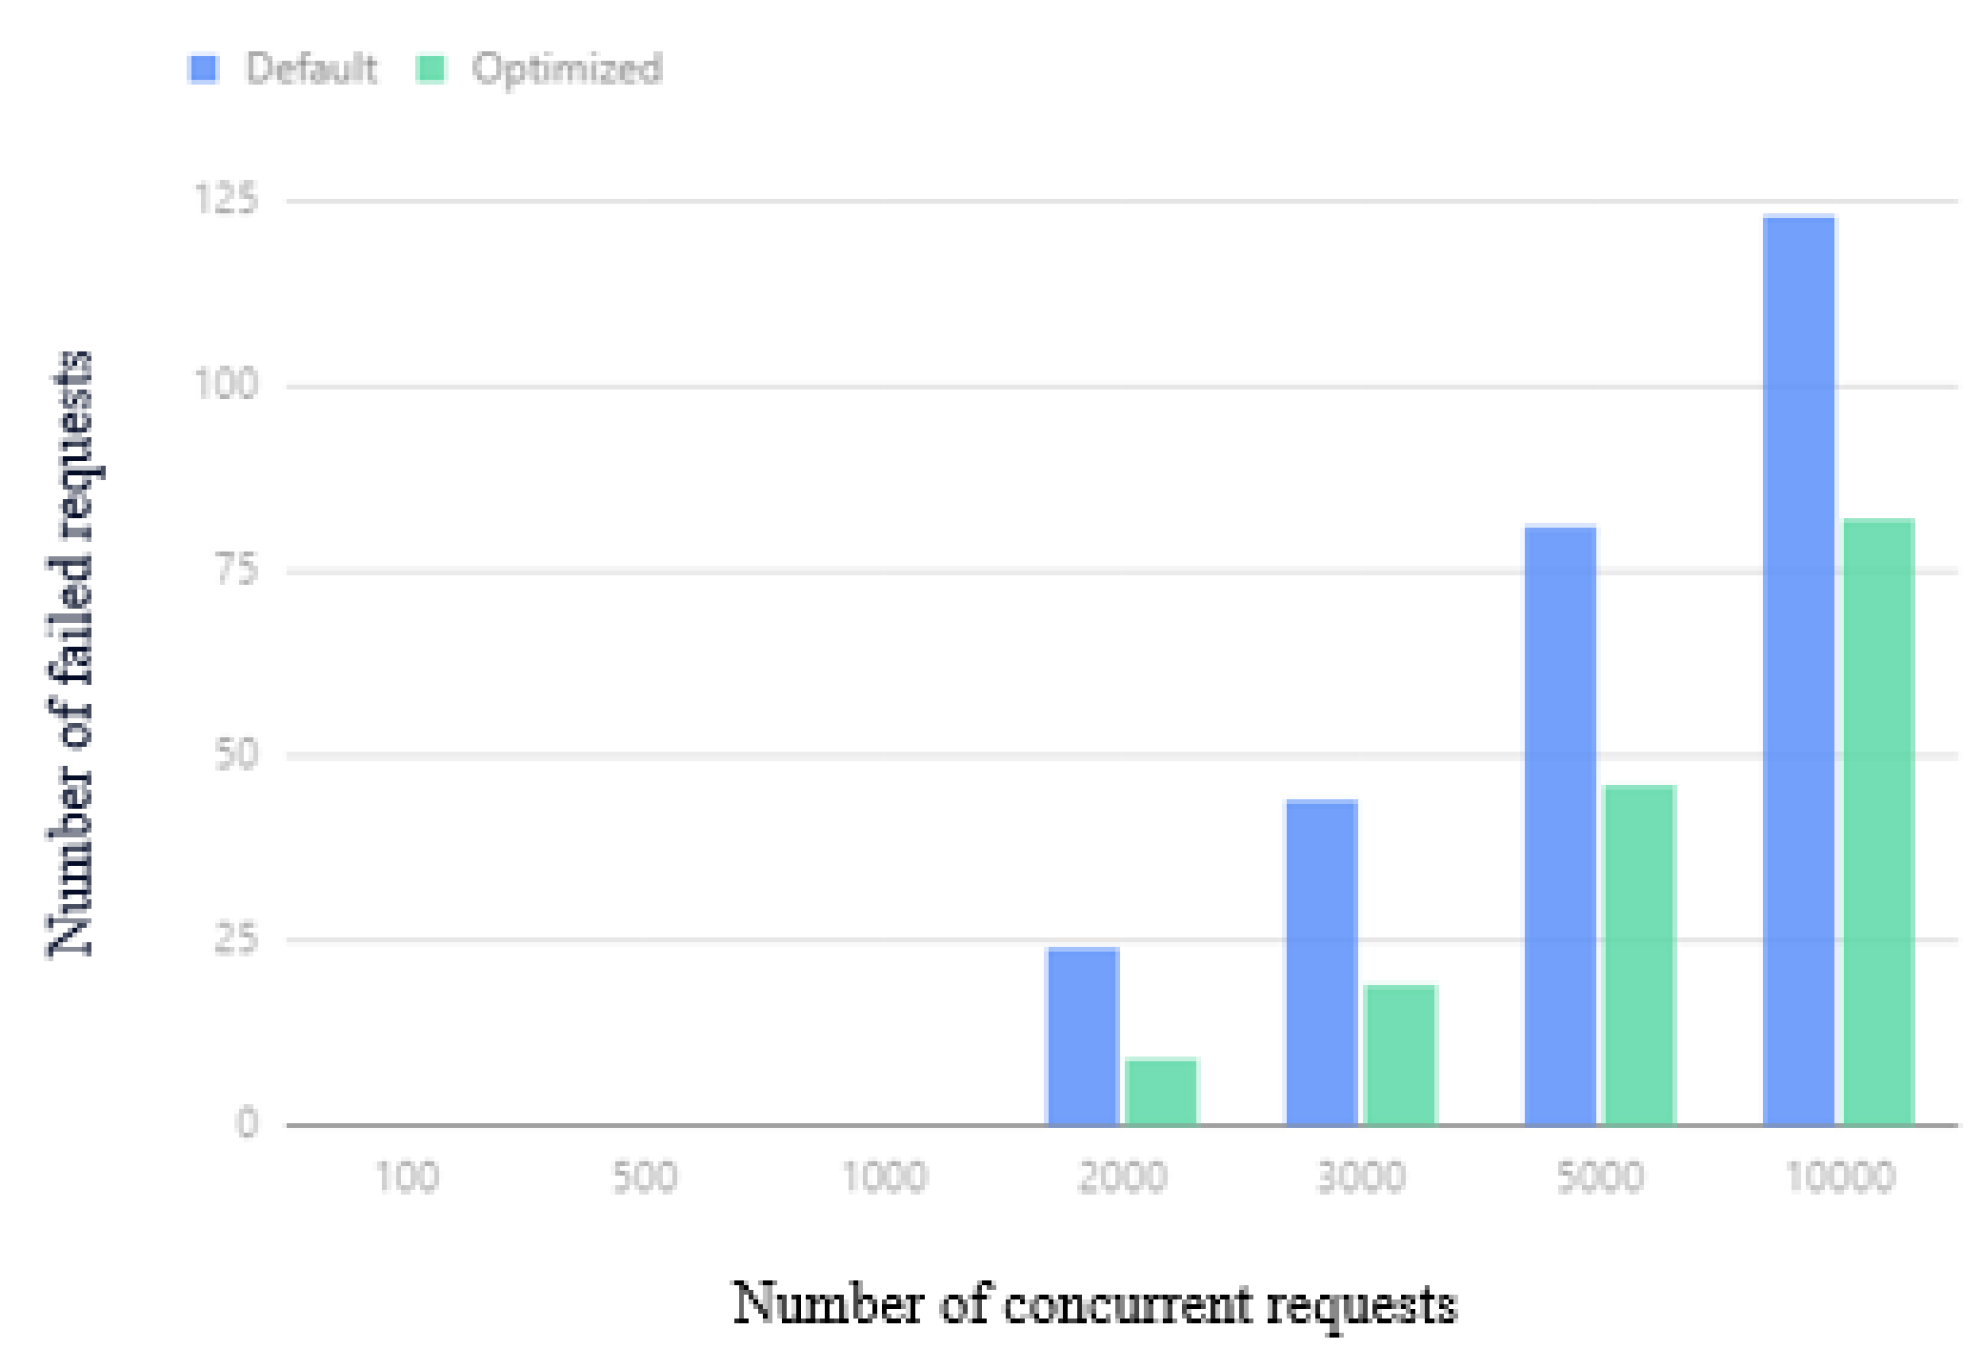
The number of cluster request failures under different concurrent request volumes is shown in Figure 19. The optimized Kubernetes cluster is effective and reduces the number of failures. When the number of concurrent requests is more than 2000, the minimum request failure is reduced by more than 32.4 %.

Figure 19.
Average number of failed requests.
6. Related Work
In this section, we perform a literature review in the context of our study.
6.1. ETCD Performance Optimization
The performance optimization of ETCD is mainly related to hardware and network [35]. Larsson et al. [44] conducted experiments and found that poor ETCD performance leads to poor performance of Kubernetes. Compared with block storage disks attached to the network, VM local fast instance storage plus backup can have more durability, and compared with HDD hard disks, SSD hard disks can significantly improve the performance of ETCD. Determining the deployment method of ETCD and the underlying hard disk type according to different usage environments can improve the read performance of Kubernetes.
Furthermore, Jeffery et al. [45] found that the reason for the expansion of Kubernetes request latency and the decline in availability is that the increase in the amount of synchronization work performed by the leader node increases as the scale of ETCD becomes larger. Therefore, the author suggests that in large-scale clusters, to ensure that the throughput of Kubernetes increases with the increase in the cluster size, the eventual consistency algorithm should be used instead of the consistency algorithm. The methods of Larsson et al. [44] and Jeffery et al. [45] have certain requirements on storage devices, which cannot meet most situations. Therefore, we use the basic optimization of ETCD on the settings of ETCD, which can adapt to more machines.
In our analysis, we deploy etcd to SSD and increase permissions to improve the IO performance of the K8s system.
6.2. Backup and Migration
There are different ways to increase the backup capability. In the face of Kubernetes not providing resource types to define backup Pods, Zhu et al. [46] designed and implemented a controller to manage a custom resource called Backup Pod Set (BPS), the controller responds to the request to create, update, or delete the BPS instance and decide whether to back up the Pod according to the label corresponding to the BPS.
Using a couple of tools can also improve the efficiency and performance of backup. To reduce the work of application developers, Deshpande et al. [47] has also implemented a self-managed backup system with a user interface. The system is based on adaptive scheduling of snapshots, and the frequency of snapshots can be changed according to the size of the load. Users can configure the recovery point objective and backup retention time according to their own needs.
Migration can improve performance through a couple of tools. By using the CRIU (User Space Checkpoint/Restore) feature to check and restore the in-memory state of the processes running in the container, Oh and Kim [48] achieves shorter downtime and lower-cost container migration without the need for external storage components. Lee et al. [49] provides a fault-tolerant application, a container-based light virtualization, and an automatic construction system to achieve modularity, automatic update, and real-time migration on any device.
Both the snapshot-based method and the backup Pod set-based method can realize data backup. Similarly, data migration can also be realized by using CRIU and using an automatic construction system. However, these methods do not provide more options for backup and migration size. For such problems, we use Velero (Velero https://velero.io/, accessed on 7 August 2024) [32], which can provide migrations of different sizes, and we can even choose different tags, types, and namespaces for backup or migration.
6.3. Horizontal Pod Autoscaler (HPA) Optimization
In HPA optimization, metrics are an important factor affecting performance. Casalicchio and Perciballi [50] found that for CPU-intensive workloads, absolute metrics are better suited for the task of resource allocation than relative metrics when it comes to satisfying services such as application response time. Because absolute indicators can more clearly reflect the number of containers that need to be deployed, reducing the response time under high-load servers. Taherizadeh and Grobelnik [51] discovered several influencing factors that were not taken seriously in Kubernetes. When the Average CPU utilization exceeds the conservative constant, the HPA operation occurs, and the unnecessary scaling times are reduced by modifying the interval between scaling operations.
The use of mathematical models can also improve HPA performance. Jin-Gang et al. [52] proposed the monitoring indicators of a unified communications server based on the container Docker to adjust the HPA algorithm. It also uses autoregressive integral and moving average (ARIMA) models to predict future workloads and combine response scaling methods to ensure service quality.
Reinforcement learning can also improve the performance of HPA. Rossi [53] proposed a reinforcement learning model for horizontal and vertical autoscaling. By setting the cost to different weights and training, it can finally be deployed according to user definitions. The goal is to successfully learn the best adaptation strategy.
None of the above methods mentioned that HPA has fewer native indicators, and the types of indicators that can be obtained are relatively limited. Considering this problem, we actively use Prometheus [34] to obtain more indicators and optimize the performance of HPA. Notably, in our other research work [54], we show how to predict load in advance and build a custom Pod reactive autoscaler toward meeting the dynamic demand. In this paper, we keep our tasks as simple as possible, since we focus on multiple goals.
6.4. Load Balancing and Scheduling
We observe that we need to optimize the Ingress controller [18,25,27] to improve the performance of external access. Zhang et al. [55] modified the load balancing component Ingress controller of Kubernetes to implement a solution based on adding request evaluation, endpoint (the backend service container is called endpoint) evaluation, and endpoint matching. Consumption value establishes endpoint evaluation to evaluate the endpoint’s ability to process the request. The matching stage is based on the endpoint evaluation results and the request evaluation results, and finally, it selects a suitable endpoint for matching.
The optimization of the K8s-scheduler model can also improve the performance of the system. Wei et al. [56], while studying the source code of Kubernetes, found that the scheduling module of Kubernetes selects nodes for Pods based on the current optimal node, without considering specific resource usage costs. Finally, the authors combined the improved ant colony algorithm and particle swarm optimization algorithm to improve the K8s scheduling model and reduce the resource cost of Pod scheduling.
Nguyen and Kim [57] proposed a new leader election algorithm, which can evenly distribute leaders on different nodes of the cluster. This method effectively solves the problem that the leader is concentrated on a certain node during the leader election process in Kubernetes, improving the performance of Kubernetes.
It is also a good way to implement a scheduler directly. Liu et al. [58] found that Kubernetes has design flaws in load balancing. When there are too many distribution rules, it will lead to a longer request distribution time, and merely supporting simple static load balancing strategies cannot meet complex business needs. So, support for multi-index dynamic load is proposed. The load balancer of the balancing strategy uses the index collector to collect the indexes and the weight calculator to calculate the indexes, and finally, it realizes the multimetric dynamic load balancing strategy.
The scheduler based on the deep learning model can also have better performance. To solve the difficult problem of scheduling algorithm optimization, Huang et al. [59] designed a multicluster scheduler based on deep reinforcement learning: RLSK. RLSK uses a deep reinforcement learning model to learn how to schedule jobs based on the history of job scheduling among multiple clusters, so that the utilization of different resources in each cluster tends to balance, thereby improving the total utilization of resources rate.
For the optimization of the scheduler, the above methods do not consider enough system indicators, so we develop a scheduler that can meet multiple indicators such as CPU usage and memory utilization to achieve optimal scheduling.
7. Conclusions and Future Work
7.1. Conclusions
As container technology evolves and Kubernetes becomes the de facto standard for container cluster management systems, more and more companies have begun using Kubernetes. We studied the architecture and principles of Kubernetes and observed that the native Kubernetes platform has several areas for improvement, especially, the performance of native Kubernetes components cannot cope with complex application requirements. This paper chooses to optimize Kubernetes to enhance cloud computing as a research topic. The main work content and research results are summarized as follows: (1). For the optimization of ETCD, we use SSD to deploy ETCD and improve the IO priority of ETCD. (2). Aiming at the problem that the default backup strategy of Kubernetes cannot back up objects such as Type, Namespace, and Label, this article uses the Velero framework to back up the Kubernetes cluster. (3). Aiming at the problem that some users cannot access during the rolling update process, this article launches a zero-downtime rolling update strategy. (4). For the performance bottleneck caused by using the default Kubernetes Ingress, this article uses Traefik Ingress as the Ingress controller. (5). To solve the problem that cAdvisor cannot obtain more timely data, this paper uses the Prometheus server to obtain Kubernetes cluster indicators. (6). Aiming at the lack of consideration of node network IO resources in the default scheduling algorithm of Kubernetes, this paper proposes a scheduling algorithm based on node network IO balance (BNIP algorithm). The BNIP algorithm takes the network IO requirements of the Pods to be scheduled and the current network usage of the candidate nodes as the scheduling basis and selects the best scheduling node. The experiment results validate our study and show that compared with the default settings, the optimized Kubernetes platform can work better and help enhance QoS with reduced resource usage.
7.2. Limitations and Future Work
Although the current optimization scheme has a certain performance improvement compared with the native Kubernetes platform, there is still a lot of room for improvement. In future research, research can be carried out from the following aspects:
- HPA performance optimization. The current method of using Prometheus to obtain metrics can respond to changes in the entire cluster in a more timely manner, but there is still a certain lag. Predicting HPA might be a better approach.
- Add more custom scheduling algorithms and more system indicators to improve scheduling performance in different environments.
- Perform more in-depth optimization according to the needs and characteristics of different platforms to achieve performance improvement. For example, scheduling algorithms and HPA indicators can be customized according to platform requirements.
Author Contributions
Conceptualization, S.K.M., Z.Z. and Y.C.; Methodology, S.K.M., Z.Z. and Y.C.; Software, Z.Z. and S.K.M.; Validation, Z.Z., S.K.M. and Y.C.; Formal analysis, S.K.M., Z.Z. and Y.C.; Investigation, S.K.M. and Z.Z.; Resources, S.K.M. and Z.Z.; Writing—original draft, S.K.M. and Z.Z.; Writing—review & editing, S.K.M., Z.Z. and Y.C.; Visualization, Z.Z.; Supervision, S.K.M.; Project administration, S.K.M.; Funding acquisition, S.K.M. All authors have read and agreed to the published version of the manuscript.
Funding
This work was supported by The Science and Technology Development Fund of Macao, Macao SAR, China under grant 0033/2022/ITP.
Data Availability Statement
Data are contained within the article.
Acknowledgments
Authors gratefully acknowledge the funding source. The authors also would like to thank the anonymous reviewers for their quality reviews and suggestions.
Conflicts of Interest
The authors declare no conflicts of interest.
References
- Xiao, Z.; Song, W.; Chen, Q. Dynamic resource allocation using virtual machines for cloud computing environment. IEEE Trans. Parallel Distrib. Syst. 2012, 24, 1107–1117. [Google Scholar] [CrossRef]
- Huang, K.; Chen, H. The Applied Research on the Virtualization Technology in Cloud Computing. In Proceedings of the 1st International Workshop on Cloud Computing and Information Security, Shanghai, China, 9–11 November 2013; pp. 526–529. [Google Scholar]
- Bernstein, D. Containers and cloud: From lxc to docker to kubernetes. IEEE Cloud Comput. 2014, 1, 81–84. [Google Scholar] [CrossRef]
- Merkel, D. Docker: Lightweight linux containers for consistent development and deployment. Linux j 2014, 239, 2. [Google Scholar]
- Bentaleb, O.; Belloum, A.S.; Sebaa, A.; El-Maouhab, A. Containerization technologies: Taxonomies, applications and challenges. J. Supercomput. 2022, 78, 1144–1181. [Google Scholar] [CrossRef]
- Bigelow, S.J. What Is Docker and How Does It Work? 2020. Available online: https://www.techtarget.com/searchitoperations/definition/Docker/ (accessed on 7 August 2024).
- Anderson, C. Docker [software engineering]. IEEE Softw. 2015, 32, 102–c3. [Google Scholar] [CrossRef]
- Hat, R. What Is Kubernetes, 2020. Available online: https://www.redhat.com/en/topics/containers/what-is-kubernetes/ (accessed on 7 August 2024).
- Burns, B.; Grant, B.; Oppenheimer, D.; Brewer, E.; Wilkes, J. Borg, omega, and kubernetes. Commun. ACM 2016, 59, 50–57. [Google Scholar] [CrossRef]
- Mondal, S.K.; Pan, R.; Kabir, H.D.; Tian, T.; Dai, H.N. Kubernetes in IT administration and serverless computing: An empirical study and research challenges. J. Supercomput. 2022, 78, 2937–2987. [Google Scholar] [CrossRef]
- Ongaro, D.; Ousterhout, J. In search of an understandable consensus algorithm. In Proceedings of the 2014 USENIX Annual Technical Conference (USENIX ATC 14), Philadelphia, PA, USA, 19–20 June 2014; pp. 305–319. [Google Scholar]
- Oliveira, C.; Lung, L.C.; Netto, H.; Rech, L. Evaluating raft in docker on kubernetes. In Proceedings of the Advances in Systems Science: Proceedings of the International Conference on Systems Science 2016 (ICSS 2016) 19, Wroclaw, Poland, 7–9 September 2016; pp. 123–130. [Google Scholar]
- Rodríguez, H.; Quarantelli, E.L.; Dynes, R.R.; Smith, G.P.; Wenger, D. Sustainable disaster recovery: Operationalizing an existing agenda. In Handbook of Disaster Research; Springer: New York, NY, USA, 2007; pp. 234–257. [Google Scholar]
- Sameer; De, S.; Prashant Singh, R. Selective Analogy of Mechanisms and Tools in Kubernetes Lifecycle for Disaster Recovery. In Proceedings of the 2022 IEEE 2nd International Conference on Mobile Networks and Wireless Communications (ICMNWC), Tumkur, Karnataka, India, 2–3 December 2022; pp. 1–6. [Google Scholar] [CrossRef]
- Malviya, A.; Dwivedi, R.K. A Comparative Analysis of Container Orchestration Tools in Cloud Computing. In Proceedings of the 2022 9th International Conference on Computing for Sustainable Global Development (INDIACom), New Delhi, India, 23–25 March 2022; pp. 698–703. [Google Scholar] [CrossRef]
- Jackson, K. Kubernetes Rolling Updates. Available online: https://www.bluematador.com/blog/kubernetes-deployments-rolling-update-configuration (accessed on 20 May 2024).
- Shan, C.; Xia, Y.; Zhan, Y.; Zhang, J. KubeAdaptor: A docking framework for workflow containerization on Kubernetes. Future Gener. Comput. Syst. 2023, 148, 584–599. [Google Scholar] [CrossRef]
- Vayghan, L.A.; Saied, M.A.; Toeroe, M.; Khendek, F. Deploying microservice based applications with kubernetes: Experiments and lessons learned. In Proceedings of the 2018 IEEE 11th international conference on cloud computing (CLOUD), San Francisco, CA, USA, 2–7 July 2018; pp. 970–973. [Google Scholar]
- Balla, D.; Simon, C.; Maliosz, M. Adaptive scaling of Kubernetes Pods. In Proceedings of the NOMS 2020-2020 IEEE/IFIP Network Operations and Management Symposium, Budapest, Hungary, 20–24 April 2020; pp. 1–5. [Google Scholar]
- Menouer, T. KCSS: Kubernetes container scheduling strategy. J. Supercomput. 2021, 77, 4267–4293. [Google Scholar] [CrossRef]
- Pérez de Prado, R.; García-Galán, S.; Muñoz-Expósito, J.E.; Marchewka, A.; Ruiz-Reyes, N. Smart containers schedulers for microservices provision in cloud-fog-IoT networks. Challenges and opportunities. Sensors 2020, 20, 1714. [Google Scholar] [CrossRef] [PubMed]
- Senjab, K.; Abbas, S.; Ahmed, N.; Khan, A.u.R. A survey of Kubernetes scheduling algorithms. J. Cloud Comput. 2023, 12, 87. [Google Scholar] [CrossRef]
- Rejiba, Z.; Chamanara, J. Custom scheduling in kubernetes: A survey on common problems and solution approaches. ACM Comput. Surv. 2022, 55, 1–37. [Google Scholar] [CrossRef]
- Salinger, N. Autoscaling with Kubernetes HPA: How It Works with Examples, 2022. Available online: https://granulate.io/blog/kubernetes-autoscaling-the-hpa/ (accessed on 7 August 2024).
- Kubernetes_Official_Documentation. Ingress in Kubernetes, 2023. Available online: https://kubernetes.io/docs/concepts/services-networking/ingress/ (accessed on 11 July 2023).
- Kubernetes_Official_Documentation. Service in Kubernetes, 2023. Available online: https://kubernetes.io/docs/concepts/services-networking/service/#publishing-services-service-types (accessed on 7 August 2024).
- Kubernetes_Official_Documentation. Ingress Controller in Kubernetes, 2023. Available online: https://kubernetes.io/docs/concepts/services-networking/ingress-controllers/ (accessed on 11 July 2023).
- Altaf, U.; Jayaputera, G.; Li, J.; Marques, D.; Meggyesy, D.; Sarwar, S.; Sharma, S.; Voorsluys, W.; Sinnott, R.; Novak, A.; et al. Auto-scaling a defence application across the cloud using docker and kubernetes. In Proceedings of the 2018 IEEE/ACM International Conference on Utility and Cloud Computing Companion (UCC Companion), Zurich, Switzerland, 17–20 December 2018; pp. 327–334. [Google Scholar]
- Cloud, A. Getting Started with Kubernetes|Scheduling Process and Scheduler Algorithms, 2021. Available online: https://alibaba-cloud.medium.com/getting-started-with-kubernetes-scheduling-process-and-scheduler-algorithms-847e660533f1 (accessed on 13 July 2023).
- Fu, P. How to Customize Kubernetes Scheduler, 2021. Available online: https://medium.com/gemini-open-cloud/kubernetes-scheduler-%E5%AE%A2%E8%A3%BD%E5%8C%96%E7%9A%84%E6%96%B9%E6%B3%95-d662b4b7d279 (accessed on 7 August 2024).
- Tao, P. Kubernetes-v120-Architecture, 2020. Available online: https://blog.csdn.net/projim_tao/article/details/130140048 (accessed on 13 July 2023).
- Diagboya, E. What Is Velero? 2021. Available online: https://medium.com/mycloudseries/what-is-velero-1f205650b76c (accessed on 5 January 2023).
- SINGH, M. What Is Traefik and How to Learn Traefik? 2021. Available online: https://www.devopsschool.com/blog/what-is-traefik-how-to-learn-traefik/ (accessed on 1 January 2023).
- Patel, A. Prometheus—Overview, 2023. Available online: https://medium.com/devops-mojo/prometheus-overview-what-is-prometheus-introduction-92e064cff606 (accessed on 1 January 2023).
- Maayan, G.D. What Is Etcd and How Is It Used in Kubernetes? 2019. Available online: https://dev.to/giladmaayan/what-is-etcd-and-how-is-it-used-in-kubernetes-47bg (accessed on 1 January 2023).
- Xiaoshi, B. Analysis of Kubernetes Scheduler SchedulerExtender, 2020. Available online: https://my.oschina.net/u/4131034/blog/3162549 (accessed on 13 July 2023).
- Liggitt, J. Kubernetes. 2023. Available online: https://github.com/kubernetes/kubernetes/tree/master (accessed on 7 August 2024).
- Wittig, K. Kubernetes Metrics—The Complete Guide, 2021. Available online: https://www.kubermatic.com/blog/the-complete-guide-to-kubernetes-metrics/ (accessed on 13 July 2023).
- Labadie, C. Fortio: Load Testing Library, Command Line Tool, Advanced Echo Server, 2022. Available online: https://github.com/fortio/fortio (accessed on 7 August 2024).
- Mukherjee, A. An Inexact Introduction to Envoy, 2020. Available online: https://errindam.medium.com/an-inexact-introduction-to-envoy-ac41949834b5 (accessed on 18 June 2023).
- Lixu, T. Nginx Ingress Controller, 2022. Available online: https://blog.devgenius.io/k8s-nginx-ingress-controller-36bb06f95ac2 (accessed on 18 June 2023).
- Pedamkar, P. Gatling Load Testing, 2022. Available online: https://www.educba.com/gatling-load-testing/ (accessed on 1 January 2023).
- Alkraien, A. Intro to Nginx Web Server, 2022. Available online: https://medium.com/javarevisited/intro-to-nginx-web-server-part-1-bb590fad7035 (accessed on 18 June 2023).
- Larsson, L.; Tärneberg, W.; Klein, C.; Elmroth, E.; Kihl, M. Impact of etcd deployment on Kubernetes, Istio, and application performance. Softw. Pract. Exp. 2020, 50, 1986–2007. [Google Scholar] [CrossRef]
- Jeffery, A.; Howard, H.; Mortier, R. Rearchitecting Kubernetes for the Edge. In Proceedings of the 4th International Workshop on Edge Systems, Analytics and Networking, Online, 26 April 2021; pp. 7–12. [Google Scholar]
- Zhu, M.; Kang, R.; He, F.; Oki, E. Implementation of Backup Resource Management Controller for Reliable Function Allocation in Kubernetes. In Proceedings of the 2021 IEEE 7th International Conference on Network Softwarization (NetSoft), Virtual, 28 June–2 July 2021; pp. 360–362. [Google Scholar]
- Deshpande, U.; Linck, N.; Seshadri, S. Self-service data protection for stateful containers. In Proceedings of the 13th ACM Workshop on Hot Topics in Storage and File Systems, Virtual, 27–28 July 2021; pp. 71–76. [Google Scholar]
- Oh, S.; Kim, J. Stateful container migration employing checkpoint-based restoration for orchestrated container clusters. In Proceedings of the 2018 International Conference on Information and Communication Technology Convergence (ICTC), Jeju Island, Republic of Korea, 17–19 October 2018; pp. 25–30. [Google Scholar]
- Lee, J.; Jeong, H.; Lee, W.J.; Suh, H.J.; Lee, D.; Kang, K. Advanced Primary–Backup Platform with Container-Based Automatic Deployment for Fault-Tolerant Systems. Wirel. Pers. Commun. 2018, 98, 3177–3194. [Google Scholar] [CrossRef]
- Casalicchio, E.; Perciballi, V. Auto-scaling of containers: The impact of relative and absolute metrics. In Proceedings of the 2017 IEEE 2nd International Workshops on Foundations and Applications of Self Systems (FASW), Tucson, AZ, USA, 18–22 September 2017; pp. 207–214. [Google Scholar]
- Taherizadeh, S.; Grobelnik, M. Key influencing factors of the Kubernetes auto-scaler for computing-intensive microservice-native cloud-based applications. Adv. Eng. Softw. 2020, 140, 102734. [Google Scholar] [CrossRef]
- Yu, J.-G.; Zhai, Y.-R.; Yu, B.; Li, S. Research and application of auto-scaling unified communication server based on Docker. In Proceedings of the 2017 10th International Conference on Intelligent Computation Technology and Automation (ICICTA), Changsha, China, 9–10 October 2017; pp. 152–156. [Google Scholar]
- Rossi, F. Auto-scaling Policies to Adapt the Application Deployment in Kubernetes. In Proceedings of the ZEUS, Potsdam, Germany, 20–21 February 2020; pp. 30–38. [Google Scholar]
- Mondal, S.K.; Wu, X.; Kabir, H.M.D.; Dai, H.N.; Ni, K.; Yuan, H.; Wang, T. Toward Optimal Load Prediction and Customizable Autoscaling Scheme for Kubernetes. Mathematics 2023, 11, 2675. [Google Scholar] [CrossRef]
- Zhang, J.; Ren, R.; Huang, C.; Fei, X.; Qun, W.; Cai, H. Service dependency based dynamic load balancing algorithm for container clusters. In Proceedings of the 2018 IEEE 15th International Conference on e-Business Engineering (ICEBE), Xi’an, China, 12–14 October 2018; pp. 70–77. [Google Scholar]
- Zhang, W.-g.; Ma, X.-l.; Zhang, J.-z. Research on Kubernetes’ Resource Scheduling Scheme. In Proceedings of the 8th International Conference on Communication and Network Security, Qingdao, China, 2–4 November 2018; pp. 144–148. [Google Scholar]
- Nguyen, N.D.; Kim, T. Balanced Leader Distribution Algorithm in Kubernetes Clusters. Sensors 2021, 21, 869. [Google Scholar] [CrossRef] [PubMed]
- Liu, Q.; Haihong, E.; Song, M. The design of multi-metric load balancer for kubernetes. In Proceedings of the 2020 International Conference on Inventive Computation Technologies (ICICT), Coimbatore, Tamilnadu, India, 26–28 February 2020; pp. 1114–1117. [Google Scholar]
- Huang, J.; Xiao, C.; Wu, W. Rlsk: A job scheduler for federated kubernetes clusters based on reinforcement learning. In Proceedings of the 2020 IEEE International Conference on Cloud Engineering (IC2E), Sydney, Australia, 21–24 April 2020; pp. 116–123. [Google Scholar]


Disclaimer/Publisher’s Note: The statements, opinions and data contained in all publications are solely those of the individual author(s) and contributor(s) and not of MDPI and/or the editor(s). MDPI and/or the editor(s) disclaim responsibility for any injury to people or property resulting from any ideas, methods, instructions or products referred to in the content. |
© 2024 by the authors. Licensee MDPI, Basel, Switzerland. This article is an open access article distributed under the terms and conditions of the Creative Commons Attribution (CC BY) license (https://creativecommons.org/licenses/by/4.0/).