Article

Stability Analysis of Innovation Collaboration between Commercial Banks and Fintech Companies

School of Management Science and Engineering, Shandong Technology and Business University, Yantai 254005, China
*
Author to whom correspondence should be addressed.
Mathematics 2024, 12(17), 2724; https://doi.org/10.3390/math12172724 (registering DOI)
Submission received: 17 July 2024 / Revised: 29 August 2024 / Accepted: 29 August 2024 / Published: 31 August 2024
(This article belongs to the Section Financial Mathematics)

Abstract

:
Recently, there has been an increasing trend among commercial banks to collaborate with fintech companies in order to promote corporate innovation. However, due to the uncertainty and turbulence of the business environment, it is difficult for the collaborators to generate full trust to integrate knowledge and resources. Innovation collaboration often suffers from instability. The objective of this study is to identify the factors that influence the stability of innovation collaboration and clarify the path of collaboration evolution. Based on prospect theory and evolutionary game theory, this study first establishes an evolutionary game model between commercial banks and fintech companies (fintechs), and analyses the factors influencing the stability of their collaboration. The findings indicate that the benefits and costs of innovation collaboration, the fairness of income distribution, the complementarity of knowledge and technology, the synergy of collaboration, and the perceived value of gains and losses by partners all influence the stability of innovation collaboration. This study’s findings provide valuable guidance for banks and fintech companies to balance the benefits and costs of collaboration and improve the stability of collaboration. In the future, the government will be considered as a new game player, and bilateral relations will be considered as a new mode of collaboration in studying the stability of innovation collaboration.

1. Introduction

The integration of finance and technology has dramatically enhanced in the last few decades as a result of the constant process of accepting and adopting digital technology by the financial industry. Financial technology (fintech) has helped to reduce asymmetric information problems and has optimized resource allocation in the financial industry [1]. The financial industry has undergone an unprecedented revolution with the emergence of fintech companies, which use a variety of emerging technologies, such as big data analysis tools, cloud computing, machine learning, blockchain, and artificial intelligence, to create new business models and endow the development of real economics [2,3]. As an emerging productive force in the financial sector, fintech companies can set up efficient communication with customers at high penetration, good experience, and low cost, and fit well into digital ecosystems by efficiently distributing their services through platforms [4]. Meanwhile, traditional commercial banks are faced with a high degree of operating costs due to using of manual services and the opening of numerous branches. Technological progress has the potential to disrupt the traditional bank business model by causing vertical and horizontal disintegration. With the number of available financial services and their complexity enhancing, traditional commercial banks are forced to rethink their current value delivery and reshape their business model. The most digitally ambitious banks may adopt fintech to maintain competitiveness. The successful implementation of fintech in commercial banks can significantly reduce credit risk [5], enhance traditional business models [6], and improve bank performance [7,8]. Nevertheless, it has become challenging for commercial banks to advance fintech applications and innovation, relying on their resources and capabilities. Consequently, more banks are recognizing the importance of forming partnerships with fintech companies to overcome internal barriers [9,10]. Fintech companies can gradually take over services that do not require access to deposit funding, such as payments and asset management. Additionally, fintech companies can emerge as intermediaries between banks and their customers (borrowers and depositors). According to a report released by KPMG and the National Internet Finance Association of China (NIFA), 71% of fintechs have established close collaborations with traditional financial institutions to engage in open innovation [11]. The innovation collaboration between banks and fintechs can be described as the interaction and interchange of ideas between banks and fintechs in developing fintech innovations, such as financial products, services, processes, organizational designs, and business models. In March 2017, the China Construction Bank (CCB) announced a strategic collaboration agreement with Ant Financial, a leading fintech company in China. This marked the first instance of such collaboration in China’s banking sector. Over the past five years, there has been a significant increase in partnerships between banks and fintech companies. By the end of 2020, the four largest commercial banks, thirteen joint-stock banks, and more than forty of the 134 city commercial banks in China had established strategic collaborations with fintech companies. Collaborative relationships with fintech companies, which often involve trust, information exchange and joint problem-solving, have been studied extensively as an antecedent to dynamic capabilities development in banks. These collaborations often lead to the rapid acquisition of critical knowledge and enhanced innovation performance [9,12].
However, fintech–bank partnerships often face instability due to challenges in allocating collaboration risks, sharing costs, and distributing benefits. As collaboration frictions evolve, the stability of these partnerships fluctuates, with their strength varying over time. According to the theory of collaborative games, the collaboration between traditional and emerging industries has always been subject to frequent opportunistic behaviors, poor stability, and low persistence. The collaboration between commercial banks and fintechs has highlighted the challenges of aligning the objectives of the partnership and effectively translating the outcomes of collaboration. These issues have significantly dampened the enthusiasm of both parties to engage in cross-border collaboration.
By drawing attention to the importance and complexity of innovation collaboration between banks and fintechs, this study constructs an evolutionary game model between commercial banks and fintech companies, and the factors influencing the stability of collaboration. The evolutionary game approach and prospect theory offer an effective model for analyzing the stability of collaboration between banks and fintechs by considering their strategies in bounded rationality, engaged, and collaborative environments.
We set out the following research objectives. (1) This study focuses on the evolution of collaboration between banks and fintech companies based on prospect theory and evolutionary game theory. (2) This study explores the determinants of collaboration by gathering the case of fintech innovation collaboration in China and simulating the game model between banks and fintechs with representative data. The definitions of the core research methods and objects in this study are presented in Table 1.
The structure of the remainder of this study is as follows: Section 1 provides an introduction to the study, covering its background, purpose, and content. Section 2 conducts a literature review. Section 3 elaborates on the details of the proposed evolutionary game model. Section 4 showcases the evolutionary game models applied to the interactions between banks and fintech companies. Section 5 outlines and deliberates on the simulation results. Finally, Section 6 offers the conclusions and acknowledges the limitations of the study.

2. Literature Review

2.1. Motivations for Banks and Fintechs to Engage in Collaboration

Research into the relationship between commercial banks and fintechs has traditionally focused on the study of inter-firm competition based on qualitative analysis [13,14,15]. The collaboration and co-operative inter-organizational relations between banks and fintechs have yet to receive more attention [16]. Over time, the relationship between traditional banks and fintechs has shifted from competition to active collaboration [1]. The collaboration between commercial banks and fintech companies in innovation is a cross-border collaboration to develop new financial products and services [17]. Fintech companies differ from traditional financial institutions in the following respects. Firstly, fintech companies provide innovative products and solutions that fulfill customers’ needs, which were either not addressed or inadequately served by traditional financial service providers [18]. Secondly, fintech companies are able to understand customers better and have unlocked new avenues for marketing products and services by leveraging novel technologies and concepts [19]. Thirdly, fintech companies with a strong foundation in information technology are inherently better equipped to offer services in highly innovative environments [2].
Furthermore, banks engage in collaboration with fintechs for the following three main reasons: (1) The collaborations between fintechs and banks are vital in facilitating emerging technological information sharing and resource integration [20,21]. (2) Through collaboration with fintechs, banks have the opportunity to acquire strategic knowledge about new markets and technologies. This collaboration can also foster the emergence of innovative solutions that complement their existing offerings and enable the integration of new knowledge to drive corporate innovation [22]. (3) Through collaboration with fintechs, banks have the opportunity to acquire strategic knowledge about new markets and technologies. This collaboration can also foster the emergence of innovative solutions that complement their existing offerings and enable the integration of new knowledge to drive corporate innovation [5]. Ideally, the most favorable form of interaction among financial market participants is collaboration, where they can mutually enhance each other’s strengths and contribute to the overall benefit of society [23]. Based on the three motivations, the rapid rise of fintech has changed the business landscape of the banking industry and raised higher requirements for stable innovation collaboration [24].
The motivations for fintechs to enter into bank-fintech collaboration are sound for many reasons: (1) the traditional banking sector is a well-established industry with a strong customer base, known for its security and reputation. However, public confidence in emerging fintech companies is still low relative to traditional banks. Fintech companies are more likely to gain market acceptance by partnering with banks to offer financial services rather than launching new services independently [22]. (2) Collaboration with commercial banks can facilitate the sharing of risks and costs associated with the development of new technology and products by fintech companies [1]. (3) Fintechs look for financial resources and infrastructures. Commercial banks’ capital supply and risk-control expertise can provide valuable support for the research and implementation of new fintech [9].

2.2. Stability of Collaboration between Banks and Fintechs

The stability of this collaboration is not a static issue but rather a dynamic process that evolves over time [22]. At the strategic level, innovation collaboration is formed through both parties’ continuous learning and imitation of highly adaptive strategies. However, this collaboration must resist certain negative tendencies, such as opportunistic behavior and moral hazard, to maintain long-term stability. The research on the collaboration relationship between commercial banks and fintech companies is divided into two parts based on their research methodology. A strand of studies summarizes the factors affecting collaboration stability by analyzing cases of collaboration. According to Drasch et al. [9], the maintenance of stability in the collaboration between commercial banks and fintech companies is influenced by the degree of partner matching and the efficiency of knowledge and technology sharing. Acar and Çıtak explored the challenges and problems of cross-border collaboration between commercial banks and fintech companies using Turkish banks as an example [12]. Riikkinen and Pihlajamaa conducted a longitudinal case study on Nordea, examining the process of achieving collaboration fit. They found that this process was facilitated by acquiring technological and market knowledge from fintech companies [22]. The banks adapted their approach to collaborating with fintechs according to the stage of disruption in order to align with their evolving learning objectives. Fang et al. found that establishing collaboration between banks and fintechs improved bank cost efficiency and interest revenue efficiency due to knowledge spillover effects, technology transfer, demonstration effects, and cost reduction effects [17]. The findings shed light on the strategic goals of fintech investment, the added value provided by fintech companies, and the barriers arising from policies and regulations. Hornuf et al. analyzed the characteristics of banks associated with different forms of alliances with fintech companies and discover that banks tend to invest more frequently in small fintechs while often establishing product-related collaborations with larger fintechs [16]. Hoang et al. discussed the benefits, obstacles, advantages, and disadvantages of banks and fintechs involved in the collaboration process and highlighted that partner selection criteria are crucial in influencing the collaboration process [25].
Another string of studies argue for the stability of collaboration based on game models, taking banks and fintechs as players, but this string of literature is scarce. For example, Luo et al. explored the dynamic evolution of collaboration between commercial banks and fintech companies. They found that the cost of collaboration and benefit distribution are the key factors affecting collaboration formation and orderly development [26].
By reviewing the relevant literature on the motivations for collaborators and the stability of collaboration, it can be found that the current research has the following gaps, as shown in Table 2.
The main contributions of this study are as follows.
  • Establishing the evolutionary game relationship between banks and fintechs, this study examines the change process of collaboration stability in the context of China’s rapidly growing fintech market and the construction of a new fintech ecosystem.
  • This study considers the bounded rationality of collaborating partners. It can effectively enhance the science of analysis by introducing prospect theory into the decision analysis of banks and fintechs.
  • This study uses scenario simulation analysis to analyze which factors influence the stability of collaboration qualitatively. The simulation results suggest recommendations for banks and fintechs to forge a stable and effective partnership.
Therefore, to fix these research gaps and make these contributions, this paper combines prospect theory and evolutionary game theory to study the evolutionary mechanism of innovation collaboration from the perspective of the stability of collaboration between banks and fintechs, and makes an in-depth study of the preferences and evolutionary processes of game players’ strategic choices in various situations.

3. Methodology Adoption and Model Construction

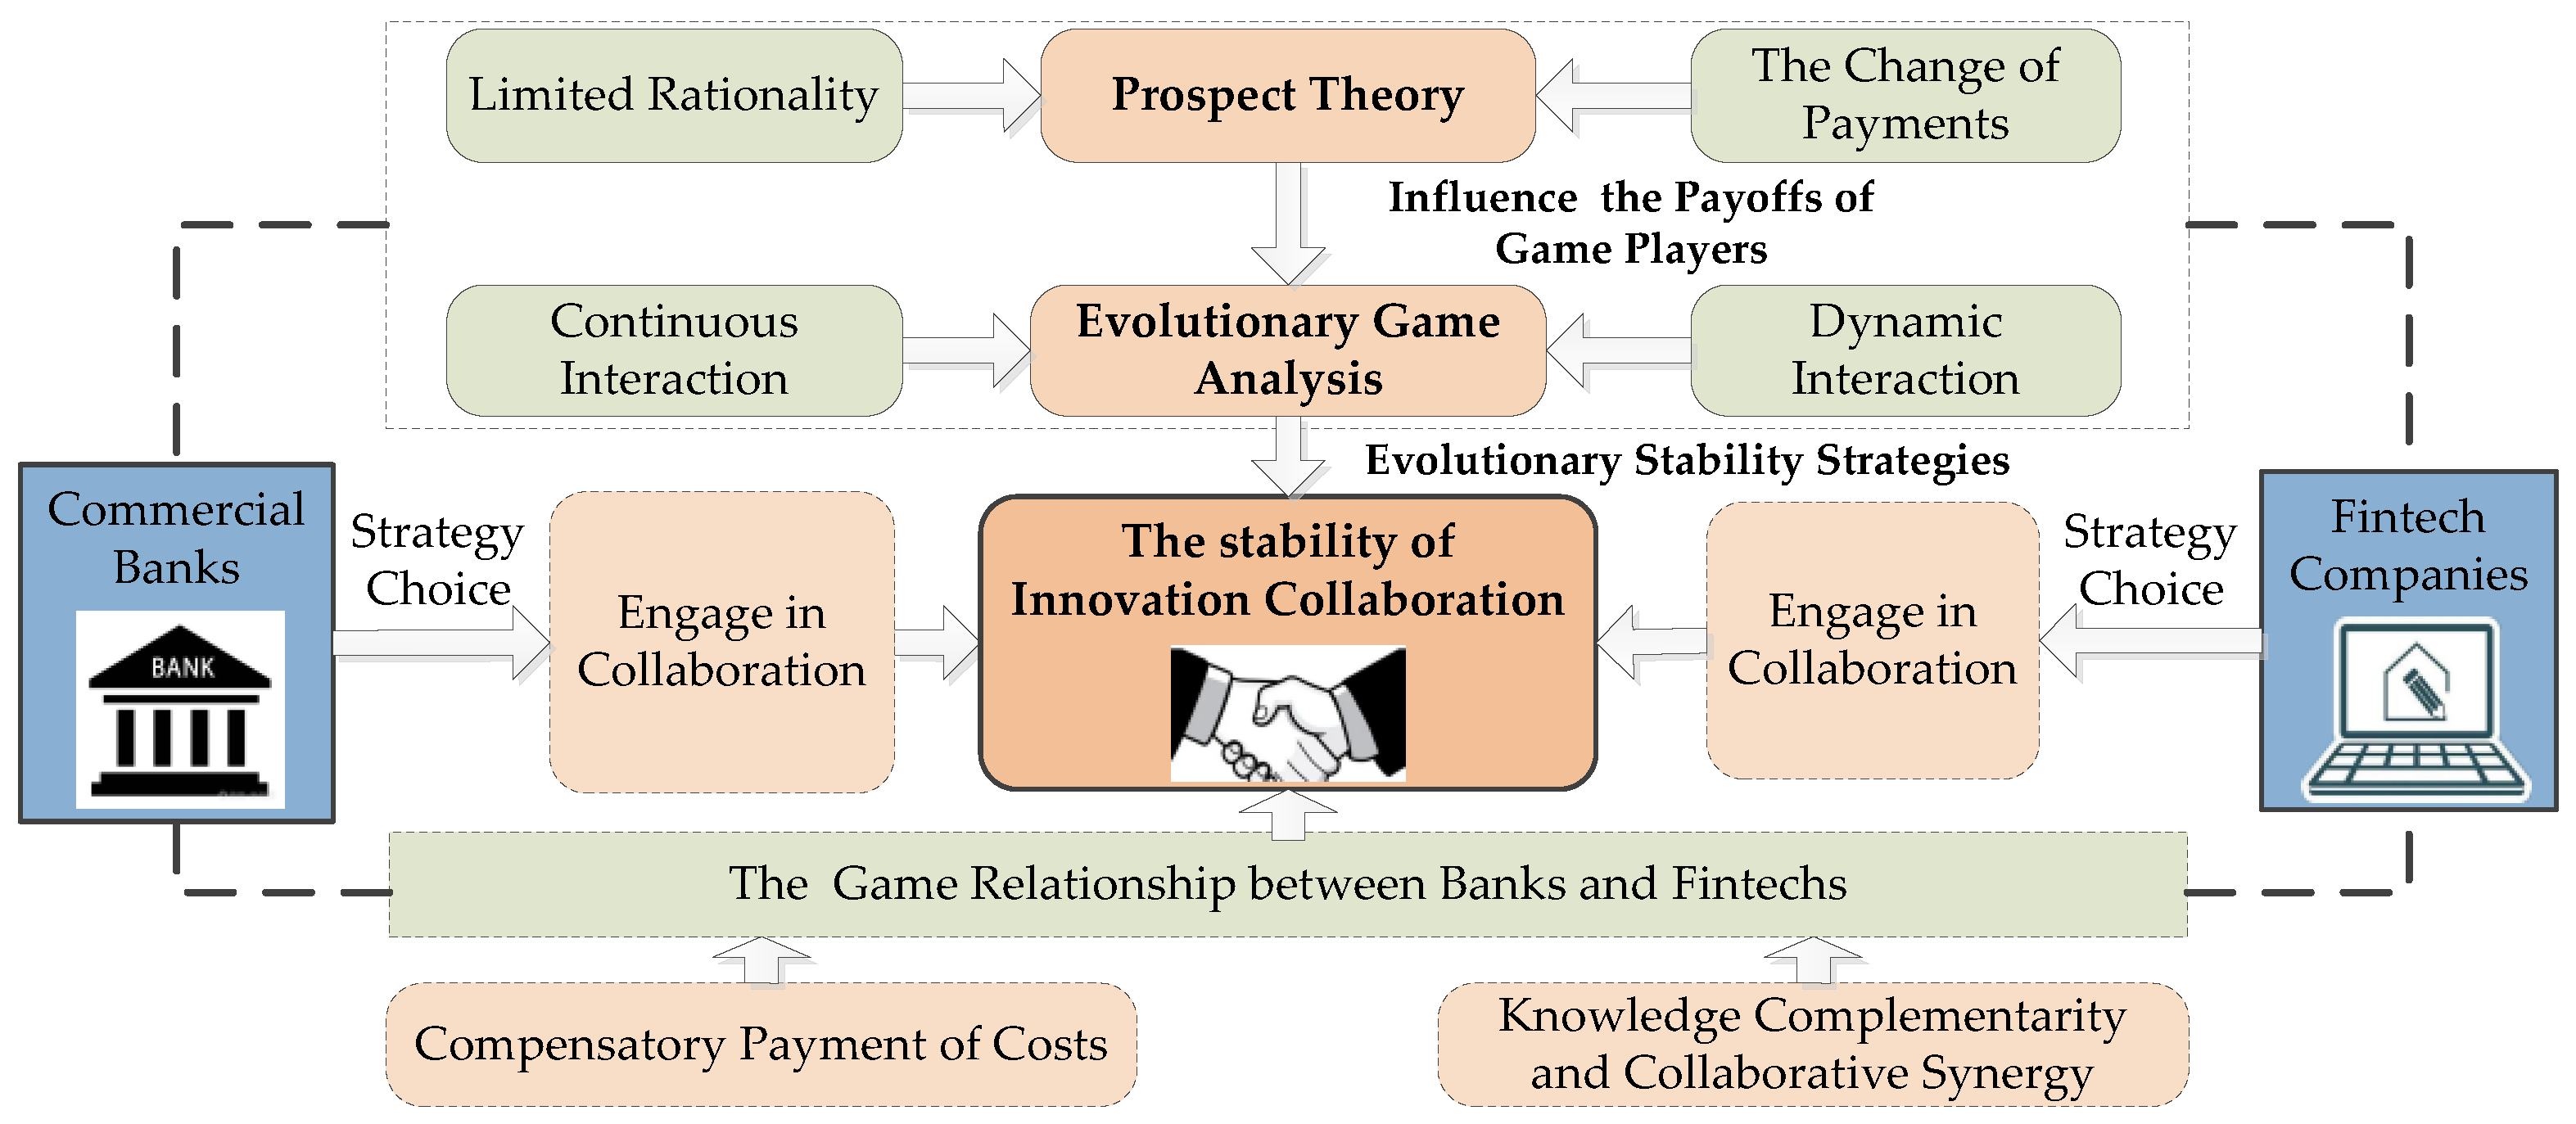
3.1. Application Analysis of Evolutionary Game Theory and Prospect Theory

Given the distinct interest demands of the two groups, a strategic game emerges between banks and fintechs concerning innovation collaboration. Limited rationality makes it challenging for them to identify optimal strategies in a single iteration. Instead, they must observe the behaviors of other individuals and then make informed choices. As a crucial branch of game theory, evolutionary game theory distinguishes itself from classical game theory in several aspects. Firstly, it posits that players are boundedly rational, as opposed to being fully rational [27]. Secondly, evolutionary game theory focuses on the population as its research subject, where individuals can iteratively adjust their strategies through observation, learning, and other mechanisms across multiple games. This iterative process aims to eventually attain a stable state for all players [28]. The evolutionary game model is a fitting and powerful theoretical analysis tool to explore the choices of banks and fintechs. On the one hand, by applying an evolutionary game to study the dynamic interactive process of banks and fintechs, it could be better to answer why innovation collaborations between banks and fintech companies have been increasing in recent years. On the other hand, the theoretical model attempts to illustrate how banks and fintech companies shift towards collaboration by considering their observations and reactions to each other’s behavior, which is more in line with the realistic scenario.
The prospect theory transcends the limitations of the traditional rational decision-making model in economics and successfully addresses the Allais Paradox and the Ellsberg Paradox associated with the expected utility theory [29]. Thus, prospect theory plays a crucial role in depicting the utility of boundedly rational behavior in uncertain decision-making. According to prospect theory, human decision-making has the following characteristics [28]. (1) People not only concentrate on the absolute amount of wealth but also consider the change of wealth; (2) in the presence of gains, individuals tend to be risk-averse, whereas when confronted with losses they exhibit risk preference; (3) people’s assessment of gains and losses frequently relies on a reference point. In the co-operative game between commercial banks and fintechs, asymmetric information often results in both parties relying on subjective perceptions for decision-making. This aligns seamlessly with the prospect theory’s stipulations regarding the perception of value. As prospect theory is adept at elucidating the decision-making process of individuals under limited rationality, it is well suited to analyzing the decision-making process of banks and fintech companies in innovation collaboration.
In summary, given that both prospect theory and evolutionary game theory operate under the assumption of bounded rationality, their integration not only captures the decision-making psychology of banks and fintechs in the face of uncertain gains and losses but also dynamically portrays their strategic selection process. Moreover, when combined with simulation technology, it allows for the visualization of the impact of various factors on their strategy selection. Therefore, in the collaborative relationship between banks and fintechs, prospect theory and evolutionary game theory are well suited for studying the evolution of decision-making behaviors and influencing factors for both parties. Based on prospect theory and evolutionary game theory, this study constructs a game model between banks and fintechs to reveal the evolution mechanism of the stability of innovation collaboration. This study proposes Figure 1 to illustrate how prospect theory and evolutionary game theory are applied in analyzing the stability of innovation partnerships between banks and fintechs.

3.2. Model Assumption

The game players should be banks and fintechs, and the following assumptions should be made: First, banks and fintechs are deemed rational economic game players, which means they cannot make the optimal choice in a single game, but they can find the optimal choice through the dynamic adjustment of strategies in multiple games. Second, there is information asymmetry between them, and the behavioral strategies are imperfect. Third, neither has complete information and priorities for coping with the collaboration, and neither can accurately predict the opponent’s actions.
Accordingly, before constructing the evolutionary game model between banks and fintechs, we need to make the following hypothesis:
  • Game player B represents banks, while game player F represents fintechs.
  • In the game process, the banks’ strategy can be expressed as {collaboration, competition}. If the probability that banks adopt the collaboration strategy is denoted by x(x ∈ [0,1]), then the probability that the banks select the competition strategy is (1 − x). Correspondingly, the fintechs’ strategy set is {collaboration, competition}. Assuming the probability that fintechs select collaboration is y(y ∈ [0,1]), the probability that fintechs choose competition strategy is (1 − y).
  • The rights and obligations of game players are equal. When the banks or fintechs choose to collaborate, they will have to spend resources to maintain collaborative relationships, but they will also have the right to share some of the technology, knowledge, and customer resources; when the banks or fintechs not to collaborate, they will also lose the right to obtain external resources.
  • Differences in partners’ concerns about short-term and long-term benefits and costs. Due to the greater uncertainty surrounding long-term benefits and costs, assessments of these factors rely more heavily on decision-makers’ perceptions compared to short-term considerations.
  • In accordance with prospect theory, the value of the reference point in the value function is set to 0. Furthermore, the perceived utility of long-term profits and losses is substituted by the deviation of profits or losses from this reference point.

3.3. Long-Term Payoffs Based on Prospect Theory

We introduce the prospect theory when considering long-term payoffs to the banks and fintechs. Behavioral finance proposes that decision-makers exhibit varying risk preferences when confronted with gains and losses, which means they are more risk-averse when faced with gains and more risk-seeking when faced with losses [30]. When long-term gains and losses are uncertain, there is a discrepancy between the perceived value and the actual outcome, and the change in the real gain or loss relative to the reference point is the perceived value. Δx ≥ 0 implies that the decision-maker perceives that the outcome of the stochastic event will be a profit, and Δx < 0 means that the decision-maker perceives that the outcome of the stochastic event will result in a loss. Based on prospect theory, the perceived value can be expressed as a weighting function with perceived utility.
V = i ω ( p i ) l ( x i )
where represents the weight of perceived utility, which denotes the decision-maker’s subjective perception of the objective probability of occurrence of event, pi, is the perceived utility of the decision-maker based on reference dependence. In this paper, objective probabilities are replaced by perceived weight functions, and expected utility is replaced by perceived utility, which can capture the decision-maker’s subjective expectations about the uncertainty of forward benefits and costs. The value function as a power function of return Δx.
l ( x ) = Δ x α ( Δ x 0 ) ε Δ x δ ( Δ x < 0 )
where α and δ represent the degree of convexity of the power function of the value of the gains and losses, respectively. ε represents the decision-makers’ aversion to losses. Many studies show that the value function best reflects decision-makers’ risk participation psychology when α = δ = 0.88 and ε = 2.25.
Assuming that the probability of success of the collaboration is p, the long-term total return is π, the return distribution ratio between banks and fintechs is λ and 1 − λ, respectively, and the two parties of the game take the return of 0 when there is no collaboration as the reference of the perceived return, v(0) = 0, then the long-term perceived value returns of the commercial banks and fintech companies ΔL1 and ΔL2 are, respectively:
Δ L 1 = ω p · v λ π 0 + ω 1 p · v 0 = ω p · ( λ π ) α
Δ L 2 = ω p · v 1 λ π 0 + ω 1 p · v 0 = ω p · ( π λ π ) α
Assuming that the long-term cost of collaboration of the bank for Ca, the long-term cost of collaboration of the fintech company for Cb, the long-term perceived cost of the bank and fintech company can be expressed as ΔE1 and ΔE2, respectively. When the players involved in the game do not have a co-operative relationship, and the collaboration costs for both parties are 0, then 0 is used as a reference for perceived costs, with v(0) = 0. However, once the collaboration is unsuccessful, both parties will only bear the costs associated with research and development collaboration, and will not incur any costs related to marketization. Therefore, the cost will be equal to Ca/2 and Cb/2.
E 1 = ω p v 0 C a + ω 1 p v 0 C a 2 = ε C a δ ω p + ω 1 p ( 1 2 ) δ
E 2 = ω p v 0 C b + ω 1 p v 0 C b 2 = ε C b δ ω p + ω 1 p ( 1 2 ) δ
Based on the above assumptions, the corresponding parameters and definitions are listed in Table 3.

3.4. Payoff Matrix of the Evolutionary Game Model

In the study of innovation collaboration between banks and fintechs, there are four possible strategy combinations because banks and fintechs have two strategies. The payoff matrix is illustrated in Table 4.
When UB1 and UB2 consider the expected utilities in which banks adopt collaboration or competition strategies, respectively, Equations (7) and (8) can present UB1 and UB2 as follows:
U B 1 = y I 1 + S 1 + β D 1 + θ β D 1 + β L 1 + θ β L 1 C 1 | E 1 | + 1 y I 1 + S 1 + β D 1 + θ β D 1 C 1 | E 1 |
U B 2 = y I 1 + S 1 + β D 1 + θ β D 1 + β L 1 C 1 + ( 1 y ) I 1 + S 1 + β D 1 + θ β D 1
Further, U ¯ B = x U B 1 + ( 1 x ) U B 2 can be regarded as the average expected utilities of banks’ mixed strategies.
When UF1 and UF2 consider the expected utilities in which fintech companies adopt collaboration or competition strategies, respectively, Equations (9) and (10) can present UF1 and UF2 as follows:
U F 1 = x I 2 + S 2 + β D 2 + θ β D 2 + β L 2 + θ β L 2 C 2 | E 2 | + ( 1 x ) ( I 2 + S 2 + β D 2 + θ β D 2 C 2 | E 2 | )
U F 2 = x I 2 + S 2 + β D 2 + θ β D 2 + β L 2 C 2 + 1 x I 2 + S 2 + β D 2 + θ β D 2
Further, U ¯ F = y U F 1 + ( 1 y ) U F 2 can be regarded as the average expected utilities of fintech companies’ mixed strategies.
Equations (7)–(10) analyze the payoffs of players employing mixed strategies and are used to construct a two-dimensional dynamic evolutionary game system.

4. Stability Analysis

4.1. Model Description

This study employs the replicator dynamic system to model the progression of strategies among players, capturing the evolutionary dynamics. The replicator dynamic equation of banks can be calculated as f(x), while the replicator dynamic equation of fintech companies can be calculated as f(y), as shown in Equation (11):
f x = x ( 1 x ) [ y ( θ β L 1 + C 1 ) ( C 1 + | E 1 | ) ] f y = y ( 1 y ) [ x ( θ β L 2 + C 2 ) ( C 2 + | E 2 | ) ]
If f(x) = 0 and f(y) = 0, the replicator dynamic system has four equilibrium points, namely Z1(0,0), Z2(0,1), Z3(1,0), Z4(1,1). At each of these equilibrium points, all stakeholders adopt a pure strategy, which defines the domain’ boundary. In addition, other mixed strategy equilibrium points may exist by solving Equation (15), namely Z0(x*,y*), where x * = ( C 2 + | E 2 | ) / ( θ β L 2 + C 2 ) , y * = ( C 1 + | E 1 | ) / ( θ β L 1 + C 1 ) (0 ≤ x*,y* ≤ 1).

4.2. Game Theory Model Solving and Analysis

Based on the evolutionary game model, we will further analyze the evolution paths of strategy and the stability of strategies between commercial banks and fintech companies.

4.2.1. Asymptotic Stability Analysis of the Banks

Based on the replication dynamic equation of the bank, when f(x) = 0, x* is the stable point of this replication dynamic equation. From f(x) = 0, we get x1* = 0, x2* = 1, y * = ( C 1 + | E 1 | ) / ( θ β L 1 + C 1 ) .
When y * = ( C 1 + | E 1 | ) / ( θ β L 1 + C 1 ) , then f x 0 , f x 0 . In other words, the bank will reach a steady state when the probability y is that the fintech enterprises actively promote collaboration to satisfy the above conditions.
If y * > ( C 1 + | E 1 | ) / ( θ β L 1 + C 1 ) , when f x 1 * > 0 and f x 2 * < 0 , the evolutionary equilibrium stable strategy of banks is x2* = 1. When the probability of fintech companies choosing ‘collaboration’ exceeds a certain threshold and continues to rise, the likelihood of banks adopting the ‘collaboration’ strategy also increases, ultimately making ‘collaboration’ the stable strategy for commercial banks.
If y * < ( C 1 + | E 1 | ) / ( θ β L 1 + C 1 ) , when f x 1 * < 0 and f x 2 * > 0 , the evolutionary equilibrium stable strategy of banks is x1* = 0. When the probability of fintech companies choosing ‘competition’ exceeds a certain threshold and continues to rise, the likelihood of banks adopting the ‘competition’ strategy also increases, ultimately making ‘competition’ the stable strategy for commercial banks. The replicator dynamic phase graph of banks is shown in Figure 2.
The economic rationale for the findings above is that individuals adhering to a ‘competition’ strategy can be regarded as mutants within the fintech company population. As the proportion of these mutants increases, commercial banks will likely encounter ‘competition’ mutants in a random repeated game experiment also rises. Consequently, commercial banks are more inclined to adopt the competition strategy to maximize their profits. Therefore, commercial banks closely monitor the strategic choices of fintech companies. The more significant the proportion of fintech companies choosing ‘collaboration’, the higher the likelihood that commercial banks will evolve toward the collaboration strategy.

4.2.2. Asymptotic Stability Analysis of the Fintechs

Based on the replication dynamic equation of the fintechs, when f(y) = 0, y* is the stable point of this replication dynamic equation. From f(y) = 0, we get y1* = 0, y2* = 1, x * = ( C 2 + | E 2 | ) / ( θ β L 2 + C 2 ) .
When x * = ( C 2 + | E 2 | ) / ( θ β L 2 + C 2 ) , then f x 0 and f x 0 .
If x * > ( C 2 + | E 2 | ) / ( θ β L 2 + C 2 ) , when f y 1 * > 0 and f y 2 * < 0 , the evolutionary equilibrium stable strategy of fintechs is y2* = 1.
If x * < ( C 2 + | E 2 | ) / ( θ β L 2 + C 2 ) , when f y 1 * < 0 and f y 2 * > 0 , the evolutionary equilibrium stable strategy of fintechs is y1* = 0. When the probability of commercial banks choosing ‘collaboration’ falls below a certain threshold and exhibits a declining trend, the likelihood of fintech companies opting for ‘competition’ increases. Over time, ‘competition’ emerges as the stable strategy for fintech companies, ultimately becoming a prevalent phenomenon within groups that have established co-operative relationships. This shift amplifies the probability of the group adopting a ‘competition’ strategy, thereby impeding the cross-boundary flow of knowledge and the establishment of a robust financial ecosystem. Consequently, the higher the proportion of commercial banks choosing ‘collaboration’ within their group, the higher the proportion of fintech companies adopting a ‘collaboration’ strategy. The replicator dynamic phase graph of fintechs is shown in Figure 3.

4.2.3. Analysis of Strategic Stability of Both Sides of Game

The equilibrium point’s asymptotic stability can be assessed by analyzing the eigenvalues of the system’s Jacobian matrices. The system’s Jacobian matrix is presented in the following equation:
G = f ( x ) x f ( x ) y f ( y ) x f ( y ) y
where a 11 = f ( x ) / x = 1 2 x [ y θ β L 1 + C 1 ( C 1 + | E 1 | ) ] ;
a 12 = f ( x ) / y = x ( 1 x ) θ β L 1 + C 1 ; a 21 = f ( y ) / x = y ( 1 y ) θ β L 2 + C 2 ;
a 22 = f ( y ) / y = 1 2 y [ x θ β L 2 + C 2 ( C 2 + | E 2 | ) ] .
When the point satisfies the conditions of Det J > 0 and Tr J < 0, the corresponding equilibrium point is locally stable. Each equilibrium solution is substituted into the Jacobian matrix above to determine the corresponding determinants and traces, as shown in Table 5.
By analyzing the positivity and negativity of the eigenvalues, we can determine whether each local equilibrium point represents the ESS (Evolutionary Stable Strategy) of the system. According to the fundamental hypothesis of evolutionary game theory, players are not entirely rational but relatively boundedly rational. This means they cannot always select the optimal strategies in a game and will adjust their strategies over time. When players engage in multiple rounds of the game and cease changing their strategies, the replicated dynamic system reaches stability. The combination of strategies all players adopt in this stable state is referred to as evolutionary stable strategies (ESS). We analyzed two scenarios to demonstrate the stability of equilibrium points under different conditions.
Scenario 1: When θβΔLi − |ΔEi| < 0, the long-term co-operative gains obtained by both parties in the game cannot compensate for their long-term co-operative costs. Consequently, both parties have strong incentives to defect from collaboration, leading to a potential prisoner dilemma where collaboration is not the dominant strategy for either party. In this scenario, collaboration between the parties cannot be sustained in the long-term, as both are prone to opportunistic behavior and defection from co-operative relationships to achieve higher gains.
Scenario 2: When θβΔLi − |ΔEi| > 0, the long-term co-operative gains obtained by both parties can offset their co-operative costs. In the evolutionary process of co-operative games, the ‘collaboration’ strategy becomes the rational choice for both parties. The evolutionary stability of the system is illustrated in Table 6. Points Z1(0,0), Z2(0,1), and Z3(1,0) are unstable in the system, while the equilibrium points of the system evolution are (0,0) and (1,1). Depending on their anticipation of the opponent’s strategy, both parties may opt for either a ‘collaboration’ or ‘competition’ strategy.
According to Table 6, point Z0(x*,y*) is the critical point, namely the saddle point. Points Z1(1,0) and Z2(0,1) are unstable points of the system. In scenario 2, the stable equilibrium points of the co-operative game between both parties are (0,0) and (1,1). However, based on the game’s payoff structure and individual utility maximization perspective, the {collaboration, collaboration} strategy set maximizes the individual utilities of both parties. This strategy set represents a stable equilibrium point in terms of utility, where both parties can sustain a balanced state without incentive to change their strategy. From a social welfare perspective, in the {collaboration, collaboration} strategy set of the game, the total payoff obtained by both parties exceeds that under the {competition, competition} strategy set. Therefore, collaboration represents a Pareto optimal strategy combination, enhancing social welfare.
In the context of long-term co-operative games, addressing issues such as compensatory cost payments, agreement security, benefit distribution, and implementation details is critical. Moreover, attention should be directed towards individual perceptions beyond rational rules. The design of mechanisms that integrate both rational rules and irrational factors significantly influences the game’s evolution. Specifically, this paper will delve into the factors impacting collaboration, the synergy between knowledge and technology, as well as the perceptions of long-term gains and costs among commercial banks and fintech companies in their co-operative efforts.

4.2.4. Analysis of Factors Influencing Collaborative Stability

Based on the analysis of the stability of the evolutionary game, the evolution phase graph of banks and fintechs in innovation collaboration is drawn, which delineates the dynamic evolutionary process, as shown in Figure 4. In the lower-left region of Figure 4, the behaviors of both parties converge to point Z1. In the upper right region of Figure 4, the system converges to Z4(1,1). Therefore, the strategic choices of both parties should fall within the upper right region of Figure 4.
The quadrangle Z2Z0Z3Z4 indicates the probability that both sides select ‘collaboration’. Let S Z 2 Z 0 Z 3 Z 4 indicate the area of quadrangle Z2Z0Z3Z4, as shown in Equation (14). By analyzing the factors that influence this area’s variation, the system’s evolutionary direction can be inferred.
S Z 2 Z 0 Z 3 Z 4 = 1 2 ( θ β L 2 | E 2 | θ β L 2 + C 2 + θ β L 1 | E 1 | θ β L 1 + C 1 )
Statement 1.
The greater the overall long-term benefits (π), the stronger the stability of innovation collaboration between fintech companies and commercial banks.
Proof. 
According to Equation (13), if θ β L 2 | π = θ β ω p α 1 λ α π α 1 > 0 , θ β L 1 | π = θ β ω p α λ α π α 1 > 0 , it will be found that S Z 2 Z 0 Z 3 Z 4 , related to π, appears as a monotonically increasing function.
S Z 2 Z 0 Z 3 Z 4 π = 1 2 θ β L 2 | π · ( C 2 + E 2 ) θ β L 2 + C 2 2 + 1 2 θ β L 1 | π · ( C 1 + E 1 ) θ β L 1 + C 1 2
An increase in π will enlarge the area of the region Z2Z0Z3Z4, thereby increasing the probability that the initial strategies of both parties fall within this region. This enhancement strengthens the stability of co-operative innovation between fintech companies and commercial banks. □
Statement 2.
The smaller the long-term collaboration costs Ca and Cb, the stronger the stability of innovation collaboration between fintech companies and commercial banks.
Proof. 
The equation of S Z 2 Z 0 Z 3 Z 4 / C a was obtained by taking the first derivative of Equation (13) with respect to the collaboration cost Ca:
S Z 2 Z 0 Z 3 Z 4 C a = 1 2 E 1 / C a θ β L 1 + C 1
According to the model assumption and calculations, it is found that E 1 / C a = ε ω p + ω 1 p 1 2 δ δ C a δ 1 > 0 , hence Equation (15) is always less than 0.
Similarly, taking the derivative of Equation (13) with respect to the collaboration cost Cb for fintechs, we can illustrate how changes in Cb affect the strategy choices of both parties. Excessively high collaboration costs burden the parties, making them more likely to choose non-co-operative strategies, thereby constraining the stability of their innovation collaboration. □
Statement 3.
An optimal value exists for the collaboration benefit distribution coefficient (λ). At this optimal distribution ratio, the likelihood of opportunistic behavior by either party is minimized, resulting in the most robust stability of innovation collaboration between fintech companies and commercial banks.
Proof. 
By taking the first derivative of Equation (13) concerning the collaboration benefit distribution coefficient (λ), we obtain:
S Z 2 Z 0 Z 3 Z 4 λ = 1 2 θ β L 2 λ · ( C 2 + E 2 ) θ β L 2 + C 2 2 + 1 2 θ β L 1 λ · ( C 1 + E 1 ) θ β L 1 + C 1 2
Since θ β L 1 λ = θ β ω p π α α λ α 1 > 0 and θ β L 2 λ = θ β ω p π α α 1 λ α 1 < 0 , the sign of Equation (16) cannot be determined. Therefore, the relationship between the area of region Z2Z0Z3Z4 and the collaboration benefit distribution coefficient (λ) is neither monotonically increasing nor decreasing. Furthermore, this study conducts second-order partial derivatives to determine the relationship between the area of region Z2Z0Z3Z4 and the co-operation benefit distribution coefficient. The result indicates the second-order partial derivative is always less than 0. Therefore, the function describing the area of region Z2Z0Z3Z4 in relation to the collaboration benefit distribution coefficient λ is an inverted ‘U’ shape, with a maximum value at λ*. When λ < λ*, the probability that both parties’ strategies converge to the {collaboration, collaboration} strategy set increases as λ increases. Conversely, when λ > λ*, this probability increases as λ decreases. Therefore, an excessively large or small collaboration benefit distribution coefficient will lead to one party betraying the collaboration, thereby increasing the possibility of collaboration terminating prematurely. A fair distribution of co-operation benefits helps to enhance the stability of the collaboration. □
Statement 4.
The greater the coefficient of knowledge complementarity in long-term collaboration(β), the stronger the stability of co-operative innovation between fintech companies and commercial banks.
Proof. 
By taking the derivative of Equation (13) concerning the coefficient of knowledge and technology complementarity between commercial banks and fintech companies, we obtain Equation (18):
S Z 2 Z 0 Z 3 Z 4 β = θ 2 [ L 2 ( C 2 + | Δ E 2 | ) + L 1 ( C 1 + | Δ E 1 | ) ]
Based on the sign of the coefficient, it is evident that Equation (17) is consistently greater than 0, indicating that the area of region Z2Z0Z3Z4 increases with the coefficient of knowledge and technology complementarity between commercial banks and fintech companies. The higher the coefficient of knowledge and technology complementarity on both sides, the greater the probability of converging to the {collaboration, collaboration} strategy combination in the evolutionary game of collaboration, thereby enhancing the stability of collaboration. □
Statement 5.
The higher the synergy coefficient in long-term collaboration (θ), the stronger the stability of innovation collaboration between fintech companies and commercial banks.
Proof. 
Taking the derivative of Equation (13) with respect to the synergy coefficient between commercial banks and fintech companies, we obtain the following expression:
S Z 2 Z 0 Z 3 Z 4 θ = β 2 [ L 2 ( C 2 + | E 2 | ) + L 1 ( C 1 + | E 1 | ) ]
Equation (18) consistently remains more significant than 0, indicating that the area of region Z2Z0Z3Z4 increases with the synergy coefficient between commercial banks and fintech companies. There is a positive correlation between the synergy coefficient and the likelihood of both parties choosing a collaborative strategy. □
Statement 6.
Reducing the profit sensitivity of banks and fintech companies (α) enhances collaboration stability.
Proof. 
Taking the derivative of Equation (13) with respect to the sensitivity of collaboration to profits α, we obtain:
S Z 2 Z 0 Z 3 Z 4 α = 1 2 θ β L 2 | α · ( C 2 + E 2 ) θ β L 2 + C 2 2 + 1 2 θ β L 1 | α · ( C 1 + E 1 ) θ β L 1 + C 1 2
Since θ β L 2 | α = θ β ω p ( π λ π ) α l n π λ π > 0 and θ β L 1 | π = θ β ω p ( λ π ) α l n λ π > 0 , Equation (19) is always greater than 0. This indicates that the area of region Z2Z0Z3Z4 increases with the sensitivity of collaboration to profits α. A higher α corresponds to lower sensitivity of both parties to profits, thereby increasing the likelihood that both parties converge to the {collaboration, collaboration} strategy set in the game. This enhances the potential for sustained and stable collaboration over time. □
Statement 7.
The greater the sensitivity of banks and fintech companies to losses, indicated by a smaller value of δ, the stronger the stability of co-operative innovation between fintech companies and commercial banks.
Proof. 
Taking the derivative of Equation (13) with respect to the overall collaboration cost δ, we obtain:
S Z 2 Z 0 Z 3 Z 4 δ = 1 2 | E 2 | | δ θ β L 2 + C 2 1 2 | E 1 | | δ θ β L 1 + C 1
Since | E 2 | | δ = ε ω p + ω 1 p 1 2 δ l n 1 2 [ 1 λ φ ] δ l n 1 λ φ > 0 and | E 1 | | φ = ε ω p + ω 1 p 1 2 δ l n 1 2 ( λ φ ) δ l n λ φ > 0 , Equation (20) is always greater than 0. The area of region Z2Z0Z3Z4 decreases monotonically with respect to the loss sensitivity coefficient δ. A more minor δ results in a larger area of Z2Z0Z3Z4, increasing the likelihood that initial strategies fall within this region and enhancing the probability of converging to the {collaboration, collaboration} strategy. The smaller δ indicates a higher aversion to losses by both parties, making collaboration between fintech companies and commercial banks more likely to maintain stability over time. □

5. Case Study and Simulation Results

This study employs the collaboration between Ant Financial and the Bank of Nanjing as an example. The strategic co-operation agreement between the Bank of Nanjing and Ant Financial was established on 29 September 2017. They co-founded the ‘Xinyun+’ fintech open platform. This co-operation relied on the ‘Data Co-Creation Laboratory’ and adopted the ‘1 + 2 + 3N’ approach to connect multiple payment channels and digital platforms. This joint effort aims to explore fintech applications and innovations in areas such as SME finance and personal finance [31]. In this model, ‘1’ represents the Bank of Nanjing, ‘2’ represents Ant Financial and Alibaba Cloud, and ‘3N’ represents digital technology platforms, small and medium-sized banks, and physical enterprises. Since 2017, the Bank of Nanjing and Ant Financial have collaborated on business areas such as user profiling, intelligent risk control, and robo-advisory services. By 2018, the ‘Xinyun+’ fintech open platform had connected with 25 prominent digital technology platforms and integrated eight payment channels. The platform attracted nearly ten million customers and issued loans totalling over 82 billion yuan, with a daily peak of one million loan transactions. In 2019, the platform’s customer base surpassed 22.86 million, with cumulative loans totalling 273.2 billion yuan. By the end of the reporting period 2020, the ‘Xinyun+’ fintech open platform had reached 45 million users and issued cumulative loans of 480.1 billion yuan. The revenue, cost, and profit data from this case study serve as the foundation for subsequent simulation research.
Based on the case study, this subsection will employ numerical simulations to more intuitively illustrate how parameter changes affect the stable state of the tripartite evolutionary game. Using Python, these simulations will explore the sensitivity of the two participants to critical parameters, i.e., the overall long-term benefits (π), the long-term collaboration costs (Ca and Cb), the collaboration benefit distribution coefficient (λ), the coefficient of knowledge and technology complementarity (β), the synergy coefficient in long-term collaboration (θ), the profit sensitivity of banks and fintechs (α), and the sensitivity of banks and fintech companies to losses (δ). The initial long-term co-operative income is set at π = 90, with the collaboration costs for both parties being Ca = 8 and Cb = 8. The initial income distribution coefficient is set at λ = 0.5. For the setting of other parameters, drawing on the initial parameter values for fintechs and commercial banks established by the literature [26], the following values are set: the income sensitivity coefficient (α) is 0.8, the loss sensitivity coefficient (δ) is 0.88, the synergy coefficient (θ) is 1.6, the knowledge and technology complementarity coefficient (β) is 0.8, and the perceived collaboration success rate (ω(p)) is 0.5.

5.1. Effect Analysis of the Overall Long-Term Benefits (π)

According to Statement 1, it can be inferred that the higher the overall co-operative income (π) in long-term collaboration, the higher the probability that the game will converge to the {collaboration, collaboration} stable point. The simulation results are presented in Figure 5. When the overall co-operative income is 90 and 95, both commercial banks and fintechs are more willing to adopt the ‘collaboration’ strategy. Additionally, as the overall co-operative income increases, the evolutionary speed of banks and fintechs will be accelerated. However, when the overall cooperative income is 75, 80, or 85, the game converges to the {competition, competition} strategy set. This indicates that improving overall long-term benefits increases the probability of selection of collaboration mode in the two groups.

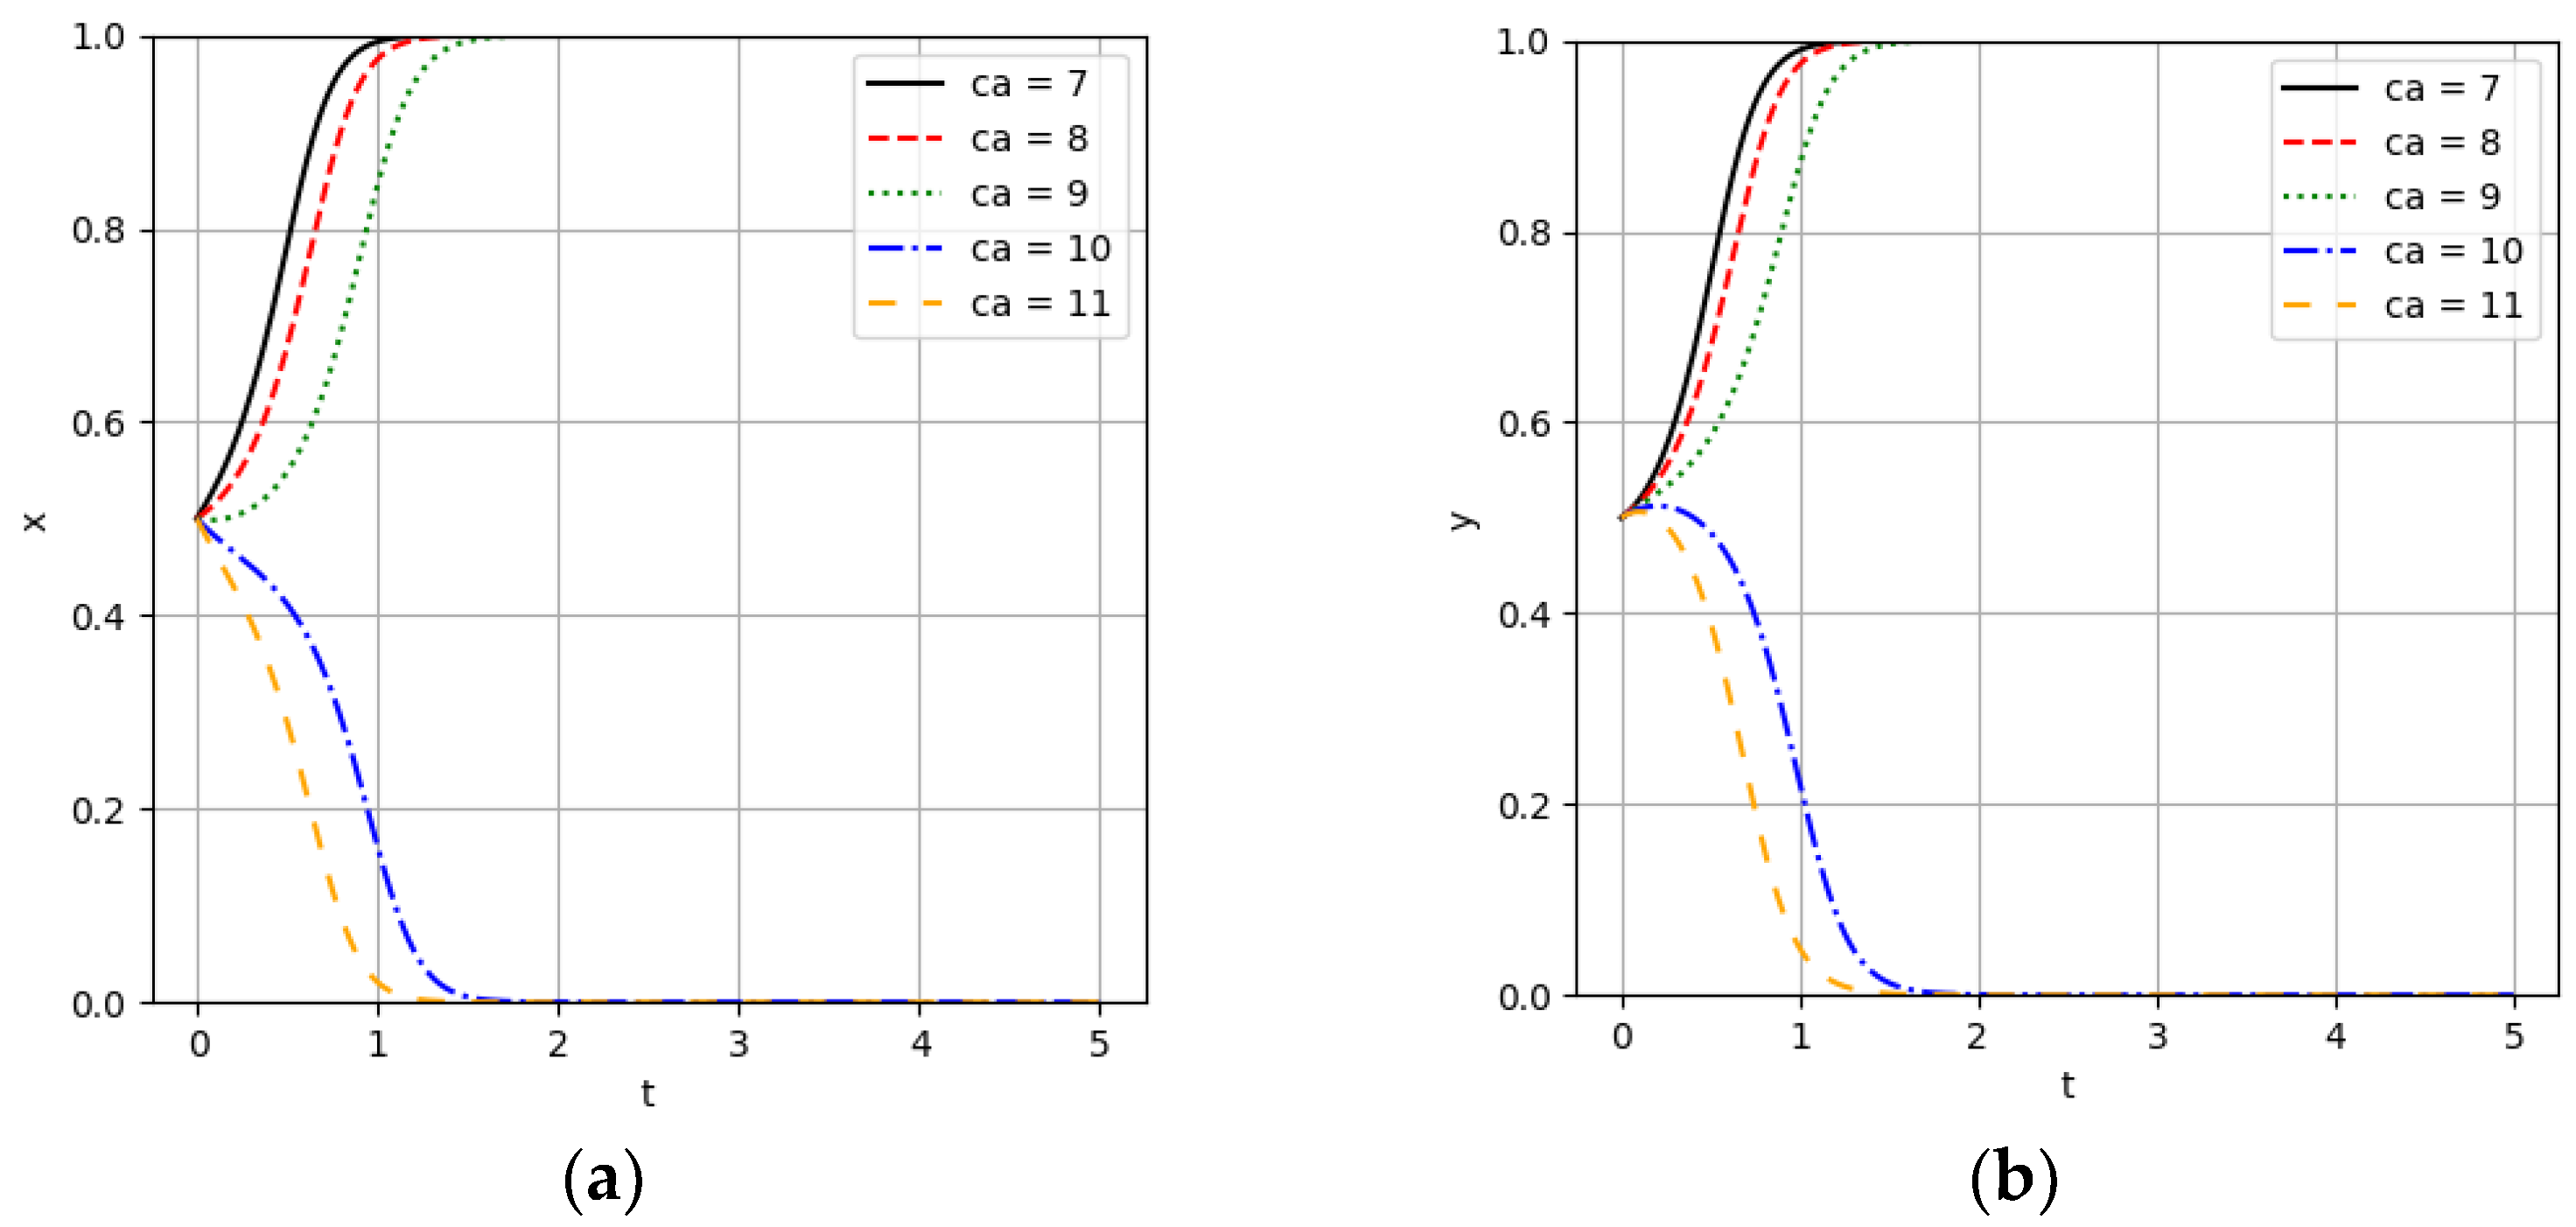
5.2. Effect Analysis of the Long-Term Costs (Ca and Cb)

The simulation separately examines the impact of long-term collaboration costs of commercial banks and fintech companies on the system’s evolutionary outcomes. The simulation results are depicted in Figure 6 and Figure 7. As illustrated in Figure 6, when the long-term collaboration costs for banks are 7, 8, and 9, commercial banks and fintech companies tend to adopt the ‘collaboration’ strategy. Conversely, when the long-term collaboration costs for commercial banks increase to 10, the substantial cost burden diminishes their willingness to co-operate. After two interactions, commercial banks and fintech companies converge to 0. Figure 7 demonstrates that, as the long-term collaboration costs for fintech companies decrease, the likelihood of both parties’ evolutionary systems converging to the {collaboration, collaboration} strategy set increases. This indicates that low-cost innovation collaboration is fundamental to the partnership between commercial banks and fintech companies, as reduced costs significantly enhance the willingness of both parties to collaborate.

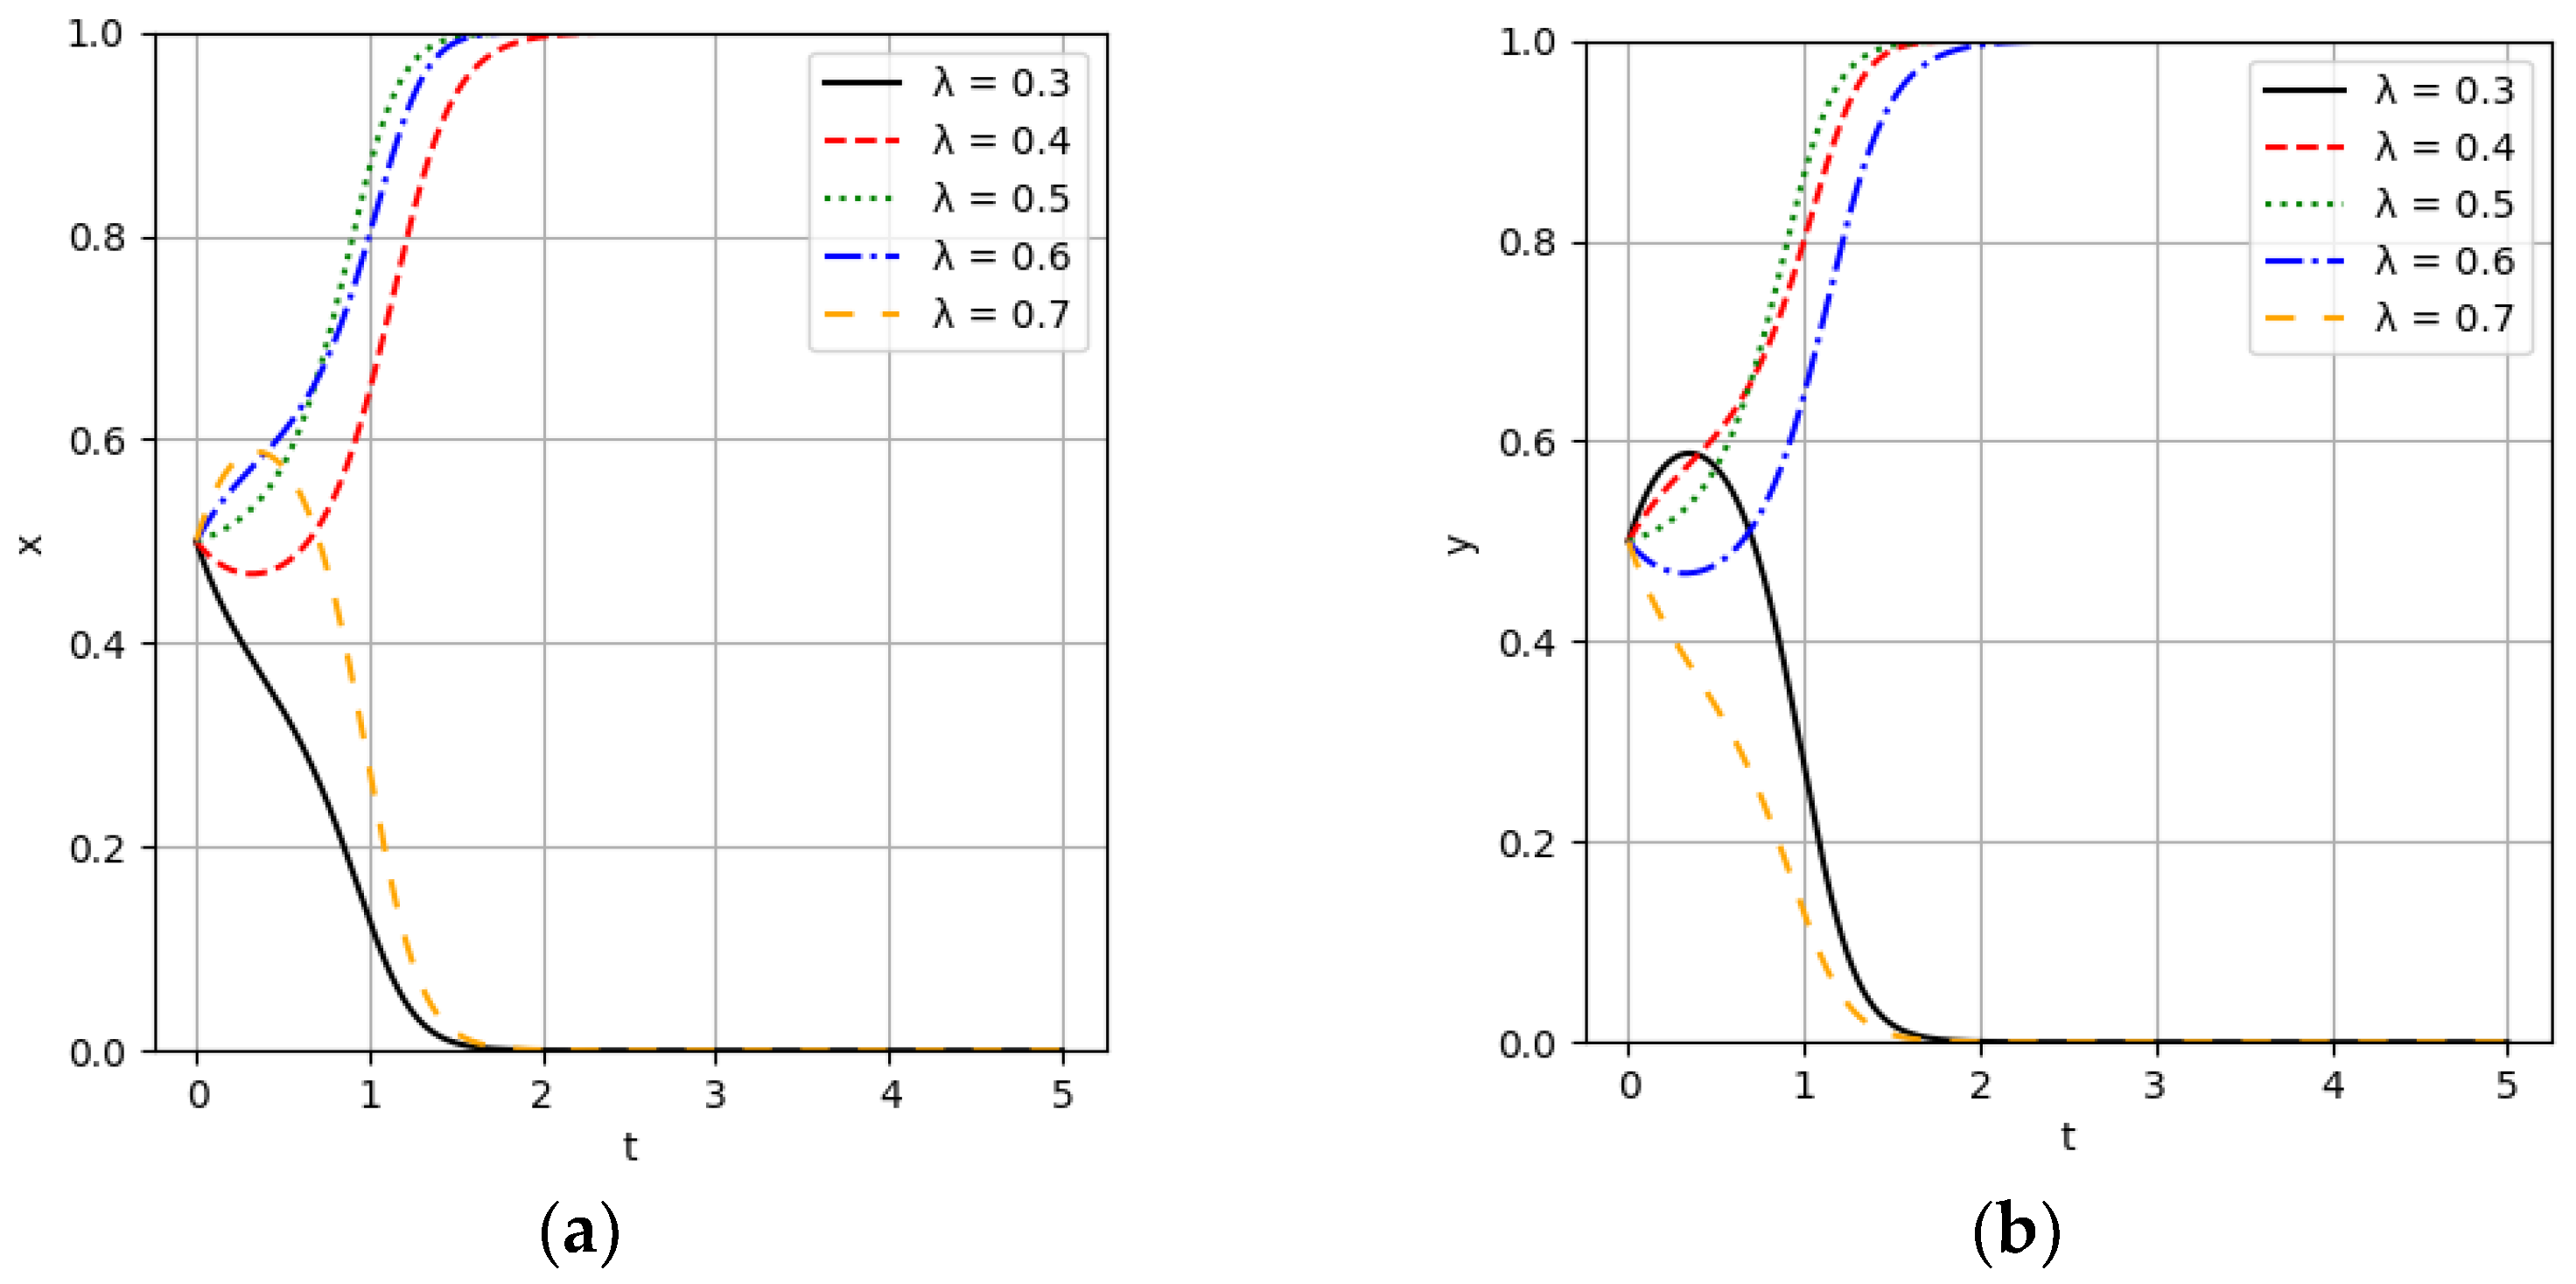
5.3. Effect Analysis of the Collaboration Benefit Distribution Coefficient (λ)

The benefit distribution coefficient λ was set to 0.3, 0.4, 0.5, 0.6, and 0.7 to conduct a simulation analysis, assessing the impact of changes in the benefit distribution coefficient on the strategic evolution trends of both parties. The numerical simulation results are presented in Figure 8. When the benefit distribution coefficient is set to 0.4–0.6, the banks and fintechs are stable at state 1. In this situation, banks and fintechs choose to collaborate. It can also be found that the closer the coefficient is to 0.5, the shorter the time it takes for banks and fintech companies to reach a stable state. In contrast, when the benefit distribution coefficients are set to 0.3 or 0.7, the change of banks and fintechs first approaches state 1, then gradually decreases, and is finally stable at 0. An excessively large or small benefit distribution coefficient leads to an imbalance in benefit distribution. This imbalance reduces the stability of collaboration, increases the tendency towards opportunism within the partnership, and raises the probability of a collaboration breakdown.

5.4. Effect Analysis of Knowledge Complementarity Coefficient (β)

We simulated the impact of changes in the knowledge complementarity coefficient between banks and fintech companies on the system’s stability. Based on the simulation results from Figure 9, when the complementarity coefficient exceeded 0.8, both parties were more inclined to collaborate. This high level of complementarity means that integrating their respective knowledge and technologies creates significant synergies, enhancing the overall value generated from the partnership. The complementary strengths of each party fill gaps and address weaknesses, resulting in a more efficient and innovative collaborative environment. This improves operational efficiencies and accelerates the development and deployment of new financial products and services, providing a competitive edge in the market. In contrast, when the complementarity coefficient is below 0.8, banks and fintech companies tend to favour competitive strategies. The insufficient overlap in knowledge and technological capabilities means that the benefits of collaboration are less apparent. Each party may perceive the risk of not gaining adequate returns on their contributions or worry about potential knowledge spillover. This perceived imbalance discourages co-operative efforts, as the parties may prefer to safeguard their proprietary knowledge and competitive positions rather than engage in a partnership with uncertain outcomes.

5.5. Effect Analysis of Collaboration Synergy Coefficient (θ)

The simulation results, as depicted in Figure 10, reveal that the system evolved towards a competitive equilibrium when the collaboration synergy coefficients were 1.3 and 1.4. At these levels, the synergy between the parties needs to be more effectively realized, likely due to significant differences in human capital and corporate governance structures, which impede effective knowledge communication. Consequently, the effects of knowledge and technology spillover are minimal, adversely impacting the stability of collaboration. However, when the collaboration synergy coefficient increases to 1.5, the system’s evolutionary stable strategy set shifts to a co-operative strategy set. This indicates that the practical realization of synergies can enhance co-operative benefits, providing both parties a positive experience and making the co-operative strategy a high-yield option within the group. This strategy becomes widely imitated and adopted, leading to more long-term and stable collaborations. As the collaboration synergy coefficient increases to 1.6 and 1.7, the synergy effects are more effectively realized, resources are better integrated, and the benefits for both parties increase accordingly. The system converges to state 1 more rapidly. This demonstrates that the stability of collaboration is contingent on the investment of various resources and the practical realization of complementary synergies between the parties.

5.6. Effect Analysis of the Profit Sensitivity of Banks and Fintechs (α)

The simulation results presented in Figure 11 indicate that when the benefit sensitivity coefficient (α) is less than or equal to 0.79, both parties tend to adopt competitive strategies after a period of interaction. As the benefit sensitivity coefficient (α) increases to 0.8, the rationality of banks and fintechs regarding long-term benefits is enhanced. This increased rationality reduces the likelihood of either party betraying the collaboration for short-term opportunistic gains, thereby more effectively maintaining the stability of the collaboration. These findings support the positive correlation between the benefit sensitivity coefficient (α) and collaboration stability, as demonstrated by the numerical simulation results. A critical value exists between 0.79 and 0.8. When α exceeds this critical value, collaboration stability is vital. Conversely, when α falls below this critical value, both parties will likely evolve towards a competitive strategy.

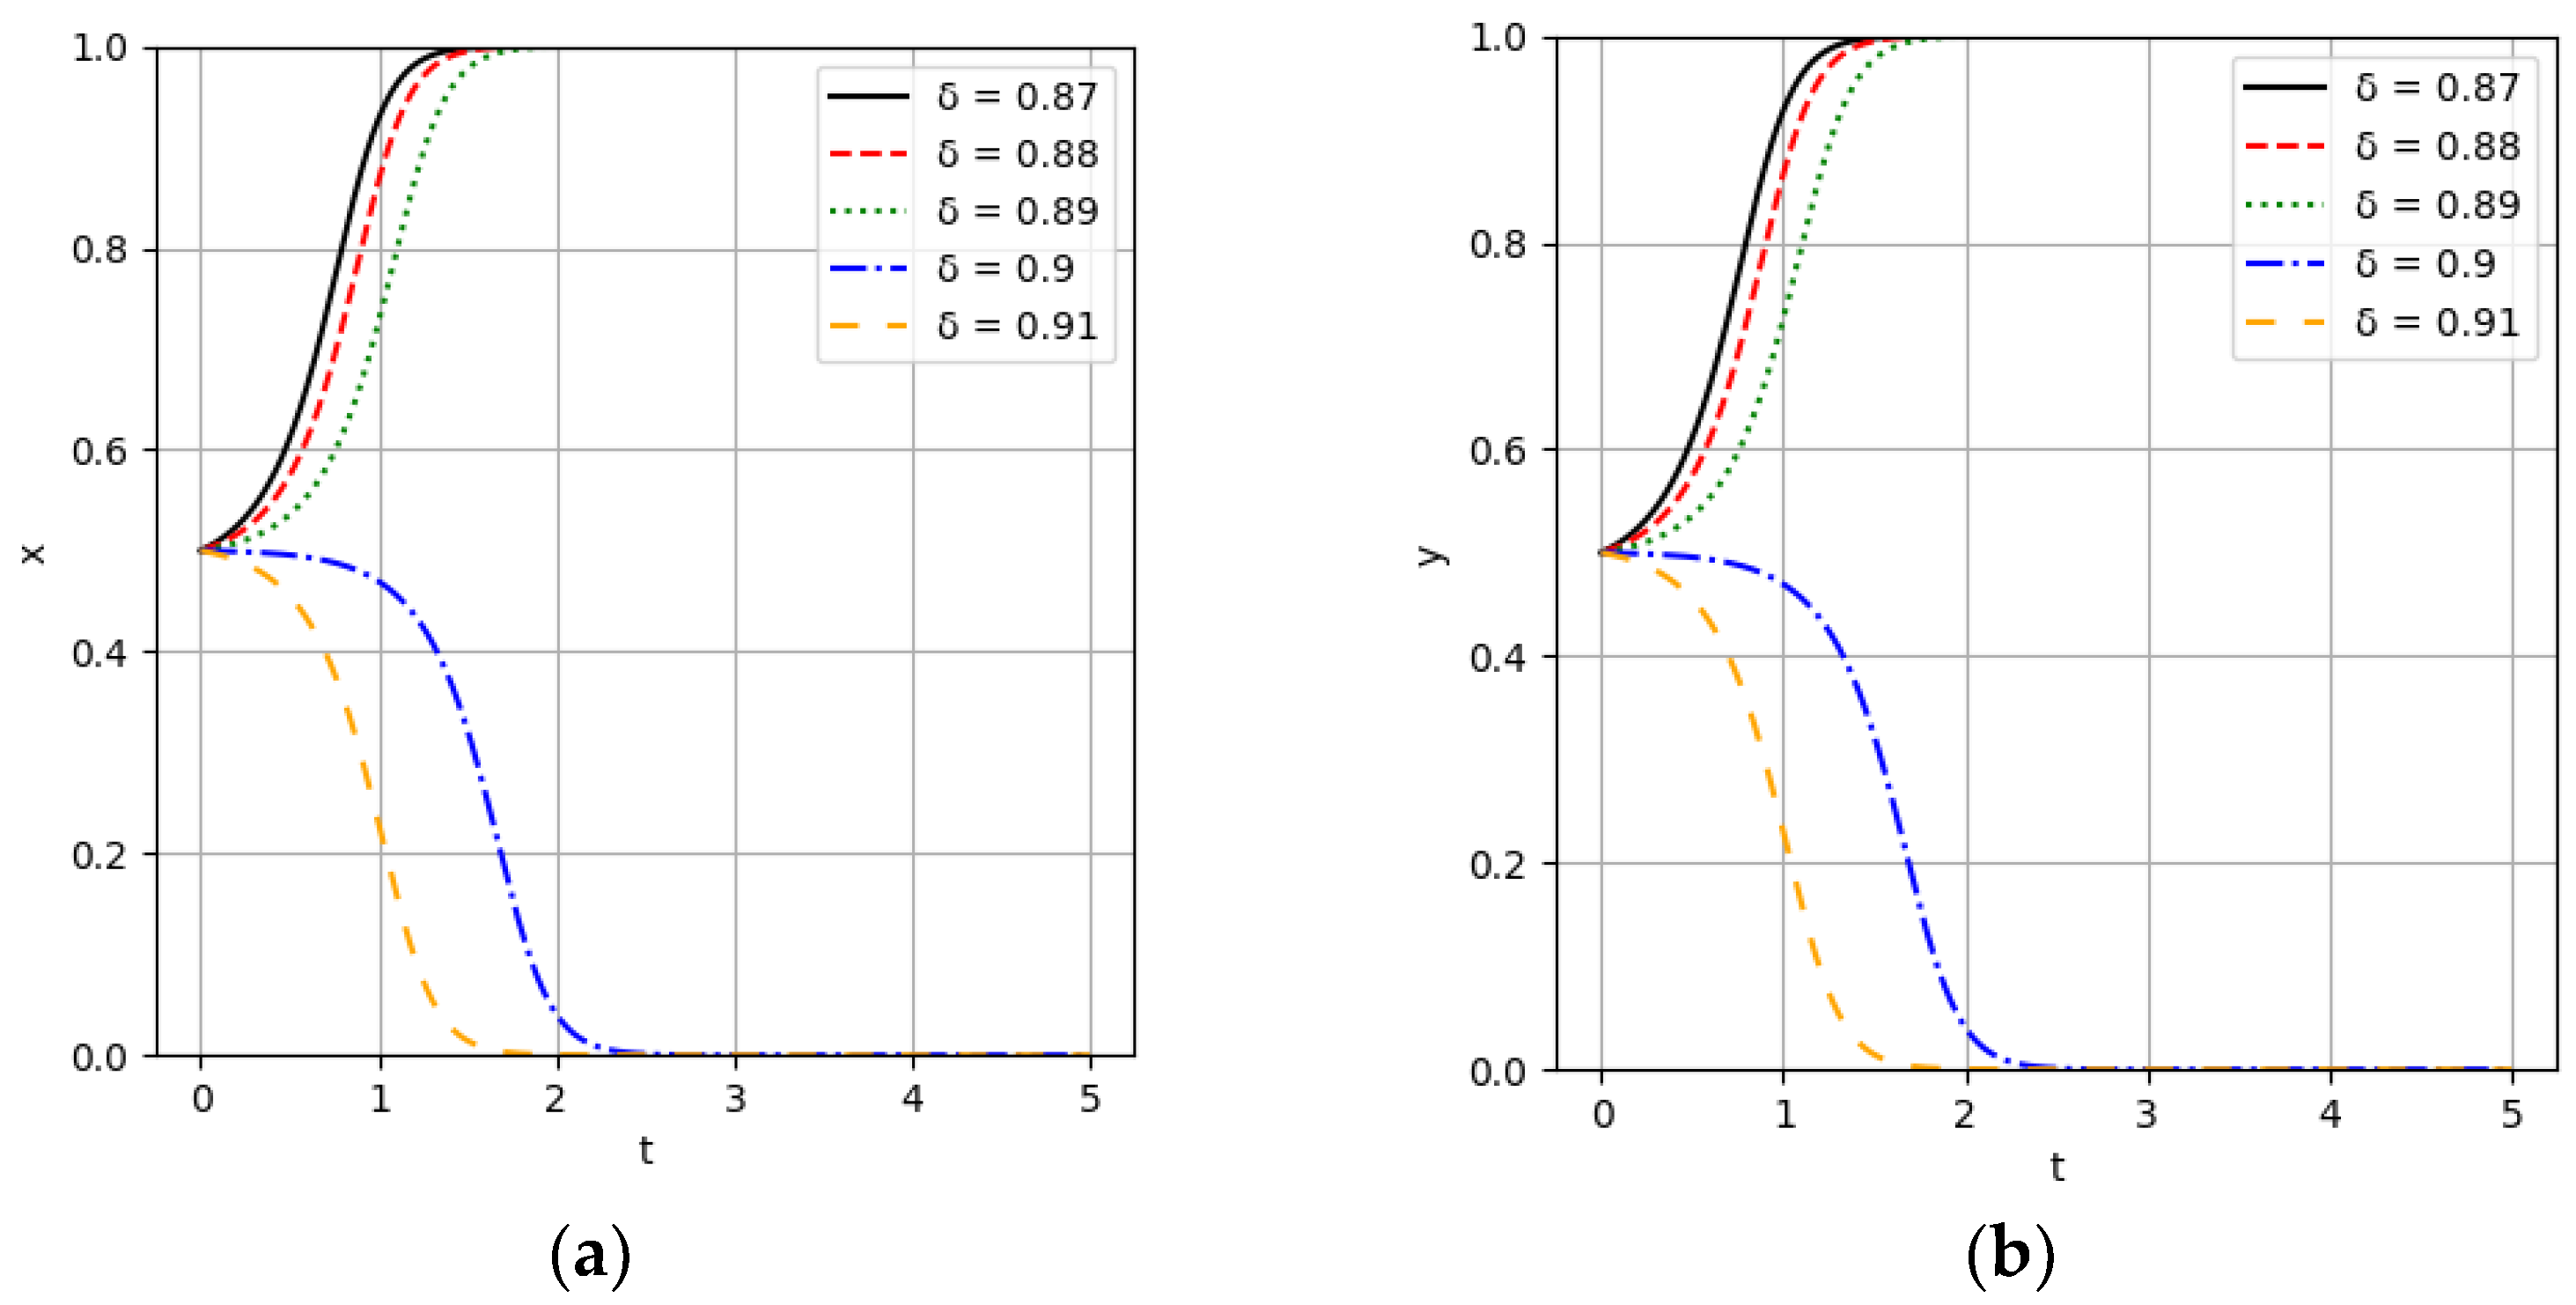
5.7. Effect Analysis of the Sensitivity of Banks and Fintech Companies to Losses (δ)

The findings from Figure 12 of our simulation demonstrate that when the loss aversion coefficient δ was equal to or less than 0.89, commercial banks and fintech companies tended to converge towards a co-operative strategy set following an interaction period. Moreover, a lower loss aversion coefficient correlated with a quicker convergence to a stable state. In contrast, when δ exceeded 0.89, the aversion of both parties towards losses diminished, thereby impeding the sustainable development of collaboration. A reduced loss aversion coefficient suggests that commercial banks and fintech companies are more inclined to adopt risk-averse behaviors in response to fluctuations in losses. The discontinuation or interruption of collaboration under these circumstances inevitably results in decreased utility over the long term.

6. Conclusions and Implications

6.1. Conclusions

Analyzing this collaboration between banks and fintechs is crucial in today’s rapidly evolving financial landscape. Such partnerships combine the stability and regulatory expertise of traditional banks with the innovative technology and agility of fintechs, fostering enhanced customer experiences and operational efficiencies [17]. In this paper, all banks and fintechs were taken as the research objects, and the innovation collaboration system of banks and fintechs was studied by establishing an evolutionary game model based on the prospect theory from the micro level. This study has provided the following contributions. First, we established the evolutionary game relationship between banks and fintech companies, analyzing the dynamics of collaboration stability within China’s rapidly expanding fintech market and the development of a new fintech ecosystem. Second, by considering the bounded rationality of collaborating partners, this study enhanced analytical rigor by incorporating prospect theory into the decision-making processes of banks and fintechs. Third, we qualitatively examined the factors that influence collaboration stability using scenario simulation analysis. The simulation results provide recommendations for banks and fintechs to develop a stable and effective partnership.
The main conclusions of this study are as follows:
First, within the framework of bounded rationality, when the long-term synergistic benefits derived from collaboration outweighed the associated costs, the ‘collaboration’ strategy emerged as the stable and optimal choice. This approach not only maximizes the individual gains for both banks and fintechs but also facilitates a balance of interests, contributing to the overall optimization of social welfare. The stability of this strategy is rooted in its ability to harmonize the mutual benefits, thus fostering a more sustainable and productive partnership. Second, from the perspective of collaboration benefits, it is necessary to advance the implementation of co-operative innovation achievements to maximize potential benefits and establish a fair mechanism for benefit distribution. Third, the selection of partners with complementary knowledge and technology is vital for enhancing synergy within the collaboration process. This complementary alignment enables a more effective integration of resources and expertise, thereby optimizing the operational efficiency and stability of the partnership. By leveraging each other’s strengths, banks and fintechs can achieve a more robust and dynamic collaboration that addresses a broader range of challenges and opportunities. Fourth, high collaboration costs can engender risk aversion among both fintech companies and commercial banks, potentially diminishing their willingness to engage in collaborative ventures. This risk aversion may stem from concerns about the return on investment and the potential financial costs of collaboration. Managing and mitigating these costs through strategic planning and cost-sharing mechanisms is essential for sustaining collaborative efforts. Fifth, it is advisable for banks and fintechs to undertake perception training aimed at addressing cognitive biases related to gains and losses. Such training can help counteract excessive preference for immediate gains and inappropriate aversion to potential losses, which often distort rational decision-making. By building a more accurate perception of risks and rewards, both parties can minimize the adverse effects of perceptual biases, thereby enhancing the stability and effectiveness of their collaborative relationship.

6.2. Implications

Based on the above analysis, it can be concluded that this study on the factors influencing innovation collaboration between banks and fintech companies provides significant practical insights and implications. By identifying and analyzing these factors, the study aids both sectors in understanding how to manage and optimize their partnerships effectively. This research highlights the critical elements that drive successful collaboration, such as benefits distribution, cost control, and collaborative synergy. It offers actionable recommendations for overcoming challenges and capitalizing on opportunities, ultimately enhancing the effectiveness of innovation strategies. The findings are helpful for banks and fintechs aiming to improve their collaborative efforts, foster innovation, and stay competitive in a rapidly evolving financial landscape. This study can provide the following managerial implications for banks and fintechs:
First of all, to establish a sustainable collaboration mechanism, banks and fintech companies should first conduct thorough market assessments to identify opportunities and challenges. By leveraging their respective strengths and implementing a structured profit-sharing model, they can ensure mutual benefits. Effective profit management and fair distribution are crucial to reducing collaboration risks and promoting stability in the partnership. Secondly, it is essential for both banks and fintechs to thoroughly evaluate the resources and technological capabilities of potential partners. By selecting partners whose resources and management approaches are compatible with their own, they can facilitate the seamless integration of systems and management practices. This strategic alignment not only enhances long-term stability in the partnership but also reduces the likelihood of collaboration failure. Thirdly, it is imperative to implement effective cost planning and control mechanisms throughout the collaboration process to prevent cost overruns and minimize resource wastage in collaborative innovation efforts. Effective cost management not only ensures financial sustainability but also enhances the efficiency and productivity of collaborative projects. By establishing robust budgeting frameworks and monitoring systems, partners can maintain fiscal discipline and allocate resources optimally. Fourthly, both parties in the collaboration must establish effective communication and co-ordination mechanisms to develop financial innovation products gradually. When confronted with potential long-term gains and losses, fintechs and banks often overestimate the likelihood of achieving gains while neglecting rational precautions against losses. However, this inclination undermines collaboration stability. Implementing practical communication and co-ordination mechanisms can prevent both parties from being overly sensitive to potential gains and excessively risk-averse to losses, thereby enhancing the stability of innovation collaboration.

6.3. Limitations and Future Research

While this study has made significant contributions to both practice and theory, several limitations need to be addressed. First, it does not account for government regulatory actions, which may influence the strategic decisions of banks and fintech companies. Second, the study is limited by its focus on binary collaboration relationships. Future research could benefit from expanding the perspective beyond these binary relationships and incorporating network game theory to gain insights into the evolution paths and stability factors of collaboration within financial ecosystem social networks. Understanding the dynamic evolutionary patterns of individual fintech companies and banks within group evolution could provide more comprehensive theoretical and empirical evidence, supporting the stability of collaboration between banks and fintechs.

Author Contributions

Conceptualization, Y.F.; methodology, Y.F.; formal analysis, Y.F. and G.W.; investigation, G.W.; resources, G.W.; writing—review and editing, Y.F. and G.W.; funding acquisition, G.W. All authors have read and agreed to the published version of the manuscript.

Funding

This research was funded by the Natural Science Foundation of Shandong Province (ZR2023MG033) and the Humanities and Social Sciences Foundation of the China Ministry of Education (22YJCH170).

Data Availability Statement

The data that support the findings of this study are available from the corresponding author upon reasonable request.

Conflicts of Interest

The authors declare no conflicts of interest.

References

  1. Zhao, J.; Li, X.; Yu, C.H.; Lee, C.C. Riding the FinTech innovation wave: FinTech, patents and bank performance. J. Int. Money Financ. 2022, 122, 102552. [Google Scholar] [CrossRef]
  2. Merello, P.; Barberá, A.; De la Poza, E. Is the sustainability profile of FinTech companies a key driver of their value? Technol. Forecast. Soc. Chang. 2022, 174, 121290. [Google Scholar] [CrossRef]
  3. Xu, Y.; Bao, H. FinTech regulation: Evolutionary game model, numerical simulation, and recommendations. Expert Syst. Appl. 2023, 211, 118327. [Google Scholar] [CrossRef]
  4. Boot, A.; Hoffmann, P.; Laeven, L.; Ratnovski, L. Fintech: What’s old, what’s new? J. Financ. Stabil. 2021, 53, 100836. [Google Scholar] [CrossRef]
  5. Cheng, M.; Qu, Y. Does bank FinTech reduce credit risk? Evidence from China. Pac.-Basin Financ. J. 2020, 63, 101398. [Google Scholar] [CrossRef]
  6. Wang, Y.; Sui, X.; Zhang, Q. Can fintech improve the efficiency of commercial banks?—An analysis based on big data. Res. Int. Bus. Financ. 2021, 55, 101338. [Google Scholar] [CrossRef]
  7. Chen, X.; You, X.; Chang, V. FinTech and commercial banks’ performance in China: A leap forward or survival of the fittest? Technol. Forecast. Soc. 2021, 166, 120645. [Google Scholar] [CrossRef]
  8. Lee, C.C.; Ni, W.; Zhang, X. FinTech development and commercial bank efficiency in China. Glob. Financ. J. 2023, 57, 100850. [Google Scholar] [CrossRef]
  9. Drasch, B.J.; Schweizer, A.; Urbach, N. Integrating the “troublemakers”: A taxonomy for cooperation between banks and fintechs. J. Econ. Bus. 2018, 100, 26–42. [Google Scholar] [CrossRef]
  10. Muthukannan, P.; Tan, B.; Gozman, D.; Johnson, L. The emergence of a fintech ecosystem: A case study of the Vizag Fintech Valley in India. Inf. Manag. 2020, 57, 103385. [Google Scholar] [CrossRef]
  11. National Internet Finance Association of China (NIFA). 2021 Chief Insight Report on China’s FinTech Enterprises. Available online: https://www.nifa.org.cn/nifa/2955675/2955761/2998236/index.html (accessed on 25 July 2021).
  12. Acar, O.; Çıtak, Y.E. Fintech integration process suggestion for banks. Procedia Comput. Sci. 2019, 158, 971–978. [Google Scholar] [CrossRef]
  13. Li, J.; Li, J.; Zhu, X.; Yao, Y.; Casu, B. Risk spillovers between FinTech and traditional financial institutions: Evidence from the US. Int. Rev. Financ. Anal. 2020, 71, 101544. [Google Scholar] [CrossRef]
  14. Lai, C.; Li, R.; Gao, X. Bank competition with technological innovation based on evolutionary games. Int. Rev. Econ. Financ. 2024, 89, 742–759. [Google Scholar] [CrossRef]
  15. Haddad, C.; Hornuf, L. How do fintech start-ups affect financial institutions’ performance and default risk? Eur. J. Financ. 2023, 29, 1761–1792. [Google Scholar] [CrossRef]
  16. Hornuf, L.; Klus, M.F.; Lohwasser, T.S.; Schwienbacher, A. How do banks interact with fintech startups? Small Bus. Econ. 2021, 57, 1505–1526. [Google Scholar] [CrossRef]
  17. Fang, Y.; Ye, L.; Wen, G.; Wang, R. Do commercial banks benefit from bank-fintech strategic collaboration? Evidence from Chinese city banks. Int. J. e-Collab. 2022, 18, 1–18. [Google Scholar] [CrossRef]
  18. Gomber, P.; Koch, J.A.; Siering, M. Digital finance and fintech: Current research and future research directions. J. Bus. Econ. 2017, 87, 537–580. [Google Scholar] [CrossRef]
  19. Najaf, K.; Schinckus, C.; Yoong, L.C. VaR and market value of fintech companies: An analysis and evidence from global data. Manag. Financ. 2021, 47, 915–936. [Google Scholar] [CrossRef]
  20. Cheng, M.; Zhao, H.; Zhou, M. Foreign strategic investors, state ownership, and non-interest activities: Evidence from China. J. Financ. Stab. 2020, 50, 100779. [Google Scholar] [CrossRef]
  21. Lu, M.; Gao, Y.; Wan, Q. Research on evolutionary game of collaborative innovation in supply chain under digitization background. Math. Probl. Eng. 2021, 2021, 3511472. [Google Scholar] [CrossRef]
  22. Riikkinen, M.; Pihlajamaa, M. Achieving a strategic fit in fintech collaboration–A case study of Nordea Bank. J. Bus. Res. 2022, 152, 461–472. [Google Scholar] [CrossRef]
  23. Elia, G.; Stefanelli, V.; Ferilli, G.B. Investigating the role of Fintech in the banking industry: What do we know? Eur. J. Innov. Manag. 2023, 26, 1365–1393. [Google Scholar] [CrossRef]
  24. Akhtar, Q.; Nosheen, S. The impact of fintech and banks M&A on acquirer’s performance: A strategic win or loss? Borsa Istanb. Rev. 2022, 22, 1195–1208. [Google Scholar] [CrossRef]
  25. Hoang, Y.H.; Nguyen, N.T.H.; Vu, N.B.; Nguyen, D.T.T.; Tran, L.H.T. Toward successful bank-fintech partnerships: Perspectives from service providers in an emerging economy. Asian Soc. Sci. 2021, 17, 19–24. [Google Scholar] [CrossRef]
  26. Luo, Y.; Li, C.; Luo, B. Research on evolutionary mechanism of competition between third-party payment institutions and commercial banks based on double-layer network. Chin. J. Manag. Sci. 2023, 31, 238–247. [Google Scholar] [CrossRef]
  27. Ye, L.; Fang, Y. Evolutionary game analysis on firms and banks’ behavioral strategies: Impact of environmental governance on interest rate setting. Environ. Impact Assess. Rev. 2021, 86, 106501. [Google Scholar] [CrossRef]
  28. Shen, J.; Gao, X.; He, W.; Sun, F.; Zhang, Z.; Kong, Y.; Wan, Z.; Zhang, X.; Li, Z.; Wang, J.; et al. Prospect theory in an evolutionary game: Construction of watershed ecological compensation system in Taihu Lake Basin. J. Clean. Prod. 2021, 291, 125929. [Google Scholar] [CrossRef]
  29. Tversky, A.; Kahneman, D. Advances in prospect theory: Cumulative representation of uncertainty. J. Risk Uncertain. 1992, 5, 297–323. [Google Scholar] [CrossRef]
  30. Dong, J.; Jiang, Y.; Liu, D.; Dou, X.; Liu, Y.; Peng, S. Promoting dynamic pricing implementation considering policy incentives and electricity retailers’ behaviors: An evolutionary game model based on prospect theory. Energy Policy 2022, 167, 113059. [Google Scholar] [CrossRef]
  31. Bank of Nanjing. Annual Report of Bank of Nanjing for 2018. Available online: https://www.njcb.com.cn/njcbmobile/2019-04/30/article_2023081810211070606.html. (accessed on 30 April 2019).
Figure 1. Evolutionary game mechanisms for innovation collaboration.
Mathematics 12 02724 g001
Figure 2. The replicated dynamic phase graph of banks.
Mathematics 12 02724 g002
Figure 3. The replicated dynamic phase graph of fintechs.
Mathematics 12 02724 g003
Figure 4. Phase graph of evolutionary game of banks and fintechs in innovation collaboration.
Mathematics 12 02724 g004
Figure 5. The influence of the overall long-term benefits (π) on the final strategy of the game; (a) the influence of the overall long-term benefits (π) on the banks’ strategy; (b) the influence of the overall long-term benefits (π) on the fintechs’ strategy.
Mathematics 12 02724 g005
Figure 6. The influence of long-term costs for banks (Ca) on the final strategy of the game; (a) the influence of long-term costs for banks (Ca) on the banks’ strategy; (b) the influence of long-term costs for banks (Ca) on the fintechs’ strategy.
Mathematics 12 02724 g006
Figure 7. The influence of long-term costs for fintechs (Cb) on the final strategy of the game; (a) the influence of long-term costs for fintechs (Cb) on the banks’ strategy; (b) the influence of long-term costs for fintechs (Cb) on the fintechs’ strategy.
Mathematics 12 02724 g007
Figure 8. The influence of the collaboration benefit distribution coefficient (λ) on the final strategy of the game; (a) the influence of long-term costs for fintechs (Cb) on the banks’ strategy; (b) the influence of long-term costs for fintechs (Cb) on the fintechs’ strategy.
Mathematics 12 02724 g008
Figure 9. The influence of the knowledge complementarity coefficient (β) on the final strategy of the game; (a) the influence of the knowledge complementarity coefficient (β) on the banks’ strategy; (b) the influence of the knowledge complementarity coefficient (β) on the fintechs’ strategy.
Mathematics 12 02724 g009
Figure 10. The influence of collaboration synergy coefficient (θ) on the final strategy of the game; (a) the influence of collaboration synergy coefficient (θ) on the banks’ strategy; (b) the influence of collaboration synergy coefficient (θ) on the fintechs’ strategy.
Mathematics 12 02724 g010
Figure 11. The influence of the profit sensitivity of banks and fintechs (α) on the final strategy of the game; (a) the influence of the profit sensitivity of banks and fintechs (α) on the banks’ strategy; (b) the influence of the profit sensitivity of banks and fintechs (α) on the fintechs’ strategy.
Mathematics 12 02724 g011
Figure 12. The influence of the sensitivity of banks and fintech companies to losses (δ) on the final strategy of the game; (a) the influence of the sensitivity of banks and fintech companies to losses (δ) on the banks’ strategy; (b) the influence of the sensitivity of banks and fintech companies to losses (δ) on the fintechs’ strategy.
Mathematics 12 02724 g012
Table 1. Definitions of core methods and research objects.
Core Methods and Research ObjectsDefinitions
Prospect TheoryProspect theory describes how people make decisions under uncertainty, highlighting that individuals value gains and losses differently. Unlike traditional utility theory, prospect theory accounts for psychological biases, such as loss aversion and framing effects, influencing choices based on perceived probabilities rather than actual outcomes.
Evolutionary Game MethodThe evolutionary game method studies strategic interactions among agents whose strategies evolve over time based on their success. Unlike classical game theory, which assumes rational decision-making, this approach models how strategies can change due to adaptation and natural selection, providing insights into the dynamics of collaboration and competition in biological and social systems.
Innovation Collaboration between Banks and FintechsInnovation collaboration between banks and fintechs involves partnerships where banks leverage fintechs’ technology to enhance their services, while fintechs gain access to banks’ resources and customer bases. This collaboration fosters innovation in financial products and services, improves customer experience, and accelerates digital transformation, benefiting both parties and driving industry growth.
Table 2. The research gaps.
Research GapsMethodology
Existing research predominantly analyzes the collaborative relationship between banks and fintech companies from a static perspective.This study employs evolutionary game theory to construct a co-operative game model, analyzing the relationship between banks and fintechs from a dynamic evolutionary perspective.
Existing research usually assumes collaborators are entirely rational and seek to maximize benefits. Applying prospect theory to incorporate bounded rationality in the analysis of collaborator behavior.
Only some studies have thoroughly considered the specific characteristics of cooperative games that differ from non-co-operative games.A comprehensive sensitivity analysis of the factors influencing the stability of collaboration is conducted using simulation methods
Table 3. Parameter description.
CategoriesParametersDefinitions
Parameters regarding the costs and benefits of banksI1Interest income
S1Fee and commission income
D1Short-term collaboration income
ΔL1Perceived income of long-term collaboration
C1Short-term collaboration cost
ΔE1Perceived costs of long-term collaboration
Parameters regarding the costs and benefits of fintechsI2Sales and service income
S2Technology service income
D2Short-term collaboration income
ΔL2Perceived income of long-term collaboration
C2Short-term collaboration cost
ΔE2Perceived costs of long-term collaboration
Parameters regarding collaborationβComplementarity of knowledge and technology between the parties
θSynergies in the collaboration process
Parameters regarding the value perception based on prospect theorypiThe objective probability of a decision event occurring
ΔxThe perceived value
αThe degree of convexity of the power function of the value of the gains
δThe degree of convexity of the power function of the value of the losses
CaThe long-term cost of collaboration of banks
CbThe long-term cost of collaboration of fintechs
Table 4. The payoff matrix of the game.
Fintech Companies (F)
Collaboration (y)Competition (1 − y)
Banks
(B)
Collaboration (x)I1 + S1 + βD1 + θβD1 + βΔL1 + θβΔL1C1 − |ΔE1|
I2 + S2 + βD2 + θβD2 + βΔL2 + θβΔL2C2 − |ΔE2|
I1 + S1 + βD1 + θβD1C1 − |ΔE1|
I2 + S2 + βD2 + θβD2 + βΔL2C2
Competition (1 − x)I1 + S1 + βD1 + θβD1 + βΔL1C1
I2 + S2 + βD2 + θβD2C2 − |ΔE2|
I1 + S1 + βD1 + θβD1
I2 + S2 + βD2 + θβD2
Table 5. The determinants and traces of Jacobian matrix.
Equilibrium Pointsdet(G)tr(G)
Z1(0,0)(C1 + |ΔE1|)(C2 + |ΔE2|)−(C1 + |ΔE1| + C2 + |ΔE2|)
Z2(0,1)(θβΔL1 − |ΔE1|)(C2+|ΔE2|)(θβΔL1 − |ΔE1|) + (C2 + |ΔE2|)
Z3(1,0)(C1 + |ΔE1|)(θβΔL2 − |ΔE2|)(C1 + |ΔE1|) + (θβΔL2 − |ΔE2|)
Z4(1,1)(θβΔL1 − |ΔE1|)(θβΔL2 − |ΔE2|)−(θβΔL1 − |ΔE1|) − (θβΔL2 − |ΔE2|)
Z0(x*,y*)(C1 + |ΔE1|)(C2 + |ΔE2|)(θβΔL1 − |ΔE1|)(θβΔL2 − |ΔE2|)0
Table 6. Analysis of stability of local equilibrium points.
Equilibrium Pointsdet(G)tr(G)Result
Z0(0,0)+ESS
Z1(1,0)++Instability
Z2(0,1)++Instability
Z3(1,1)+ESS
Zo(x*,y*)+0Saddle point
Disclaimer/Publisher’s Note: The statements, opinions and data contained in all publications are solely those of the individual author(s) and contributor(s) and not of MDPI and/or the editor(s). MDPI and/or the editor(s) disclaim responsibility for any injury to people or property resulting from any ideas, methods, instructions or products referred to in the content.

