Abstract
The survivability of out-of-hospital cardiac arrest patients in China is notably low, at less than 1%, primarily due to difficulties in accessing nearby Automated External Defibrillator (AED) devices during emergencies. Therefore, the strategic deployment of AEDs is crucial for improving patient survival. This study adopts a novel hybrid methodology that integrates the Fuzzy Analytic Network Process (FANP) and Grey Relational Analysis (GRA) to assess and prioritize the critical factors for optimizing AED deployment in China. In the FANP model, the rate of cardiopulmonary resuscitation training among individuals in the area, the rate of AED training among individuals in the area, and records of AED device usage within the area are key factors for improving the effectiveness of AED deployment. Furthermore, in the GRA model, the factors with higher gray relational degrees are Visibility, Social Environment, and Accessibility. This analysis sheds light on which secondary indicators can have the most significant impact on improving specific primary indicators. The insights from this study can guide the optimization of AED deployment strategies in China and offer practical solutions for enhancing the deployment of relevant public medical facilities.
Keywords:
automated external defibrillator; optimization deployment; fuzzy analytic network process; grey relational analysis; multi-criteria decision making MSC:
90B50; 62P10
1. Introduction
In this chapter, we first present the research background. This includes the current status of pre-hospital emergency care, the deployment of Automated External Defibrillator (AED), an introduction to AED, and the methods used in current research on AED deployment issues, along with their limitations. Next, we discuss the methods employed in this study to address the decision-making problems related to AED deployment. Finally, we clarify the main goals of the research to provide a clear framework and direction for the following chapters.
1.1. Research Background
The number of deaths worldwide due to sudden cardiac arrest has been on the rise. In China, approximately 80% of cardiac arrests occur outside the hospital, with around 550,000 cases annually, yet the survival rate is less than 1% []. Early defibrillation using an AED is an indispensable component of the pre-hospital emergency survival chain for out-of-hospital cardiac arrest (OHCA) patients. The pre-hospital emergency survival chain consists of four key steps: early recognition and call for help, early high-quality Cardio Pulmonary Resuscitation (CPR), early defibrillation, and early Advanced Cardiac Life Support (ACLS) [,,]. The unpredictability of OHCA and the challenges posed by geography make it extremely difficult to provide rapid, timely, and effective treatment for OHCA. In 1995, the American Heart Association (AHA) introduced the Public Access Defibrillation (PAD) program, which involves the use of AED by first responders, before the arrival of Emergency Medical Service (EMS) personnel, to enhance the chances of survival for OHCA patients [,]. If CPR is initiated within 1 min and defibrillation is performed within 3 to 5 min for OHCA patients, the survival rate can reach 50% to 70%. However, with each minute of delay in defibrillation, the survival rate decreases by 7% to 10%. Therefore, early defibrillation of OHCA patients significantly increases their chances of survival, making the PAD program a crucial initiative [,]. However, the utilization rate of PAD remains low. The key factors and strategies for AED deployment are worth studying.
Initially, defibrillators were used as emergency equipment in hospital operating rooms. With the spread of emergency medical knowledge, simpler and more user-friendly AED devices have been gradually deployed outside hospitals, allowing for early treatment of patients in the early stages of the disease. In 2015, the AHA recommended that in areas with high foot traffic and high population density, AED devices should be deployed as extensively as possible. They also suggested implementing a public access defibrillation program in conjunction with public locations to ensure timely treatment for cardiac arrest patients. According to statistics, the number of AED devices per 100,000 people is close to 400 in Japan, close to 200 in the United States, and exceeds 20 in both the United Kingdom and Australia [,]. China’s AED promotion program started in 2004, and public reports indicate that AED devices are mainly concentrated in major cities’ transportation hubs such as airports, subway stations, and train stations in densely populated areas. They are also temporarily deployed during large events such as sports events and marathons. In recent years, the Chinese government has placed increasing importance on the deployment of emergency equipment such as AEDs. For instance, in 2006, Beijing Capital International Airport equipped its three terminals with 76 AED units. Other cities such as Shanghai, Hangzhou, and Shenzhen have also installed large numbers of AED devices in public places. By 2019, Shenzhen had completed the installation of over two thousand AED units along with related emergency supplies []. Compared to other countries, the deployment of AED devices in China is still relatively low. There is also a lack of clear patterns and regulations regarding the actual deployment locations.
An AED is a medical device designed to save the life of a patient suffering from specific cardiac arrhythmias. It can rapidly diagnose particular arrhythmias and help restore normal heart rhythm through defibrillation by delivering an electrical shock. Compared to defibrillators in operating rooms, AEDs are more compact, easy to operate, and portable [,]. Even people with no prior experience can use them with guidance. Currently, automatic defibrillation products are divided into three categories: Wearable Cardioverter Defibrillator (WCD), drone-based Automated External Defibrillator, and standard Automated External Defibrillator. The WCD does not require surgical implantation and can be worn and removed at any time. Typical products include the ZOLL Life Vest(ZOLL, Boston, MA, USA) and the Vivest WCD (Vivest, Nanjing, China). These products are generally used for emergency defibrillation in high-risk sudden cardiac arrest populations and are not suitable for sudden cardiac arrest events in public places. The drone-based Automated External Defibrillator is not just a combination of a drone and an AED but a smart airborne rescue platform built using 5G technology. It offers a new approach to establishing an emergency rescue pathway for sudden cardiac arrest patients. Typical products include the Vivest Air AED(Vivest, Nanjing, China). These products further improve the accessibility and efficiency of urban emergency resources, but are still in the exploratory research and development stage. The standard Automated External Defibrillator is the emergency equipment commonly deployed in public places in most countries. The user profile for these products is non-medical personnel who are the first responders. Typical products include the Mindray Bene Heart D6 Defibrillator Monitor (Mindray, Shenzhen, China), Mindray Bene Heart D1 (Mindray, Shenzhen, China), Heart Save AED-M (Pumacare, Wels, Germany), ZOLL AED PLUS (ZOLL, Boston, MA, USA), HeartStart Smart AED (Philips, Amsterdam, The Netherlands), Cardiolife AED-3100 (NIHON KOHDEN, Hamamatsu City, Japan), and Power Beat X3 (Vivest, Nanjing, China). These products are known for their high functionality and ease of operation; however, their use in cardiac arrest incidents remains low [,,]. This paper studies AED optimization deployment indicators and strategies. They mainly focus on standard Automated External Defibrillators that are commonly deployed in most countries.
Currently, researchers mainly use two methods to address the deployment issues of AEDs. The first method relies on statistical indicators. The optimal locations for AEDs can be determined based on statistical indicators such as historical cardiac arrest events [], geographic landmarks [,], spatial accessibility [], population density [,], and so on. The strategy of deploying AEDs based on historical cardiac arrest events can be referred to as a case-based approach. It involves collecting precise location data of OHCA occurrences in specific areas and creating a geographic coding map of OHCA incidents [,]. This helps identify high-risk areas for OHCA incidents and guides the placement of AEDs. For example, Min Fan et al. studied the straight-line distance and walking distance between existing AED locations and historical OHCA locations in Hong Kong. They focused on the proportion of historical OHCAs that occurred within a 100-m range of an AED []. The landmark-based strategy involves selecting specific public locations such as schools, sports facilities, subway stations, and airports to place AEDs in fixed locations []. The advantage of this strategy is that local bystanders can quickly locate the position of the AED in these familiar landmarks. Compared to other strategies, the landmark-based approach does not rely on mobile applications to locate AED positions, making it significantly convenient []. The grid-based strategy involves dividing the area requiring AED deployment into equidistant grids and placing AEDs at equally spaced positions, typically 200 m apart []. The strategy based on population density in a region involves determining the number of AED placements in an area based on the density of the population in that region []. However, the current AED deployment using statistical indicators typically evaluates only single indicators. This approach may result in uneven deployment, with some areas being excessively covered while other equally in-need areas are inadequately considered.
The second method is mathematical modeling [,,]. Commonly used mathematical models include the p-median model, set covering model, and maximum coverage model, among others. These models primarily address the spatial distribution issues of AEDs. Some researchers have also considered that not all registered AEDs are accessible 24 h a day. They have proposed spatiotemporal optimization models [,], dividing the week into time periods to analyze the availability of each AED at each time, aiming to improve the spatiotemporal accessibility coverage of AEDs. In all these mathematical optimization models, whether pure spatial or spatiotemporal, the definition of coverage distance between facilities and demand points is crucial for effectively evaluating the spatial accessibility of AEDs. It forms the foundation for constructing models accurately.
Although previous studies have provided methods and suggestions from multiple perspectives for the optimal deployment of AEDs, they often focus on single indicators influencing AED optimization deployment. The ranking of the importance of indicators affecting AED optimization deployment from a macro perspective has not been specifically researched. There is still a lack of established effective reference indicators to measure the importance of various factors.
1.2. Method Selection
To maximize the efficiency of AED usage and the benefits of deployment, decision-makers need to rely on effective decision analysis tools to determine the optimal AED deployment strategy. In this regard, the Fuzzy Analytic Network Process (FANP) as an advanced decision analysis method has shown tremendous potential [,,]. Kahraman et al., drawing from fuzzy theory, combined it with ANP to propose a comprehensive approach known as FANP []. This method is capable of handling uncertainty, fuzziness, and complex relationships to address decision problems arising from imprecise psychological perceptual variables.
By reviewing the cases and research outcomes where FANP has been utilized in existing literature, it is evident that FANP has been extensively applied in various fields of multi-criteria decision-making problems. It has been proven to be an efficient and reliable method for multi-criteria decision research [,,]. For example, in fields such as engineering management, financial decision-making, healthcare, etc. Compared to other decision analysis methods, FANP has clear advantages in handling fuzzy information and complex relationships, allowing for a more accurate reflection of the complexity of real decision scenarios. Through the FANP method, decision-makers can better understand the essence of the problem, clarify the relationships between various factors, and make wiser, more scientifically informed decisions.
Chinese scientist Deng Julong first introduced Grey relational analysis in 1982 []. This method is a data analysis technique based on grey system theory, which describes uncertainty problems as grey systems. By fuzzifying information, it aims to reveal underlying regularities and study the degree of relationships between entities. It is particularly suitable for handling cases with incomplete information and high uncertainty. These characteristics make GRA a suitable method for solving Multi-Criteria Decision Making (MCDM) problems involving multiple attributes and scenarios [].
The reason for choosing GRA as the research method in this paper is that it can overcome the limitations of traditional analysis methods when dealing with incomplete information. It has strong adaptability and reliability. By comparing the degree of association in data sequences, GRA can reveal the inherent relationships between variables, providing decision-makers with objective and scientifically based reference points.
1.3. Research Objectives
The objective of this study is to conduct a comprehensive analysis of the various factors influencing the efficiency of AED usage, with the aim of determining the ranking of key factors for optimizing AED deployment in China. Meanwhile, proposing optimization suggestions for AED deployment.
We constructed indicators for optimizing AED deployment through expert questionnaires and literature reviews of other studies. Subsequently, we used the FANP to determine the weights of evaluation dimensions and indicators. Finally, we employed GRA (GRA) to determine the correlation between the sub-indicators with the highest weights under each main indicator and other sub-indicators. Thus, achieving the following research objectives:
- Establish an evaluation system for optimizing the deployment of Automated External Defibrillators.
- Analyze the weights of evaluation dimensions and indicators for optimizing the deployment of Automated External Defibrillators using FANP from the perspective of experts.
- Utilize GRA to provide decision support for optimizing the deployment of Automated External Defibrillators.
- Fill the research gap regarding the ranking of indicator importance influencing the optimization deployment of Automated External Defibrillators and provide relevant decision recommendations for AED optimization deployment.
2. Materials and Methods
A hybrid method based on FANP and GRA is proposed to assess the importance of indicators influencing the optimization deployment of AED and provide corresponding strategies. The research process is shown in Figure 1.
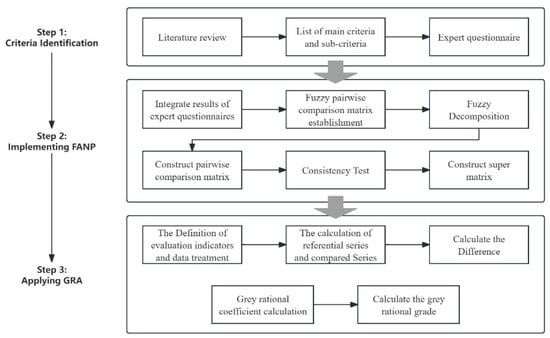
Figure 1.
Research Processes.
The research process is divided into three main steps. The first step is to establish evaluation indicators. We determine the main and secondary criteria that affect the deployment of AED through a literature review and expert interviews. Next, we design and distribute a questionnaire to collect opinions and data from experts in the field. The second step is to implement the FANP. Based on the results from the expert questionnaire, we calculate the FANP to obtain the weight ranking of the main and secondary criteria. The third step is to apply GRA. Using the results from FANP, we apply GRA to identify the relationship between the secondary criteria and the main criteria. Through these three steps, we can rank the effectiveness of indicators for optimizing AED deployment. We can also identify which secondary indicators need to be strengthened to improve a specific main indicator. This will provide effective support for optimizing AED deployment in China.
2.1. The Identification of Evaluation Criteria
In this study, the development of guidelines is the foundation. Only by having effective guidelines can experts make better judgments and choices, thus making the importance ranking of AED deployment guidelines obtained through data more reliable. After literature research, we finalized 5 primary guidelines and 26 minor guidelines. The evaluation process is divided into two levels: the first level consists of 5 main criteria and the second level consists of 26 secondary criteria. The details of the evaluation criteria are shown in Figure 2.
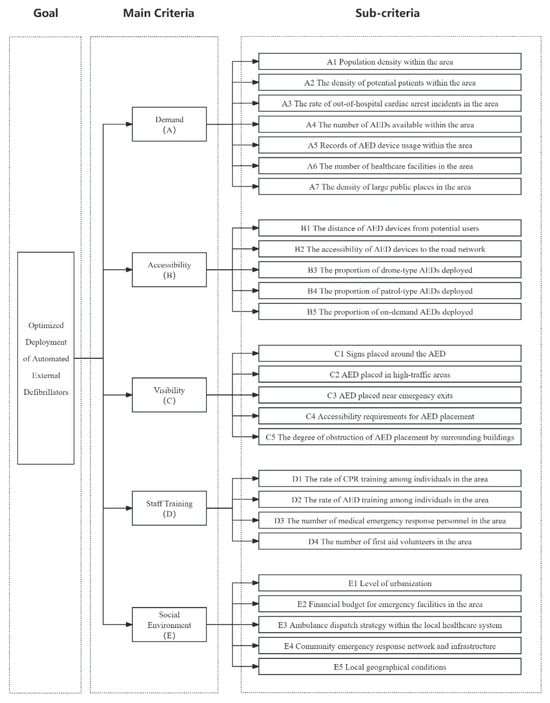
Figure 2.
Evaluation criteria identification.
The first major criterion is demand. The purpose of this criterion is to assess the actual amount of AED demand at different locations. According to Liu et al., population density in an area has a significant impact on the number of AEDs deployed, so this main criterion was established []. Two secondary criteria were established: population density within the region and density of potential patients. Further reference was made to the analysis of Kobayashi et al. [] and Liang et al. [], who analyzed specific OHCA incidence data to explore the optimal location for AED deployment. Based on this, we added four secondary criteria: the incidence of historical out-of-hospital cardiac arrest events in the region, the number of existing AEDs, the record of AED device use, and the number of medical institutions in the region. Finally, based on the findings of Cram et al. [], we learned that the initial AED deployment strategy was mainly focused on public venues, such as shopping malls, large retailers, offices, transportation hubs, and sports venues. Therefore, we add a secondary criterion: the density of large public spaces in the area.
The second major criterion is accessibility. Designed to measure AED accessibility in different locations. We refer to the study of Lin, C.H., and Chu, K.C. et al. [], which classified the accessibility of AEDs into three types: fixed, summonable, and patrolling. In addition, Hajari, Hadi, et al. further explored the application of summonable AEDs in buses []. Based on these studies, we developed a second major guideline and set five secondary indicators: distance between AED equipment and potential users, accessibility between AED equipment and road networks, proportion of drone AED sites, proportion of patrol AEDs, and proportion of summonable AEDs.
The third major criterion is Visibility. It is intended to indicate that the AED should be placed in a location that can be easily noticed and detected. We refer to the study of Smith et al. [], which states that AEDs should be placed in a location that is likely to attract public attention. Visibility is not only about the physical location of the AEDs but also about ensuring that the public can discover and use these devices in a timely manner. Therefore, we also drew out several relevant secondary criteria, including whether the AED is clearly marked around the AED, whether the AED is placed in a high-traffic area, whether the AED is located near the emergency exit, whether the AED is placed in a location that meets the accessibility requirements, and whether the AED is placed in a location that is obstructed by the surrounding buildings.
The fourth major criterion is personnel training. That is, considering the training of personnel around the location where the AED is deployed. We refer to studies by Merchant et al. [], and Soar, J. et al. [], all of which emphasize the importance of early initiation of CPR in emergency situations for lay rescuers. In addition, the study of Matinrad et al. [] further explores the critical role of first aid volunteers in emergency response. As a result, we have established the primary criteria for personnel training, as well as four related secondary guidelines: the proportion of CPR trained by personnel in the area, the proportion of personnel trained in the use of AEDs in the area, the number of medical emergency responders in the area, and the number of first aid volunteers in the area.
The fifth major criterion is the social environment. Based on the study by Chen et al. [], we added this primary criterion and set five relevant secondary criteria: the level of urbanization, the fiscal budget of the region’s emergency facilities, the ambulance dispatch strategy of the region’s healthcare system, the community’s emergency response network and infrastructure, and the region’s geography.
Furthermore, based on the suggestions of 15 experts, this study obtained the interdependence relationships between the main criteria and sub-criteria, thereby establishing the hierarchical structure and network structure of the criteria influencing the optimization deployment of AED, as shown in Figure 3.
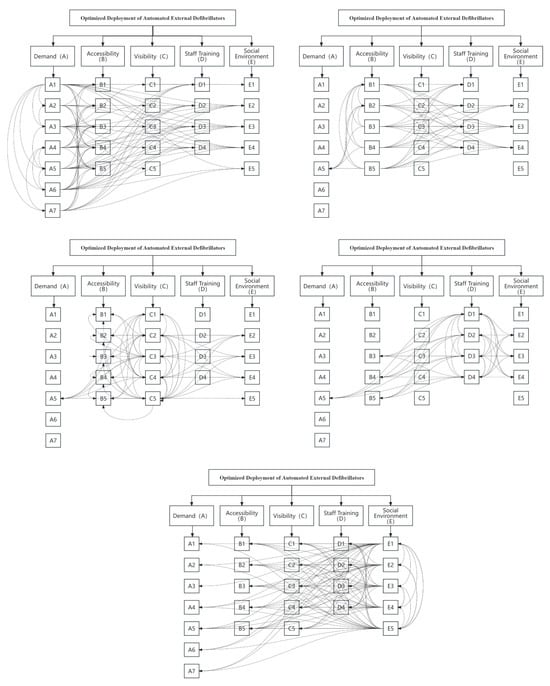
Figure 3.
The hierarchy and network structure of this research.
2.2. Questionnaire Establishment and Measuring
Regarding the quantity of experts involved, Darko et al. contended that a high number of experts may result in the inclusion of “door-knocking” experts [], which has a considerable impact on the consistency assessment results. Moreover, we found that many studies use small sample sizes of 10–15 experts to acquire valuable and dependable decision-making information [,,]. Therefore, in this study, we selected 15 experts.
In this study, the selection of experts is very important. Therefore, we set a series of specific criteria to ensure that the selected experts have deep knowledge and experience in relevant fields.
We mainly considered the following criteria: first, experts need to have professional knowledge related to the research topic, including areas such as medicine, emergency training, medical devices, and public health. Only experts with relevant knowledge can accurately understand the key issues in the optimization of AED deployment, provide effective insights, and ensure that the advice given is scientifically valid. Second, we prioritize experts with at least five years of work experience in their respective fields. This rich experience ensures that they have a deep understanding of industry trends and professional skills. It also enables them to better identify and solve specific problems that may arise, thus enhancing the credibility of the survey. Third, experts from academia should have published high-level academic papers or participated in relevant research projects. This ensures that the experts have a certain level of academic reputation and influence and that their research results and experience can provide authoritative support for the study on AED optimization, while also increasing the acceptability of the survey. Fourth, for experts in emergency training and medical devices, we assess their participation in actual training and equipment application. This is to ensure that their understanding of the methods is not limited to theory alone.
In the process of selecting experts, we first contacted several hospitals to identify specialists and managers in relevant fields. Next, we reached out to well-known medical device manufacturers and invited their research and application experts to join the study. Additionally, we found experts in public health through official websites and related documents. Finally, we identified and contacted scholars who have published important papers on the research topic at relevant academic conferences and in journals. Eventually, 15 experts who best fit the criteria were recruited. These experts cover multiple fields, including 6 medical experts, 4 emergency training experts, 2 medical device experts, and 3 public health experts. Their diverse professional backgrounds and knowledge distribution provided diversity and comprehensiveness to the questionnaire study, helping to ensure the accuracy and credibility of the research results. In addition, to strengthen the stability of expert opinions, we first distributed the questionnaire to experts from 13 June to 25 August 2023 and then sent the same questionnaire again from 10 October to 21 December 2023. The results from both rounds were good and largely consistent. For questions with differing answers, we will ask the experts again to ensure the accuracy of the final responses.
The questionnaires yielded hierarchical and network structures. We input the relevant assessment metrics from the hierarchical and network structures into the Super Decision software (version 3.2.0) to generate a pairwise comparison survey using a 9-point evaluation scale. The results of the pairwise comparison questionnaire were consolidated using the geometric mean method and analyzed using FANP. Additionally, we conducted GRA based on the FANP results. This analysis aims to assess the correlation between the five primary indicators and the 26 subordinate secondary indicators.
2.3. Fuzzy Logic and Linguistic Variables
Academics argue that linguistic variables are utilized to quantify significance, such as “very important”, “important”, “moderate”, “unimportant”, and “very unimportant”, are often ambiguous [,]. Therefore, the introduction of fuzzy logic is essential to clarify human psychological perceptual states.
Fuzzy logic was proposed by the renowned Iranian-American mathematician Lotfi Zadeh in 1965 []. It is a mathematical logic system used to handle uncertainty and vagueness []. Furthermore, Buckley discussed the attributes of triangular fuzzy numbers, providing a method to effectively depict human imprecise psychological perception variables by transforming fuzzy numbers into tangible and practical values. In addition, Pedrycz [] has shown that triangular fuzzy numbers are ideal for articulating the relative psychological perception and judgment levels of criteria and choices within hierarchical and network frameworks. Therefore, this study employs triangular fuzzy numbers to portray scales of linguistic variables.
Triangular fuzzy numbers are a common mathematical representation method in fuzzy logic, typically used to indicate the degree of uncertainty in fuzzy concepts. In triangular fuzzy numbers, uncertainty is described by three parameters of a triangle (the minimum value, maximum value, and peak value). For example, A (L, M, U) is given by the following formula.
The precise value of a triangular fuzzy number can be calculated using Formula (2).
In addition, FANP employs a nine-point evaluation scale to assess the significance of each evaluation criterion. Thus, we integrated triangular fuzzy numbers with the FANP evaluation scale to appraise and gauge experts’ genuine psychological preferences for particular options. Table 1 provides the corresponding fuzzy numbers.

Table 1.
Fuzzy numbers and scales [].
2.4. Fuzzy Analytic Network Process
In this section, we will provide a detailed description of the calculation process for the FANP. Through these steps, we will obtain the weights for both the main and secondary indicators.
2.4.1. Consolidate Opinions of All Experts
In the FANP model, the geometric mean method is used to integrate expert scores.
where n represents the number of experts.
2.4.2. The Construction of Fuzzy Pairwise Comparison Matrix
During this stage, a fuzzy pairwise comparison matrix is conducted and illustrated as follows:
where depicts the fuzzy pairwise comparison matrix. stands for the triangular fuzzy mean value used to compare priority pairs among elements.
2.4.3. Fuzzy Decomposition
The process of defuzzification is outlined as follows:
where:
where:
- represents the lower boundary value of the triangular fuzzy number.
- denotes the median value of the triangular fuzzy number.
- stands for the upper boundary value of the triangular fuzzy number.
When the diagonal matrix is matching, we have:
2.4.4. Set up the De-Fuzzified Comparison Matrix
Calculate the weight of each dimension indicator using Formula (5). The de-fuzzified pairwise comparison matrix can be formulated as follows:
2.4.5. The Calculation of Priority Vector
In the Analytic Network Process (ANP) model, the local priority vector is utilized to assess the relative importance attributed to elements or components under comparison. The computation of the local priority vector is as follows:
where:
- A is the de-fuzzified pairwise comparison matrix.
- represents the maximum value of the matrix.
- is the eigenvector.
In the case where A represents the consistency matrix, the eigenvector X is computed in the following manner:
2.4.6. Consistency Check
The Consistency Index (C.I.) and Consistency Ratio (C.R.) are utilized to assess the consistency of the comparison matrix. The definitions of C.I. and C.R. are as follows:
where n is the number of criteria.
The Random Index (R.I.) is a consistency index derived from positive reciprocal matrices of various orders. A C.I. value of ≤0.1 indicates minimal acceptable error, while a C.R. value of ≤0.1 signifies satisfactory consistency of the matrix.
2.4.7. The Construction of Supermatrix
Upon completion of the aforementioned steps, the supermatrix is created in the following manner:
where
- represents the weight of indicators in the supermatrix.
- represents the vector of the feature.
- represents the vector of the criterion.
- represents the dependency of dimensions.
- represent the dependency of criteria.
Ultimately, the weight of indicators in the supermatrix (WN) is calculated as follows:
where
- represents the weight matrix for the main criteria, taking into account the degree of interdependence.
- denotes the evaluation weight matrix for the sub-criteria, also considering the degree of interdependence.
2.5. Grey Rational Analysis
In this section, we will provide a detailed description of the calculation process for GRA. Through these steps, we will obtain the grey relational degree between the main and secondary indicators.
2.5.1. The Definition of Evaluation Indicators and Data Treatment
Based on the results of FANP, GRA is conducted to evaluate the relationship between each secondary indicator and the most important one within the same primary indicator group. Since the scores of the secondary indicators and primary indicators are already relative ratings, we directly use these scores for GRA calculation without the need for additional standardization processing.
2.5.2. The Calculation of Referential Series and Compared Series
The referential series denoted by and consisting of a total of n data points is formally defined as follows:
Subsequently, the series under comparison, denoted as , is formally defined as follows:
2.5.3. Calculate the Difference between Referential Series and Compared Series
The variance between the series is computed in the following manner:
where
- is the referential series of 26 sub-criteria.
- represents the compared series of 26 sub-criteria.
2.5.4. Calculate the Grey Rational Coefficient
The grey relational coefficient between the series under comparison and the reference series at the jth indicator is specified as follows:
2.5.5. The Calculation the Grey Rational Grade
The grey rational grade (GRG) for a series is calculated in the following manner:
Ultimately, the criteria are ranked according to the magnitude of the GRG values .
3. Results
In this chapter, we present the research results. First, we conducted a numerical analysis using the FANP and GRA, based on the formulas and steps outlined in Chapter 2. Next, we present the specific research results obtained from each of these methods.
3.1. Numerical Analysis
In this section, we will present the calculation processes for the FANP and GRA separately.
3.1.1. Fuzzy Analytic Network Process
The expert questionnaires were employed within the FANP model to collect expert opinions. Subsequently, Equation (3) was utilized to amalgamate the experts’ viewpoints, followed by the establishment of the fuzzy pairwise comparison matrix for all criteria in the FANP model.
Table 2 represents the fuzzy pairwise comparison matrices of the five main criteria: Demand (A), Accessibility (B), Visibility (C), Staff Training (D), and Social Environment (E).
Table 2.
The fuzzy pairwise comparison matrix for the five primary criteria in the FANP model.
Table 3 represents the defuzzified pairwise comparison matrices of Demand (A), Accessibility (B), Visibility (C), Staff Training (D), and Social Environment (E).
Table 3.
The defuzzified pairwise comparison matrix for the five primary criteria in the FANP model.
Table 4 represents the calculation process and results of the maximum single values of Demand (A), Accessibility (B), Visibility (C), Staff Training (D), and Social Environment (E).
Table 4.
The process of calculating the maximum individual value.
Table 5 represents the calculation process and results of the weights of Demand (A), Accessibility (B), Visibility (C), Staff Training (D), and Social Environment (E).
Table 5.
The weighting calculation for the five dimensions.
Table 6 represents the calculation process of the normalized matrices for Demand (A), Accessibility (B), Visibility (C), Staff Training (D), and Social Environment (E).
Table 6.
Calculation of the normalized matrix.
Table 7 represents the calculation process and results of the maximum eigenvector (W1) for Demand (A), Accessibility (B), Visibility (C), Staff Training (D), and Social Environment (E).
Table 7.
Calculating the maximum eigenvector for the five main criteria.
Subsequent to determining that the number of main dimensions is 5, denoted as n = 5, the calculations for and C.I. are performed as follows:
For C.R., with n = 5,we have R.I. = 1.12.
In this study, we obtained a consistency index (C.I.) of 0.02905 and a consistency ratio (C.R.) of 0.0259 through consistency testing. C.I. is an indicator used to measure the consistency among raters, and a smaller C.I. value (such as less than 0.1) indicates a high level of agreement among raters, reflecting the reliability of the data. C.R. is derived by comparing the C.I. with a random consistency index, and it measures whether the consistency of raters’ judgments is significantly higher than random levels. When C.R. is less than 0.1, it indicates that the consistency among raters is acceptable, meaning they maintained a certain level of stability during the rating process, which further confirms the reliability of the questionnaire.
Table 8 represents the calculation results of the defuzzified pairwise comparison matrices for Demand (A), Accessibility (B), Visibility (C), Staff Training (D), and Social Environment (E).
Table 8.
The pairwise comparison matrix for the five primary criteria in the FANP model.
In addition, the calculation process for each sub-standard is like the process mentioned above.
Finally, use the Super Decision software (version 3.2.0) to calculate the supermatrix. Table 9, Table 10 and Table 11 show the results of the unweighted supermatrix, weighted supermatrix, and extreme weighted supermatrix. The weight results for each criterion are shown in Table 12.
Table 9.
Results of the unweighted supermatrix calculation.
Table 10.
Results of the weighted supermatrix calculation.
Table 11.
Results of the extreme weighted supermatrix calculation.
Table 12.
Weight results for each criterion.
3.1.2. Grey Rational Analysis
In FANP results, a higher weight value indicates a criterion is more important. Therefore, the maximum weight value of each substandard is taken as the reference sequence , and the weight values of each indicator are taken as the comparison sequence . Table 13 provides the reference sequence and the comparison sequence .
Table 13.
Referential series and compared series.
The calculation results of the deviation sequence and the grey rational coefficient are shown in Table 14 and Table 15.
Table 14.
Deviation sequences.
Table 15.
Grey rational coefficient.
3.2. Research Results
In this section, we will separately present the research results obtained from the FANP and GRA.
3.2.1. Fuzzy Analytic Network Process
According to the calculation results of FANP, the total weight rankings of the 5 main criteria and 26 sub-criteria are shown in Figure 4 and Figure 5.
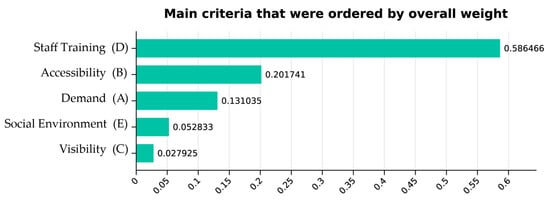
Figure 4.
The overall weight and ranking of five main criteria.
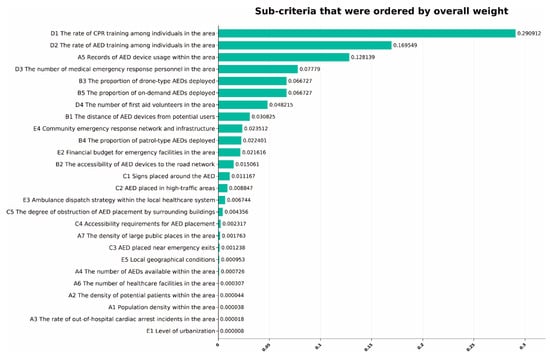
Figure 5.
The overall weight and ranking of sub-criteria.
As shown in Figure 5, the weight rankings of the sub-criteria with the top 3 weights are as follows: D1—the rate of CPR training among individuals in the area (0.290912), D2—the rate of AED training among individuals in the area (0.169549), A5—records of AED device usage within the area (0.128139).
The total weights of the sub-criteria ranked 4th to 8th are as follows: D3—the number of medical emergency response personnel in the area (0.07779), B3—the proportion of drone-type AEDs deployed (0.066727), B5—the proportion of on-demand AEDs deployed (0.066727), D4—the number of first aid volunteers in the area (0.048215), B1—the distance of AED devices from potential users (0.030825).
The total weights of the sub-criteria ranked 9th to 13th are as follows: E4—community emergency response network and infrastructure (0.023512), B4—the proportion of patrol-type AEDs deployed (0.022401), E2—financial budget for emergency facilities in the area (0.021616), B2—the accessibility of AED devices to the road network (0.015061), C1—signs placed around the AED (0.011167).
The total weights of the sub-criteria ranked 14th to 18th are as follows: C2—AED placed in high-traffic areas (0.008847), E3—ambulance dispatch strategy within the local healthcare system (0.006744), C5—the degree of obstruction of AED placement by surrounding buildings (0.004356), C4—accessibility requirements for AED placement (0.002317), A7—the density of large public places in the area (0.001763).
The total weights of the sub-criteria ranked 19th to 23rd are as follows: C3—AED placed near emergency exits (0.001238), E5—local geographical conditions (0.000953), A4—the number of AEDs available within the area (0.000726), A6—the number of healthcare facilities in the area (0.000307), A2—the density of potential patients within the area (0.000044).
The total weights of the last 3 sub-criteria, ranked 24th to 26th, are as follows: A1—population density within the area (0.000038), A3—the rate of OHCA incidents in the area (0.000018), E1—level of urbanization (0.000008).
3.2.2. Grey Rational Analysis
Based on the results of FANP, we conducted a GRA study. The scores for both the main and secondary indicators are already relative scores. The sum of the weights for the five main indicators equals 1, which indicates that these weights have been standardized and accurately reflect the relative importance of each indicator in the overall evaluation. Similarly, the sum of the weights for the 26 secondary indicators also equals 1, which further confirms that their relative relationships have been effectively established. In GRA, this relative relationship is exactly what is needed to effectively compare different options. If we were to apply additional standardization on top of this, it could introduce unnecessary complexity and may even affect the reliability of the results. Therefore, these relative scores can be used directly for GRA calculations without the need for extra standardization. Calculate the grey rational grade of the main indicators using Equation (21) as shown in Table 16.
Table 16.
Grey rational grade.
Grey relational degree results typically range from 0 to 1, where values closer to 1 indicate a higher degree of correlation, while values closer to 0 indicate a lower degree of correlation.
The ranking of grey relational degree between the main indicators and their corresponding secondary indicators is as follows: Visibility (0.956897729), Social Environment (0.908837832), Accessibility (0.841103607), Demand (0.560574557), Staff Training (0.549027811).
4. Discussion
In this section, we will discuss the ranking results of the indicators and provide corresponding suggestions for AED deployment. Additionally, we will explore the limitations of this study and potential directions for future research.
4.1. Discussion and Suggestions
The results of the FANP model ranking indicate that Staff Training emerged on top, confirming it as the most critical criterion. This conclusion suggests that when considering the optimal deployment of AEDs, the primary focus should be on the number of personnel in the area trained in out-of-hospital emergency skills and their training level. Additionally, the findings indicate that there is a need to improve the level of emergency skills training for a greater number of individuals to ensure the effective deployment of AEDs.
Following that, the main criteria ranked 2–4 are Accessibility, Demand, and Social Environment for AEDs. Therefore, when contemplating the optimal deployment of AEDs, it is imperative to prioritize accessibility of AEDs in various locations, followed by assessing the level of demand for AEDs in different locations, and lastly considering the social environment of the region, considering the influence of various aspects of the country’s situation on the deployment of AEDs in China.
The main criterion ranked last is Visibility, which refers to whether the surroundings of the AED deployment location are complex and whether the AED can be clearly seen. This criterion can be considered when resources are available.
In the sub-criteria ranking of the FANP model, the top three most important sub-criteria are as follows: the rate of CPR training among individuals in the area, the rate of AED training among individuals in the area, and the records of AED device usage within the area. These results indicate that when decision-makers consider AED deployment issues, they should first focus on the training rates of individuals in the area in CPR and AED device usage. Therefore, enhancing the training rate of non-medical personnel in the area is crucial as it will help citizens to promptly initiate rescue actions, thereby increasing the success rate of rescue efforts. Secondly, the records of AED device usage within the area are a key measure of the likelihood of incidents in the area, which is the current mainstream approach to AED deployment based on historical OHCA incidents. These three most important sub-criteria align with the direction of AED deployment considered in existing research, thereby confirming the validity of the current research direction.
The fourth to eighth important sub-criteria are as follows: the number of medical emergency response personnel in the area, the proportion of drone-type AEDs deployed, the proportion of on-demand AEDs deployed, the number of first aid volunteers in the area, and the distance of AED devices from potential users. Considering the considerations, it is evident that the deployment of AEDs necessitates a focus on a number of key points. Firstly, equip AED devices based on the number of medical personnel and first aid volunteers in the area. Secondly, increase the proportion of drone-type AEDs and on-demand AEDs appropriately. Moreover, the distance between devices and potential users should be considered, which aligns with the grid-based strategy commonly used in deploying AED devices in most current research.
The ninth to thirteenth important sub-criteria are as follows: community emergency response network and infrastructure, the proportion of patrol-type AEDs deployed, financial budget for emergency facilities in the area, the accessibility of AED devices to the road network, and signs placed around the AED. Therefore, we recommend placing emphasis on the development of community emergency response networks and infrastructure to establish a solid foundation for out-of-hospital emergency care. At the same time, there is a need for active government intervention and increased investment to enhance the financial budget for emergency facilities and improve the development of community emergency response networks. Additionally, signs should be placed around AED devices to help emergency responders quickly locate nearby AED devices and be prepared for OHCA incidents.
When dealing with the 13 sub-criteria ranked lower, it is recommended to consider them one by one based on the actual situation after meeting the requirements of the top 13 important sub-criteria. These subsequent sub-criteria include AEDs placed in high-traffic areas, ambulance dispatch strategy within the local healthcare system, the degree of obstruction of AED placement by surrounding buildings, accessibility requirements for AED placement, the density of large public places in the area, AEDs placed near emergency exits, local geographical conditions, the number of AEDs available within the area, the number of healthcare facilities in the area, the density of potential patients within the area, population density within the area, the rate of OHCA incidents in the area, and level of urbanization. Considering these sub-criteria one by one can ensure that the deployment and use of AED devices adhere to best practices and maximize the role of AED devices in the emergency response process. When considering these subsequent sub-criteria, it is recommended to comprehensively consider factors such as local medical resources, community characteristics, and the status of the emergency response system to develop a suitable AED deployment strategy for the area.
Given the above circumstances, this study recommends prioritizing the training of emergency personnel in the area as the primary consideration for optimizing AED deployment. Additionally, records of AED device usage within the area and types of AED devices are also key factors for optimizing AED deployment. Finally, in the FANP model, the main criterion and sub-criterion ranked last are Visibility and level of urbanization, respectively. This suggests that these criteria are relatively less important among the factors to consider in optimizing AED deployment.
This study uses the GRA to determine which improvements in secondary indicators have a more significant enhancing effect on the main indicators. In other words, if there is a targeted enhancement needed for a specific main indicator, the GRA scores can help identify which corresponding secondary indicator should be intervened upon. The higher the Grey Relational Degree score of a main indicator, the smaller the gap between its corresponding sub-indicators and the optimal solution. This indicates that to improve this main indicator, all corresponding secondary indicators need to be enhanced comprehensively. On the contrary, the lower the score of a main indicator, the larger the gap between its corresponding secondary indicators and the optimal solution. In such cases, improving the main indicator may only require strengthening the secondary indicator with the highest weight.
In the GRA model, the main indicator with the highest Grey Relational Degree ranking is “Visibility”, followed by “Social Environment”, “Accessibility”, “Demand”, and “Staff Training.” It has been confirmed that “Visibility” has the highest degree of association with its corresponding secondary indicators, indicating that to improve this main indicator, all corresponding secondary indicators need to be enhanced comprehensively. On the other hand, “Staff Training” has the lowest degree of association with its corresponding secondary indicators, suggesting that to enhance this main indicator, only the secondary indicator with the highest weight needs to be improved, which is the rate of CPR training among individuals in the area.
4.2. Research Limitations and Future Research Possibilities
This study employed a mixed research method combining FANP and GRA to enhance the accuracy and reliability of the analysis. During the development of the hierarchical and network structures, 14 out of 15 invited experts reached a consensus, indicating a significant agreement in the field. To ensure the validity of the comparisons regarding the importance of the indicators, this study utilized the Consistency Index (C.I.) and Consistency Ratio (C.R.) for verification. In the GRA model, all 15 experts provided detailed evaluations of the indicators and related plans. Although this study relies on expert opinions, which presents a limitation, we specifically invited experienced experts to complete the questionnaires to increase the credibility of the results.
To gain a more comprehensive and accurate understanding of the related issues in this field, the following suggestions can guide future research:
- Broaden the Range of Experts: Future studies could consider including experts from more diverse backgrounds and perspectives. This will help capture a wider range of opinions and strengthen overall consensus.
- Methodological Triangulation: Researchers might explore using additional methods beyond FANP and GRA. Qualitative methods, such as interviews or focus groups, can provide deeper insights into expert opinions and enrich the analysis.
- Conduct Longitudinal Studies: Carrying out longitudinal research can help researchers assess changes in expert opinions and the importance of indicators over time. This will provide valuable insights into the dynamics within the field.
- Validate Research Findings: Future research should consider validating findings through empirical testing or case studies. This will enhance the practical applicability of the results and further establish their credibility.
- Explore Additional Indicators: Future studies can investigate other indicators not covered in this research. This will improve the comprehensiveness of the analysis and may lead to new insights.
5. Conclusions
Based on expert recommendations, this study constructed a hierarchical structure for optimizing AED deployment indicators. Subsequently, the FANP model was utilized to calculate the total weights of each sub-criterion, and the weights of related sub-criteria were computed through weighted averaging to determine the weights of the main criteria. Finally, the GRA method was used to calculate the grey relational indices between the main criteria and sub-criteria.
In the FANP model, the primary factor with the highest weight ranking is personnel training, and the top five secondary factors in terms of weight ranking are as follows: the rate of CPR training among individuals in the area, the rate of AED training among individuals in the area, records of AED device usage within the area, the number of medical emergency response personnel in the area, the proportion of drone-type AEDs deployed, and the proportion of on-demand AEDs deployed (with equal weight ranking for the fifth and sixth factors). These top-weighted factors are crucial considerations for prioritizing the optimization deployment of AEDs.
In the GRA model, the primary indicators with high grey correlation to their corresponding secondary indicators are Visibility, Social Environment, and Accessibility. To improve these primary indicators, it is essential to enhance the associated secondary indicators comprehensively. The primary indicators with low grey correlation to their corresponding secondary indicators are Demand and Staff Training. To enhance the importance of the Demand indicator, simply increasing the weight of the highest-ranking secondary indicator, records of AED device usage within the area, is sufficient. Likewise, to enhance the importance of the Staff Training indicator, just increasing the weight of the highest-ranking secondary indicator, the rate of CPR training among individuals in the area, is required.
In conclusion, in the practical work of optimizing AED deployment in China, researchers can use the results of the FANP model from this study to determine the weights of each indicator. This helps identify which indicators should be prioritized in the deployment process. Additionally, the GRA results can clarify which secondary indicators need to be focused on to effectively improve a specific primary indicator. Based on this analysis, the efficiency and effectiveness of AED deployment in China can be enhanced, providing a scientific basis for relevant decisions and offering more targeted guidance for practical applications. The research findings not only provide a reference for the optimization deployment of AEDs in China but also offer a feasible method for optimizing the deployment of related public medical facilities. These discoveries will contribute to enhancing the efficiency of emergency rescue operations, ultimately saving more lives.
Author Contributions
Conceptualization, J.D. and Y.D.; methodology, J.D.; software, Y.L.; validation, Y.Z.; investigation, Y.D. and Y.Z.; resources, J.D.; writing—original draft preparation, J.D.; writing—review and editing, Y.D.; visualization, Y.Z.; project administration, D.W. All authors have read and agreed to the published version of the manuscript.
Funding
This research received no external funding.
Data Availability Statement
The original contributions presented in the study are included in the article. Further inquiries can be directed to the corresponding author/s.
Acknowledgments
The authors wish to thank the five experts who participated in the expert interviews to help determine the indicators, the 15 experts who participated in filling out the questionnaires during the research process, including 6 medical experts, 4 emergency training specialists, 2 medical equipment experts, and 3 public health specialists, for supporting this research.
Conflicts of Interest
The authors declare no conflicts of interest.
References
- The Writing Committee of the Report on Cardiac Arrest and Cardiopulmonary Resuscitation in China. Report on Cardiac Arrest and Cardiopulmonary Resuscitation in China (2022) Summary. Chin. Circ. J. 2023, 10, 1005–1017. [Google Scholar]
- Powers, W.J.; Derdeyn, C.P.; Biller, J.; Coffey, C.S.; Hoh, B.L.; Jauch, E.C.; Meschia, J.F. AHA/ASA Guideline. Stroke 2015, 46, 3020–3035. [Google Scholar] [CrossRef] [PubMed]
- Simmons, K.M.; McIsaac, S.M.; Ohle, R. Impact of community-based interventions on out-of-hospital cardiac arrest outcomes: A systematic review and meta-analysis. Sci. Rep. 2023, 13, 10231. [Google Scholar] [CrossRef] [PubMed]
- Nishiyama, C.; Kiguchi, T.; Okubo, M.; Alihodžić, H.; Al-Araji, R.; Baldi, E.; Beganton, F.; Booth, S.; Bray, J.; Christensen, E.; et al. Three-year trends in out-of-hospital cardiac arrest across the world: Second report from the International Liaison Committee on Resuscitation (ILCOR). Resuscitation 2023, 186, 109757. [Google Scholar] [CrossRef]
- Ishii, M.; Tsujita, K.; Seki, T.; Okada, M.; Kubota, K.; Matsushita, K.; Kaikita, K.; Yonemoto, N.; Tahara, Y.; Ikeda, T. Sex-and age-based disparities in public access defibrillation, bystander cardiopulmonary resuscitation, and neurological outcome in cardiac arrest. JAMA Netw. Open 2023, 6, e2321783. [Google Scholar] [CrossRef]
- Pourghaderi, A.R.; Kogtikov, N.; Lees, M.H.; Cai, W.; Pek, P.P.; Ho, A.F.W.; Ng, W.M.; Kwak, J.; White, A.E.; Lim, S.L.; et al. Maximum expected survival rate model for public access defibrillator placement. Resuscitation 2022, 170, 213–221. [Google Scholar] [CrossRef]
- Riva, G.; Hollenberg, J. Different forms of bystander cardiopulmonary resuscitation in out-of-hospital cardiac arrest. Intern. Med. 2021, 290, 57–72. [Google Scholar] [CrossRef]
- Gnesin, F.; Møller, A.L.; Mills, E.H.A.; Zylyftari, N.; Jensen, B.; Bøggild, H.; Ringgren, K.B.; Blomberg, S.N.; Christensen, H.C.; Kragholm, K.; et al. Rapid dispatch for out-of-hospital cardiac arrest is associated with improved survival. Resuscitation 2021, 163, 176–183. [Google Scholar] [CrossRef]
- Ringh, M.; Hollenberg, J.; Palsgaard-Moeller, T.; Svensson, L.; Rosenqvist, M.; Lippert, F.K.; Wissenberg, M.; Malta Hansen, C.; Claesson, A.; Viereck, S.; et al. The challenges and possibilities of public access defibrillation. J. Intern. Med. 2018, 283, 238–256. [Google Scholar] [CrossRef]
- Tsukigase, K.; Tanaka, H.; Takyu, H. Mismatch between sites of incidence of out-of-hospital cardiac arrest and locations of installed automated external defibrillator in the Tokyo metropolitan area. World J. Cardiovasc. Dis. 2017, 7, 185–194. [Google Scholar] [CrossRef]
- Chen, G.; Widener, M.J.; Zhu, M.; Wang, C.C. Identification of priority areas for public-access automated external defibrillators (AEDs) in metropolitan areas: A case study in Hangzhou, China. Appl. Geogr. 2023, 154, 102922. [Google Scholar] [CrossRef]
- Gessman, L.J.; Schacknow, P.N.; Brindis, R.G. Sudden Cardiac Death at Home: Potential Lives Saved with Fully Automated External Defibrillators. Ann. Emerg. Med. 2024, 83, 35–41. [Google Scholar] [CrossRef] [PubMed]
- Arabloo, J.; Ahmadizadeh, E.; Rezapour, A.; Ehsanzadeh, S.J.; Alipour, V.; Peighambari, M.M.; Asiabar, A.S.; Souresrafil, A. Economic evaluation of automated external defibrillator deployment in public settings for out-of-hospital cardiac arrest: A systematic review. Expert Rev. Med. Devices, 2024; just-accepted. [Google Scholar] [CrossRef]
- Lim, Z.J.; Reddy, M.P.; Afroz, A.; Billah, B.; Shekar, K.; Subramaniam, A. Incidence and outcome of out-of-hospital cardiac arrests in the COVID-19 era: A systematic review and meta-analysis. Resuscitation 2020, 157, 248–258. [Google Scholar] [CrossRef] [PubMed]
- Berdowski, J.; Blom, M.T.; Bardai, A.; Tan, H.L.; Tijssen, J.G.; Koster, R.W. Impact of onsite or dispatched automated external defibrillator use on survival after out-of-hospital cardiac arrest. Circulation 2011, 124, 2225–2232. [Google Scholar] [CrossRef] [PubMed]
- McNally, B.; Robb, R.; Mehta, M.; Vellano, K.; Valderrama, A.L.; Yoon, P.W.; Sasson, C.; Crouch, A.; Perez, A.B.; Merritt, R.; et al. Out-of-hospital cardiac arrest surveillance—Cardiac Arrest Registry to Enhance Survival (CARES), United States, October 1, 2005-December 31, 2010. MMWR Surveill. Summ. 2011, 60, 1–19. [Google Scholar]
- Hogan, H.; Hutchings, A.; Wulff, J.; Carver, C.; Holdsworth, E.; Nolan, J.; Welch, J.; Harrison, D.; Black, N. Type of Track and Trigger system and incidence of in-hospital cardiac arrest: An observational registry-based study. BMC Health Serv. Res. 2020, 20, 885. [Google Scholar] [CrossRef]
- Cram, P.; Vijan, S.; Fendrick, A.M. Cost-effectiveness of automated external defibrillator deployment in selected public locations. J. Gen. Intern. Med. 2003, 18, 745–754. [Google Scholar] [CrossRef]
- Pijls, R.W.M.; Nelemans, P.J.; Rahel, B.M.; Gorgels, A.P.M. Circumstances and causes of sudden circulatory arrests in the Dutch province of Limburg and the involvement of citizen rescuers. Neth. Heart J. 2018, 26, 41–48. [Google Scholar] [CrossRef]
- Karlsson, L.; Malta Hansen, C.; Wissenberg, M.; Moller Hansen, S.; Lippert, F.K.; Rajan, S.; Kragholm, K.; Møller, S.G.; Søndergaard, K.B.; Gislason, G.H.; et al. Automated external defibrillator accessibility is crucial for bystander defibrillation and survival: A registry-based study. Resuscitation 2019, 136, 30–37. [Google Scholar] [CrossRef]
- Rea, T.D.; Olsufka, M.; Bemis, B.; White, L.; Yin, L.; Becker, L.; Copass, M.; Eisenberg, M.; Cobb, L. A population-based investigation of public access defibrillation: Role of emergency medical services care. Resuscitation 2010, 81, 163–167. [Google Scholar] [CrossRef] [PubMed]
- Tsai, Y.-S.; Ko, P.C.-I.; Huang, C.-Y.; Wen, T.-H. Optimizing locations for the installation of automated external defibrillators (AEDs) in urban public streets through the use of spatial and temporal weighting schemes. Appl. Geogr. 2012, 35, 394–404. [Google Scholar] [CrossRef]
- Folke, F.; Lippert, F.K.; Nielsen, S.L.; Gislason, G.H.; Hansen, M.L.; Schramm, T.K.; Sørensen, R.; Fosbøl, E.L.; Andersen, S.S.; Rasmussen, S.; et al. Location of cardiac arrest in a city center: Strategic placement of automated external defibrillators in public locations. Circulation 2009, 120, 510–517. [Google Scholar] [CrossRef] [PubMed]
- Tierney, N.J.; Reinhold, H.J.; Mira, A.; Weiser, M.; Burkart, R.; Benvenuti, C.; Auricchio, A. Novel relocation methods for automatic external defibrillator improve out-of-hospital cardiac arrest coverage under limited resources. Resuscitation 2018, 125, 83–89. [Google Scholar] [CrossRef] [PubMed]
- Fan, M.; Fan, K.L.; Leung, L.P. Walking route–based calculation is recommended for optimizing deployment of publicly accessible defibrillators in urban cities. J. Am. Heart Assoc. 2020, 9, e014398. [Google Scholar] [CrossRef] [PubMed]
- Liang, L.D.; Chan, T.C.; Leung, K.B.; Scheuermeyer, F.; Chakrabarti, S.; Andelius, L.; Deakin, J.; Heidet, M.; Fordyce, C.B.; Helmer, J.; et al. Utilization and cost-effectiveness of school and community center AED deployment models in Canadian cities. Resuscitation 2022, 172, 194–200. [Google Scholar] [CrossRef]
- Portner, M.E.; Pollack, M.L.; Schirk, S.K.; Schlenker, M.K. Out-of-hospital cardiac arrest locations in a rural community: Where should we place AEDs? Prehosp. Disaster Med. 2004, 19, 352–355. [Google Scholar] [CrossRef]
- Yasunaga, H.; Miyata, H.; Horiguchi, H.; Tanabe, S.; Akahane, M.; Ogawa, T.; Koike, S.; Imamura, T. Population density, call-response interval, and survival of out-of-hospital cardiac arrest. Int. J. Health Geogr. 2011, 10, 26. [Google Scholar] [CrossRef]
- Chan, T.C.; Li, H.; Lebovic, G.; Tang, S.K.; Chan, J.Y.; Cheng, H.C.; Brooks, S.C. Identifying locations for public access defibrillators using mathematical optimization. Circulation 2013, 127, 1801–1809. [Google Scholar] [CrossRef]
- Chan, T.C.; Demirtas, D.; Kwon, R.H. Optimizing the deployment of public access defibrillators. Manag. Sci. 2016, 62, 3617–3635. [Google Scholar] [CrossRef]
- Lin, C.H.; Chu, K.C.; Lee, J.T.; Kao, C.Y. Optimal deployment of automated external defibrillators in a long and narrow environment. PLoS ONE 2023, 18, e0264098. [Google Scholar] [CrossRef] [PubMed]
- Sun, C.L.; Karlsson, L.; Torp-Pedersen, C.; Morrison, L.J.; Folke, F.; Chan, T.C. Spatiotemporal AED optimization is generalizable. Resuscitation 2018, 131, 101–107. [Google Scholar] [CrossRef] [PubMed]
- Sun, C.L.; Demirtas, D.; Brooks, S.C.; Morrison, L.J.; Chan, T.C. Overcoming spatial and temporal barriers to public access defibrillators via optimization. J. Am. Coll. Cardiol. 2016, 68, 836–845. [Google Scholar] [CrossRef] [PubMed]
- Lupo, T. A Fuzzy Framework to Evaluate Service Quality in the Healthcare Industry: An Empirical Case of Public Hospital Service Evaluation in Sicily. Appl. Soft Comput. 2016, 40, 468–478. [Google Scholar] [CrossRef]
- Chang, S.C.; Tsai, P.H.; Chang, S.C. A Hybrid Fuzzy Model for Selecting and Evaluating the E-Book Business Model: A Case Study on Taiwan e-Book Firms. Appl. Soft Comput. 2015, 34, 194–204. [Google Scholar] [CrossRef]
- Ozdemir, Y.; Basligil, H. Aircraft Selection Using Fuzzy ANP and the Generalized Choquet Integral Method: The Turkish Airlines Case. J. Intell. Fuzzy Syst. 2016, 31, 589–600. [Google Scholar] [CrossRef]
- Kahraman, C.; Ertay, T.; Büyüközkan, G. A Fuzzy Optimization Model for QFD Planning Process Using Analytic Network Approach. Eur. J. Oper. Res. 2006, 171, 390–411. [Google Scholar] [CrossRef]
- Kargari, M. Ranking of Performance Assessment Measures at Tehran Hotel by Combining DEMATEL, ANP, and SERVQUAL Models under Fuzzy Condition. Math. Probl. Eng. 2018, 2018, 5701923. [Google Scholar] [CrossRef]
- Wicher, P.; Zapletal, F.; Lenort, R. Sustainability Performance Assessment of Industrial Corporation Using Fuzzy Analytic Network Process. J. Clean. Prod. 2019, 241, 118132. [Google Scholar] [CrossRef]
- Deng, J.L. Control Problems of Grey Systems. Syst. Control Lett. 1982, 1, 288–294. [Google Scholar]
- Deng, J.L. Introduction to Grey System. J. Grey Syst. 1989, 1, 1–24. [Google Scholar]
- Liu, C.-H.; Chen, S.-H.; Hu, Y.-F.; Wu, M.-C.; Lin, C.-C. Strategies on locations of public access defibrillator: A systematic review. Am. J. Emerg. Med. 2021, 47, 52–57. [Google Scholar] [CrossRef] [PubMed]
- Kobayashi, D.; Noguchi, T.; Kondo, Y.; Kitamura, T.; Nishiyama, C.; Kiyohara, K.; Iwami, T.; Kiguchi, T.; Shimamoto, T. Public location and survival from out-of-hospital cardiac arrest in the public-access defibrillation era in Japan. J. Cardiol. 2020, 75, 97–104. [Google Scholar] [CrossRef] [PubMed]
- Hajari, H.; Smith, C.M.; Colquhoun, M.C.; Samuels, M. Simulating public buses as a mobile platform for deployment of publicly accessible automated external defibrillators. Prehosp. Emerg. Care 2020, 24, 238–244. [Google Scholar] [CrossRef]
- Smith, C.M.; Colquhoun, M.C.; Samuels, M.; Chamberlain, D. New signs to encourage the use of automated external defibrillators by the lay public. Resuscitation 2017, 114, 100–105. [Google Scholar] [CrossRef]
- Merchant, R.M.; Topjian, A.A.; Panchal, A.R.; Cheng, A.; Aziz, K.; Berg, K.M.; Lavonas, E.J. Adult Basic and Advanced Life Support, and Pediatric Basic and Advanced Life Support: 2020 American Heart Association Guidelines for Cardiopulmonary Resuscitation and Emergency Cardiovascular Care. Circulation 2020, 142, S337–S357. [Google Scholar] [CrossRef]
- Soar, J.; Berg, K.M.; Andersen, L.W.; Böttiger, B.W.; Cacciola, S.; Callaway, C.W. Adult advanced life support: 2020 international consensus on cardiopulmonary resuscitation and emergency cardiovascular care science with treatment recommendations. Resuscitation 2020, 156, A80–A119. [Google Scholar] [CrossRef]
- Matinrad, N.; Granberg, T.A. Optimal pre-dispatch task assignment of volunteers in daily emergency response. Socio-Econ. Plann. Sci. 2023, 87, 101589. [Google Scholar] [CrossRef]
- Darko, A.; Chan, A.; Ameyaw, E.; Owusu, E.; Pärn, E.; Edwards, D. Review of Application of Analytic Hierarchy Process (AHP) in Construction. Int. J. Constr. Manag. 2018, 19, 436–452. [Google Scholar] [CrossRef]
- Pan, W.; Dainty, A.R.J.; Gibb, A.G.F. Establishing and Weighting Decision Criteria for Building System Selection in Housing Construction. J. Constr. Eng. Manag. 2012, 138, 1239–1250. [Google Scholar] [CrossRef]
- Akadiri, P.O.; Olomolaiye, P.O.; Chinyio, E.A. Multi-Criteria Evaluation Model for the Selection of Sustainable Materials for Building Projects. Autom. Constr. 2013, 30, 113–125. [Google Scholar] [CrossRef]
- Chou, J.; Pham, A.; Wang, H. Bidding Strategy to Support Decision-Making by Integrating Fuzzy AHP and Regression-Based Simulation. Autom. Constr. 2013, 35, 517–527. [Google Scholar] [CrossRef]
- Herrera, F.; Herrera-Viedma, E. Linguistic Decision Analysis: Steps for Solving Decision Problems under Linguistic Information. Fuzzy Sets Syst. 2000, 115, 67–82. [Google Scholar] [CrossRef]
- Zimmermann, H. Fuzzy Set Theory—And Its Applications, 2nd ed.; Kluwer Academic: Dordrecht, The Netherlands, 1992. [Google Scholar]
- Zadeh, L.A. The Concept of a Linguistic Variable and Its Application to Approximate Reasoning-I. Inf. Sci. 1975, 8, 199–249. [Google Scholar] [CrossRef]
- Wan, J.; Lin, C.L. Research on the service quality index and alternatives evaluation and ranking for online Yue Kiln Celadon Art Education in post COVID-19 era. Mathematics 2023, 11, 1339. [Google Scholar] [CrossRef]
- Pedrycz, W. Why triangular membership functions? Fuzzy Sets Syst. 1994, 64, 21–30. [Google Scholar] [CrossRef]
Disclaimer/Publisher’s Note: The statements, opinions and data contained in all publications are solely those of the individual author(s) and contributor(s) and not of MDPI and/or the editor(s). MDPI and/or the editor(s) disclaim responsibility for any injury to people or property resulting from any ideas, methods, instructions or products referred to in the content. |
© 2024 by the authors. Licensee MDPI, Basel, Switzerland. This article is an open access article distributed under the terms and conditions of the Creative Commons Attribution (CC BY) license (https://creativecommons.org/licenses/by/4.0/).