Article

Mathematical and Statistical Analysis of Fused Filament Fabrication Parameters for Thermoplastic Polyurethane Parts via Response Surface Methodology

1
Department of Mechanical Engineering, College of Engineering, University of Ha’il, Ha’il City 81451, Saudi Arabia
2
Air Conditioning Engineering Department, College of Engineering, University of Warith Al-Anbiyaa, Karbala 56001, Iraq
3
Department of Petroleum Engineering, Al-Amarah University College, Maysan 62001, Iraq
4
Department of Mechanical Engineering, Esfarayen University of Technology, Esfarayen 96619-98195, Iran
5
Faculty of Arts, Science and Technology, University of Northampton, Northampton NN1 5PH, UK
*
Authors to whom correspondence should be addressed.
Mathematics 2024, 12(19), 3146; https://doi.org/10.3390/math12193146
Submission received: 10 September 2024 / Revised: 3 October 2024 / Accepted: 4 October 2024 / Published: 8 October 2024
(This article belongs to the Special Issue Mathematical Applications in Industrial Engineering)

Abstract

:
This work aims to analyze the effects of the main process parameters of fused filament fabrication (FFF) on the mechanical properties and part weight of 3D-printed thermoplastic polyurethane (TPU). Raster angle (RA), infill percentage (IP), and extruder temperature (FFF) in the ranges of 0–90°, 15–55%, and 220–260 °C, respectively, were considered as the FFF input parameters, and output variables part weight (PW), elongation at break (E), maximum failure load (MFL), ratio of the maximum failure load to part weight (Ratio), and build time (BT) were considered as responses. The Response Surface Methodology (RSM) and Design of Experiments (DOE) were applied in the analysis. Subsequently, the RSM approach was performed through multi-response optimizations with the help of Design-Expert software. The experimental results indicated a higher maximum failure load is achieved with an increased raster angle and decreased extruder temperature. ANOVA results show that ET has the most significant effect on elongation at break, with elongation at break decreasing as ET increases. The raster angle does not significantly affect the part weight of the TPU samples. The ratio of the maximum failure load to part weight of samples decreases with an increase in IP and ET. The results also indicated that the part weight and build time of FFF-printed TPU samples increase with an increase in IP. An ET of 220 °C, RA of 0°, and IP of 15% are the optimal combination of input variables for achieving the minimal part weight; minimal build time; and maximum elongation at break, maximum failure load, and ratio of the maximum failure load to part weight.

1. Introduction

Additive manufacturing (AM), commonly known as 3D printing, produces three-dimensional parts layer by layer from a digital model. In recent years, AM has advanced rapidly, impacting sectors such as manufacturing, aerospace, and healthcare and enabling the development of complex and customized designs [1,2,3,4,5]. Among the various AM techniques, fused filament fabrication (FFF) is widely utilized due to its flexibility, affordability, and broad industrial applications [6,7,8,9]. The FFF method employs a range of thermoplastic filaments, including ABS (acrylonitrile butadiene styrene) [10], PEEK (polyether ether ketone) [11], PC (polycarbonate) [12], PETG (polyethylene terephthalate glycol) [13], TPU (thermoplastic polyurethane) [14], PVA (polyvinyl alcohol) [15], and PLA (polylactic acid) [16,17,18,19].
The effect of FFF factors (including printing speed (PS), layer thickness (LT), extruder temperature (ET), raster angle (RA), bed temperature (BT), infill percentage (IP), flow rate (FR), and infill pattern (P)) on the mechanical behavior, surface finish, dimensional accuracy, and overall performance of various thermoplastics has been reported in several studies [20,21,22,23,24,25,26,27,28]. Afshari et al. [29] used a Response Surface Methodology (RSM) approach to analyze the impact of various FFF parameters (i.e., BT, IP, LT) on the tensile strength and flexural strength of PLA samples fabricated by FFF. Their results revealed that FFF parameters affect the mechanical properties of the PLA samples. Johar et al. [30] evaluated the effect of various platform temperatures (60–80 °C) on the dimensional accuracy of 3D-printed PLA samples. They concluded that decreasing the platform temperatures can raise the amount of shrinkage and deformation angles. Using the Taguchi method, the researchers evaluated the influence of LT, IP, and PS on the hardness and strength of PLA parts [31]. The study revealed that the most significant factors affecting mechanical properties were printing speed and layer thickness. Ambade et al. [32] optimized FFF process parameters using RSM methodology and investigated the effect of ET, LT, IP, and RA on the tensile strength of the PLA 3D parts. Their study revealed that optimizing these FFF process parameters significantly improved the tensile strength of the printed parts. Kutnjak-Mravlinčić et al. [33] used an RSM approach to optimize the FFF process factors of ABS parts produced by FFF. They found that a layer thickness of 0.1 mm, an infill percentage of 40%, and a linear pattern were the optimal conditions for achieving the highest mechanical properties. Kechagias [34] optimized FFF process parameters using Taguchi design and investigated the effect of ET, BT, IP, LT, and RA on the flexural strength of ABS 3D parts. They found that IP and RA had the greatest effect on flexural strength.
Thermoplastic polyurethane (TPU) filament is widely used due to its properties, including elasticity, transparency, impact strength, chemical resistance, radiation resistance, weather resistance, abrasion, and scratch resistance [35,36]. These characteristics make TPU a versatile material employed across various industries [37]. Rahmatabadi et al. [38] analyzed the influence of the shell, infill density (IP), and nozzle temperature on memory properties (i.e., applied stress, recovery stress, shape fixity, and shape recovery) of PLA-TPU 3D-printed samples using the RSM method. Their study revealed that the infill density had the most significant impact on shape memory properties. Ursini et al. [39] evaluated the mechanical properties of cellular structures made from TPU and printed using FFF. The results show that the thin-walled cell structures were less affected by the layering factor, whereas thicker-walled structures exhibited adverse effects. Hasdiansah et al. [40] used the Taguchi approach to analyze the influence of FFF process parameters, including LT, NT, PS, and FR, on the surface roughness of the 3D-printed TPU samples. They observed that layer thickness, with a contribution of 65.11%, had the most significant effect on the surface roughness of the samples. Dixit and Jain [41] examined the impact of chemical processing on the dimensional accuracy, surface roughness, and mechanical properties of 3D-printed TPU parts. Their results show that TPU parts treated with dimethyl sulfoxide exhibited better mechanical properties and surface quality than those treated with dimethyl formamide. Zolfaghari et al. [42] analyzed the influence of the recovery temperature, IP, LT, RA, on the memory properties (fixity ratio and recovery ratio) of 4D-printed PLA-TPU using the RSM method.
This literature review reveals that limited research has focused on the statistical modeling and optimization of FFF process parameters for TPU parts. For practical industrial applications, further studies are necessary to better understand the effects of FFF parameters on the mechanical properties of TPU parts and to optimize these parameters for improved performance. Based on this literature review, it is evident that the effects of three key parameters—infill percentage (IP), raster angle (RA), and extruder temperature (ET)—on the mechanical properties of TPU and the optimization of these parameters have been less explored. Therefore, this article examines the influence of process factors, namely component raster angle (variation range: 0 to 90°), infill percentage (variation range: 15 to 55%), and extruder temperature (variation range: 220 to 260 °C), on the part weight, elongation at break, maximum failure load, ratio of the maximum failure load to part weight, and build time of FFF-TPU 3D printing. This study utilized Response Surface Methodology (RSM) and ANOVA to analyze these. Subsequently, the RSM approach was used to perform multi-response optimizations with the help of Design-Expert (State-Ease, version 11) software.

2. Materials and Experiments

2.1. Design of Experiments (DOE)

The Design of Experiments (DOE) in Response Surface Methodology (RSM) analysis entails systematically altering input components using a selected experimental design. DOE contributes to creating a mathematical model that illustrates the link between causes and responses by performing several experiments and recording responses [43,44,45,46]. The identification of ideal circumstances is guided by this model, which is usually a quadratic equation. Critical processes include factor selection, experimental design selection, order randomization, response surface model fitting, response optimization, and repeat trials for confirming model correctness [47,48,49,50]. In RSM investigations, DOE simplifies the factor-level research and optimization process. In this article, the RSM approach was used to investigate the effect of FFF parameters on the mechanical characteristics of 3D-printed thermoplastic polyurethane (TPU) with the help of Design-Expert software (State-Ease, version 11, Minneapolis, MN, USA). The influence of the main parameters of the FFF machine on the mechanical properties (elongation at break (E) and maximum failure load (MFL)), part weight (PW), ratio of the maximum failure load to part weight (Ratio), and build time (BT) of FFF-printed TPU objects was evaluated. These FFF parameters were extruder temperature (ET), raster angle (RA), and infill percentage (IP). The variation ranges of the FFF parameters were 220–260 °C for ET, 0–90° for RA, and 15–55% for IP. Table 1 presents the FFF parameters for 3D printing at the design level. According to the FFF parameters of this research and their levels (Table 1), Table 2 presents the arrangement of the FFF parameters for 17 FFF experiments.

2.2. Material and Part Fabrication

For this article, the material used was thermoplastic polyurethane (TPU) (from 3DFILAPRINT company). TPU is a common thermoplastic filament used in FFF machines due to its elastic, durable, and flexible qualities. It is ideal for creating flexible and long-lasting products, such as phone covers, shoe insoles, and medical models, as it can bend without breaking. Table 3 lists the mechanical characteristics of TPU that are cited in this study. The FFF 3D printing process was conducted using the Ultimaker cure 3D printer (Ultimaker, Utrecht, The Netherlands), which has a printing capacity of 330 mm × 240 mm × 300 mm. Figure 1a shows the pictorial representation of the FFF 3D printing process. Figure 1b depicts the schematic of the types of RAs. The raster angle refers to the orientation of the deposited material layers relative to the build platform. For instance, a raster angle of 45 degrees was used, indicating that all sediment layers were printed at this angle. The FFF-printed TPU specimen design was performed using SolidWorks version 2022 software, adhering to ASTM D638 type IV. The width of the end tabs is 19 mm, while the center width narrows to 6 mm, giving the tabs a unique design (see Figure 2). Throughout the design, the 4 mm thickness of the material is kept constant. Based on Table 2, seventeen FFF tests were conducted. During the printing of the samples, the layer thickness was 0.1 mm, the printing speed was 50 mm/s, and the filament diameter was 1.75 mm.

2.3. Characterization Methods

After the FFF process, an OHAUS GALAXY 110 weighing machine was used in a controlled laboratory setting to carefully weigh the seventeen 3D-printed samples. Then, a universal testing machine (UTM) from the Instron brand of testing equipment was used to analyze the tensile behavior. The tensile testing of FFF-TPU samples was performed at a speed of 1 mm/min.

3. Results and Discussion

3.1. Maximum Failure Load Model

The RSM method generally suggests different response models, such as linear, two-factor interaction, quadratic, and cubic polynomials. As shown in Table 4, the Design Expert software recommended a quadratic model for predicting maximum failure load. ANOVA tables are used to investigate how various factors affect the response. In general, model terms are considered significant when p-values are less than 0.05 (a 95% confidence level). According to Table 4, the p-value of the model is less than 0.05 (0.0012) (i.e., confidence level 95%), which shows that the model is effective. We can see that the IP (C), RA (B), ET (A), RA2 (B2), and ET2 (A2) are statistically significant for the maximum failure load, in which the p-value is less than 0.05. The interactions IP × ET, ET × RA, and RA × IP are not significant because the p-value for each interaction is greater than 0.05, indicating that these interactions do not have a statistically significant effect on the maximum failure load. The model’s R2 and Adjusted R2 values were calculated as 0.9454 and 0.8752, respectively. These values indicate that the regression model for maximum failure load has a good fit, demonstrating a suitable correlation between the predicted and experimental results. The p-value for the LOF (lack-of-fit) term is greater than 0.05 (0.7199), indicating that the LOF is not statistically significant, which is essential for achieving an appropriate model. The final regression model for maximum failure load, in terms of the real factors, is shown in Equation (1). Table 4 depicts that the extruder temperature (LT, °C) has the statistically most significant impact on the maximum failure load, followed by raster angle (RA, degree) and infill percentage (IP, %); their F-values are 67.06, 18.06, and 0.4652, respectively.
( M a x i m u m   f a i l u r e   l o a d ) 3 = 4.7319 × 10 9 3.75793 × 10 7     E T   + 1.69021 × 10 6     R A + 3.53018 × 10 6     I P 12726.9     E T     R A 6866.88     E T     I P + 4718.96     R A     I P + 75343.9     E T 2   + 19389.4     R A 2   32549.1   I P 2
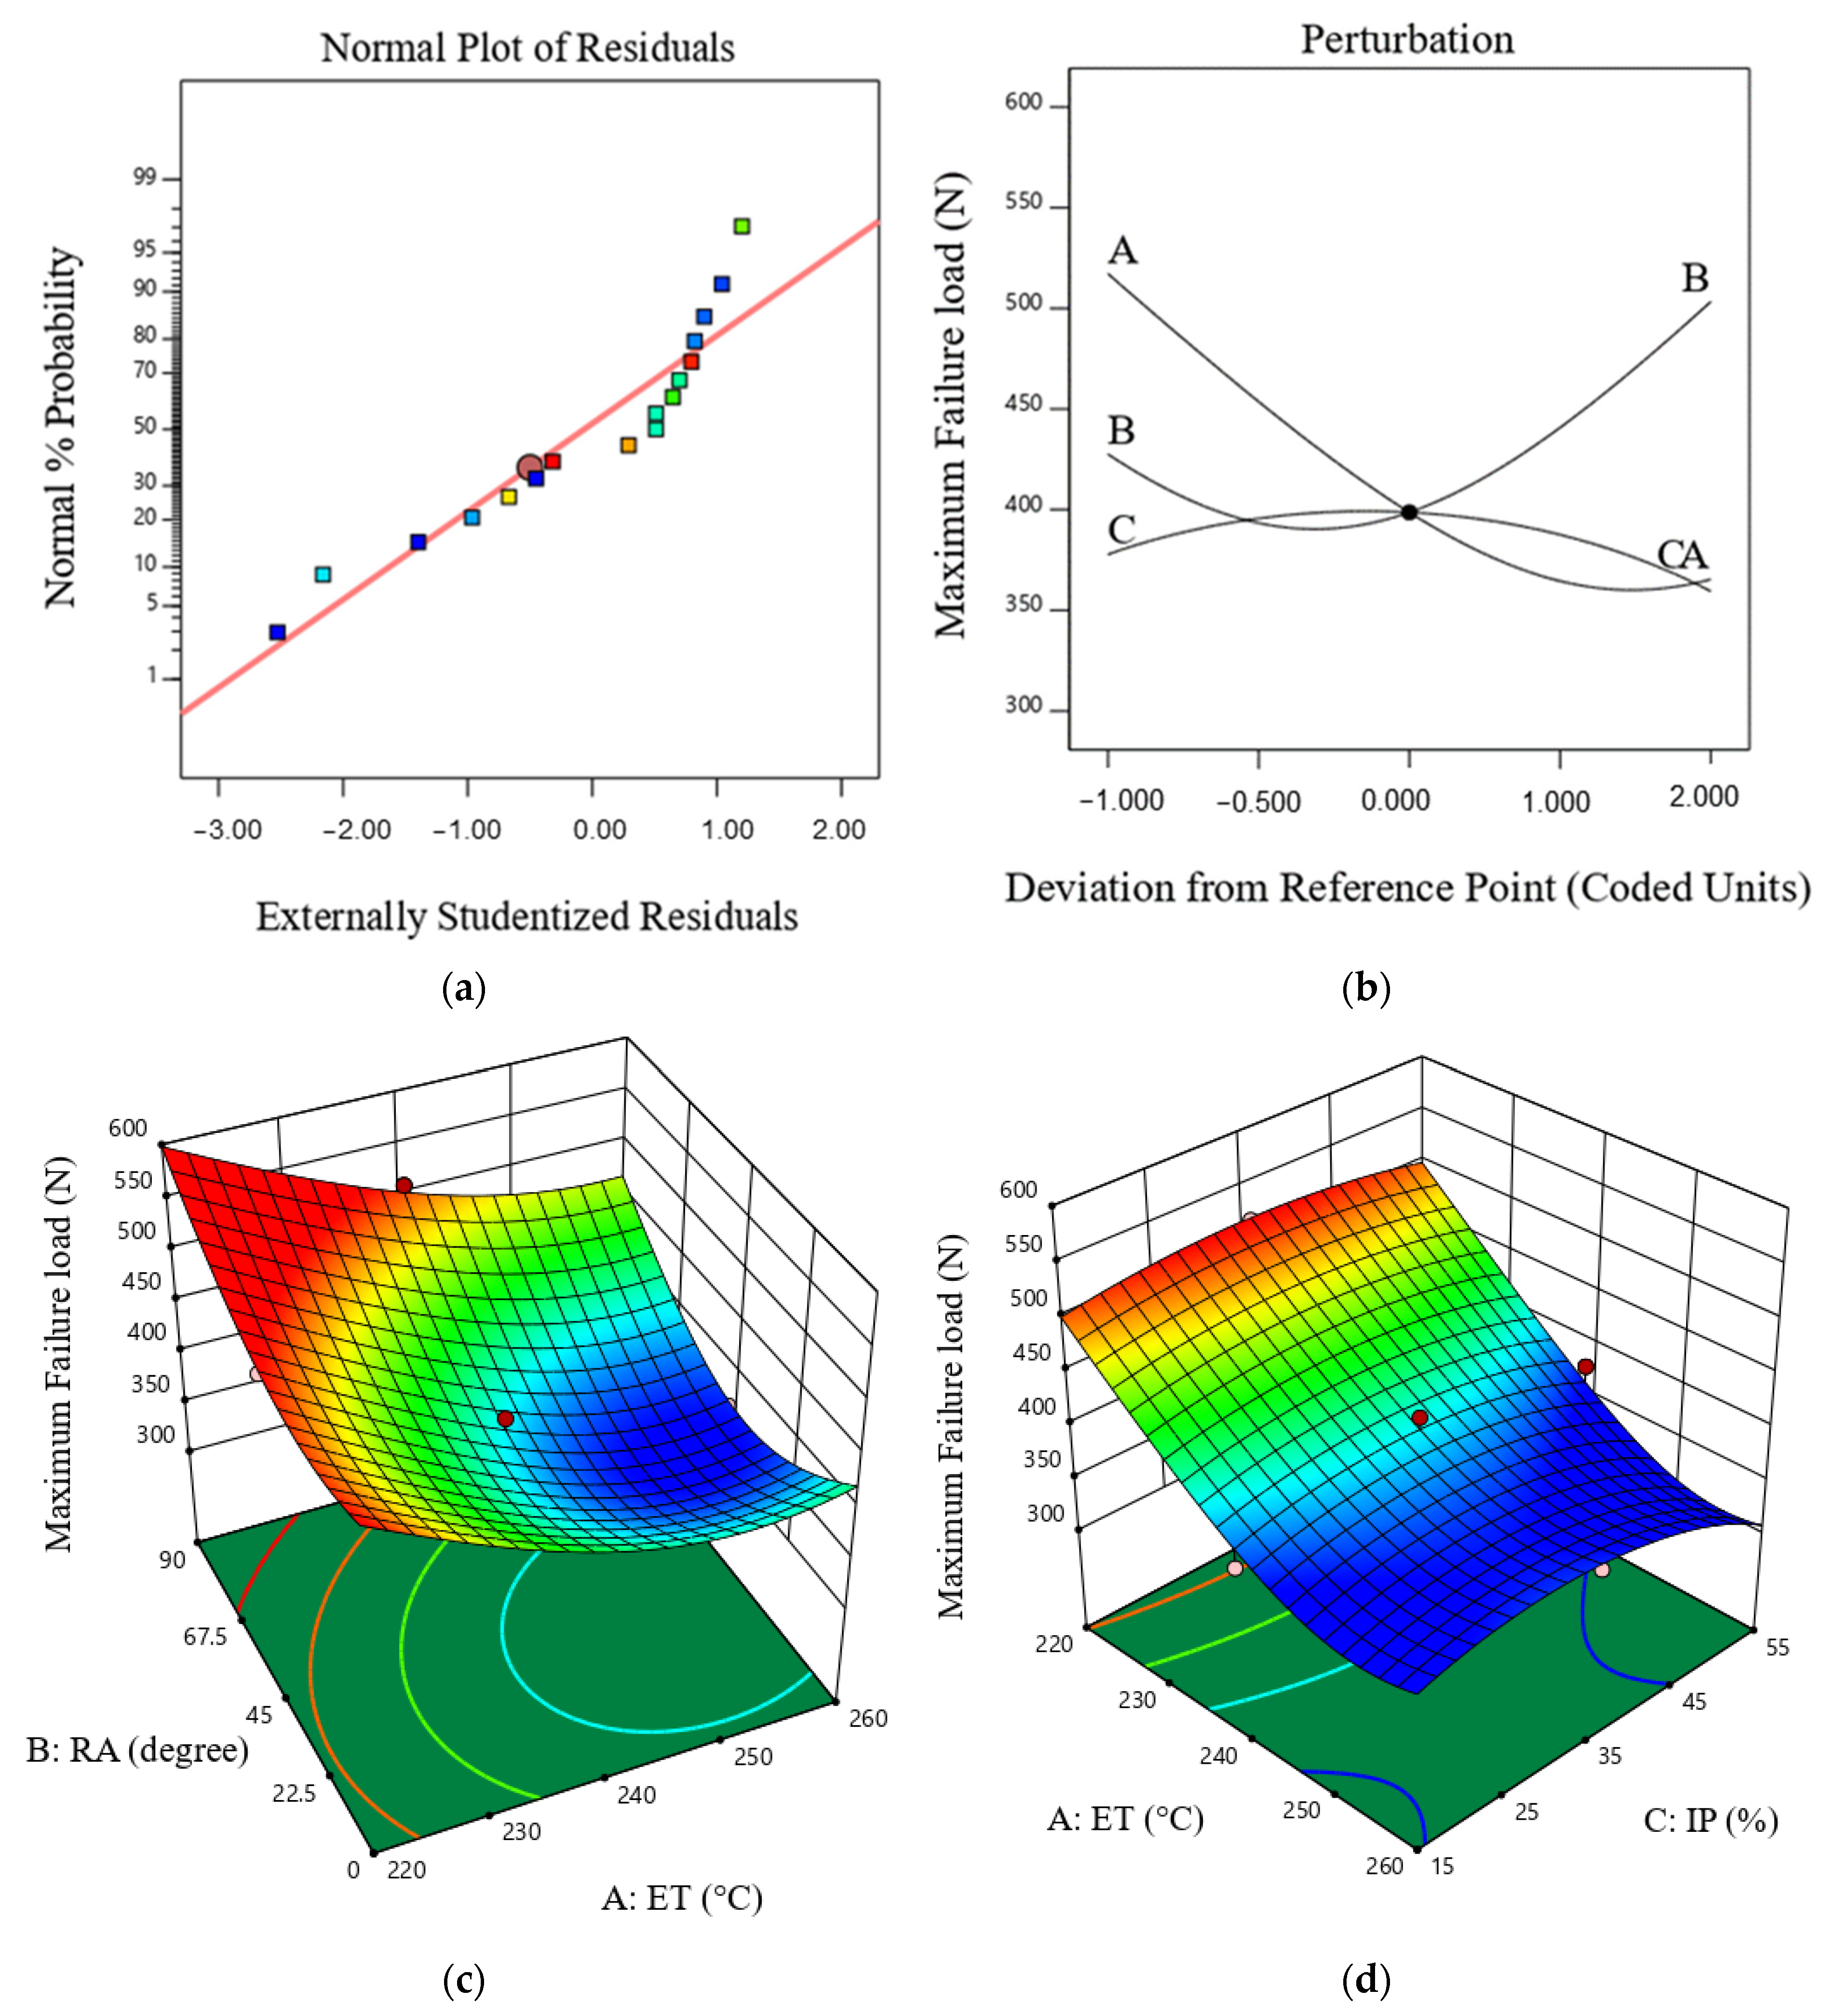
Figure 3a, the normal plot of residuals for maximum failure load of TPU samples, depicts the normal percentage probability against the externally studentized residuals for maximum failure load. This figure shows that the residuals generally align with the mean line. Typically, the distribution of residuals around a straight line should be random without exhibiting an S-shaped trend. However, the pronounced S-shape in this plot suggests a reduction in accuracy. The transition of points from blue to red represents maximum failure load values ranging from the lowest to the highest. This result confirms that the maximum failure load values around the red line exhibit no discernible trend and are randomly distributed.
The perturbation graph depicts the individual influence of input variables on the maximum failure load (see Figure 3b). From Figure 3b, it can be observed that extruder temperature (Line A) has a steep curvature, followed by raster angle (Line B) and infill percentage (Line C). It is clear that as the ET increases, the amount of the maximum failure load decreases. Increasing the ET enhances the fluidity of the molten plastic, causing the filaments to lose viscosity and leading to the continuous formation of voids, which in turn diminishes the mechanical properties of the part [52,53]. These findings are consistent with those reported by other studies [53,54]. Previous studies reported that as the ET increases, the viscosity of the filament material decreases, leading to a reduction in the overall thickness of the part [54], which can result in maximum failure load degradation. Additionally, the material becomes prone to degradation and increased brittleness at higher ET levels. Conversely, As the RA increases, the maximum failure load initially decreases and then increases. At a raster angle of 0°, the deposited layers are parallel to the direction of the applied load. This alignment maximizes the effective load-bearing capacity due to optimal filament orientation and strong layer adhesion, resulting in higher MFL. When the raster angle increases to 45°, the alignment becomes less effective as the filament orientation begins to deviate from the load direction. Consequently, this misalignment leads to a decrease in the MFL. On the other hand, as the raster angle approaches 90°, the filaments are laid down perpendicularly to the direction of the applied load. This orientation can enhance interlayer bonding due to the overlap of filaments, which may improve the overall strength of the structure. The geometry of the layers creates more opportunities for the filaments to interlock and distribute stress more evenly, resulting in an increase in the maximum failure load. Based on Table 2, increasing the IP from 15% (sample #5) to 55% (sample #6) resulted in a modest rise in the MFL from 360 N to 375 N. However, Figure 3b,d indicate that the effect of infill percentage on the MFL is considerably smaller compared to the influence of ET and RA. The interaction effect of ET and RA on the maximum failure load is presented in Figure 3c, and the interaction effect of ET and IP on the maximum failure load is presented in Figure 3d. Figure 3c,d show that the highest maximum failure load can be achieved when the extruder temperature is sufficiently low, between 230 and 220 °C, while the lowest maximum failure load occurs when the extruder temperature is at its highest, between 250 and 260 °C. Based on Table 2, the TPU part printed at a raster angle of 45 degrees, an infill percentage of 35%, and an extruder temperature of 220 °C had the highest maximum failure load of 515 N.

3.2. Elongation at Break Model

Based on the results of ANOVA (see Table 5), the quadratic model is statistically significant for analyzing elongation at break. The p-value for the elongation at break model is 0.0089, which is less than 0.05. This confirms that the regression model is significant at a 95% confidence level. This confirms a statistically significant relationship between the FFF process parameters and the response. The LOF term is greater than 0.05 (0.5331). The ANOVA table for elongation at break shows that only ET significantly affects the response (p-value = 0.0003), while the other terms are insignificant. The R2 and Adjusted R2 terms for the final regression model were calculated as 0.8998 and 0.7710, respectively. These values indicate the final regression model for elongation at break fits well. The final regression model for elongation at break, in terms of the real factors, is shown in Equation (2).
( e l o n g a t i o n   a t   b r e a k ) 1.04 = 2532.33 11.4588     E T   1.47737     R a s t e r   a n g l e 32.3439     I P + 0.00478771     E T     R A + 0.105294     E T     I P 0.0214707     R A     I P + 0.0104753     E T 2   + 0.0133345     R A 2 + 0.105652     I P 2
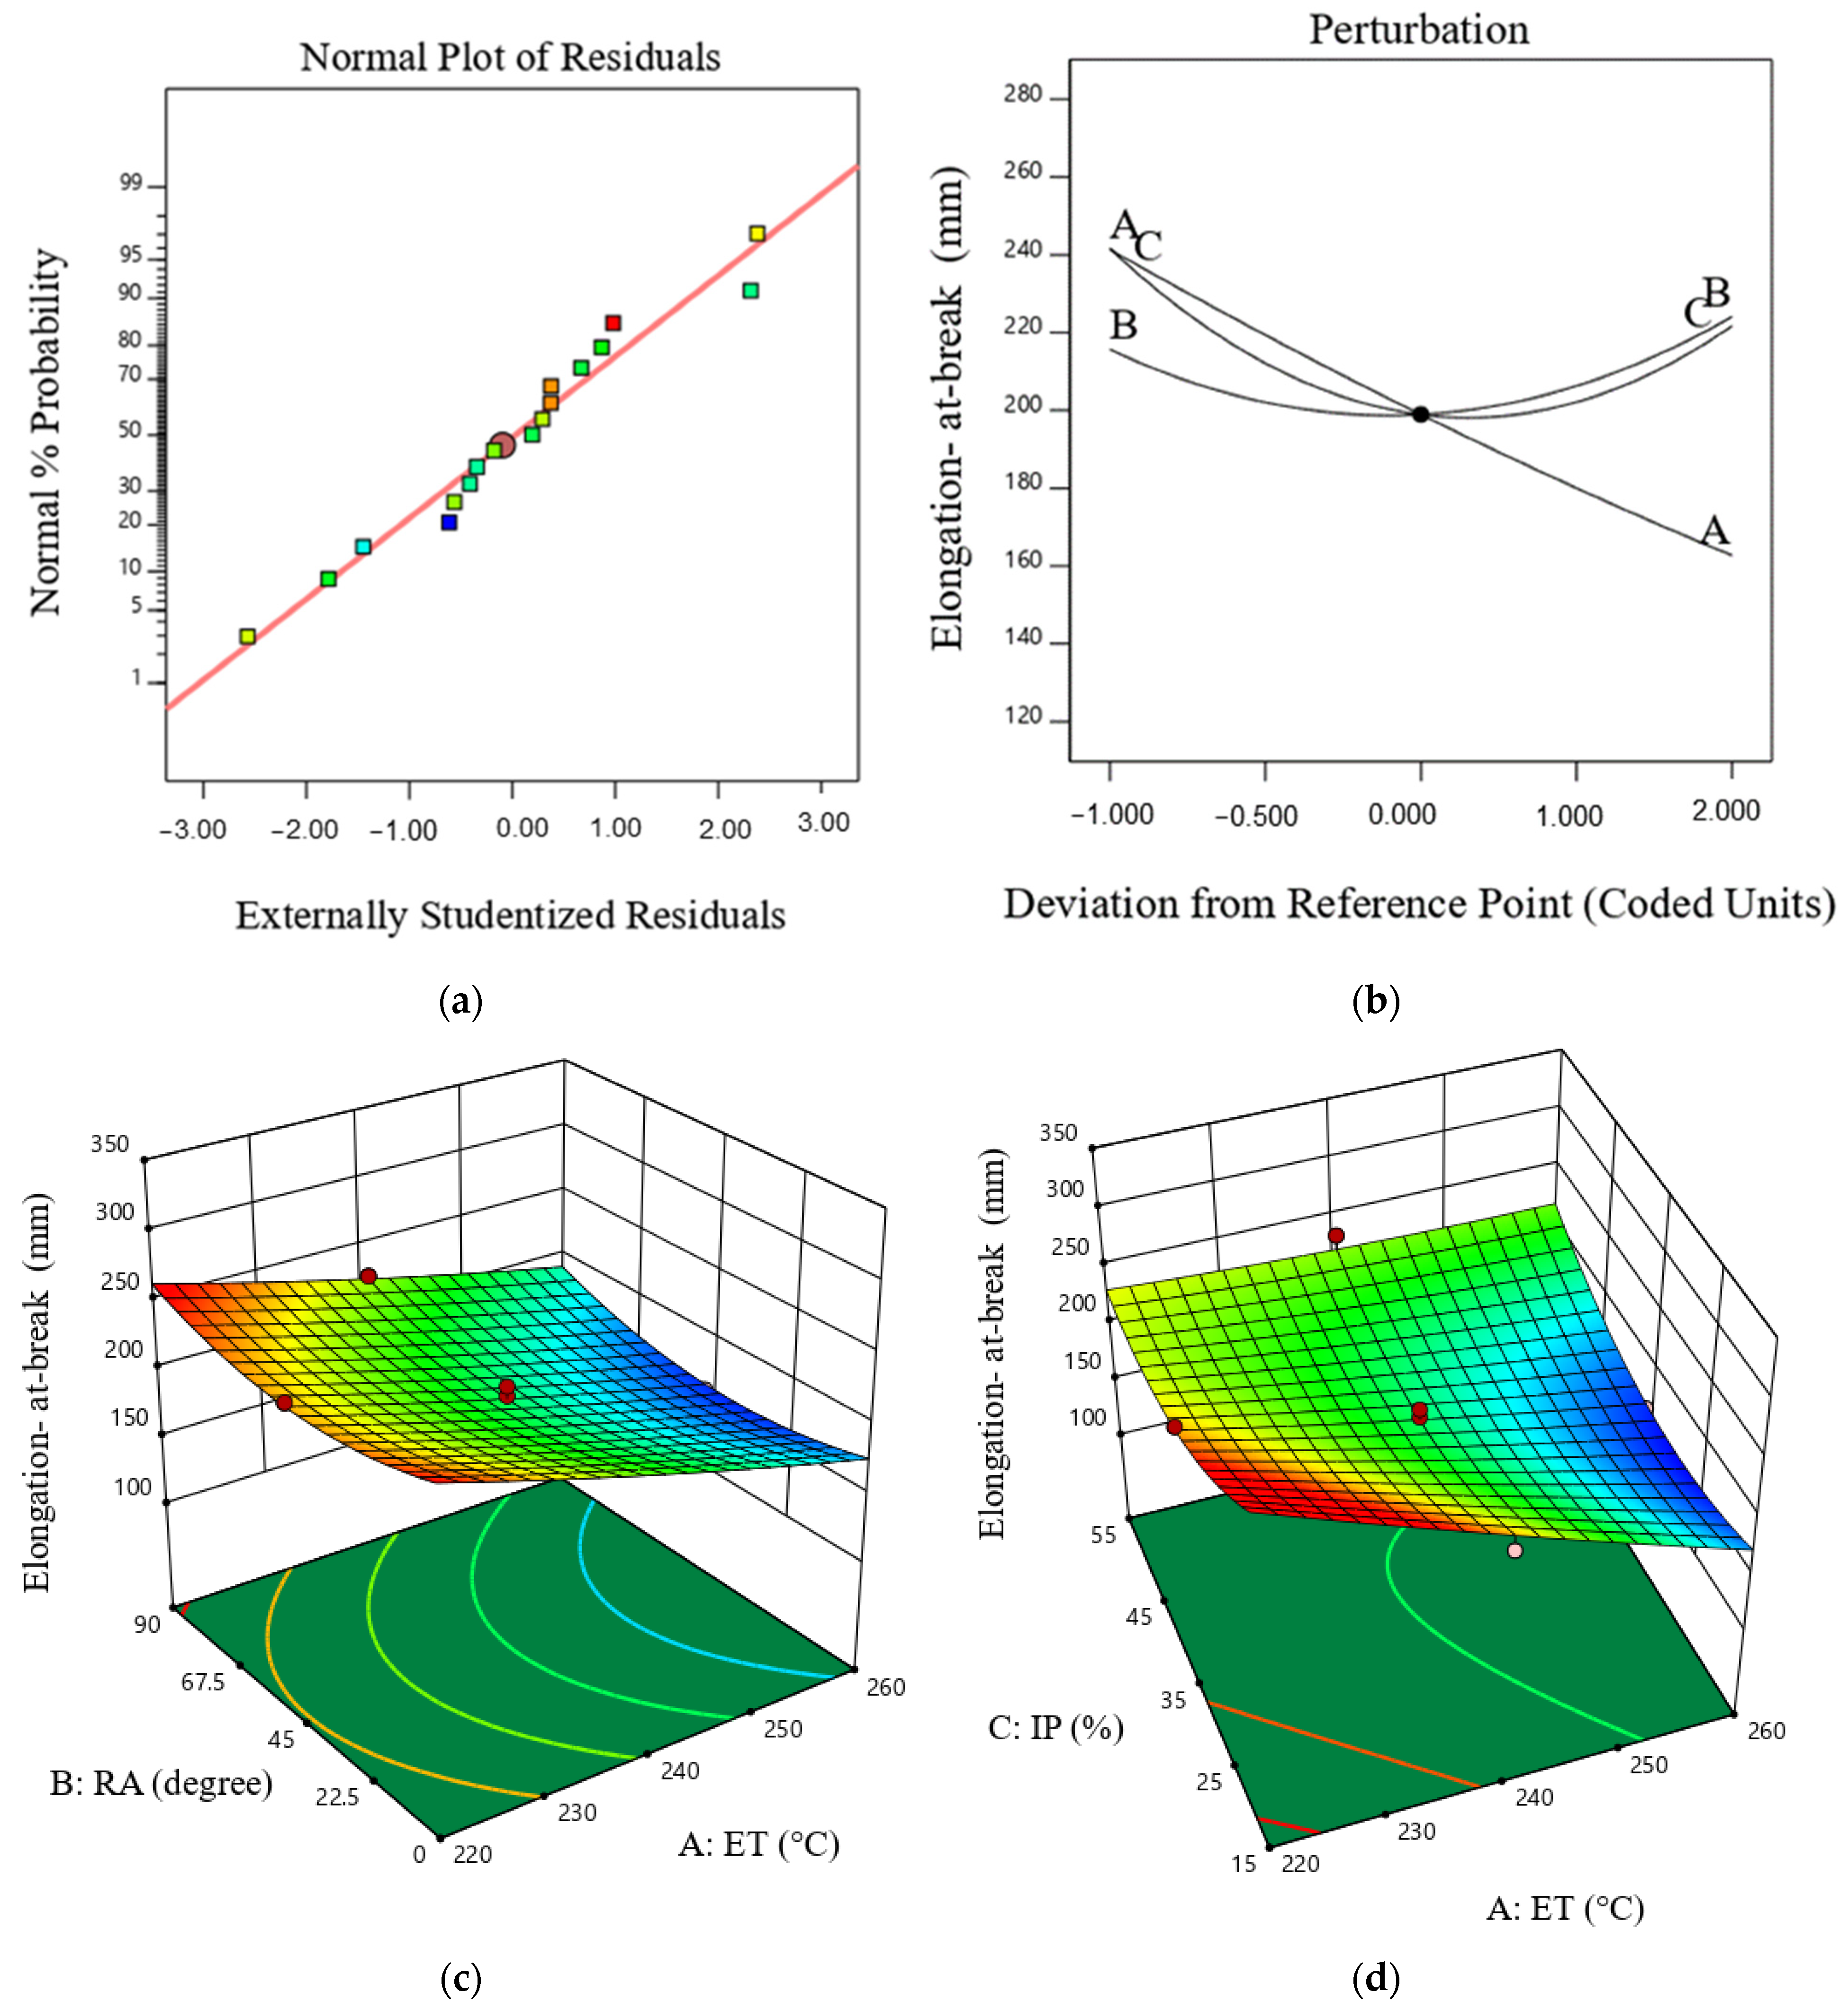
Figure 4a shows that the response values are randomly distributed around the red line, which confirms the model’s accuracy in predicting the elongation at break of the TPU samples. In the perturbation graph, one factor varies over its range due to elongation at break being plotted as a response (see Figure 4b), whereas the other factors are fixed. The slope of each line in the perturbation graph indicates the efficiency of elongation at break in relation to the selected factors. As can be seen, ET has direct influences on elongation at break. Within the range of the factors studied in this paper, with a decrease in ET, the elongation at break of TPU increases. The filament material may thermally degrade if the ET is raised over the ideal range. The breaking of the polymer chains caused by this degradation lowers the interlayer bonding and, as a result, lowers the elongation at break of the TPU parts. On the other hand, a high extruder temperature decreases the viscosity of the melted filament, which reduces adhesion between layers and results in poor layer deposition, thus reducing the elongation at break of the TPU parts. It can also be seen that as the raster angle (RA) and infill percentage (IP) approach the reference point, they exert a negative influence on elongation at break. However, as these parameters move away from the reference point, they have a positive effect on the elongation at break of TPU parts. Figure 4c illustrates the variation in the elongation at break with the raster angle and the extruder temperature. The elongation at break decreases with an increase in the extruder temperature. The results show that the maximum elongation at break is obtained at the minimum extruder temperature.

3.3. Part Weight Model

Table 6 presents the ANOVA results for a quadratic model of part weight. Table 4 shows that the p-value of the model is <0.0001, which confirms that the part weight model is significant. The R2 and Adjusted R2 terms for the final regression model are 0.9932 and 0.9845, respectively, close to 1. These values indicate a good fit between the predicted and experimental results. From the ANOVA results, ET (A), IP (C), IP2 (C2), ET2 (A2), and RA2 (B2) were significant terms (p-values are less than 0.05), while RA (B), IP× ET (AC), ET × RA (AB), and RA × IP (CB) insignificant terms in impacting the part weight of FFF-printed TPU parts. The value of the LOF term is calculated as 0.3891, which indicates that the pure error is not significant. Based on the F-value, the parameter with the greatest influence on part weight was IP, followed by ET (906.28 and 12.84).
The final regression model for part weight in terms of actual factors is expressed as follows (see Equation (3)):
( P a r t   w e i g h t ) 1.49 = 0.959457 + 0.00933988     E T 0.000954649   R A 0.00122006     I P + 3.74647 × 10 6     E T   R A 1.7645 × 10 6     E T     I P 2.39355 × 10 6   R A I P 1.99139 × 10 5     E T 2 + 1.30434 × 10 6     R A 2 + 1.16924 × 10 5     I P 2
Figure 5a shows that the response values (part weight value) are randomly distributed around the red line, and the part weight values do not follow any particular pattern. This indicates the model’s accuracy and adequacy for predicting the TPU samples’ part weight. The perturbation graph of the part weight model suggests that the infill percentage has a positive impact (see Figure 5b). As extruder temperature approaches the reference point, it exerts a negative influence; however, moving away from the reference point has a positive effect. The varying slopes of each factor suggest their level of significance and the specific role each plays in altering the part weight. During the FFF process, an increase in the IP results in the deposition of more TPU filament, making the part denser and consequently increasing its weight. At higher infill percentages, more material is deposited inside the object to make it denser. Figure 5b,d illustrate that the RA has no effect on the weight of the TPU samples. Figure 5c illustrates the influence of ET and IP on part weight at the center point for an RA of 45 °C. It demonstrates that increasing the infill percentage from 15 to 55% significantly increases the weight of the TPU parts. By comparing samples 3 and 4, it is determined that at a constant extruder temperature of 240 °C and raster angle of 45°, increasing the infill percentage from 15% to 50% resulted in a 30.8% increase in the sample’s weight. Figure 5d illustrates that the maximum weight of the samples is obtained at the highest IP.

3.4. Ratio of the Maximum Failure Load to Part Weight Model

Table 7 presents the ANOVA results for a quadratic model of the ratio of the maximum failure load to part weight. Table 4 shows that the p-value of the model is 0.0010, which confirms that the ratio model is significant. The R2 and Adjusted R2 terms for the regression model are 0.9491 and 0.88836, respectively. These values indicate a good fit between the predicted and experimental results. From the ANOVA results, all main FFF parameters (IP, ET, and RA) and RA2 (B2) were significant terms in impacting the ratio of FFF-printed TPU parts, as indicated by p-values less than 0.05. The value of the LOF term is calculated as 0.9121, which indicates that the pure error is not significant. The final regression model for the ratio of the maximum failure load to part weight, in terms of the real factors, is shown in Equation (4).
( R a t i o ) 1.88 = 0.000200312 + 2.01206 × 10 6     E T   + 6.5499 × 10 6     R A 3.24203 × 10 5     I P 1.55641 × 10 8   E T     R A + 1.29743 × 10 7 E T I P 1.52605 × 10 9     R A     I P 1.7013 × 10 9     E T 2   3.89224 × 10 8   R A 2 + 7.58384 × 10 8 I P 2
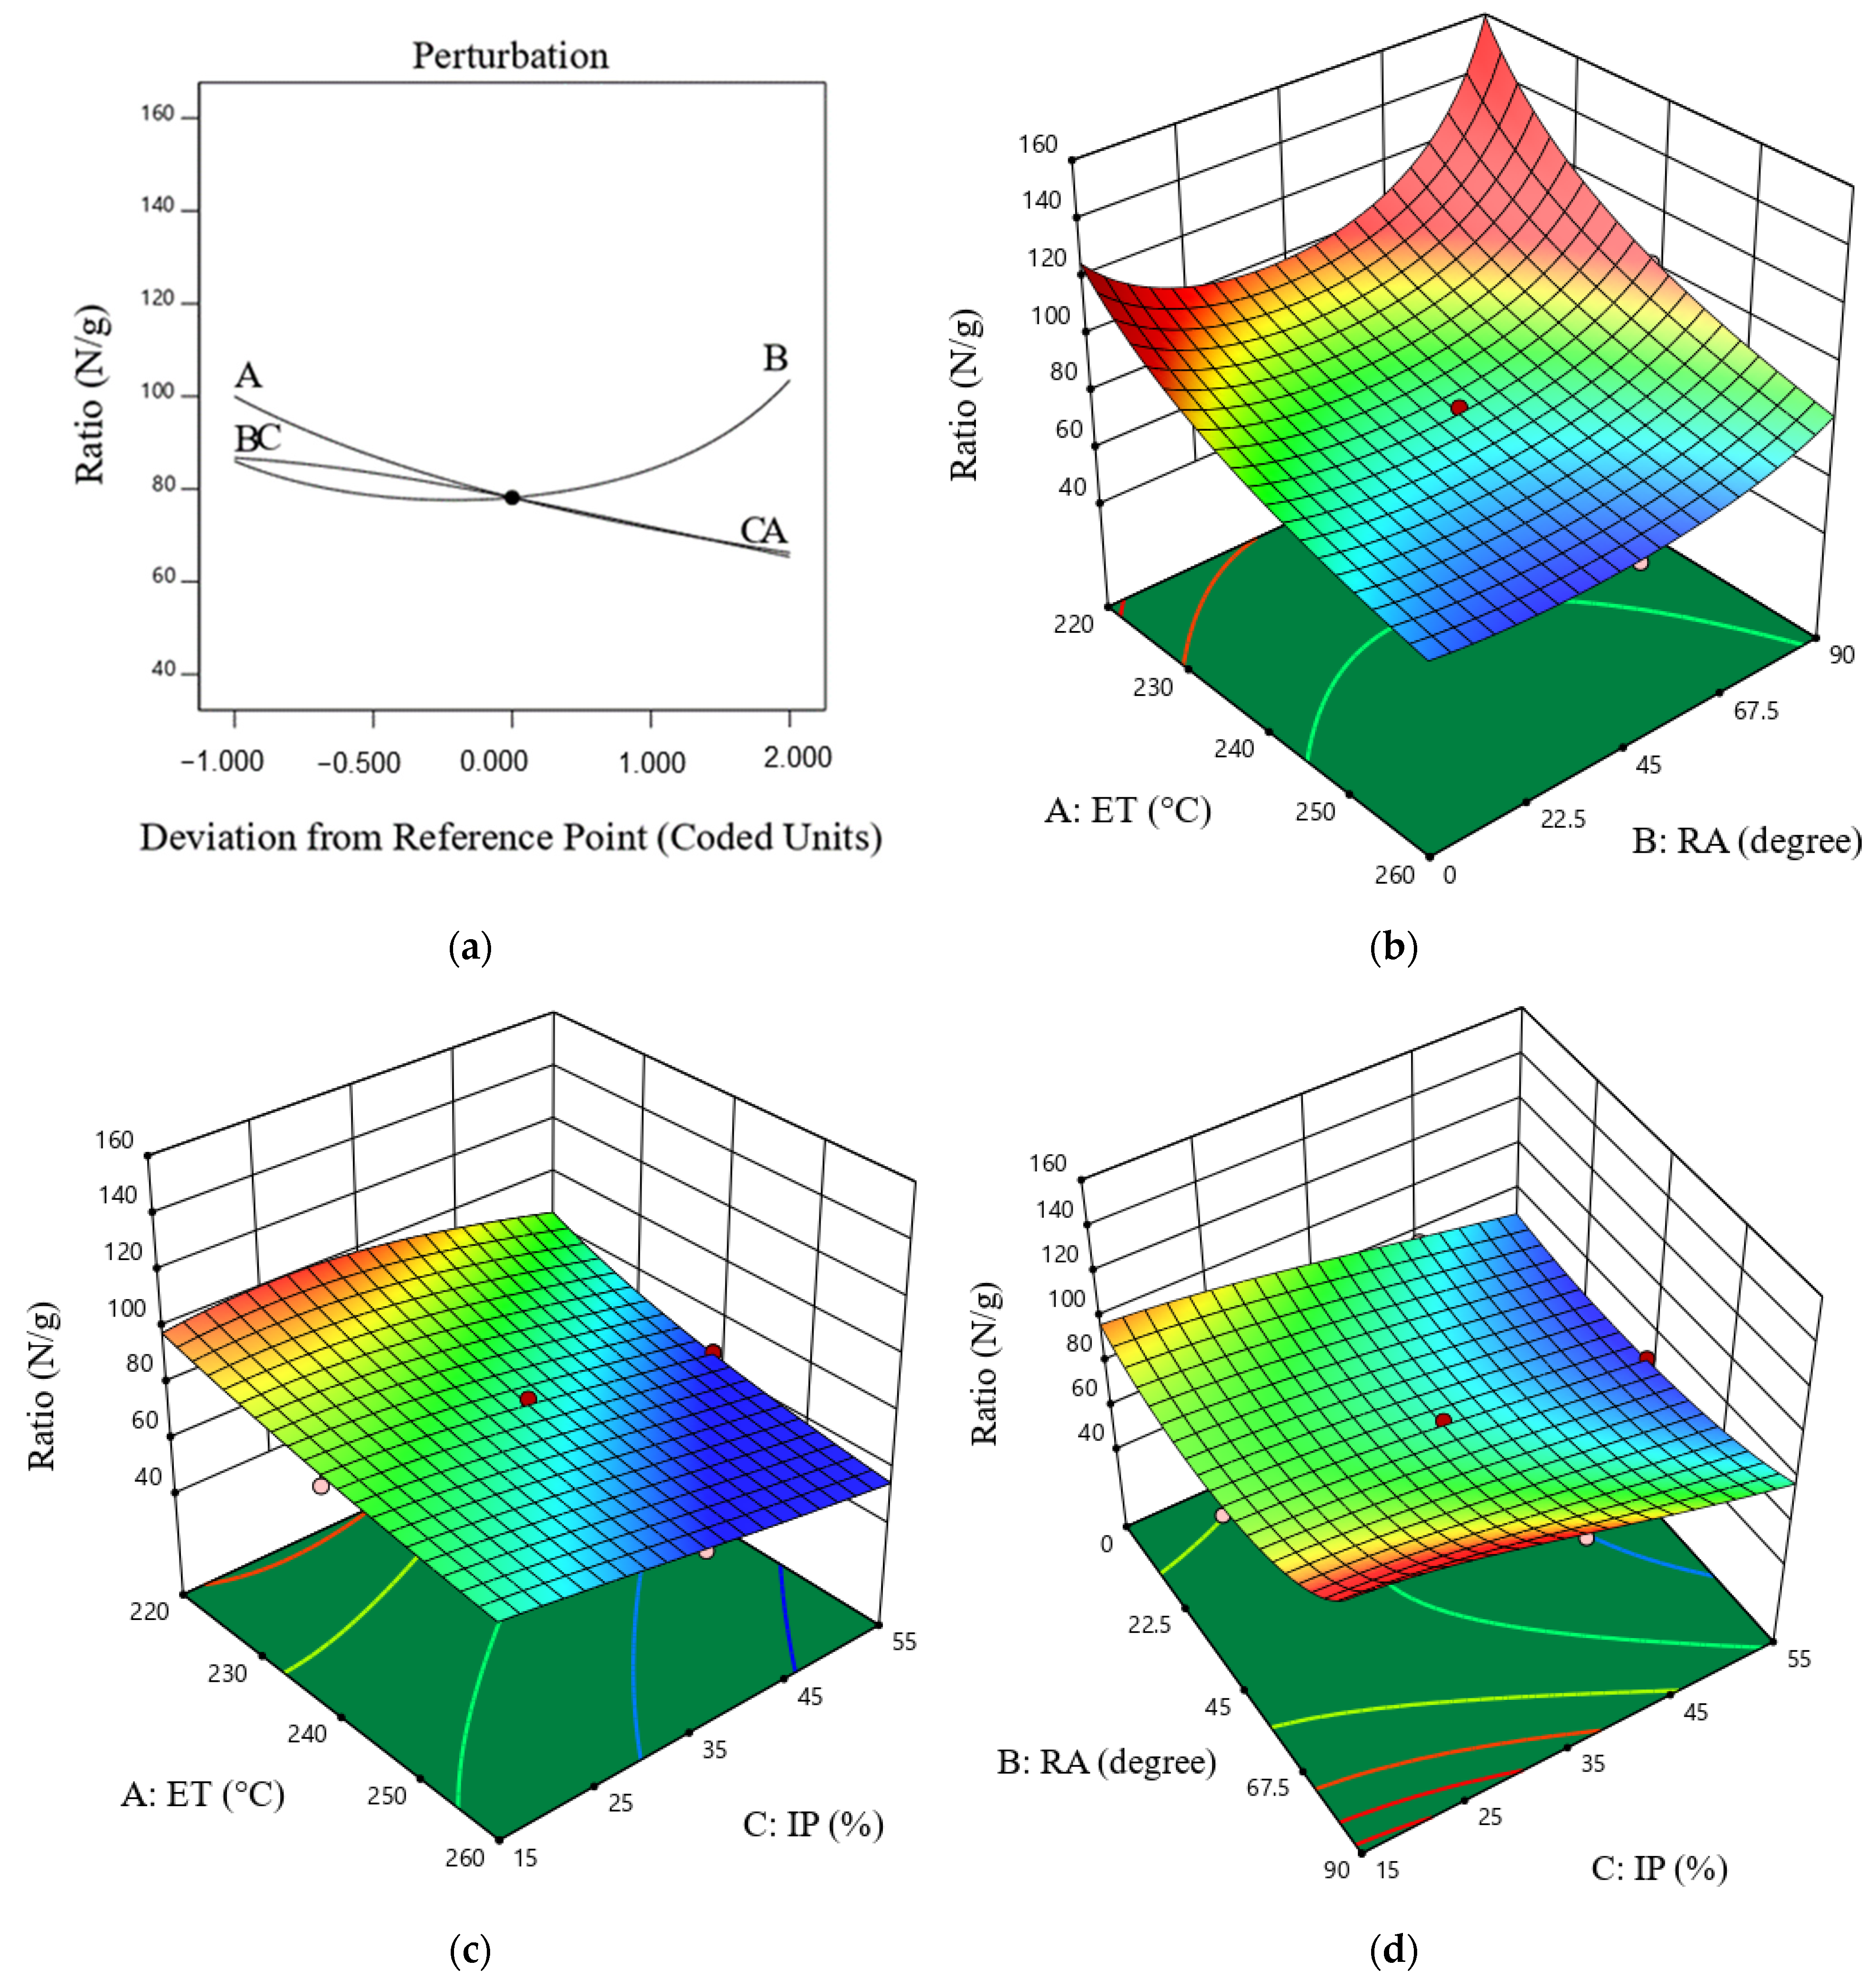
In the perturbation graph, one factor varies over its range due to the ratio of the maximum failure load to part weight being a response (Figure 6a), whereas the other factors are fixed. The slope of each line in the perturbation graph indicates the efficiency of the ratio of the maximum failure load to part weight in relation to the selected factors. As can be seen, ET and IP have negative influences on the ratio. Within the range of the factors studied in this paper, with a decrease in ET and IP, the ratio of the maximum failure load to part weight of the TPU parts increases. The impact of the RA on the ratio is not linear. First, the ratio decreases as the RA increases from 0° to 45°, but then the ratio increases as the RA continues to rise from 45° to 90°. The ratio of strength to part weight in FFF parts is a critical factor in assessing the efficiency and performance of parts manufactured by the FFF process. In general, a higher ratio of maximum failure load to part weight indicates better performance of the samples. Figure 6b shows that the maximum ratio of the maximum failure load to part weight is obtained at the maximum ET, while the maximum ratio of the maximum failure load to part weight is obtained at the maximum RA and minimum ET. The response surface between ET and IP shows that the highest ratio is attained at low ET and IP (Figure 6c). Based on Table 2, the TPU part printed at an RA of 67.5°, an IP of 25%, and an ET of 230 °C had the highest ratio of the maximum failure load to part weight of 102.19 N/g. The interaction between IP and RA shows that the minimum ratio is obtained at high IP and 45° RA (Figure 6d).

3.5. Build Time Model

The quadratic model is statistically significant for analyzing build time (see Table 8). The ANOVA table for build time shows that IP and IP2 significantly affect the response, while the other terms are insignificant. The final regression model for build time, in terms of the real factors, is shown in Equation (5).
The final regression model for build time in terms of actual factors is expressed as follows (see Equation (5)):
( B u i l t   t i m e ) 3 = 8.54587 × 10 11 + 1.07879 × 10 12     E T   2.48831 × 10 13     R A 7.29817 × 10 14     I P + 7.80687 × 10 16     E T     R A + 1.75655 × 10 15     E T     I P + 5.84649 × 10 16     R A   I P 2.45373 × 10 15     E T 2 + 3.30528 × 10 16     R A 2 6.01161 × 10 15     I P 2
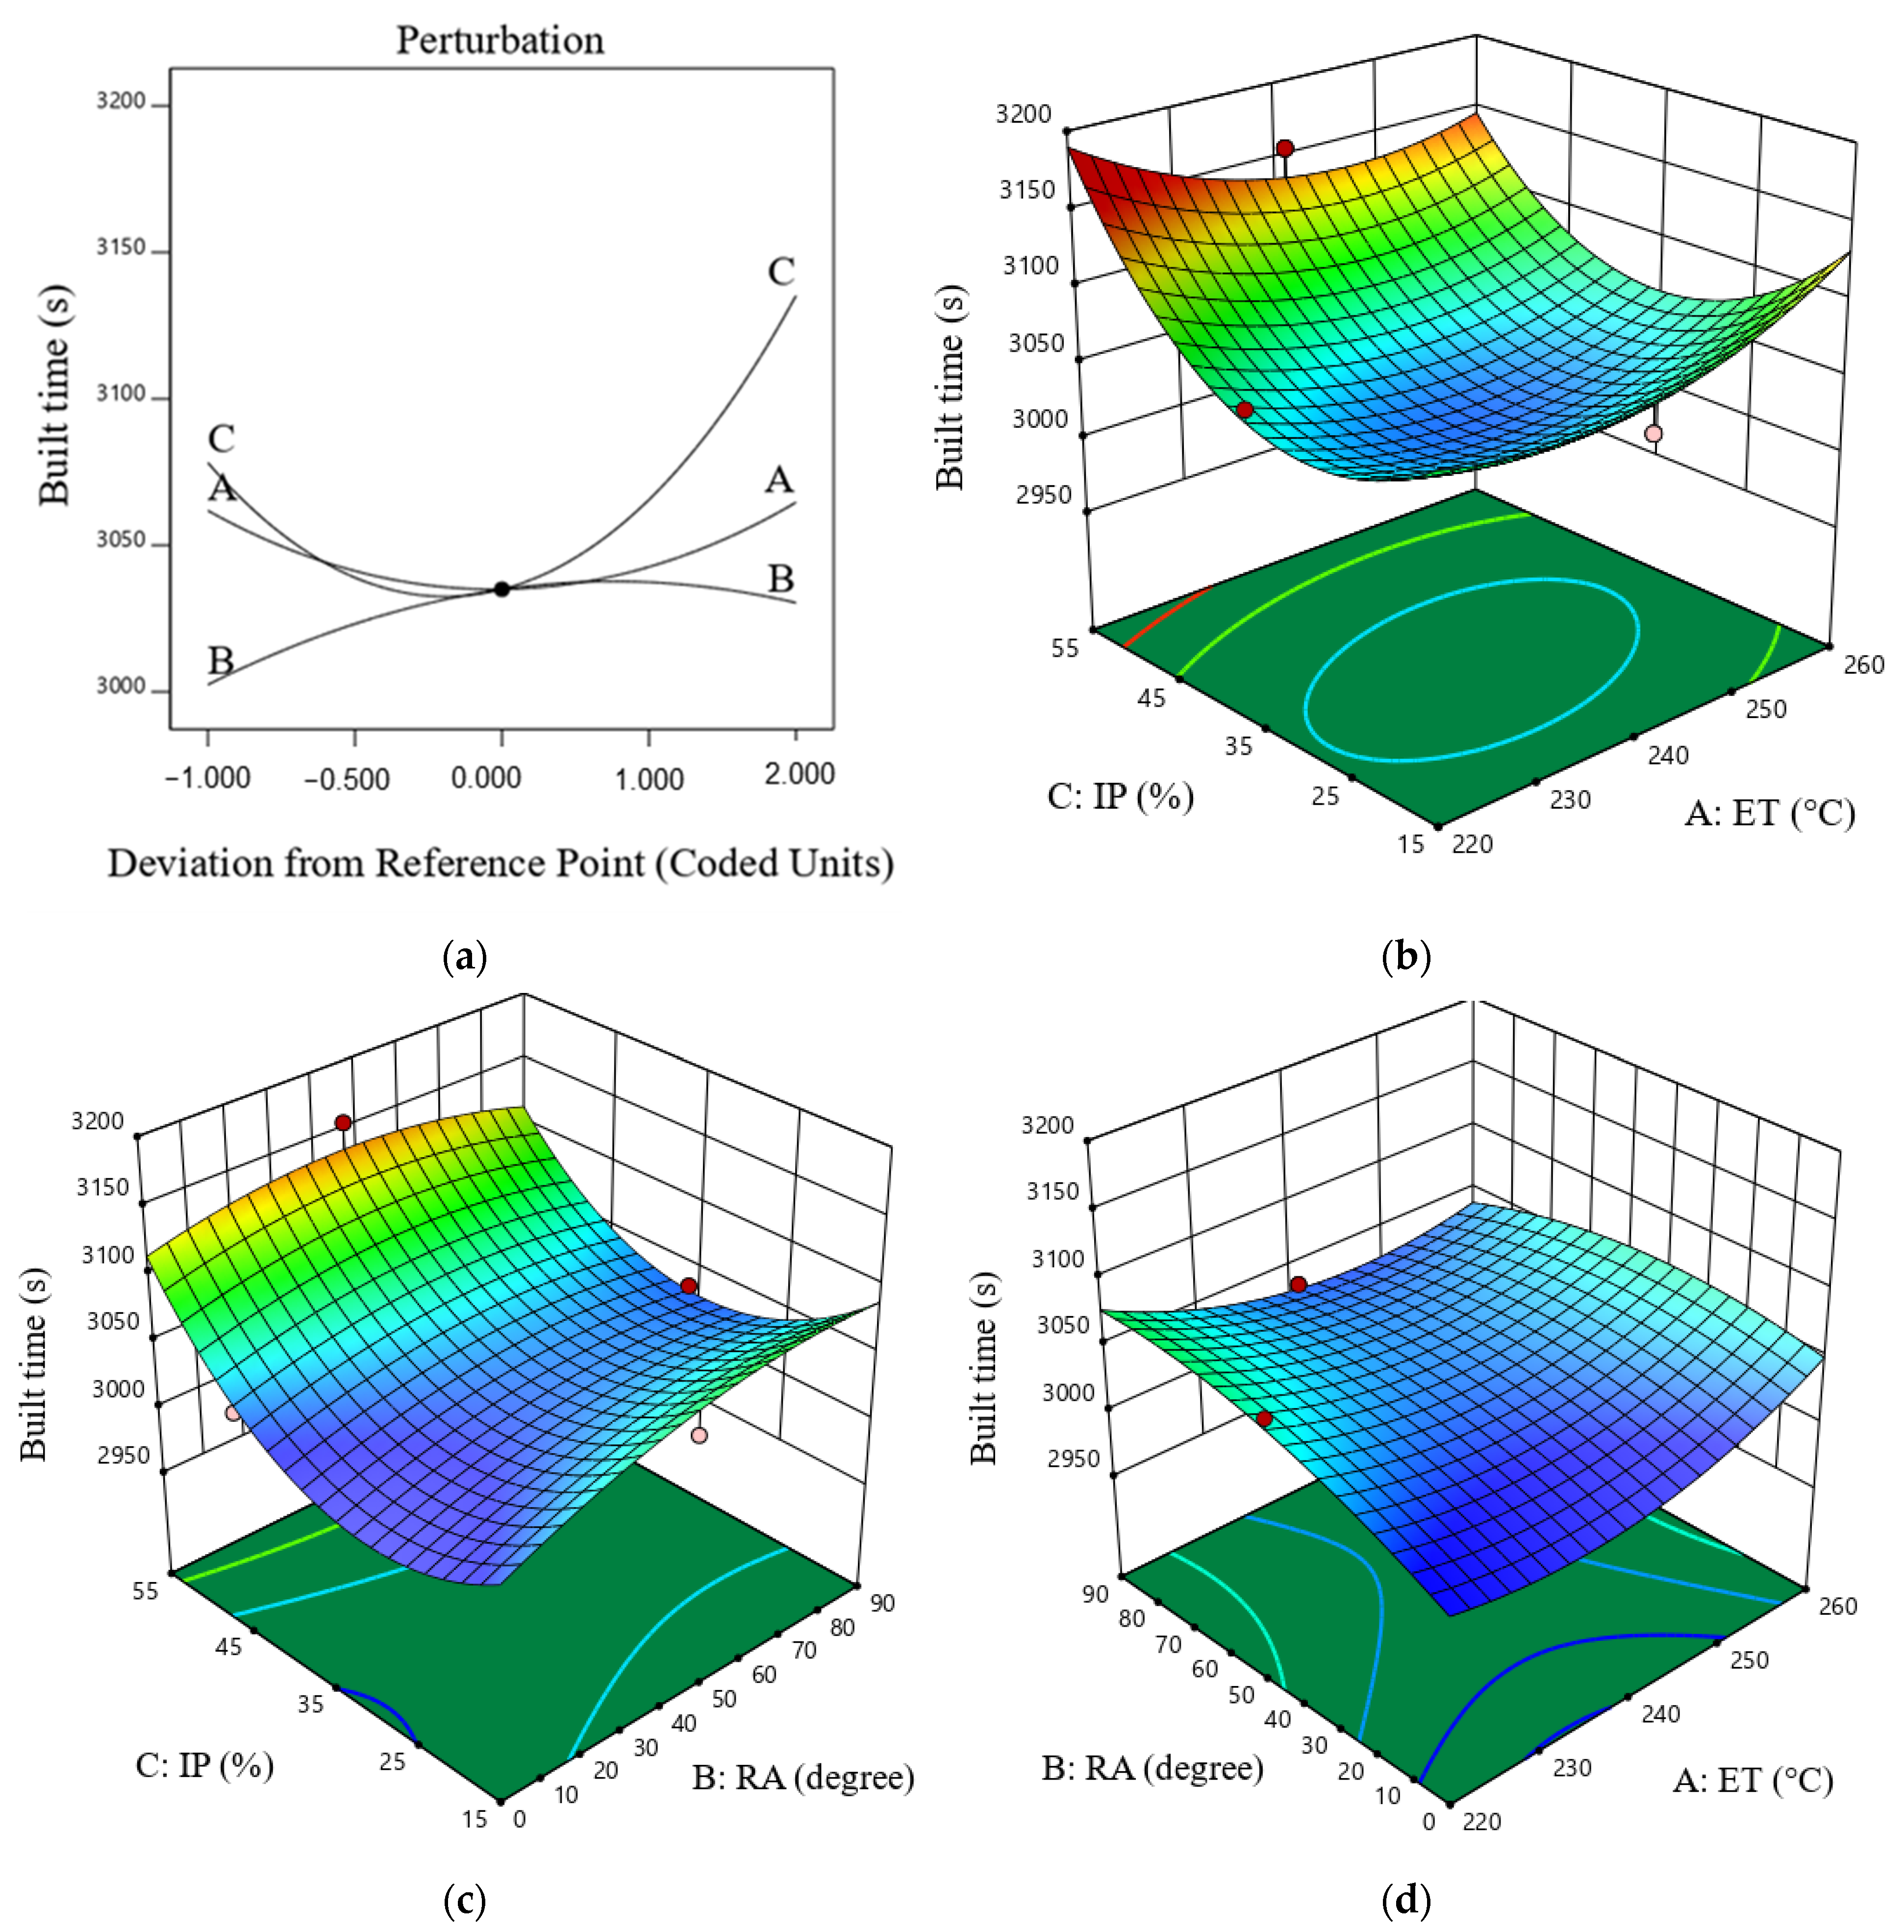
These days, estimating build time is one of the most important aspects of manufacturing science, particularly in mass production. Build time is regarded as an objective function in the current study. The goal of the FFF process is to reduce build time (BT) in order to lower costs. The build time perturbation plot is shown in Figure 7a. It is possible to reach the conclusion that build time is significantly influenced by infill percentage. However, when the IP was increased, the BT significantly decreased. This is because as the infill percentage increases, more filament is deposited, which in turn extends the build time. Figure 7b illustrates the variation in the build time with the IP and the ET. The results show that the BT is obtained at the highest IP (55%) and lowest ET (220 °C). Figure 7c,d illustrate that the raster angle has a minimal effect on the build time of the TPU parts. According to Table 2, the TPU part printed at an IP of 55%, an RA of 45°, and an ET of 240 °C had the highest build time, 3155 s (sample #6).

4. Multi-Response Optimization

One of the main goals of multi-response optimizations is to achieve desirable mechanical properties and part weight for the FFF process, which optimization can realize. The FFF input variables were optimized by utilizing the desirability function. Based on the literature review and the practical experiences, the optimal levels of the FFF input variables were determined to achieve the maximum MFL, maximum elongation at break, maximum ratio of the maximum failure load to part weight, minimum part weight, and minimum build time of the 3D-printed TPU (see Table 9). In multi-objective optimization design, different solutions can be provided based on the importance of the responses. In Design Expert v11 software, the overall importance can be selected on a scale between 2 and 5. In Criteria Set 1, all the responses are assigned equal importance values. In Criteria Set 2, mechanical properties are the most critical factor, so the importance values for mechanical properties were set to 5. Finally, in Criteria Set 3, the highest importance (5) was assigned to part weight and build time, emphasizing efficiency in material usage and production speed. This flexible approach enables the optimization to focus on different priorities depending on specific objectives or constraints. Equation (6) provides the desirability function (D) for the optimum 3D printing process parameter setting [55]:
D = i = 1 n d i ( Y i ) 1 n
where n is the number of responses and di(Yi) represents the relevance and desirability functions of each response. Based on Table 10, an ET of 220 °C, RA of 0°, and IP of 15% were found to be optimal levels for obtaining the maximum MFL (511.436 N), maximum E (321.086 mm), maximum ratio (124.625 N/g), minimum BT (3015.783 s), and minimum PW (4.400 g) of the 3D-printed TPU. Desirability (D) ranges from zero to one, with one indicating the ideal case. As shown in Table 9, the value of D equals 0.988 (based on solution 1), signifying that the optimization is perfect.

5. Conclusions

The present study focuses on the optimization of the fused filament fabrication process parameters like raster angle (RA), infill percentage (IP), and extruder temperature (ET) for characteristics like the part weight, elongation at break, maximum failure load, ratio of the maximum failure load to part weight, and build time of 3D-printed TPU. The key findings of this research can be summarized as follows:
(1)
Among the input factors in the FFF process, extruder temperature is the most significant, exerting an inverse effect on mechanical properties (elongation at break and maximum failure load).
(2)
The TPU part printed with a raster angle of 45 degrees, an infill percentage of 35%, and an extruder temperature of 220 °C achieved the highest maximum failure load of 515 N.
(3)
Increasing the infill percentage increases the weight and build time of TPU parts. Additionally, the raster angle does not affect the part weight and build time. By comparing samples 3 and 4, it is determined that at a constant extruder temperature and raster angle, increasing the infill percentage from 15% to 50% resulted in a 30.8% increase in the part weight.
(4)
Within the range of the factors studied in this study, with a decrease in ET and IP, the ratio of the maximum failure load to part weight of the TPU parts increases.
(5)
It was found that an ET of 220 °C, an RA of 0°, and an IP of 15% are the optimal combination of input variables for achieving the highest maximum failure load of 511 N, maximum elongation at break of 321 mm, ratio of 124 N/g, build time of 3015 s, and minimum part weight of 4.40 g of the 3D-printed TPU. The value of the desirability obtained is 0.988.

6. Future Research

In future research, the effect of additional FFF process parameters, such as printing speed, layer thickness, bed temperature, flow rate, and infill pattern, on the mechanical properties of TPU samples can be explored using three-point bending, torsion, compression, and impact tests. Additionally, simulations of the FFF process could be conducted to evaluate how these parameters influence mechanical behavior. The simulation results can then be compared with experimental findings to provide a comprehensive understanding of the relationship between FFF process parameters and the mechanical properties of TPU parts.

Author Contributions

Conceptualization, M.M. and O.M.; Methodology, W.R., A.B.M.A. and L.B.S.; Software, O.M.; Validation, D.J.J.; Resources, M.M.; Data curation, O.M. and W.R.; Writing—original draft, O.M.; Writing—review and editing, M.M., W.R., A.B.M.A., D.J.J. and L.B.S.; Visualization, D.J.J.; Supervision, M.M. All authors have read and agreed to the published version of the manuscript.

Funding

This research received no external funding.

Data Availability Statement

The original contributions presented in the study are included in the article; further inquiries can be directed to the corresponding authors.

Conflicts of Interest

The authors declare no conflicts of interest.

References

  1. Mehrabi, O.; Hossein Seyedkashi, S.M.; Moradi, M. Effect of the Laser Power on the Geometrical Features of 316L Stainless Steel Additively Manufactured by Direct Laser Metal Deposition (DLMD). Lasers Eng. 2023, 56, 127. [Google Scholar]
  2. Mehrabi, O.; Seyedkashi, S.M.H.; Moradi, M. Experimental study of SS316L, Inconel 625, and SS316L-IN625 functionally graded material produced by direct laser metal deposition process. Proc. Inst. Mech. Eng. Part C J. Mech. Eng. Sci. 2024, 238, 8139–8150. [Google Scholar] [CrossRef]
  3. Cusator, A.; Key, N.L. Development of a Novel Transonic Fan Casing Making Use of Rapid Prototyping and Additive Manufacturing. Appl. Sci. 2024, 14, 8400. [Google Scholar] [CrossRef]
  4. Wang, J.; Fu, A.; Liu, B.; Chen, Y.; Cao, Y.; Zhou, H.; Wang, B.; Li, X.; Li, J.; Fang, Q.; et al. Weakening the mechanical property anisotropy of additively manufactured medium entropy alloy by controlling the cellular structure. Addit. Manuf. 2024, 89, 104303. [Google Scholar] [CrossRef]
  5. Cao, Y.; Chen, C.; Xu, S.; Zhao, R.; Guo, K.; Hu, T.; Liao, H.; Wang, J.; Ren, Z. Machine learning assisted prediction and optimization of mechanical properties for laser powder bed fusion of Ti6Al4V alloy. Addit. Manuf. 2024, 91, 104341. [Google Scholar] [CrossRef]
  6. Lalegani Dezaki, M.; Mohd Ariffin, M.K.A.; Hatami, S. An overview of fused deposition modelling (FDM): Research, development and process optimisation. Rapid Prototyp. J. 2021, 27, 562–582. [Google Scholar] [CrossRef]
  7. Karthick, N.; Soundararajan, R.; Arul, R.; Prasanth, J.A. Evolution of Tribological Performance of Polypropylene with Carbon Fibre Composites Fabricated Through FDM Technology by Varying Infill Density. J. Inst. Eng. Ser. D 2024, 105, 961–968. [Google Scholar] [CrossRef]
  8. Karimi, A.; Rahmatabadi, D.; Baghani, M. Various FDM Mechanisms Used in the Fabrication of Continuous-Fiber Reinforced Composites: A Review. Polymers 2024, 16, 831. [Google Scholar] [CrossRef]
  9. Jiang, Y.; Liu, L.; Yan, J.; Wu, Z. Room-to-low temperature thermo-mechanical behavior and corresponding constitutive model of liquid oxygen compatible epoxy composites. Compos. Sci. Technol. 2024, 245, 110357. [Google Scholar] [CrossRef]
  10. Nathaphan, S.; Trutassanawin, W. Effects of process parameters on compressive property of FDM with ABS. Rapid Prototyp. J. 2021, 27, 905–917. [Google Scholar] [CrossRef]
  11. Zhao, Y.; Zhao, K.; Li, Y.; Chen, F. Mechanical characterization of biocompatible PEEK by FDM. J. Manuf. Process. 2020, 56, 28–42. [Google Scholar] [CrossRef]
  12. Mohamed, O.A.; Masood, S.H.; Bhowmik, J.L.; Nikzad, M.; Azadmanjiri, J. Effect of Process Parameters on Dynamic Mechanical Performance of FDM PC/ABS Printed Parts Through Design of Experiment. J. Mater. Eng. Perform. 2016, 25, 2922–2935. [Google Scholar] [CrossRef]
  13. Alarifi, I.M. Mechanical properties and numerical simulation of FDM 3D printed PETG/carbon composite unit structures. J. Mater. Res. Technol. 2023, 23, 656–669. [Google Scholar] [CrossRef]
  14. Shin, E.J.; Jung, Y.S.; Choi, H.Y.; Lee, S. Synthesis and fabrication of biobased thermoplastic polyurethane filament for FDM 3D printing. J. Appl. Polym. Sci. 2022, 139, e52959. [Google Scholar] [CrossRef]
  15. Ng, N.Y.Z.; Abdul Haq, R.H.; Marwah, O.M.F.; Ho, F.H.; Adzila, S. Optimization of polyvinyl alcohol (PVA) support parameters for fused deposition modelling (FDM) by using design of experiments (DOE). Mater. Today Proc. 2022, 57, 1226–1234. [Google Scholar] [CrossRef]
  16. Srivastava, S.; Saritha, D.; Sujithra, R. Effect of fill pattern on flexural performance of FDM printed PLA. Mater. Manuf. Process. 2024, 39, 787–796. [Google Scholar] [CrossRef]
  17. Moradi, M.; Mehrabi, O.; Rasoul, F.A.; Mattie, A.A.; Schaber, F.; Khandan, R. Enhancing 3D Printing Copper-PLA Composite Fabrication via Fused Deposition Modeling through Statistical Process Parameter Study. Micromachines 2024, 15, 1082. [Google Scholar] [CrossRef]
  18. Fernández-Cervantes, I.; Morales, M.A.; Agustín-Serrano, R.; Cardenas-García, M.; Pérez-Luna, P.V.; Arroyo-Reyes, B.L.; Maldonado-García, A. Polylactic acid/sodium alginate/hydroxyapatite composite scaffolds with trabecular tissue morphology designed by a bone remodeling model using 3D printing. J. Mater. Sci. 2019, 54, 9478–9496. [Google Scholar] [CrossRef]
  19. ISO/ASTM 52900; 2021 Additive Manufacturing—General Principles—Fundamentals and Vocabulary. ISO: Geneva, Switzerland, 2021.
  20. Kam, M.; İpekçi, A.; Şengül, Ö. Investigation of the effect of FDM process parameters on mechanical properties of 3D printed PA12 samples using Taguchi method. J. Thermoplast. Compos. Mater. 2021, 36, 307–325. [Google Scholar] [CrossRef]
  21. Birosz, M.T.; Ledenyák, D.; Andó, M. Effect of FDM infill patterns on mechanical properties. Polym. Test. 2022, 113, 107654. [Google Scholar] [CrossRef]
  22. Wang, S.; Ma, Y.; Deng, Z.; Zhang, S.; Cai, J. Effects of fused deposition modeling process parameters on tensile, dynamic mechanical properties of 3D printed polylactic acid materials. Polym. Test. 2020, 86, 106483. [Google Scholar] [CrossRef]
  23. He, Y.; Shen, M.; Wang, Q.; Wang, T.; Pei, X. Effects of FDM parameters and annealing on the mechanical and tribological properties of PEEK. Compos. Struct. 2023, 313, 116901. [Google Scholar] [CrossRef]
  24. Murali, A.; Vakkattil, M.A.; Parameswaran, R. Investigating the Effect of Processing Parameters on Mechanical Behavior of 3D Fused Deposition Modeling Printed Polylactic Acid. J. Mater. Eng. Perform. 2023, 32, 1089–1102. [Google Scholar] [CrossRef]
  25. Wang, P.; Zou, B.; Ding, S.; Li, L.; Huang, C. Effects of FDM-3D printing parameters on mechanical properties and microstructure of CF/PEEK and GF/PEEK. Chin. J. Aeronaut. 2021, 34, 236–246. [Google Scholar] [CrossRef]
  26. Yin, S.; Du, Y.; Liang, X.; Xie, Y.; Xie, D.; Mei, Y. Surface coating of biomass-modified black phosphorus enhances flame retardancy of rigid polyurethane foam and its synergistic mechanism. Appl. Surf. Sci. 2023, 637, 157961. [Google Scholar] [CrossRef]
  27. Chen, Y.; Sun, S.; Zhang, T.; Zhou, X.; Li, S. Effects of post-weld heat treatment on the microstructure and mechanical properties of laser-welded NiTi/304SS joint with Ni filler. Mater. Sci. Eng. A 2020, 771, 138545. [Google Scholar] [CrossRef]
  28. Li, J.; Wang, Z.; Zhang, S.; Lin, Y.; Jiang, L.; Tan, J. Task incremental learning-driven Digital-Twin predictive modeling for customized metal forming product manufacturing process. Robot. Comput.-Integr. Manuf. 2024, 85, 102647. [Google Scholar] [CrossRef]
  29. Afshari, H.; Taher, F.; Alavi, S.A.; Afshari, M.; Samadi, M.R.; Allahyari, F. Studying the effects of FDM process parameters on the mechanical properties of parts produced from PLA using response surface methodology. Colloid Polym. Sci. 2024, 302, 955–970. [Google Scholar] [CrossRef]
  30. Johar, M.; Rosli, A.A.; Shuib, R.K.; Abdul Hamid, Z.A.; Abdullah, M.K.; Ku Ishak, K.M.; Rusli, A. Dimensional stability of poly(lactic acid) (PLA) parts fabricated using fused deposition modelling (FDM). Prog. Rubber Plast. Recycl. Technol. 2024, 40, 14777606241262882. [Google Scholar] [CrossRef]
  31. Sahoo, S.; Sutar, H.; Senapati, P.; Shankar Mohanto, B.; Ranjan Dhal, P.; Kumar Baral, S. Experimental investigation and optimization of the FDM process using PLA. Mater. Today Proc. 2023, 74, 843–847. [Google Scholar] [CrossRef]
  32. Ambade, V.; Rajurkar, S.; Awari, G.; Yelamasetti, B.; Shelare, S. Influence of FDM process parameters on tensile strength of parts printed by PLA material. Int. J. Interact. Des. Manuf. (IJIDeM) 2023, 17, 1–12. [Google Scholar] [CrossRef]
  33. Kutnjak-Mravlinčić, S.; Godec, D.; Pilipović, A.; Sutlović, A. Optimization of the FDM Processing Parameters on the Compressive Properties of ABS Objects for the Production of High-Heeled Shoes. J. Manuf. Mater. Process. 2024, 8, 106. [Google Scholar] [CrossRef]
  34. Kechagias, J.D. 3D printing parametric optimization using the power of Taguchi design: An expository paradigm. Mater. Manuf. Process. 2024, 39, 797–803. [Google Scholar] [CrossRef]
  35. Farid, M.I.; Wu, W.; Li, G.; Zheng, A.; Zhao, Y. Superior tensile properties of FDM 3D-printed TPU/E-TPU layered structure. J. Mater. Res. 2024, 39, 2051–2066. [Google Scholar] [CrossRef]
  36. M’Bengue, M.-S.; Mesnard, T.; Chai, F.; Maton, M.; Gaucher, V.; Tabary, N.; García-Fernandez, M.-J.; Sobocinski, J.; Martel, B.; Blanchemain, N. Evaluation of a Medical Grade Thermoplastic Polyurethane for the Manufacture of an Implantable Medical Device: The Impact of FDM 3D-Printing and Gamma Sterilization. Pharmaceutics 2023, 15, 456. [Google Scholar] [CrossRef] [PubMed]
  37. Soltanmohammadi, K.; Rahmatabadi, D.; Aberoumand, M.; Soleyman, E.; Ghasemi, I.; Baniassadi, M.; Abrinia, K.; Bodaghi, M.; Baghani, M. Effects of TPU on the mechanical properties, fracture toughness, morphology, and thermal analysis of 3D-printed ABS-TPU blends by FDM. J. Vinyl Addit. Technol. 2024, 30, 958–968. [Google Scholar] [CrossRef]
  38. Rahmatabadi, D.; Soltanmohammadi, K.; Pahlavani, M.; Aberoumand, M.; Soleyman, E.; Ghasemi, I.; Baniassadi, M.; Abrinia, K.; Bodaghi, M.; Baghani, M. Shape memory performance assessment of FDM 3D printed PLA-TPU composites by Box-Behnken response surface methodology. Int. J. Adv. Manuf. Technol. 2023, 127, 935–950. [Google Scholar] [CrossRef]
  39. Ursini, C.; Collini, L. FDM Layering Deposition Effects on Mechanical Response of TPU Lattice Structures. Materials 2021, 14, 5645. [Google Scholar] [CrossRef]
  40. Hasdiansah, H.; Yaqin, R.I.; Pristiansyah, P.; Umar, M.L.; Priyambodo, B.H. FDM-3D printing parameter optimization using taguchi approach on surface roughness of thermoplastic polyurethane parts. Int. J. Interact. Des. Manuf. (IJIDeM) 2023, 17, 3011–3024. [Google Scholar] [CrossRef]
  41. Dixit, N.; Jain, P.K. Properties evaluation of chemically treated TPU parts printed through FFF. Int. J. Adv. Manuf. Technol. 2023, 126, 131–143. [Google Scholar] [CrossRef]
  42. Zolfaghari, A.; Purrouhani, M.R.; Zolfagharian, A. A response surface methodology study on 4D printing for layered PLA/TPU structures. Prog. Addit. Manuf. 2024, 9, 1–12. [Google Scholar] [CrossRef]
  43. Pradhan, M.K. Estimating the effect of process parameters on MRR, TWR and radial overcut of EDMed AISI D2 tool steel by RSM and GRA coupled with PCA. Int. J. Adv. Manuf. Technol. 2013, 68, 591–605. [Google Scholar] [CrossRef]
  44. Hashmi, K.H.; Zakria, G.; Raza, M.B.; Khalil, S. Optimization of process parameters for high speed machining of Ti-6Al-4V using response surface methodology. Int. J. Adv. Manuf. Technol. 2016, 85, 1847–1856. [Google Scholar] [CrossRef]
  45. Zhao, Y.; Liu, K.; Zhang, H.; Tian, X.; Jiang, Q.; Murugadoss, V.; Hou, H. Dislocation motion in plastic deformation of nano polycrystalline metal materials: A phase field crystal method study. Adv. Compos. Hybrid Mater. 2022, 5, 2546–2556. [Google Scholar] [CrossRef]
  46. Wang, Z.; Zhou, T.; Zhang, S.; Sun, C.; Li, J.; Tan, J. Bo-LSTM based cross-sectional profile sequence progressive prediction method for metal tube rotate draw bending. Adv. Eng. Inform. 2023, 58, 102152. [Google Scholar] [CrossRef]
  47. Li, M. Evaluation of the effect of process parameters on the cut quality in fiber laser cutting of duplex stainless steel using response surface method (RSM). Infrared Phys. Technol. 2021, 118, 103896. [Google Scholar] [CrossRef]
  48. Selvam, R.; Vignesh, M.; Pugazhenthi, R.; Anbuchezhiyan, G.; Satyanarayana Gupta, M. Effect of process parameter on wire cut EDM using RSM method. Int. J. Interact. Des. Manuf. (IJIDeM) 2024, 18, 2957–2968. [Google Scholar] [CrossRef]
  49. Tian, X.; Zhao, Y.; Gu, T.; Guo, Y.; Xu, F.; Hou, H. Cooperative effect of strength and ductility processed by thermomechanical treatment for Cu–Al–Ni alloy. Mater. Sci. Eng. A 2022, 849, 143485. [Google Scholar] [CrossRef]
  50. Cen, Q.; Xing, Z.; Wang, Q.; Li, L.; Wang, Z.; Wu, Z.; Liu, L. Molding simulation of airfoil foam sandwich structure and interference optimization of foam-core. Chin. J. Aeronaut. 2024, 37, 325–338. [Google Scholar] [CrossRef]
  51. ASTM 638; Standard Test Method for Tensile Properties of Plastics. ASTM International: West Conshohocken, PA, USA, 2014.
  52. Guessasma, S.; Belhabib, S.; Nouri, H. Thermal cycling, microstructure and tensile performance of PLA-PHA polymer printed using fused deposition modelling technique. Rapid Prototyp. J. 2020, 26, 122–133. [Google Scholar] [CrossRef]
  53. NurFarrahain, N.A.; Yew, H.W.; Nik, N.N.G. A systematic review of fused deposition modeling process parameters. Soft Sci. 2022, 2, 11. [Google Scholar]
  54. Syrlybayev, D.; Zharylkassyn, B.; Seisekulova, A.; Akhmetov, M.; Perveen, A.; Talamona, D. Optimisation of Strength Properties of FDM Printed Parts—A Critical Review. Polymers 2021, 13, 1587. [Google Scholar] [CrossRef] [PubMed]
  55. Dwivedi, A.; Khurana, M.K.; Bala, Y.G. Effect of parameters on quality of IN718 parts using laser additive manufacturing. Mater. Sci. Technol. 2024, 40, 633–648. [Google Scholar] [CrossRef]
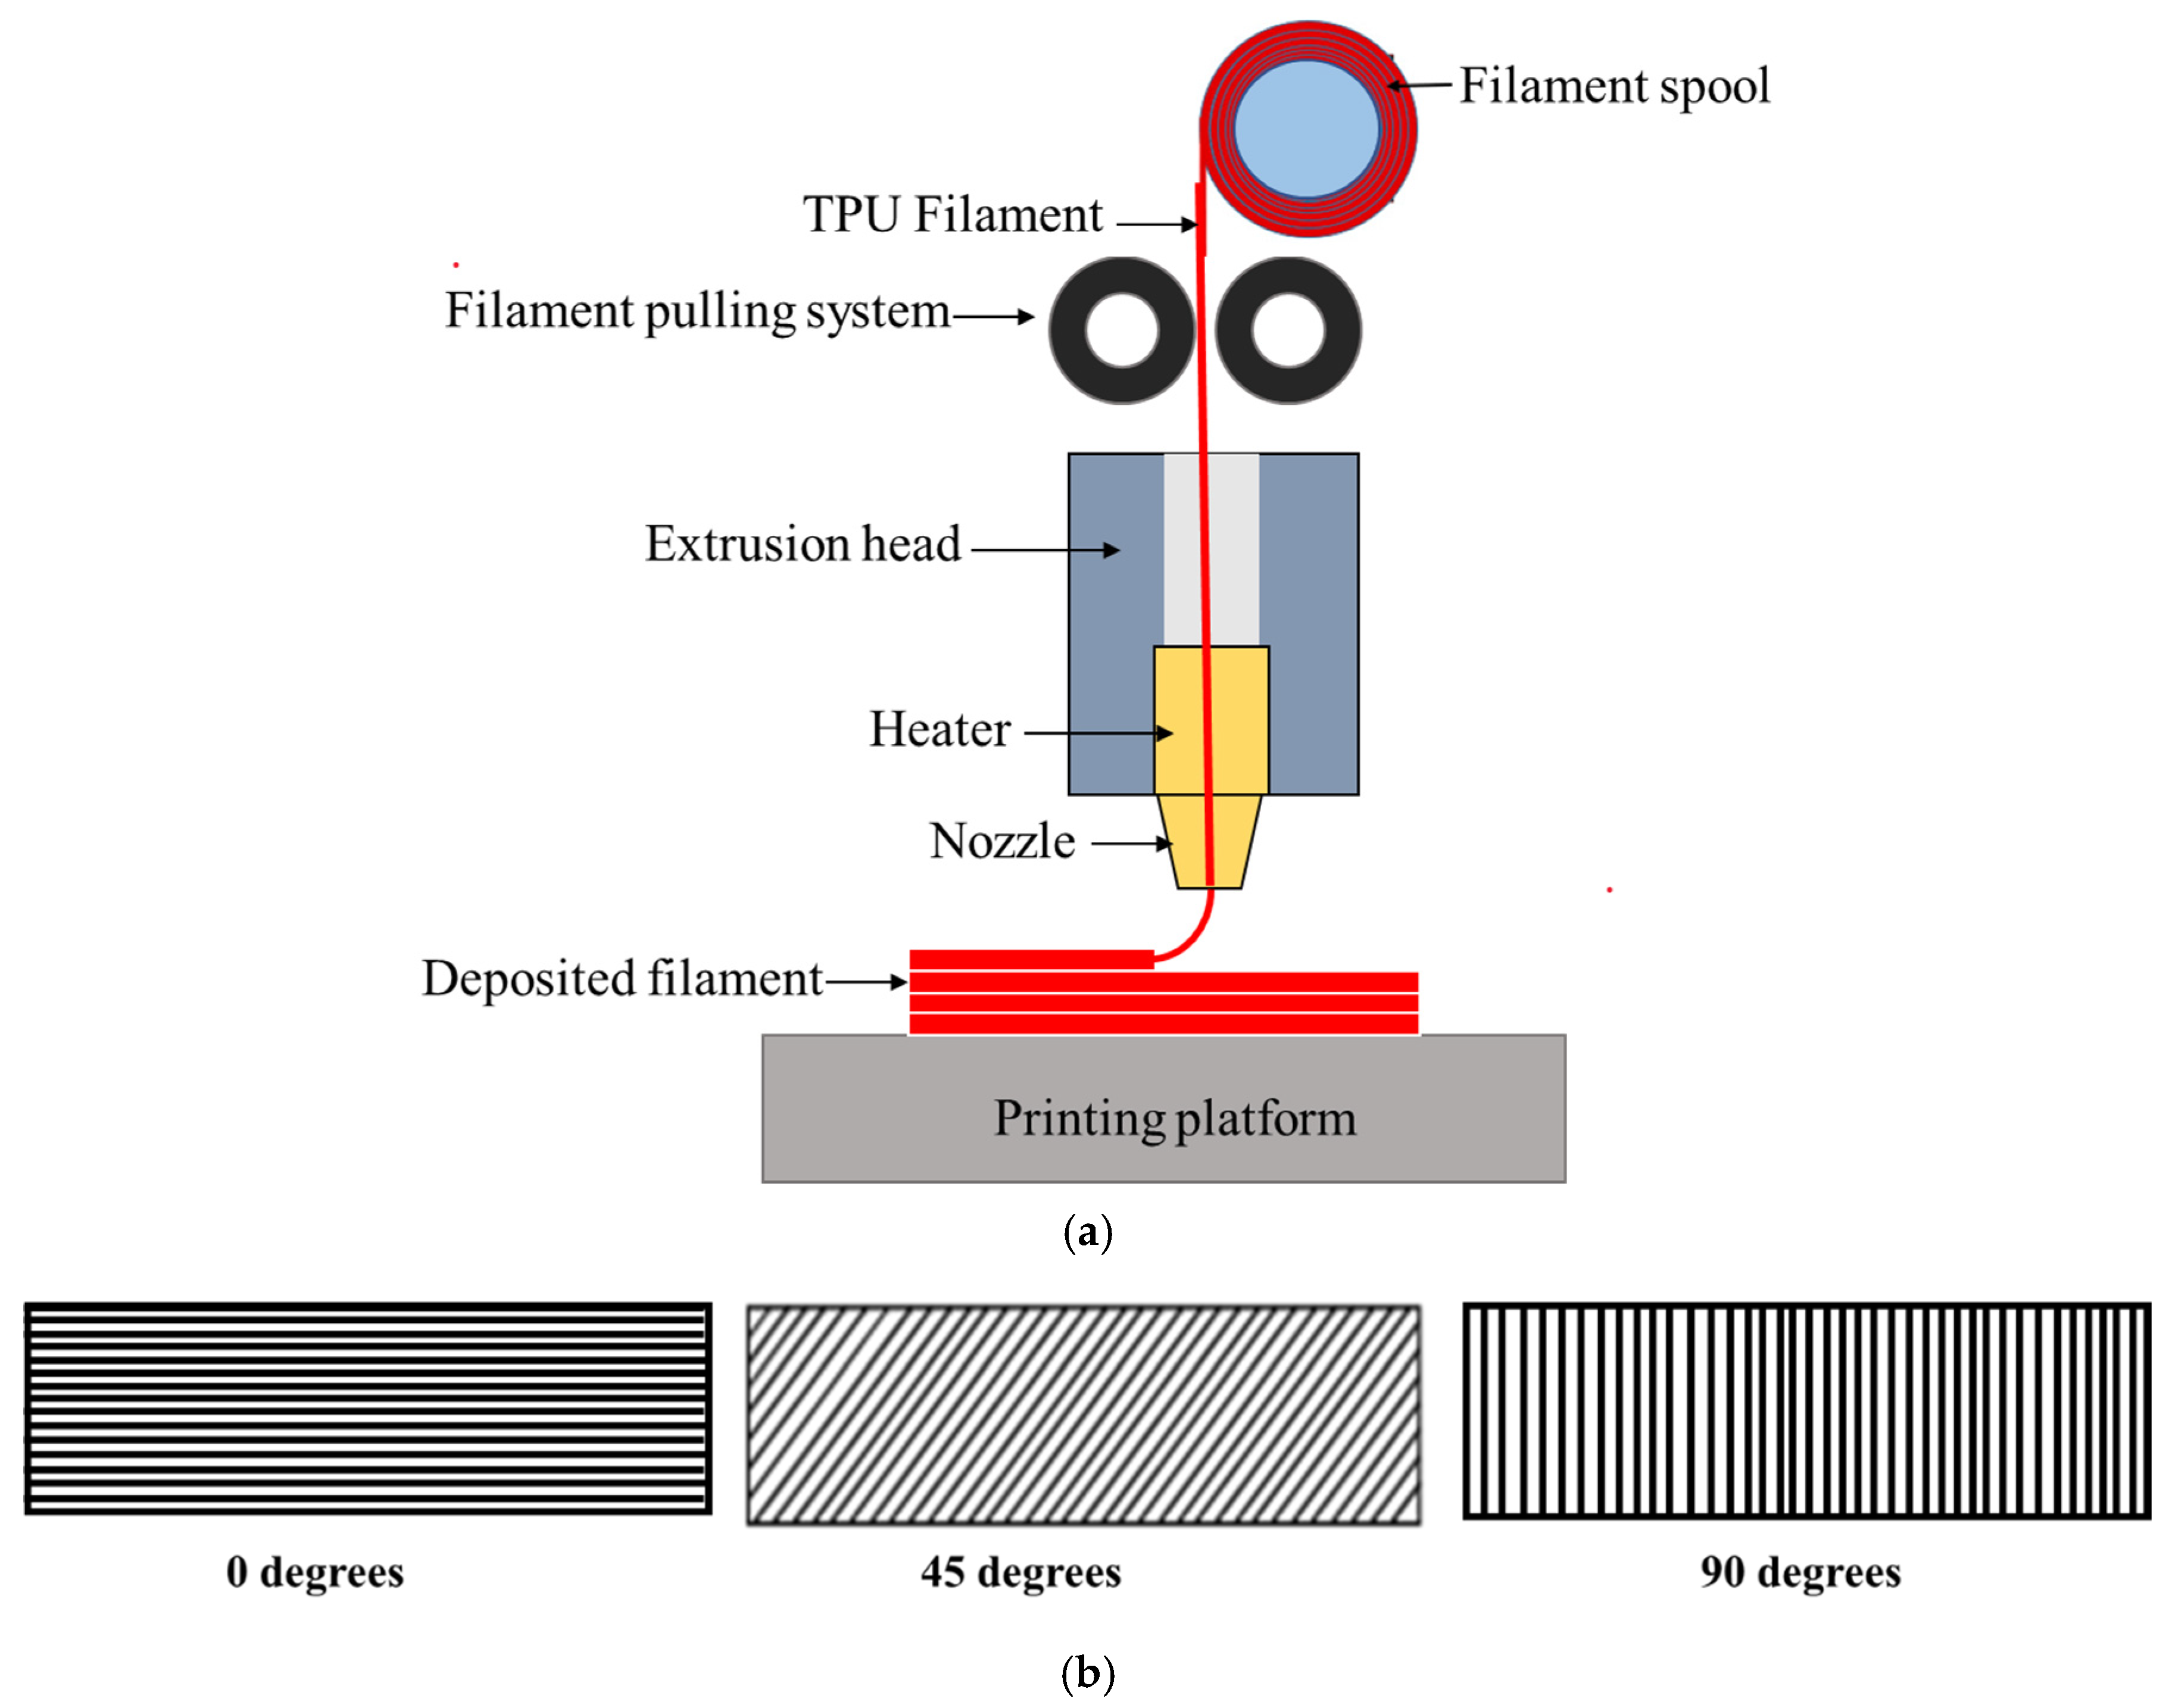
Figure 1. (a) Schematic of FFF 3D printing process; (b) schematic of the types of raster angle.
Mathematics 12 03146 g001
Figure 2. Design of dog-bone-shaped test specimen based on ASTM D638 type [17,51].
Mathematics 12 03146 g002
Figure 3. Plots for the maximum failure load model: (a) normal residual plot, (b) perturbation graph, (c) response surface between ET and RA, and (d) response surface between ET and IP.
Mathematics 12 03146 g003
Figure 4. Plots for the elongation at break model: (a) normal residual plot, (b) perturbation graph, (c) response surface between ET and RA, and (d) response surface between ET and IP.
Mathematics 12 03146 g004
Figure 5. Plots for the part weight model: (a) normal residual plot, (b) perturbation graph, (c) response surface between ET and IP, and (d) response surface between RA and IP.
Mathematics 12 03146 g005
Figure 6. Plots for the ratio of the maximum failure load to part weight: (a) perturbation graph, (b) response surface between ET and RA, (c) response surface between ET and IP, and (d) response surface between RA and IP.
Mathematics 12 03146 g006
Figure 7. Plots for the ratio of the maximum failure load to part weight: (a) perturbation graph, (b) response surface between ET and IP, (c) response surface between RA and IP, and (d) response surface between RA and IP.
Mathematics 12 03146 g007
Table 1. FFF parameters for 3D printing with design level.
VariableNotationUnit−2−10+1+2
Extruder temperatureET°C220230240250260
Raster angleRAdegree022.54567.590
Infill percentageIP%1525354555
Table 2. Specification of experiments and multi-performance results (seventeen experiments; three repetitions in the center point).
Experiment No.Input VariablesOutput Variables
Coded ValuesActual ValuesMaximum Failure
Load [N]
Elongation at Break
[mm]
Part Weight [g]Ratio of the MFL to PW [N/g]Build Time
[s]
ET [°C]RA
[°]
IP
[%]
ET [°C]RA [°]IP [%]
1−11−123067.525490258.004.795102.193060
22002604535360158.335.4965.57383055
30002404535410201.065.1180.23483034
40002404535360185.335.0471.42863034
500−22404515360228.844.3582.75863060
60022404555375251.805.6965.90513155
71−1125022.545370193.865.5966.18963060
81−1−125022.525380211.764.8778.02873060
9−1−1123022.545445220.565.4282.10333060
10−1−1−123022.525455243.514.7096.80853020
1111−125067.525415202.164.7886.82013060
120002404535410207.885.1080.39223034
130202409035510226.165.02101.5943034
1411125067.545385193.115.6468.26243060
15−2002204535515244.095.3396.62293070
160−20240045395222.735.2175.81573034
17−11123067.545480205.35.5286.95653060
Table 3. Mechanical characteristics of TPU filament.
PropertyTest MethodValue
Tensile StrengthASTM D63840 MPa
Elongation at BreakASTM D638500%
Flexural StrengthASTM D79030 MPa
Impact StrengthASTM D256100 kJ/m2
Shore Hardness (A)ASTM D224090 A
DensityASTM D7921.2 g/cm3
Tear StrengthASTM D62480 kN/m
Table 4. ANOVA results of the presented model (quadratic model) for maximum failure load.
SourceSum of Squares (SS)Degrees of Freedom (DF)Mean Square (MS)F-Valuep-Value
Model1.435 × 101691.594 × 101513.470.0012Significant
A—Extruder temperature7.937 × 101517.937 × 101567.06<0.0001Significant
B—Raster angle2.137 × 101512.137 × 101518.060.0038Significant
C—Infill percentage5.506 × 101315.506 × 10130.46520.5171
AB6.560 × 101316.560 × 10130.55430.4808
AC3.772 × 101213.772 × 10120.03190.8634
BC1.041 × 101311.041 × 10130.08790.7754
A21.098 × 101511.098 × 10159.270.0187Significant
B21.757 × 101511.757 × 101514.840.0063Significant
C22.061 × 101412.061 × 10141.740.2285
Residual8.285 × 101471.184 × 1014
Lack of Fit4.980 × 101459.960 × 10130.60270.7199
Pure Error3.305 × 101421.652 × 1014
Cor Total1.518 × 101616
R2 = 0.9454Adjusted R2 = 0.8752
Table 5. ANOVA results of the presented model (quadratic model) for elongation at break.
SourceSSDFMSF-Valuep-Value
Model15,087.1791676.356.980.0089Significant
A—Extruder temperature10,240.96110,240.9642.670.0003Significant
B—Raster angle103.781103.780.43240.5318
C—Infill percentage674.631674.632.810.1375
AB9.2819.280.03870.8497
AC886.941886.943.700.0960
BC215.401215.400.89740.3750
A221.22121.220.08840.7749
B2830.901830.903.460.1051
C22171.3612171.369.050.0197Significant
Residual1680.217240.03
Lack of Fit1238.915247.781.120.5331
Pure Error441.292220.65
Cor Total16,767.3816
R2 = 0.8998Adjusted R2 = 0.7710
Table 6. ANOVA results of the presented model for part weight.
SourceSSDFMSF-Valuep-Value
Model0.001690.0002113.98<0.0001Significant
A—Extruder temperature0.000010.000012.840.0089Significant
B—Raster angle3.432 × 10−613.432 × 10−62.200.1819
C—Infill percentage0.001410.0014906.28<0.0001Significant
AB5.685 × 10−615.685 × 10−63.640.0981
AC2.491 × 10−712.491 × 10−70.15940.7016
BC2.677 × 10−612.677 × 10−61.710.2318
A20.000110.000149.080.0002Significant
B27.950 × 10−617.950 × 10−65.090.0587
C20.000010.000017.020.0044Significant
Residual0.000071.562 × 10−6
Lack of Fit8.978 × 10−651.796 × 10−61.840.3891
Pure Error1.956 × 10−629.782 × 10⁻⁷
Cor Total0.001616
R2 = 0.9932Adjusted R2 = 0.9845
Table 7. ANOVA results of the presented model for the ratio of the maximum failure load to part weight.
SourceSSDFMSF-Valuep-Value
Model8.366 × 10−899.296 × 10−914.500.0010Significant
A—Extruder temperature4.058 × 10−814.058 × 10−863.28<0.0001Significant
B—Raster angle3.946 × 10−913.946 × 10−96.150.0422Significant
C—Infill percentage2.549 × 10−812.549 × 10−839.750.0004Significant
AB9.811 × 10−1119.811 × 10−110.15300.7073
AC1.347 × 10−911.347 × 10−92.100.1906
BC1.088 × 10−1211.088 × 10−120.00170.9683
A25.596 × 10−1315.596 × 10−130.00090.9773
B27.079 × 10−917.079 × 10−911.040.0127
C21.119 × 10−911.119 × 10−91.740.2281
Residual4.489 × 10−976.413 × 10⁻¹⁰
Lack of Fit1.697 × 10−953.394 × 10−100.24310.9121
Pure Error2.792 × 10−921.396 × 10⁻⁹
Cor Total8.815 × 10−816
R2 = 0.9491Adjusted R2 = 0.8836
Table 8. ANOVA results of the presented model (quadratic model) for build time.
SourceSSDFMSF-Valuep-Value
Model1.302 × 10−2391.446 × 10−244.760.0258Significant
A—Extruder temperature9.124 × 10−2719.124 × 10−270.03010.8673
B—Raster angle9.083 × 10−2519.083 × 10−252.990.1273
C—Infill percentage3.430 × 10−2413.430 × 10−2411.300.0121Significant
AB2.468 × 10−2512.468 × 10−250.81310.3972
AC2.468 × 10−2512.468 × 10−250.81310.3972
BC1.597 × 10−2511.597 × 10−250.52610.4918
A21.164 × 10−2411.164 × 10−243.830.0911
B25.105 × 10−2515.105 × 10−251.680.2358
C27.030 × 10−2417.030 × 10−2423.160.0019Significant
Residual2.125 × 10−2473.036 × 10−25
Lack of Fit2.125 × 10−2454.250 × 10−25
Pure Error0.000020.0000
Cor Total1.514 × 10−2316
R2 = 0.8596Adjusted R2 = 0.6792
Table 9. Constraints and criteria applied to the numerical optimization of the parameters of the FFF process.
Parameter or ResponseRange/GoalLower LimitUpper LimitImportance
Extruder temperature (°C)Within range260220-
Raster angle (degrees)Within range900-
Infill percentage (%)Within range5515-
Criteria Set 1Maximum failure load (N)Maximize5153603
Elongation at break (mm)Maximize258158.333
Part weight (g)Minimize5.694.353
Ratio of the MFL to PW (N/g)Maximize102.1965.57383
Build time (s)Minimize315530203
Criteria Set 2Maximum failure load (N)Maximize5153605
Elongation at break (mm)Maximize258158.335
Part weight (g)Minimize5.694.352
Ratio of the MFL to PW (N/g)Maximize102.1965.57385
Build time (s)Minimize315530202
Criteria Set 3Maximum failure load (N)Maximize5153603
Elongation at break (mm)Maximize258158.333
Part weight (g)Minimize5.694.355
Ratio of the MFL to PW (N/g)Maximize102.1965.57383
Build time (s)Minimize315530205
Table 10. The results of numerical optimization.
SolutionExtruder Temperature
(ET)
Raster Angle
(RA)
Infill Percentage
(IP)
Maximum Failure Load
(MFL)
Elongation at Break
(E)
Part Weight
(PW)
Ratio of the MFL to PW
(Ratio)
Build Time
(BT)
Composite Desirability (D)
1220.0000.00015.000511.436321.0864.400124.6253015.7830.988
2220.0000.00015.003511.438321.0714.400124.6273015.7720.990
3220.0000.00015.000511.435321.0874.400124.6243015.7840.986
Disclaimer/Publisher’s Note: The statements, opinions and data contained in all publications are solely those of the individual author(s) and contributor(s) and not of MDPI and/or the editor(s). MDPI and/or the editor(s) disclaim responsibility for any injury to people or property resulting from any ideas, methods, instructions or products referred to in the content.