Article

Fracture Characteristics and Tensile Strength Prediction of Rock–Concrete Composite Discs Under Radial Compression

1
School of Resources Environment and Safety Engineering, University of South China, Hengyang 421001, China
2
School of Resources and Safety Engineering, Central South University, Changsha 410017, China
*
Author to whom correspondence should be addressed.
These authors contributed equally to this work.
Mathematics 2024, 12(22), 3510; https://doi.org/10.3390/math12223510
Submission received: 2 October 2024 / Revised: 28 October 2024 / Accepted: 7 November 2024 / Published: 10 November 2024

Abstract

:
To investigate the fracture mechanism of rock–concrete (R–C) systems with an interface crack, Brazilian splitting tests were conducted, with a focus on understanding the influence of the interface crack angle on failure patterns, energy evolution, and RA/AF characteristics. The study addresses a critical issue in rock–concrete structures, particularly how crack propagation differs with varying crack angles, which has direct implications for structural integrity. The experimental results show that the failure paths in R–C disc specimens are highly dependent on the interface crack angle. For crack angles of 0°, 15°, 30°, and 45°, cracks initiate from the tips of the interface crack and propagate toward the loading ends. However, for angles of 60°, 75°, and 90°, crack initiation shifts away from the interface crack tips. The AE parameters RA (rise time/amplitude) and AF (average frequency) were used to characterize different failure patterns, while energy evolution analysis revealed that the highest percentage of energy consumption occurs at a crack angle of 45°, indicating intense microcrack activity. Moreover, a novel tensile strength prediction model, incorporating macro–micro damage interactions caused by both microcracks and macrocracks, was developed to explain the failure mechanisms in R–C specimens under radial compression. The model was validated through experimental results, demonstrating its potential for predicting failure behavior in R–C systems. This study offers insights into the fracture mechanics of R–C structures, advancing the understanding of their failure mechanisms and providing a reliable model for tensile strength prediction.

1. Introduction

Mining activities such as blasting and equipment vibration cause the formation of cracks, joints, bedding planes, and faults of various scales in R–C structures [1,2,3,4]. The existence of these defects results in complex mechanical properties and deformation behaviors, such as heterogeneity, discontinuity, and anisotropy, which seriously affect the safety of underground mining activities. The investigation on the mechanical performances of R–C structures with an interface crack is important to the safe operation of concrete structure–bedrock systems in civil and mining engineering [5,6].
To investigate the strength and failure mechanisms of R–C interfaces, scholars have studied this extensively [7,8]. Shames et al. [9] monitored the fracture process of rock–mortar disc specimens using acoustic emission (AE) and digital image correlation (DIC). Damage inside the mortar appeared at lower load levels, while damage in the rock occurred at higher load levels. The DIC results showed that the deformation characteristics of rock and mortar significantly affected the strain distribution at the interface, and, when there was a significant difference in strain rate between rock and mortar, it caused failure along the interface. Yu et al. [10] prepared R–C specimens with a natural roughness interface and performed tests on the specimens under different loading angles (θ). It was found that the loading angle had a greater impact on the mechanical properties of the specimens than the interface roughness. The peak load increased with an increasing loading angle. When the θ < 60°, the peak strength increases fast, while, when the θ > 60°, the peak strength increases slowly. To study the effect of inclined interfaces on the damage characteristics of R–C specimens, Levent et al. [11] conducted splitting tests on specimens with different interface inclination angles (θ). The result found that when θ ranged from 30 to 60°, the specimens were mainly failures along the interface. For θ = 45°, the specimens were subjected to mixed interface and splitting failure; while, for θ > 45°, the specimens mainly fail by splitting. The above findings provide valuable experience in the study of R–C interfaces.
For reasons of the rock surface roughness and construction condition limitations, it is difficult for the rock and concrete surfaces to completely adhere, resulting in the appearance of cracks. The presence of cracks seriously affects the stability of the structure. Therefore, scholars have studied the impact of cracks on the mechanical properties and deformations of the structure through experimental and numerical simulation methods [12,13,14]. By examining the evolution of interfacial cracks in brittle R–C materials during the tensile failure process, Chang et al. [15] discovered that for brittle R–C structures in rock engineering, their stability depends not only on cracks but also on the entire performance of the R–C. Aranda et al. [16] performed a series of tests on bi-material disc specimens with an interface crack and obtained the fracture energy evolution law for mixed fracture modes. To study the effect of pre-existing cracks on the crack extension, Aliabadian et al. [17] performed a test on disc specimens with a prefabricated crack. It was found that when the loading angle α = 0° (loading direction is perpendicular to the crack direction), the new cracks were generated from the prefabricated crack interior instead of the crack tips. Whereas, when α ranges from 15° to 90°, the cracks arise from the tips of the prefabricated cracks and extend towards the loading points. Yu et al. [18] conducted numerical simulation tests on sandstone disc specimens containing a central flaw using a modified smoothed particle hydrodynamics (SPH) method. It is revealed that the presence of the flaw greatly reduces the load-carrying capacity. The strength of the specimens increased and then decreased with the increase in the flaw angle, where the specimens with a flaw angle of 60° had the lowest strength. Regarding the mechanical behaviors of materials with a crack, scholars mainly concentrated on strength (tensile, compression, and shear), displacement, and stress, utilizing fracture mechanic theory to explore the deformation characteristics of fissured materials with varying geometries and loading conditions [19,20,21]. The above research is crucial for enriching the comprehension of the mechanical performance of cracked materials. However, the above studies have only carried out phenomenological studies on the mechanical properties and deformation characteristics of materials with cracks and have not conducted deeper mechanistic studies from the perspective of the fracture damage constitutive model.
To further study the damage mechanics of cracked materials, scholars performed numerous investigations on the fracture damage constitutive model [22,23,24,25]. Kawamoto et al. [26] first proposed an anisotropic damage model for describing the effect of joints on rocks. Chen et al. [27] derived damage variables considering crack extension length and joints’ friction effect by combining the strain energy principle and fracture damage theory, established the constitutive model of rock under coupled macroscopic and microscopic damage conditions, and verified the reasonableness of the model. Pan et al. [28] developed an intrinsic structure model considering microscopic damage and macroscopic damage, which applies to single-fracture rock under coupled hydrochemical and uniaxial compression conditions. Xia et al. [29] analyzed the effect that crack angle has on mechanical performance, fracture pattern, energy properties, and fracture process. A damage constitutive model with coupled microfractures and macrofractures was also developed based on strain energy theory. It should be noted that the above models are established on compressional damage of rocks, while the study of the tensile properties of rocks and their constitutive models is frequently neglected. In addition, the tensile strength of rock is less than the compressive strength, which is about 1/10 of the compressive strength [30]. The initiation, propagation, and extension of cracks are mostly caused by tensile force [31], so it is valuable for the study of materials in tensile damage state. However, most of the above studies were conducted on specimens in a compression state and not in a tension state.
In actual engineering, underground rock engineering problems such as rock fracture, slab settlement, and quarry collapse are mainly related to the initiation, propagation, and penetration of rock defects under tensile conditions [32,33,34]. Moreover, most of the free surfaces of the surrounding rock masses are subject to tension stresses after excavation for underground works, which severely affects the stability of underground work. Thus, it is valuable to study the deformation–damage evolution features of rocks for the stability evaluation of subsurface rock projects with theoretical and practical significance [35]. Liu et al. [36] analyzed the correlation between damage variables and strains and developed a constitutive model for simulating rocks under uniaxial tension conditions based on the Lemaitre assumption. The model can better describe the complete strain process of the rock under uniaxial tensile conditions and accurately grasp the nonlinear phase of the curve.
The previous studies provide valuable insights into the damage evolution of rocks under tensile conditions [37]. However, most of these investigations focused on single materials with cracks, leaving a gap in understanding the damage evolution of R–C structures featuring interface cracks under tensile conditions. Therefore, this work aims to explore the damage evolution laws in R–C disc specimens that contain a prefabricated interfacial crack subjected to radial compression. Load-displacement data were obtained through indoor experiments, and acoustic emission (AE) data were monitored using the PCI-2 equipment. Additionally, we analyzed how varying angles of the prefabricated interface cracks affect the strength and damage characteristics of the R–C specimens. The fracture mechanisms were assessed using the acoustic emission RA/AF parameters, while the energy dissipation characteristics during loading were also examined. By integrating fracture mechanics with statistical damage theory, we developed a tensile strength prediction model that encompasses both microscopic and macroscopic fractures, validating its effectiveness. This model enhances our understanding of the fracture mechanisms associated with the interplay of micro and macro damage in R–C specimens with prefabricated interface cracks.

2. Specimens and Equipment

2.1. Specimens Productions

The specimens are composed of rock and concrete. The rock is the sandstone from Sichuan, China. To maintain the consistency of the physical and mechanical properties of the sandstone, all the sandstone materials are taken from the same homogeneous texture of the parent rock. In contrast, the concrete ratio is adopted from the common ratio used in the mine production process [38,39]. The cementing material is 42.5R silicate cement, and mechanism sand of 2.9 fineness modulus is used. The mass ratio of cement–sand–water is 1:2:0.45, which is the ratio commonly used in mines. The mechanical parameters of sandstone and concrete are shown in Table 1. This experiment was processed by the artificial preparation method, as shown in Figure 1. In this paper, the crack length 2a = 32 mm, disc diameter R = 75 mm, and disc thickness T = 30 mm were considered [40]. Three duplicate specimens were prepared for each group to ensure the accuracy of the experimental data. Moreover, the peak tensile strength of three sets of replicate specimens was subjected to a mean value calculation, and then the stress-strain of the rock–concrete specimens closest to the mean value was selected for the study and analyzed.
The production procedure of the R–C disc specimens containing an interface crack is illustrated in Figure 1. First, cubic specimens with the length × width × height of 300 mm × 100 mm × 100 mm were cast in the standard mold. Subsequently, cylindrical specimens with a diameter ϕ = 75 mm were taken from the cubic specimens using a coring machine. Then, the cylindrical specimens were cut into disc specimens with a cutting machine; the surfaces of the discs were polished using a high-speed grinding machine; and the unevenness of the disc specimens was less than ±0.05 mm at both ends. Lastly, cracks with length and width of 2a = 32 mm and t = 1 mm, respectively, were prefabricated using wire-cutting equipment. This experiment considers seven types of disc specimens with θ of 0°, 15°, 30°, 45°, 60°, 75°, and 90°, respectively.

2.2. Test Scheme of the Specimens

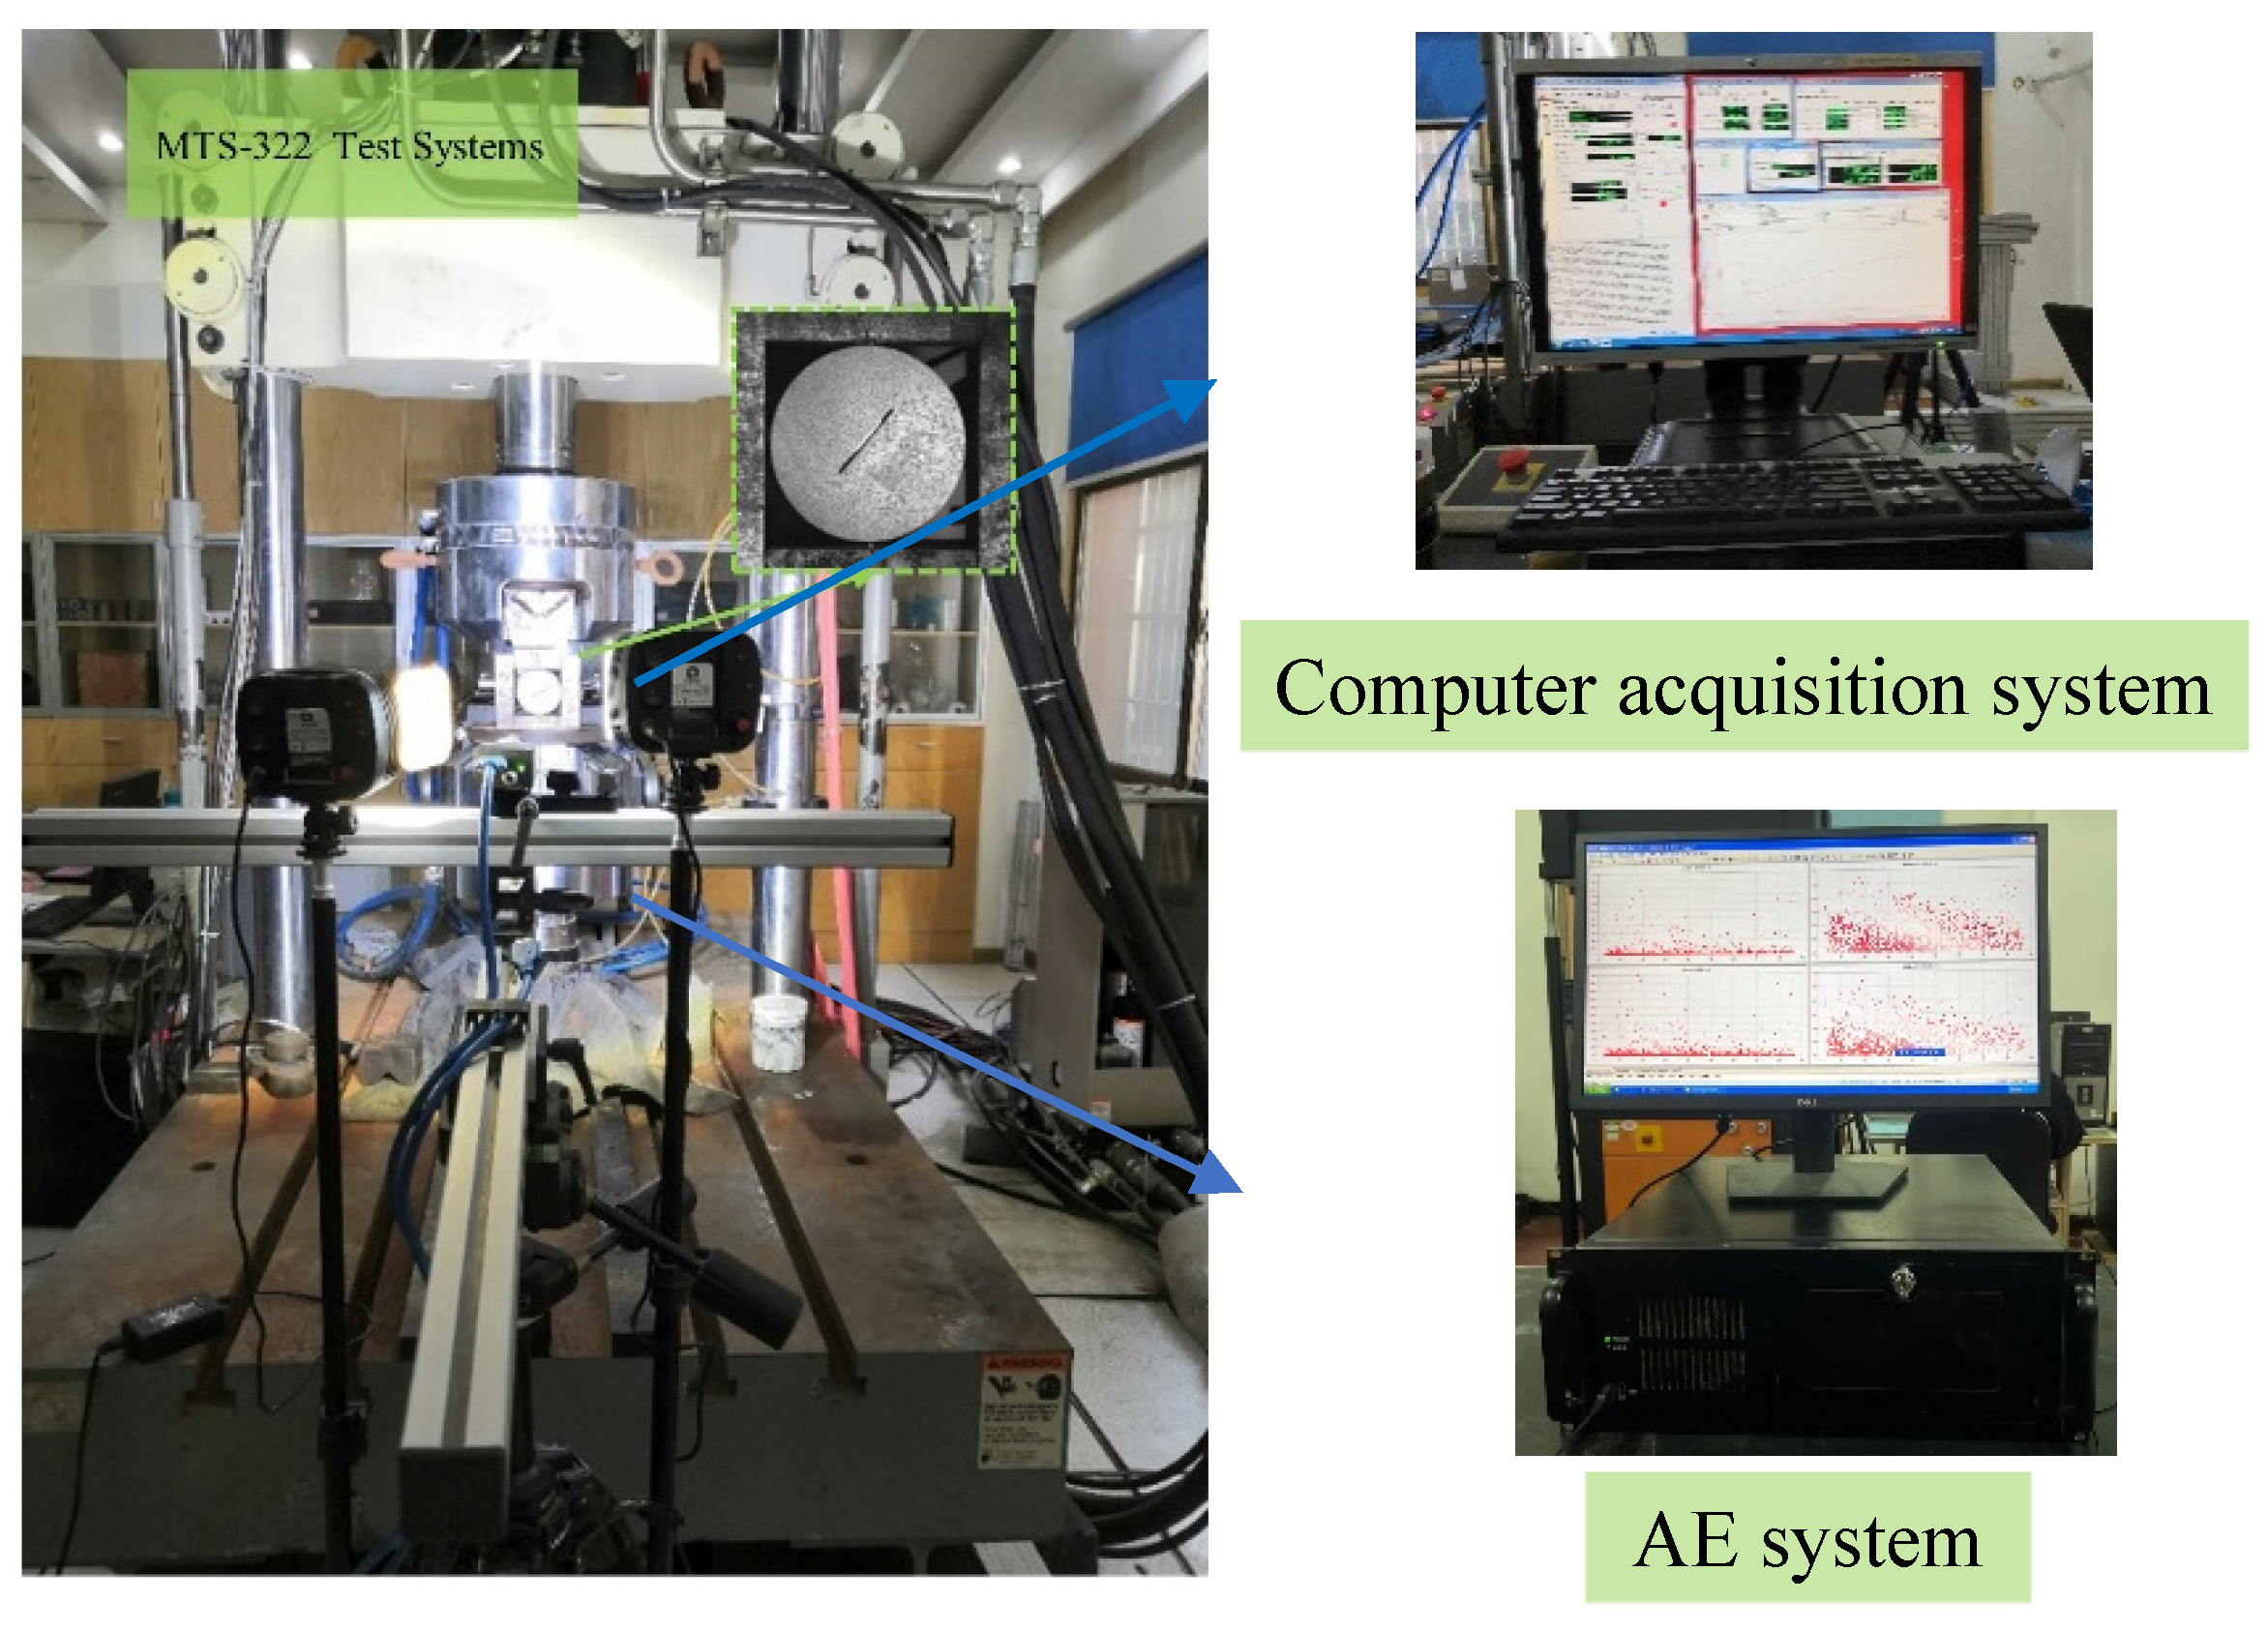
The loading equipment is the MTS-322 electro-hydraulic servo-controlled testing machine, as shown in Figure 2. It is controlled by displacement at a loading rate of 0.15 mm/min. The AE signal generated during the specimen is monitored using the PCI-2 acoustic emission system, and the threshold value of the AE signal is 35 dB to reduce the impact of current noise. The AE sensor samples were taken at a frequency of 10 MHz.

3. Results and Analysis

3.1. Analysis of Failure Paths

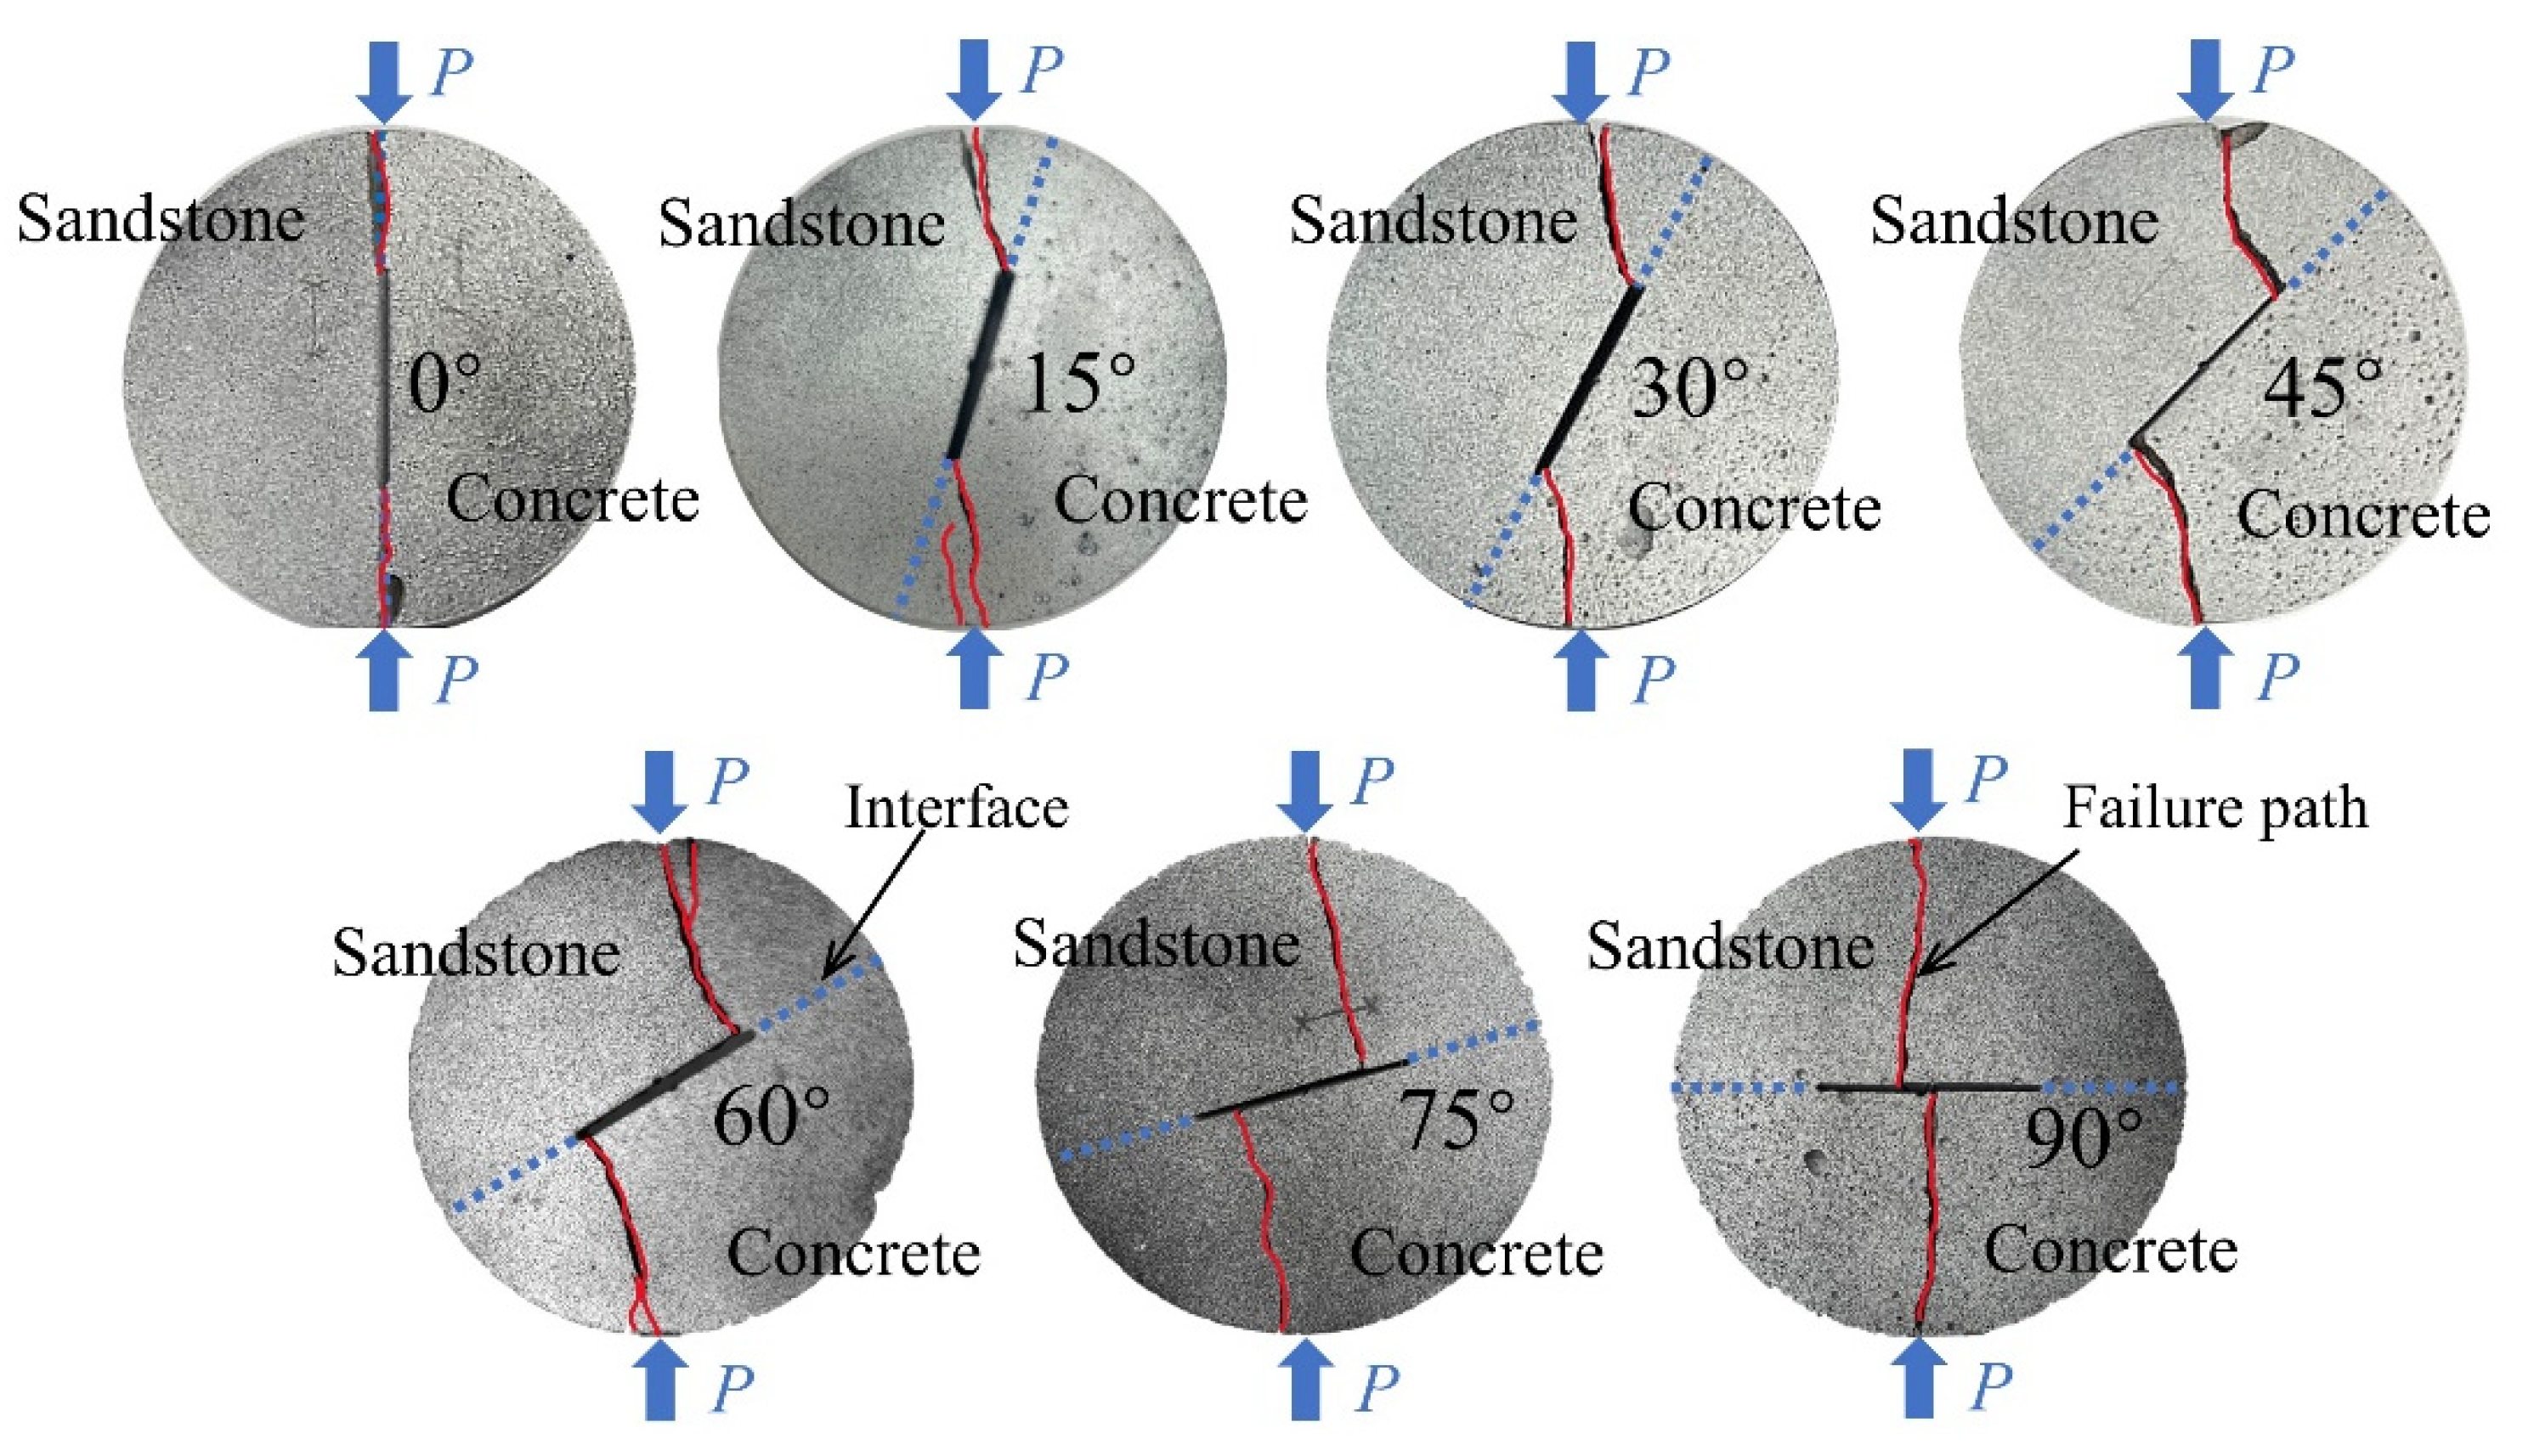
The failure paths of R–C disk specimens with varying θ are demonstrated in Figure 3 [41]. Sandstone and concrete are labeled in Figure 3 separately, where sandstone is smooth, and concrete is uneven. As shown in the figure, when the θ is 0°, the crack expands along the interface crack with a straight crack formed along the interface, which means the specimen suffers tensile fracture. This is due to the fact that the interface of the specimen is weaker when the inclination angle is 0°, so tensile fracture occurs along the interface. For the θ = 15°, 30°, 45°, 60°, and 75°, wing cracks appear and penetrate along the loading end direction, indicating tensile–shear fracture. This is because when the inclination angle is 15°, 30°, 45°, 60°, and 75°, cracks sprout near the interface crack tip, and smaller inclination angles are prone to interface shear slip. Under the combined effect of shear and tensile stresses, the wing fracture then extends to the loading end. As the θ increases to 90°, the failure path is perpendicular to the prefabricated crack and the specimens fail in tension, which is essentially the same as the failure path of a typical intact disc specimen. In this case, the loading direction is perpendicular to the interfacial crack and the specimen is mainly affected by the compressive stresses generated by the load. Since the tensile strength of rock and concrete materials is much lower than the compressive strength, the specimen undergoes tensile fracture along the loading direction. It is noteworthy that when the θ are 60°, 75°, and 90°, the cracks no longer propagate from the two tips of the interface crack.

3.2. Analysis of Stress–Strain Curves

For the specimen subjected to a radially concentrated load disc, it can be simplified to a planar problem. From the analytical solution of the elastic mechanics of the plane problem, the stresses on the line between two loading points in the disk can be calculated using Equation (1) [42]:
σ x = 2 P π D T σ y = 2 P π D T 1 4 D 2 D 2 4 r 2
where P is the load; D is the disc diameter; T is the disc thickness; r is the distance of the calculation point from the center of the circle; σx is the tangential positive stress; σy is the radial positive stress.
Therefore, for the disc specimen, the nominal tensile stress ( σ ¯ t ) can be calculated by Equation (2) [43,44]:
σ ¯ t = 2 P / π D T
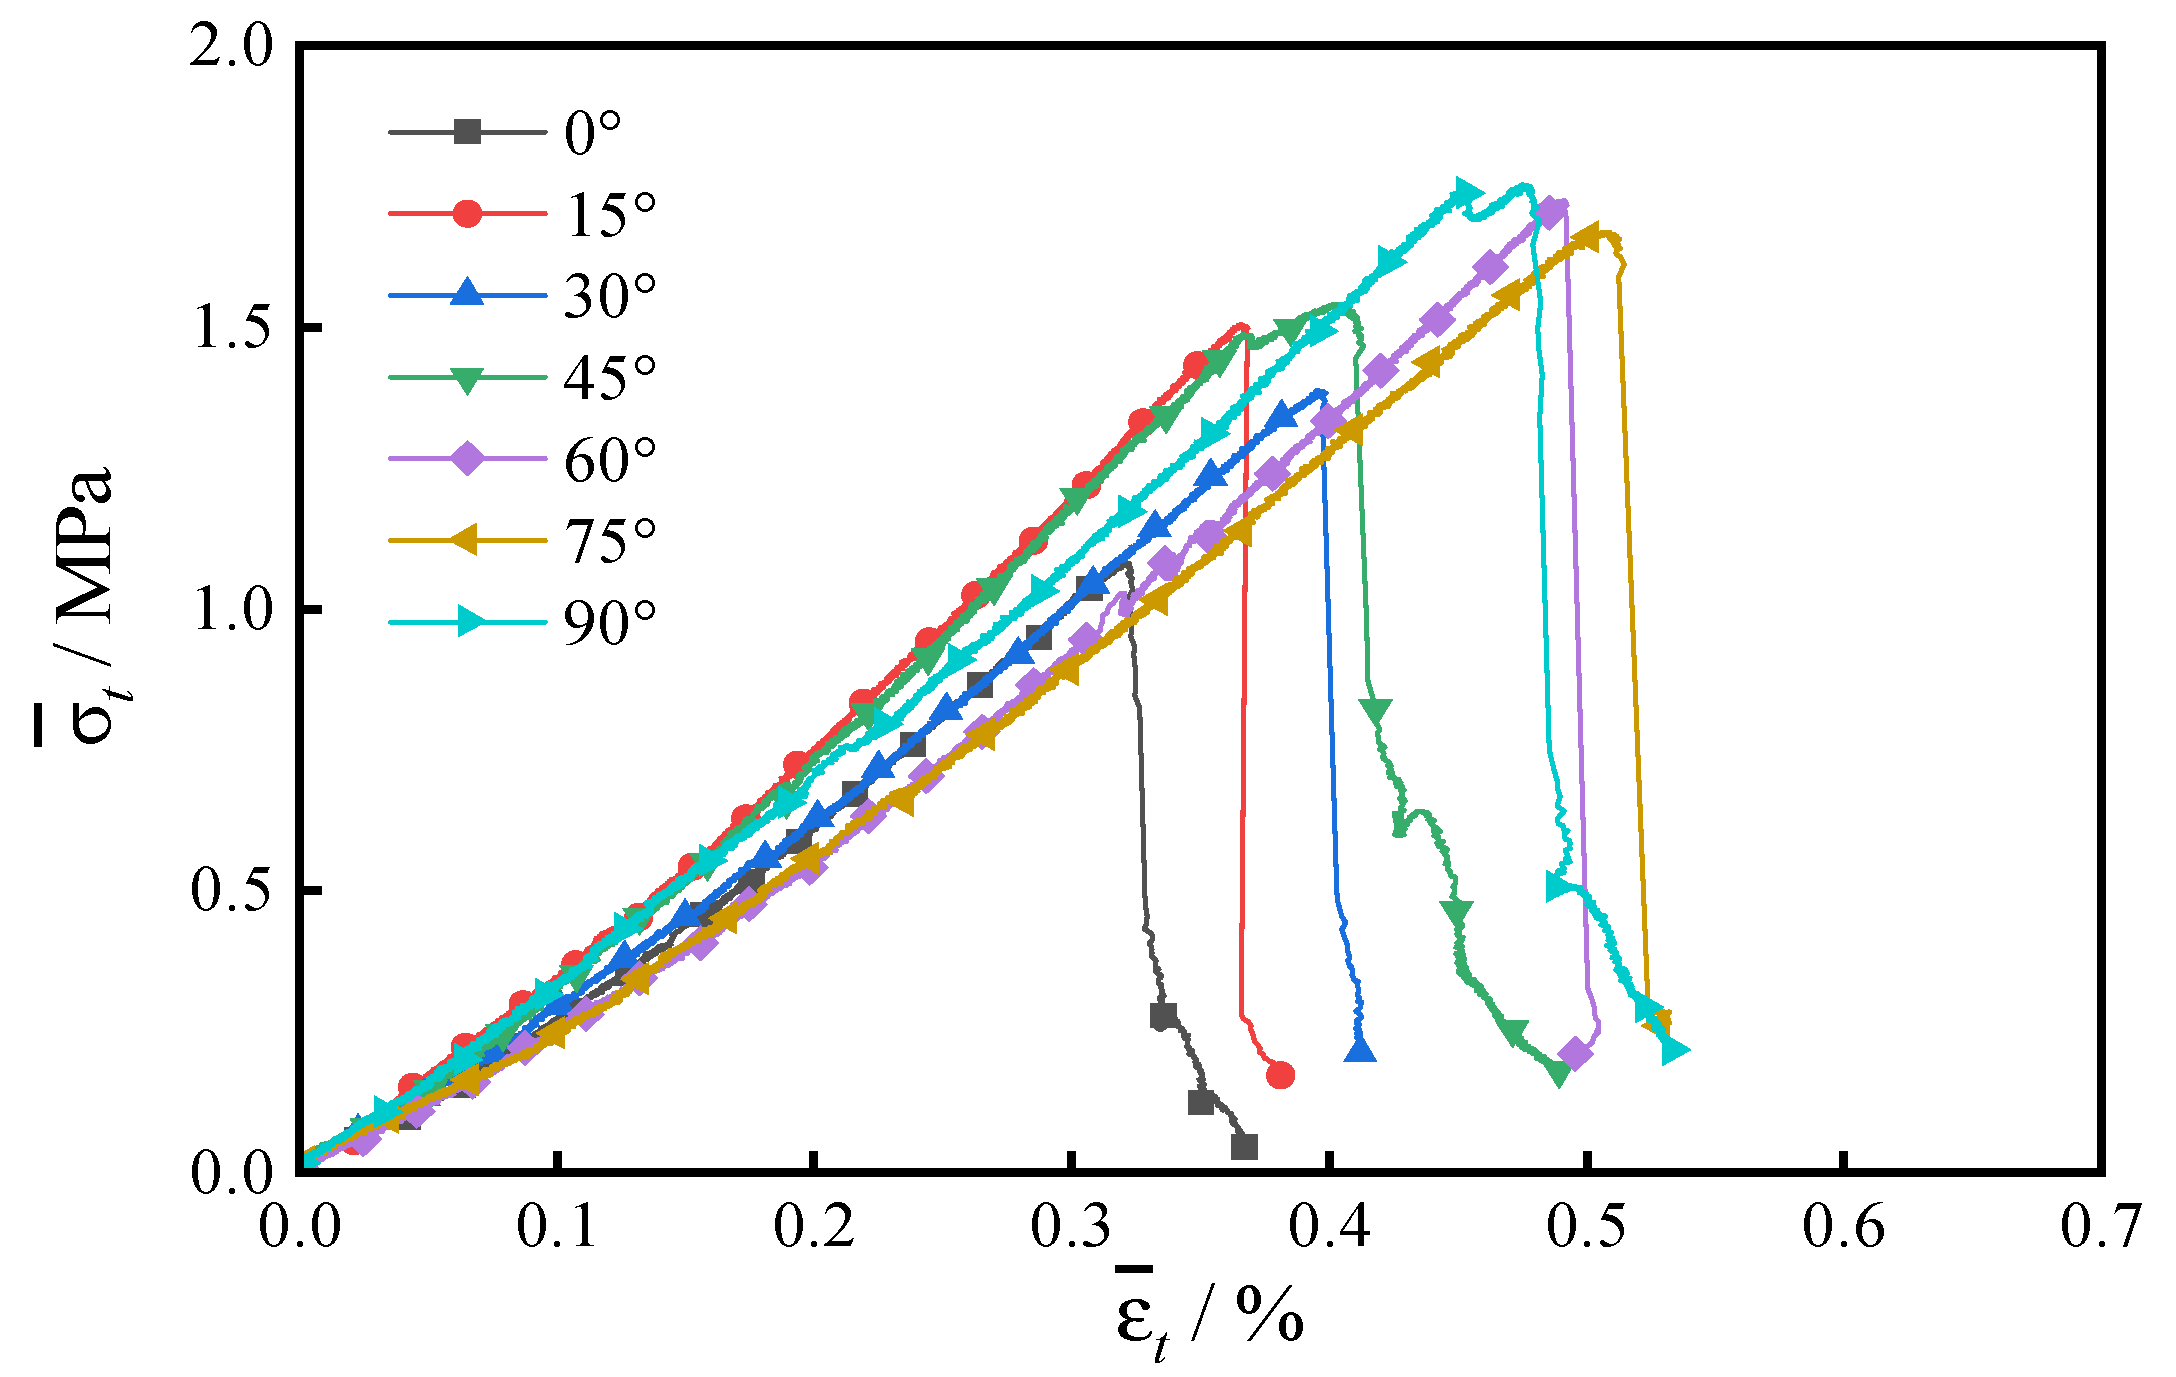
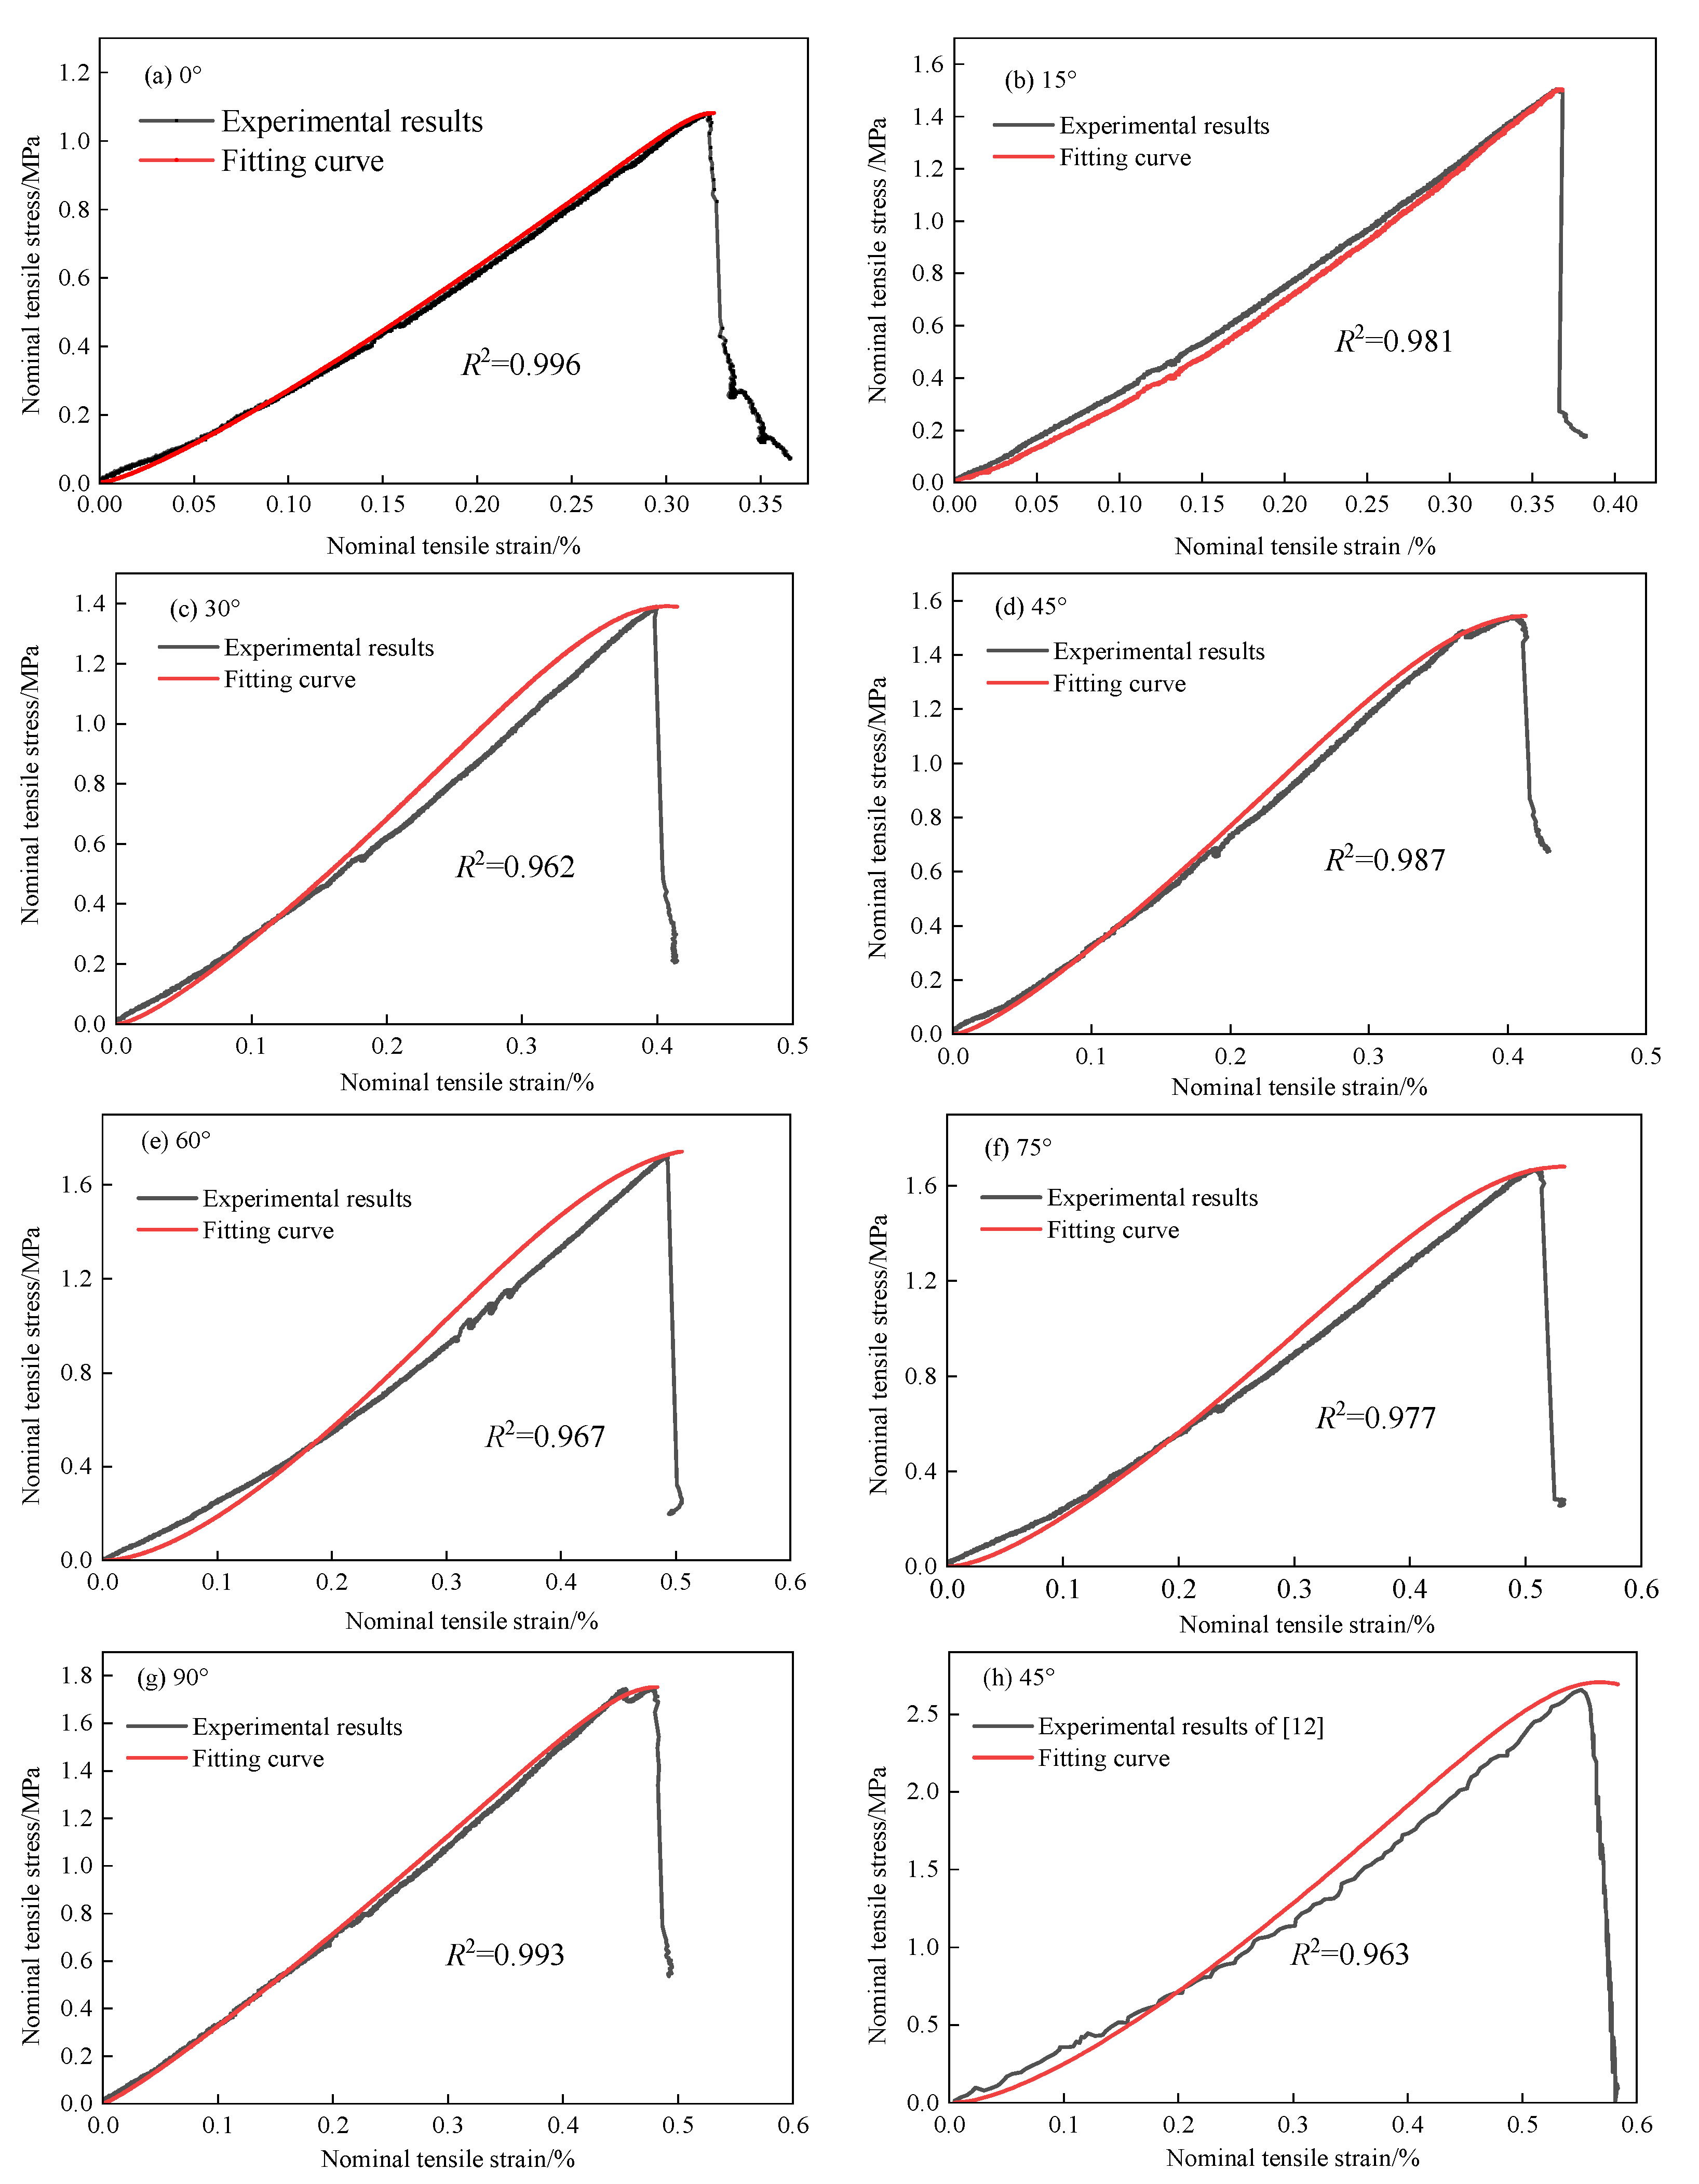
The σ ¯ t ε ¯ t (nominal tensile strain) curves of R–C disc specimens containing varying θ are given in Figure 4. It is observed that the deformation characteristics of the specimens with different θ can all be classified into compression-dense, linear elastic, plastic, and damage stages. At the early stage of loading, the pores and microfractures in the disc specimens are compressed, and the σ ¯ t ε ¯ t curves show an upward concave branch. As the nominal stress increases, the disc specimens display obvious linear elasticity characteristics, and the σ ¯ t ε ¯ t curves display linear changes at this period. Before the maximum nominal tensile stress, the disc specimens show plastic deformation characteristics, and the crack expansion activity in the specimen is active currently. When the nominal stress reaches the maximum nominal value that disc specimens can bear, the nominal stress decreases rapidly, which indicates that the specimens are damaged sharply and rapidly, showing obvious characteristics of brittle damage and failure.
It can also be seen that three groups of R–C specimens can be divided by the nominal tensile strength [45]. The difference between the three groups is obvious. The first group, θ = 0°, has the lowest nominal tensile strength of 1.08 Mpa of all R–C specimens. The second group is for a θ range from 15° to 45°, which have similar nominal tensile strengths and propagate cracks in a wing-shaped pattern from the tips of interface crack. And when the θ > 45°, the strength does not have much difference. The highest nominal tensile strength of 1.75 Mpa was found at θ = 90°, while the lowest nominal tensile strength of 1.67 Mpa was found at θ = 75°.

3.3. Analysis of AE Features

The failure patterns of R–C disc specimens with different θ are essentially caused by the generation and accumulation of internal microscopic fractures, during which elastic waves are released outward, meaning that acoustic emissions are generated. Currently, the AE technique has become an effective method to investigate the failure mechanism and damage process of R–C specimens [46,47,48].
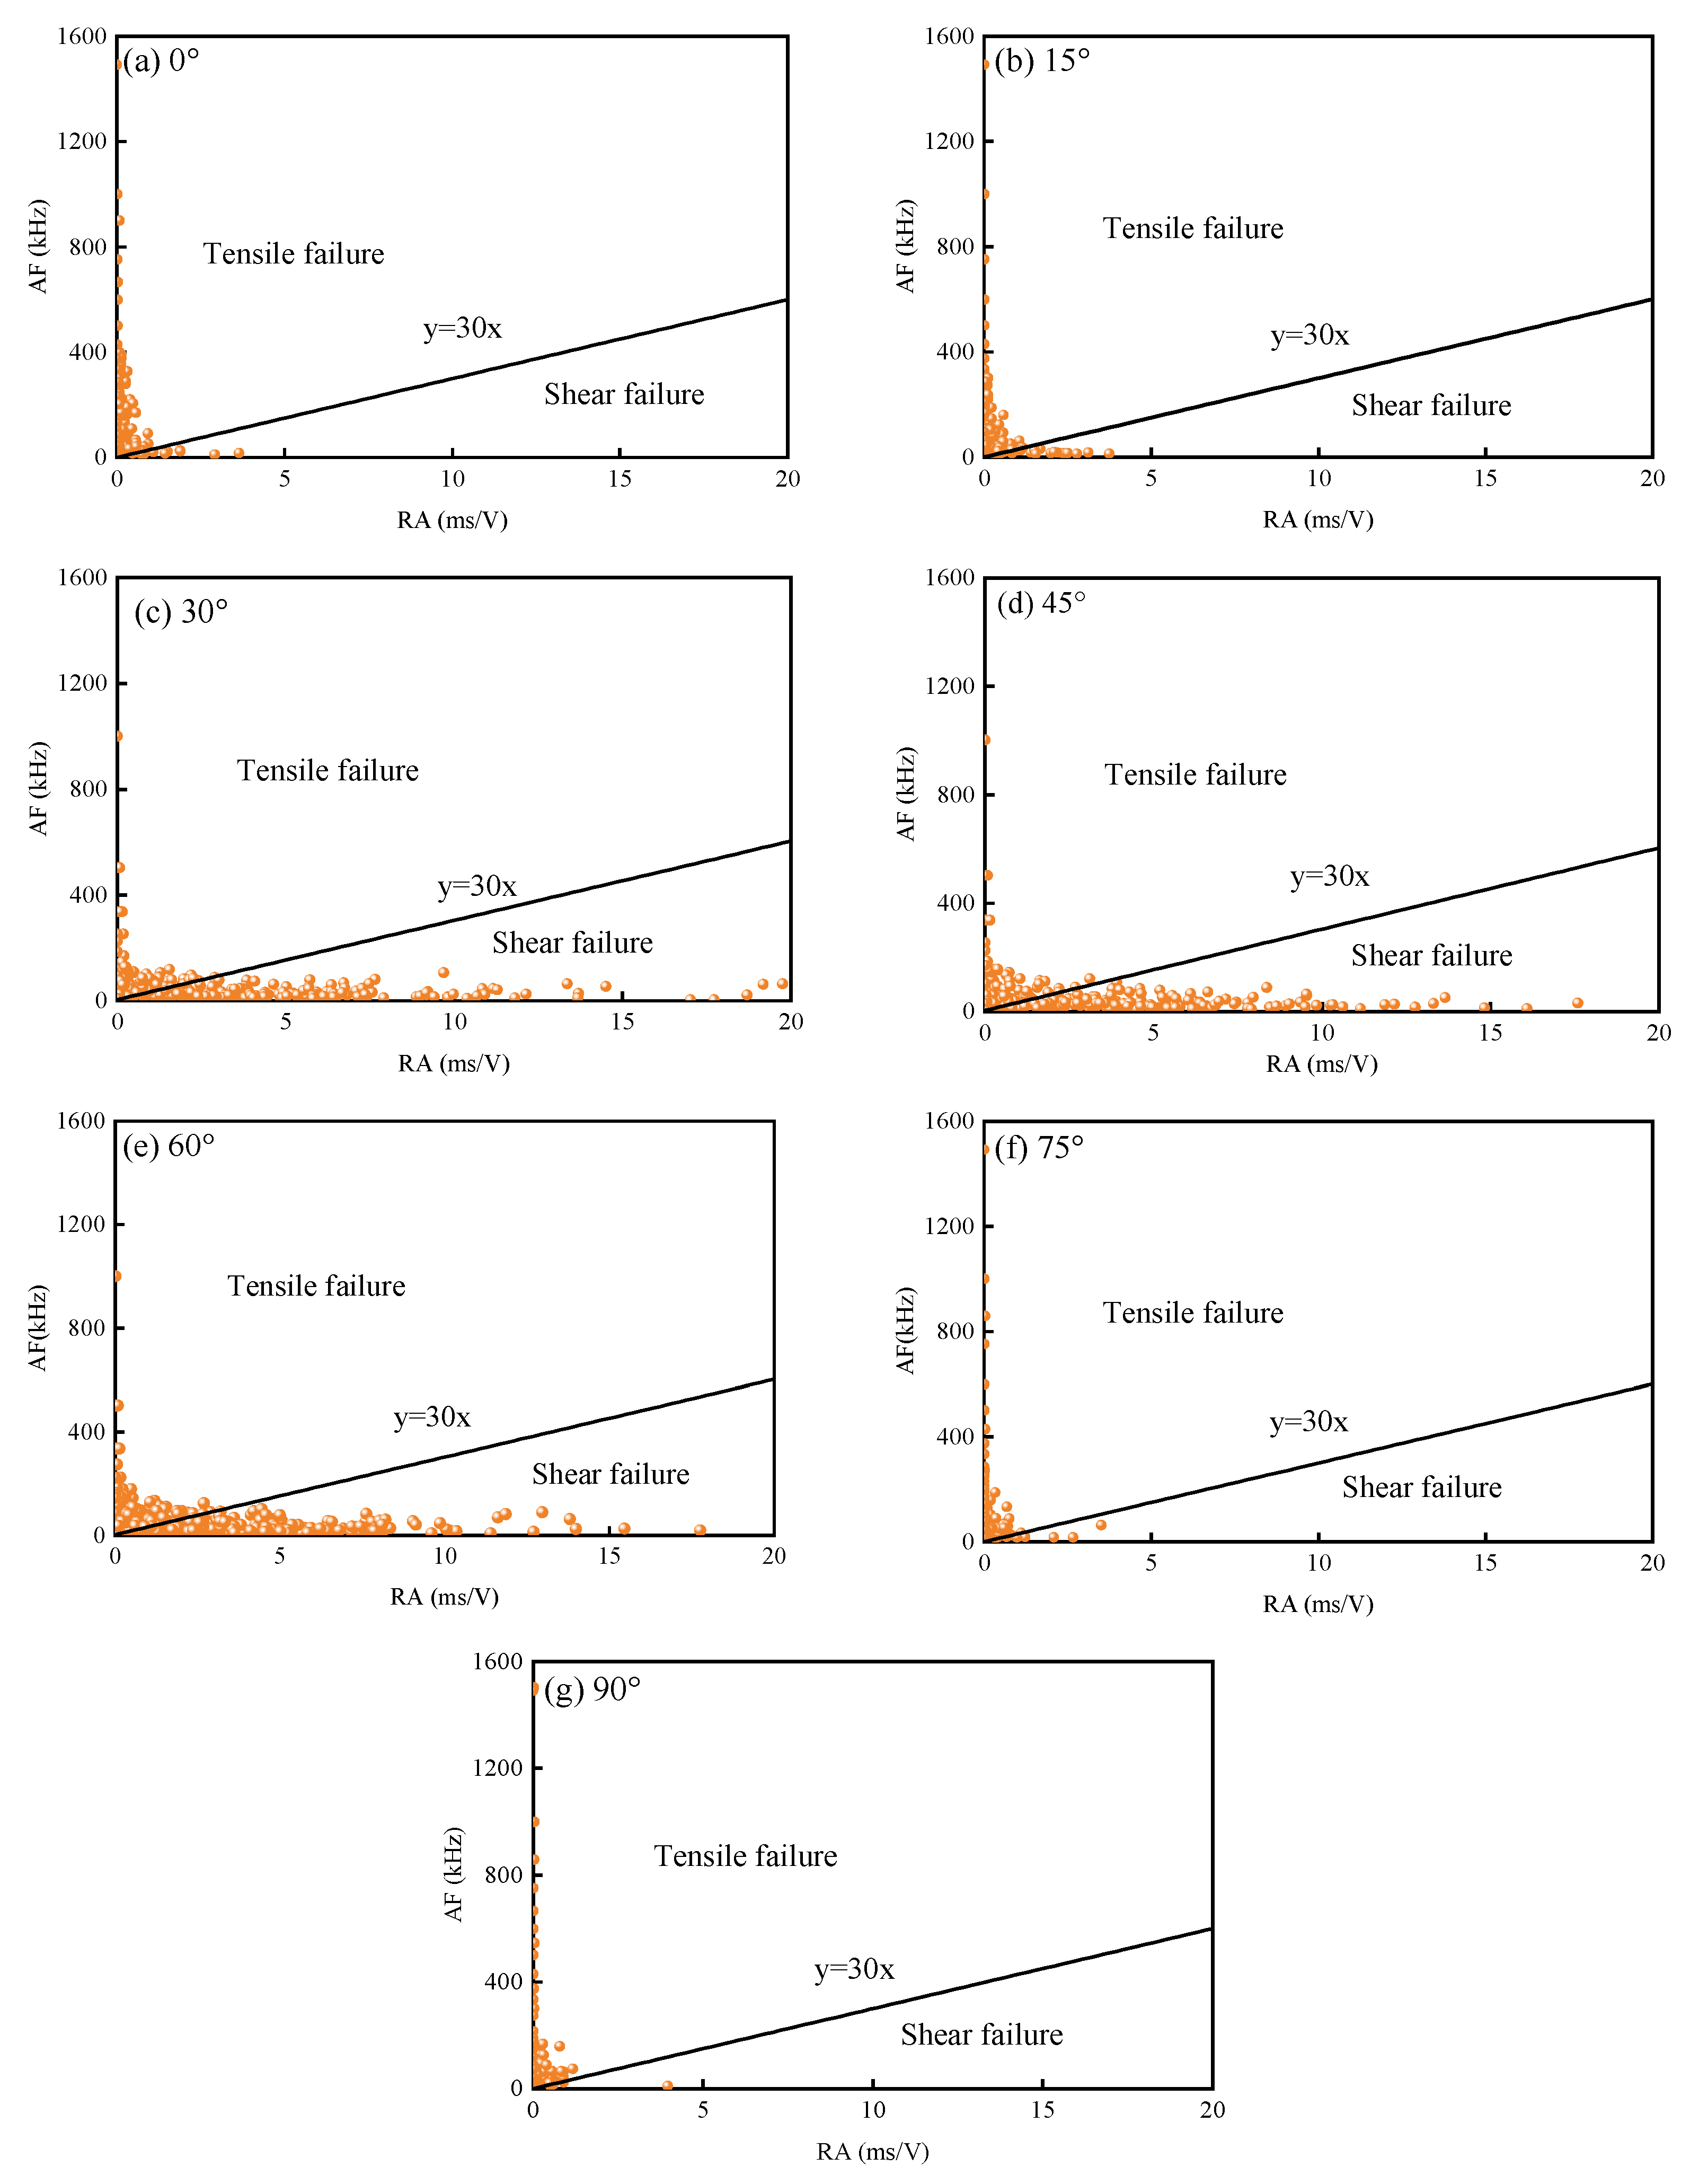
The AE signals resulting from cracks that sprout and expand under different failure mechanisms can also be significantly different. Among the statistical parameters of AE, RA/AF is commonly used to identify the mechanism of crack generation. In specimens subjected to load, the AE waveform formed by tensile cracks has a low rise time with high frequency, while the AE waveform formed by shear cracks has a long rise time with low frequency. Therefore, RA–AF can be used to analyze the causes and patterns of microcracks [49]. High AF and low RA correspond to tensile cracks, while low AF and high RA correspond to shear cracks, where RA = rise time/amplitude and AF = count/duration. For splitting of tensile and shear cracks, different values are taken under different loading conditions, which is generally taken as RA/AF = 1/30 in tensile and shear tests, so RA/AF = 1/30 is taken in this paper [50]. Figure 5 shows the RA–AF distributions of R–C disc specimens with different θ.
From Figure 5, the values of RA are mainly focused on the range of 0–20 ms/V, and the values of AF are mainly centered in the range of 0–1000 kHz for different θ. According to the distribution features of RA–AF, there are roughly two kinds of crack types in the specimens [50]: tensile cracks (θ = 0°, and 90°) and tensile–shear cracks (θ = 15°, 30°, 45°, 60°, and 75°). When θ = 0° and 90°, the tensile cracks in the specimens account for a larger proportion, meaning that most of the cracks are produced by tension. The tensile cracks in the specimen at θ = 0° are mainly concentrated around the interface, while the tensile cracks in the specimens at θ = 90° are mainly focused around the rock and concrete matrix. At θ = 15°, 30°, 45°, 60°, and 75°, the RA–AF is distributed in both tensile and shear cracks, resulting in a tensile–shear failure, indicating the presence of a mixture of tensile and shear cracks in the specimens. Based on Figure 5, it was found that specimens of 15° and 75° were dominated by tensile cracks. Moreover, the percentage of shear cracks was observed to be inversely proportional to the crack angle when the θ ranges from 30° to 60°. The highest percentage of shear cracks was observed in θ = 30°, which was 55.69%. As the crack angle increased, the percentage of shear cracks gradually decreased, with specimens of θ = 45° and θ = 60° exhibiting 48.84% and 45.45% shear cracks, respectively.

3.4. Analysis of Energy Dissipation

Energy input, accumulation, and dissipation are inextricably linked to the deformation and failure process of the specimens. The generation and expansion of fractures within the specimens are the results of energy dissipation, while the overall failure of specimens is the consequence of the sudden emission of accumulated energy. Hence, studying the deformation and failure process of the specimen by analyzing the energy change is meaningful. The main purpose of calculating the energy was to understand the effect of θ on the energy evolution characteristics of R–C disc specimens [51,52].
Supposing that there is no energy exchange between the specimen and the external environment in the loading process, the total energy U within a unit volume of the specimens is known to be the work resulting from the external environment on a unit volume of the specimens according to the first law of thermodynamics [53], which gives
U = U d + U e
where Ud is the dissipation energy density and Ue is the elastic strain energy density.
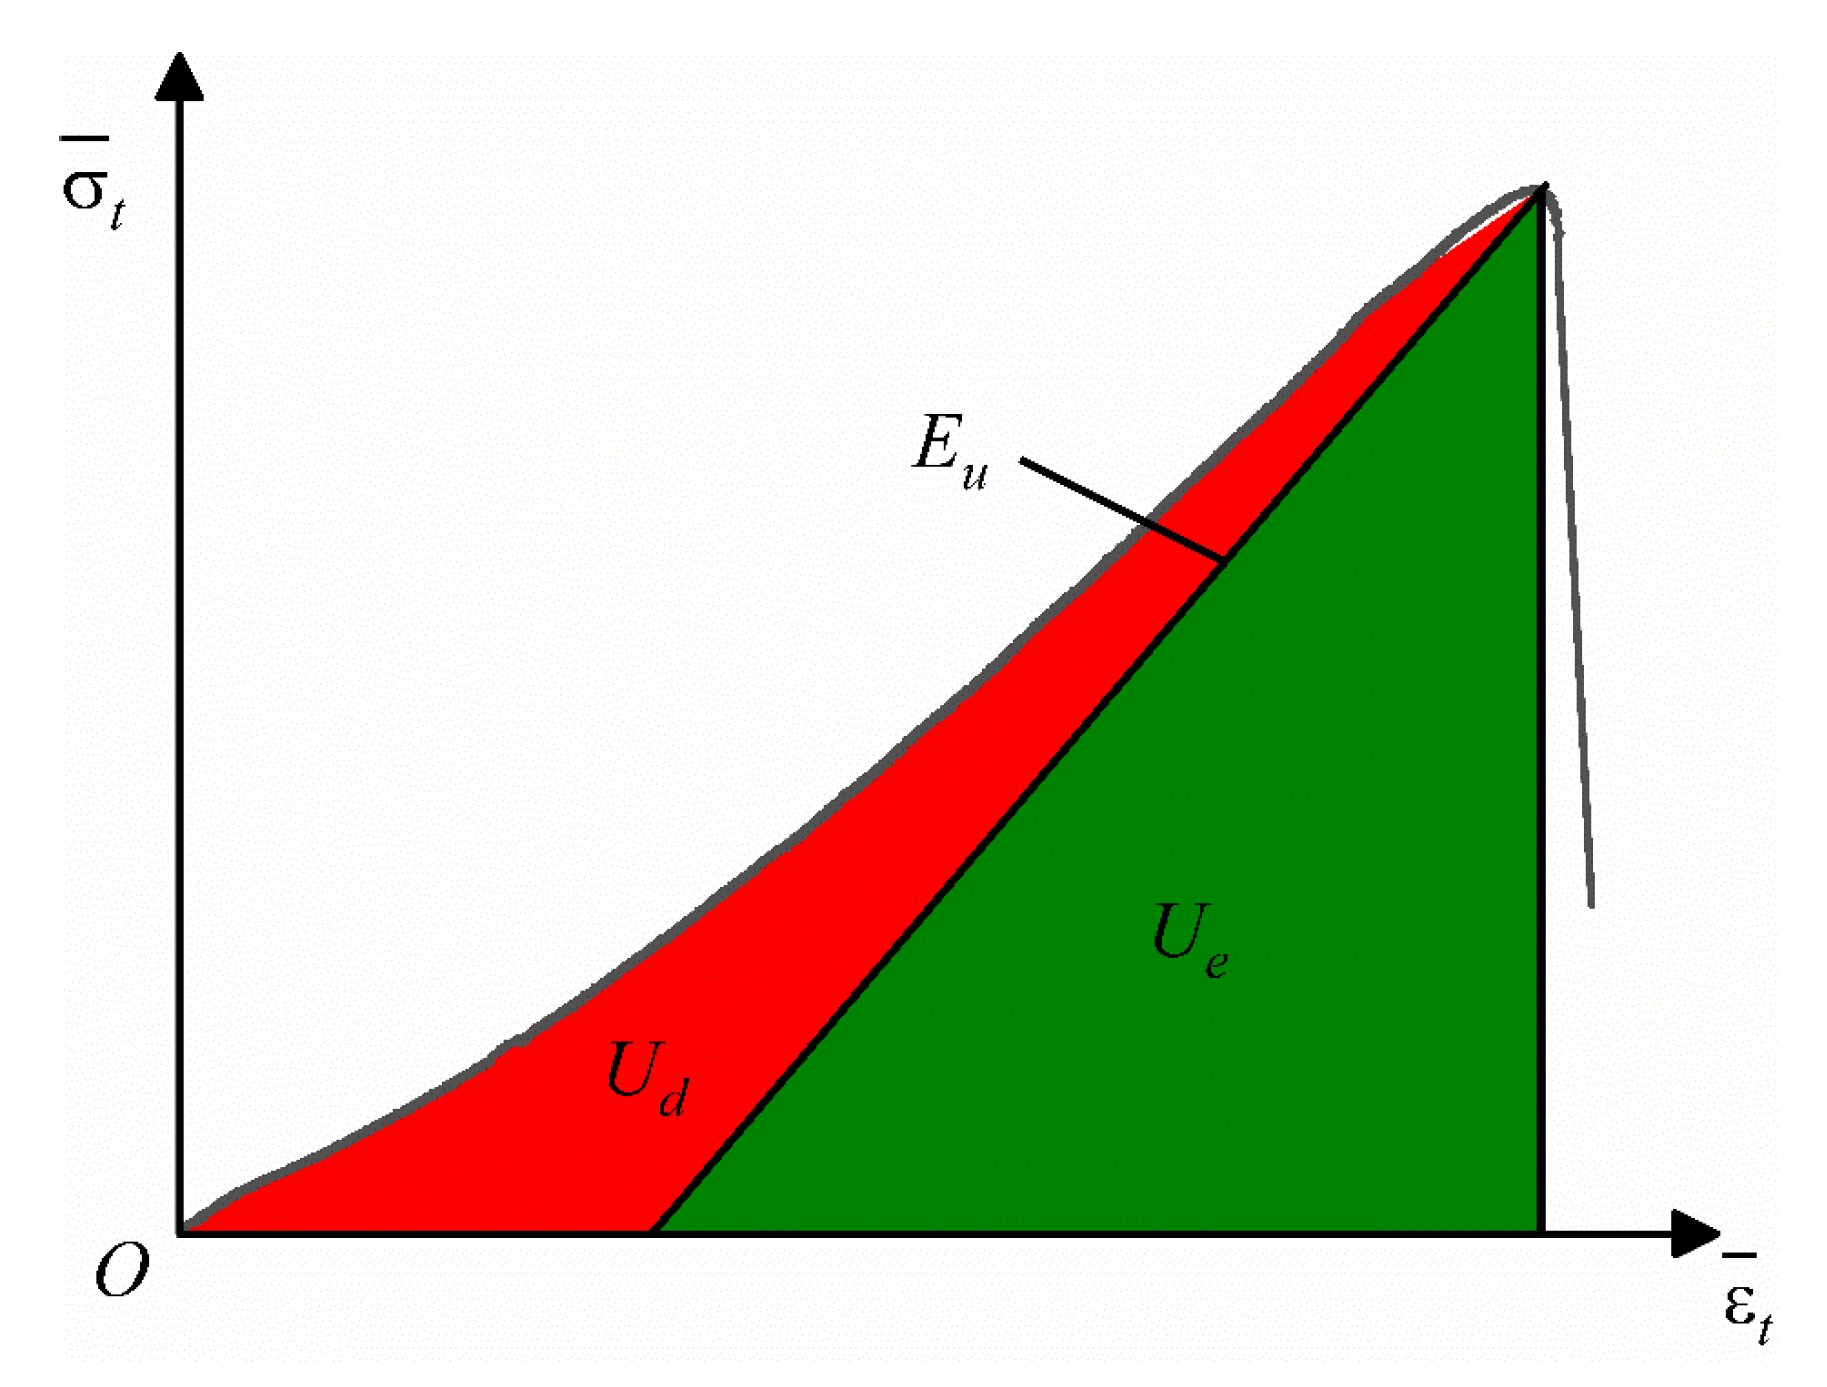
Figure 6 illustrates the correlation between the dissipative energy density and elastic strain energy density under the stress–strain curve. Previous studies [43] have shown that for R–C disc specimens, the difference between the tensile strength calculated by Equation (2) and the tensile strength obtained from numerical simulation is only 1.04%, indicating that the use of the nominal tensile strength to qualitatively compare the energy evolution characteristics of rock–concrete disc specimens at different θ is somewhat reliable. Since Brazilian splitting is axially pressurized, without the impact from the surrounding pressure, the total energy U of the per unit volume, the elastic strain energy density Ue, the dissipative energy density Ud, and the dissipative energy share Ud /U can be denoted by
U = 0 ε ¯ t σ d ε
U e = σ ¯ t 2 / 2 E u
U d = U U e
where Eu is the unloading modulus [54].
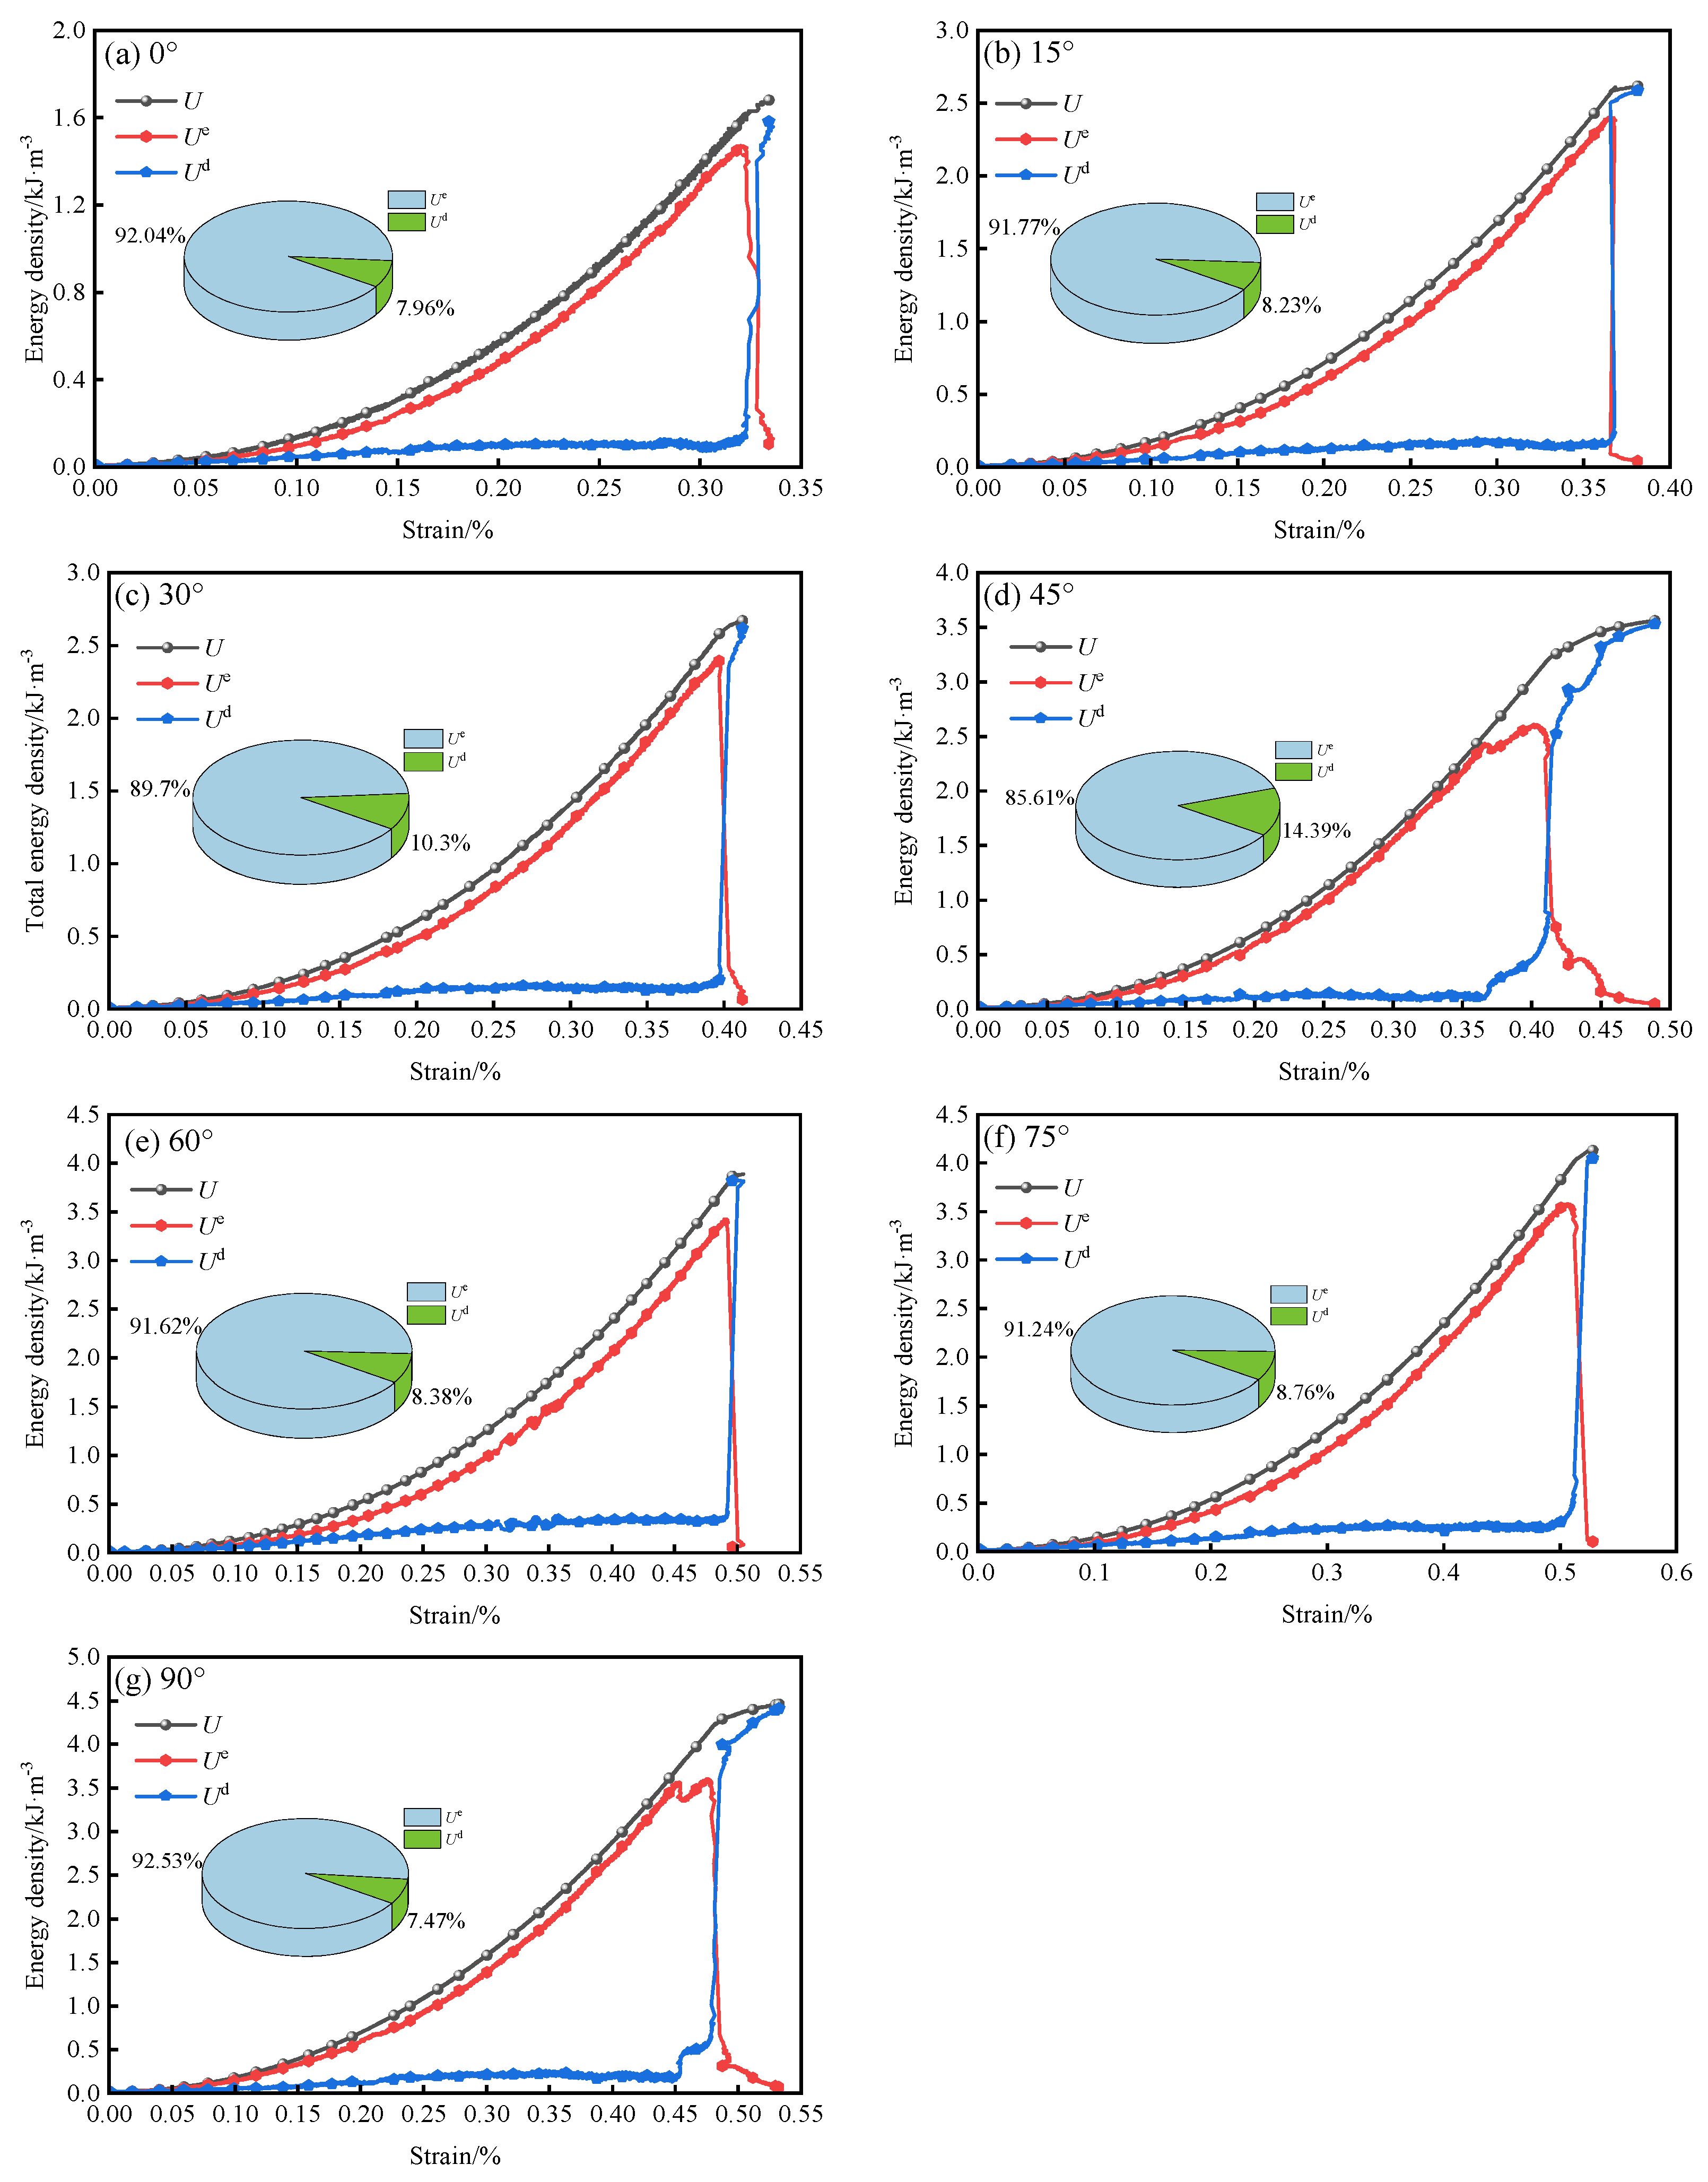
The values of U, Ue, and Ud at the peak strength of the R–C specimens with varying θ are given in Table 2. As indicated in Table 2, U and Ue at the peak intensity increase with the increasing θ, while the dissipative energy density increases and then decreases with the increasing θ.
The energy terms U, Ue, and Ud in the Brazil splitting failure process of R–C specimens at prefabricated cracks with different angles are calculated by the energy calculation equation, and relationships between the individual energy parameters and strain at different angles are shown in Figure 7.
It is noticed that the energy variation curves of the R–C specimens which have varying θ have similar shapes. At the early stage of loading, which is the compressive closure stage of the stress–strain relation, Ue and Ud of the specimens increase at about the same rate, which is attributed to the energy dissipation caused by the compacting of the primitive cracks and pores in the specimens. As the load increases, the stress–strain curve enters the linear elastic deformation stage. Ue of the specimen grows approximately linearly, and Ud growth is relatively small. In this stage, the energy is mainly stored in the specimen in the form of elastic strain energy. When the stress–strain curve enters the failure stage, Ud rises rapidly with the increase in strain, which is due to the development, expansion, and penetration of microcracks in the specimen with the increase in load, which consumes part of the energy. After reaching the peak stage, the cracks inside the specimens gather and penetrate, leading to the destruction of the specimen, and the massive elastic energy stored in the specimens is suddenly released. The elastic energy is converted into the dissipated energy due to the destruction of the specimen, while the elastic strain energy drops sharply, and the dissipated energy rises suddenly, which indicates a close connection between the change of energy characteristics in the specimen and the deformation and damage characteristics [55]. It is worth noting that the percentage of the dissipated energy Ud/U reaches the maximum at θ = 45°. This indicates that the maximum percentage of energy is consumed for microcrack development and extension, and the specimens are damaged most, at θ = 45°.

4. Analysis and Discussion of Tensile Strength Prediction Model

Assuming that the damage of the specimens containing a macroscopic prefabricated crack is mainly composed of two components: (1) The damage D1 induced by the randomly distributed microscopic cracks within the specimens. (2) The damage D2 caused by the macroscopic prefabricated cracks existing in the specimens.

4.1. Damage Caused by Microscopic Cracks

Numerous microfractures and microporosities exist in specimens, which are randomly distributed in the specimens and affect the deformations and physical and mechanical performances of the specimens significantly. For these microscopic defects, statistical damage mechanics can be utilized to study them. Assuming that the intensity of the micro-elements in the specimens follows the Weibull distribution, the probability density function is given by [56]
ϕ ( F ) = m F 0 ( F F 0 ) m 1 exp F F 0 m
where F denotes the micro-element intensity; m and F0 are the parameters of Weibull distribution.
Defining the damage variable caused by microscopic D1 defects as the ratio of the number of micro-element failures N1 to the total number N0, the statistical damage variable can be given as
D 1 = N 1 N 0
Combining Equation (7) with Equation (8), the damage variables of the specimens subject to the load can be expressed as
D 1 = 1 exp F F 0 m
Then, the associated constitutive equations are
σ = E t ε ( 1 D 1 )
The accurate determination of the strength of micro units is crucial in deciding whether the D1 can precisely reflect the damage caused by internal microcracks during loading. Thus, in this paper, the Drucker–Prager criterion is chosen to reflect the strength of rock micro units, since this criterion takes into account the compression and shear properties of the micro units, which can better describe its deformation behavior [57]. The strength variable F for the micro units of rock can be expressed as
F = sin ϕ E n ε 3 sin 2 ϕ + 9 + E n ε 3
At the peak stress, Equation (10) can be rewritten as
F p = sin ϕ E n ε p 3 sin 2 ϕ + 9 + E n ε p 3
where σp and εp are peak stress and peak strain, respectively.
Based on the slope of the stress–strain curve at the peak point being 0, it is concluded that
d σ d ε | σ = σ ¯ t , ε = ε ¯ t = 0
where σ ¯ t and ε ¯ t are the max nominal stress and max nominal strain of R–C specimens, respectively.
Substituting Equation (13) into Equation (10) yields that
m = 1 ln ( E t ε ¯ t / σ ¯ t )
F 0 = F p / ( m ) 1 / m

4.2. Damage Caused by Macroscopic Fractures

It is difficult and impractical to analyze the damage caused by the interface and the interface crack on the specimen individually; to avoid the above problems, the damage caused by the interface and the interface crack on the specimen is combined in this paper and analyzed from the energy point of view. For specimens containing a single macroscopic crack, it is difficult to analyze them accurately as the stress concentration at the crack tips. For this reason, the following assumptions are given for macroscopic single-crack specimens: (1) assuming that the shape of the crack is rectangular, and the surface is flat; (2) ignoring end effects, the stress on the surface of the fissure is considered to be uniform; (3) considering only the change of elastic strain energy. Based on the energy theory and fracture mechanics theory, the damage variables of the specimens containing macroscopic single fractures are established [27,30,58].
The incremental strain energy caused by macroscopic fractures can be expressed by uniaxial stress:
U 1 = V σ ¯ t 2 2 E t ( 1 D 2 ) σ ¯ t 2 2 E t
where V is the volume of specimens; D2 is the damage variable of a macroscopic single fracture.
Based on the calculation of the stress intensity factor for plane strain problems in fracture mechanics, the incremental strain energy of a specimen caused by a crack is calculated by
U 2 = 1 ν 2 E t 0 A ( K I c 2 + K II c 2 ) d A
where KIc and KIIc are the stress intensity factors at the crack tip, respectively; A is the crack surface area; I and II refer to mode I and mode II.
Because both U1 and U2 can characterize the strain energy increment caused by macroscopic fracture, they should be numerically equal, which gives
V σ ¯ t 2 2 E t ( 1 D 2 ) σ ¯ t 2 2 E t = 1 ν 2 E t 0 A ( K I c 2 + K II c 2 ) d A
The damage variable D2 for a specimen containing a single interface crack is given as follows:
D 2 = 1 1 + 2 ( 1 ν 2 ) V σ ¯ t 2 0 A ( K I c 2 + K II c 2 ) d A 1
For the stress intensity factor of a isotropic straight-cut slotted Brazilian disc specimen under load, an analytical solution to this typical fracture mechanics problem was given by Atkinson et al. [59]. The stress intensity factor can be estimated by the following Equations (20) and (21). The radius of the disc specimen R = 37.5 mm; the thickness T = 30 mm; the length of the crack 2a = 32 mm; the peak load is Pmax.
K I c = P max a π R T Y I ( 2 a / 2 R , θ )
K II c = P max a π R T Y II ( 2 a / 2 R , θ )
In order to clarify the basic principle of the J-integral method for calculating complex SIFs at the interface of two different materials, the theory of interface fracture elasticity is briefly introduced here. For a bi-material interface cracking problem under a plane strain condition, the relationship between the stresses (σ22 and σ12) and SIFs of the interface cracking stress field has the following form (Rice 1988) [60]:
σ 22 + i σ 12 = K I + i K II r i ε 2 π r
where i = 1 and ε is the oscillation index:
ε = 1 2 π ln ( 1 β 1 + β )
where β is a Dundurs’ parameter, which can be determined by
β = 1 2 G A ( 1 2 ν B ) G B ( 1 2 ν A ) G A ( 1 2 ν B ) + G B ( 1 2 ν A )
where G and ν are the shear modulus and Poisson’s ratio, respectively. Subscripts A and B represent two different materials.
The relation between the energy release rate (J-integral) and the SIFs can be defined by
G = 1 2 ( 1 β 2 ) 1 ν A 2 E A + 1 ν B 2 E B K 2
K = K Ι 2 + K Ι Ι 2
where YI and YII are dimensionless geometric coefficients related to the crack length ratio a/R and the loading angle θ [61]. YI and YII are calculated by numerical simulation in previous studies [62], as shown in Table 3. It should be noted that in a previous study [62], we used the finite element method to verify and determine the dimensionless stress intensity factor for rock–concrete disc specimens due to the simplicity and convenience of numerical simulation application, and, therefore, it is briefly described here.

4.3. Total Damage Caused by Coupling of Micro- and Macrofractures

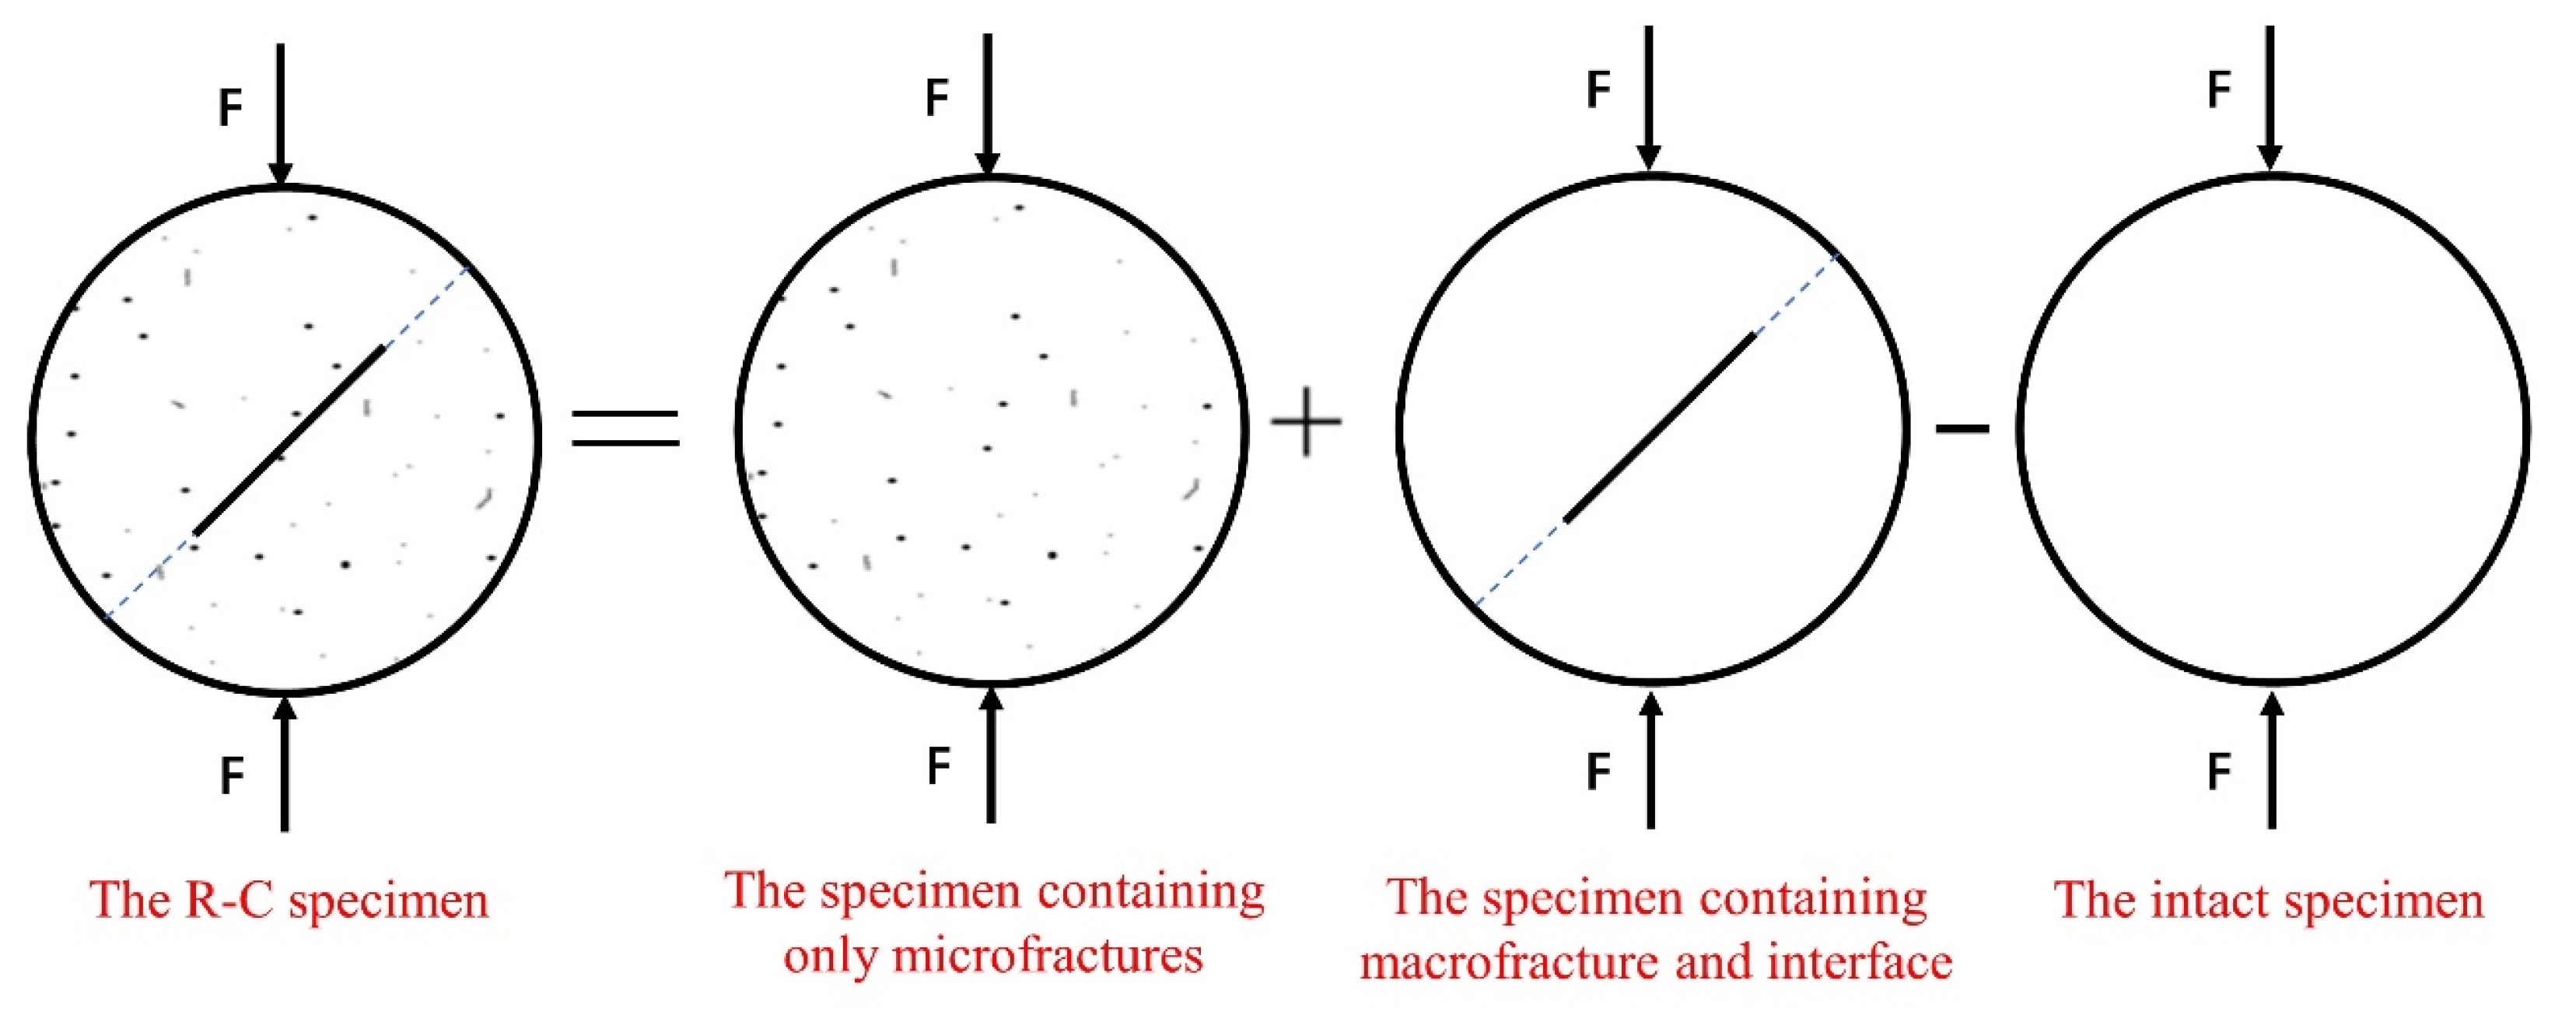
The damage to the specimens resulted from the coupling of macroscopic cracks and microscopic cracks. Consequently, the loading damage variation can be evaluated by coupling both types of damage by the Lemaitre strain equivalence assumption, as shown in Figure 8 [28].
ε = ε 1 + ε 2 ε 0
where ε is the strain derived from the coupled macroscopic and microscopic fractures in the specimens; ε1 is the strain resulting from microscopic fractures; ε2 is the strain generated by macroscopic fractures; ε0 is the strain of intact specimen.
Under uniaxial stress, the following is obtained:
ε = σ E t = σ E 1 + σ E 2 σ E 0
where E0 is the elastic modulus of the intact specimens; E1 is the elastic modulus of the microscopic crack specimens; and E2 is the elastic modulus of the macroscopic crack specimens.
From the standpoint of continuum damage mechanics, it is well known that
E t = E 0 ( 1 D t ) E 1 = E 0 ( 1 D 1 ) E 2 = E 0 ( 1 D 2 )
where Dt is the coupled macroscopic and microscopic crack damage variable.
Substituting Equation (29) into Equation (28), the coupling damage variables during loading can be obtained as follows:
D t = 1 ( 1 D 1 ) ( 1 D 2 ) 1 D 1 D 2
The constitutive model of the R–C specimens can be obtained by Equation (31) [29]:
σ = E t ( 1 D t ) ε
Combining Equation (30) with Equation (31), the tensile strength prediction model of the R–C specimens with an interface crack is obtained as follows:
σ = E t ( 1 D 1 ) ( 1 D 2 ) 1 D 1 D 2 ε
The stress–strain curves in the compaction stage show a concave shape. However, the established constitutive model is a convex function and fails to represent the compaction stage of the rock. To address this limitation, the compaction coefficient K is introduced, as follows [63]:
K = log n ( n 1 ) ε ε y + 1 ε < ε y 1 ε ε y
Here, n is a constant, which can be obtained by least squares fitting; εy is the yield strain. Since the specimen used in this paper is hard rock, εy can be replaced with εp [64]. The revised damage constitutive model is given as
σ = K E t ( 1 D 1 ) ( 1 D 2 ) 1 D 1 D 2 ε

4.4. Validation of the Tensile Strength Prediction Model

Figure 9 shows the experimental results and fitting curves for the R–C specimens that contain a prefabricated interfacial crack. The fitting curve is calculated through the above Equation (34). Moreover, to confirm the adequacy of the obtained reliability model, a comparative analysis with results of another author is essential. In this paper, the result of Zhou [65] is selected for comparison, and the results are presented in Figure 9e. As illustrated in Figure 9, the model effectively predicted the stress–strain behavior of the R–C specimens with the correlation coefficients R2 all greater than 0.95, which proves that the test results are in satisfactory agreement with the proposed tensile strength prediction model. However, since the structure is built based on the Weibull distribution of the micro-element strength and the Drucker–Prager (D–P) criterion, it cannot reflect the post-peak phase. In addition, although the model can be applied to both compression and shear cases, we have only verified the applicability of the model in tensile conditions, and, if the damage model constructed based on the current study is to be generalized to compression, its applicability will need to be further verified experimentally in future research work.

4.5. Analysis of m and F0

The model is conceptualized within the framework of statistical damage mechanics, positing that the failure probability of micro units adheres to the Weibull distribution. This distribution is characterized by two key parameters, m and F0, which represent the concentration of strength distribution and the average strength of the micro units, respectively. From a macroscopic viewpoint, these parameters m and F0 indicate the brittleness and overall strength of specimens.
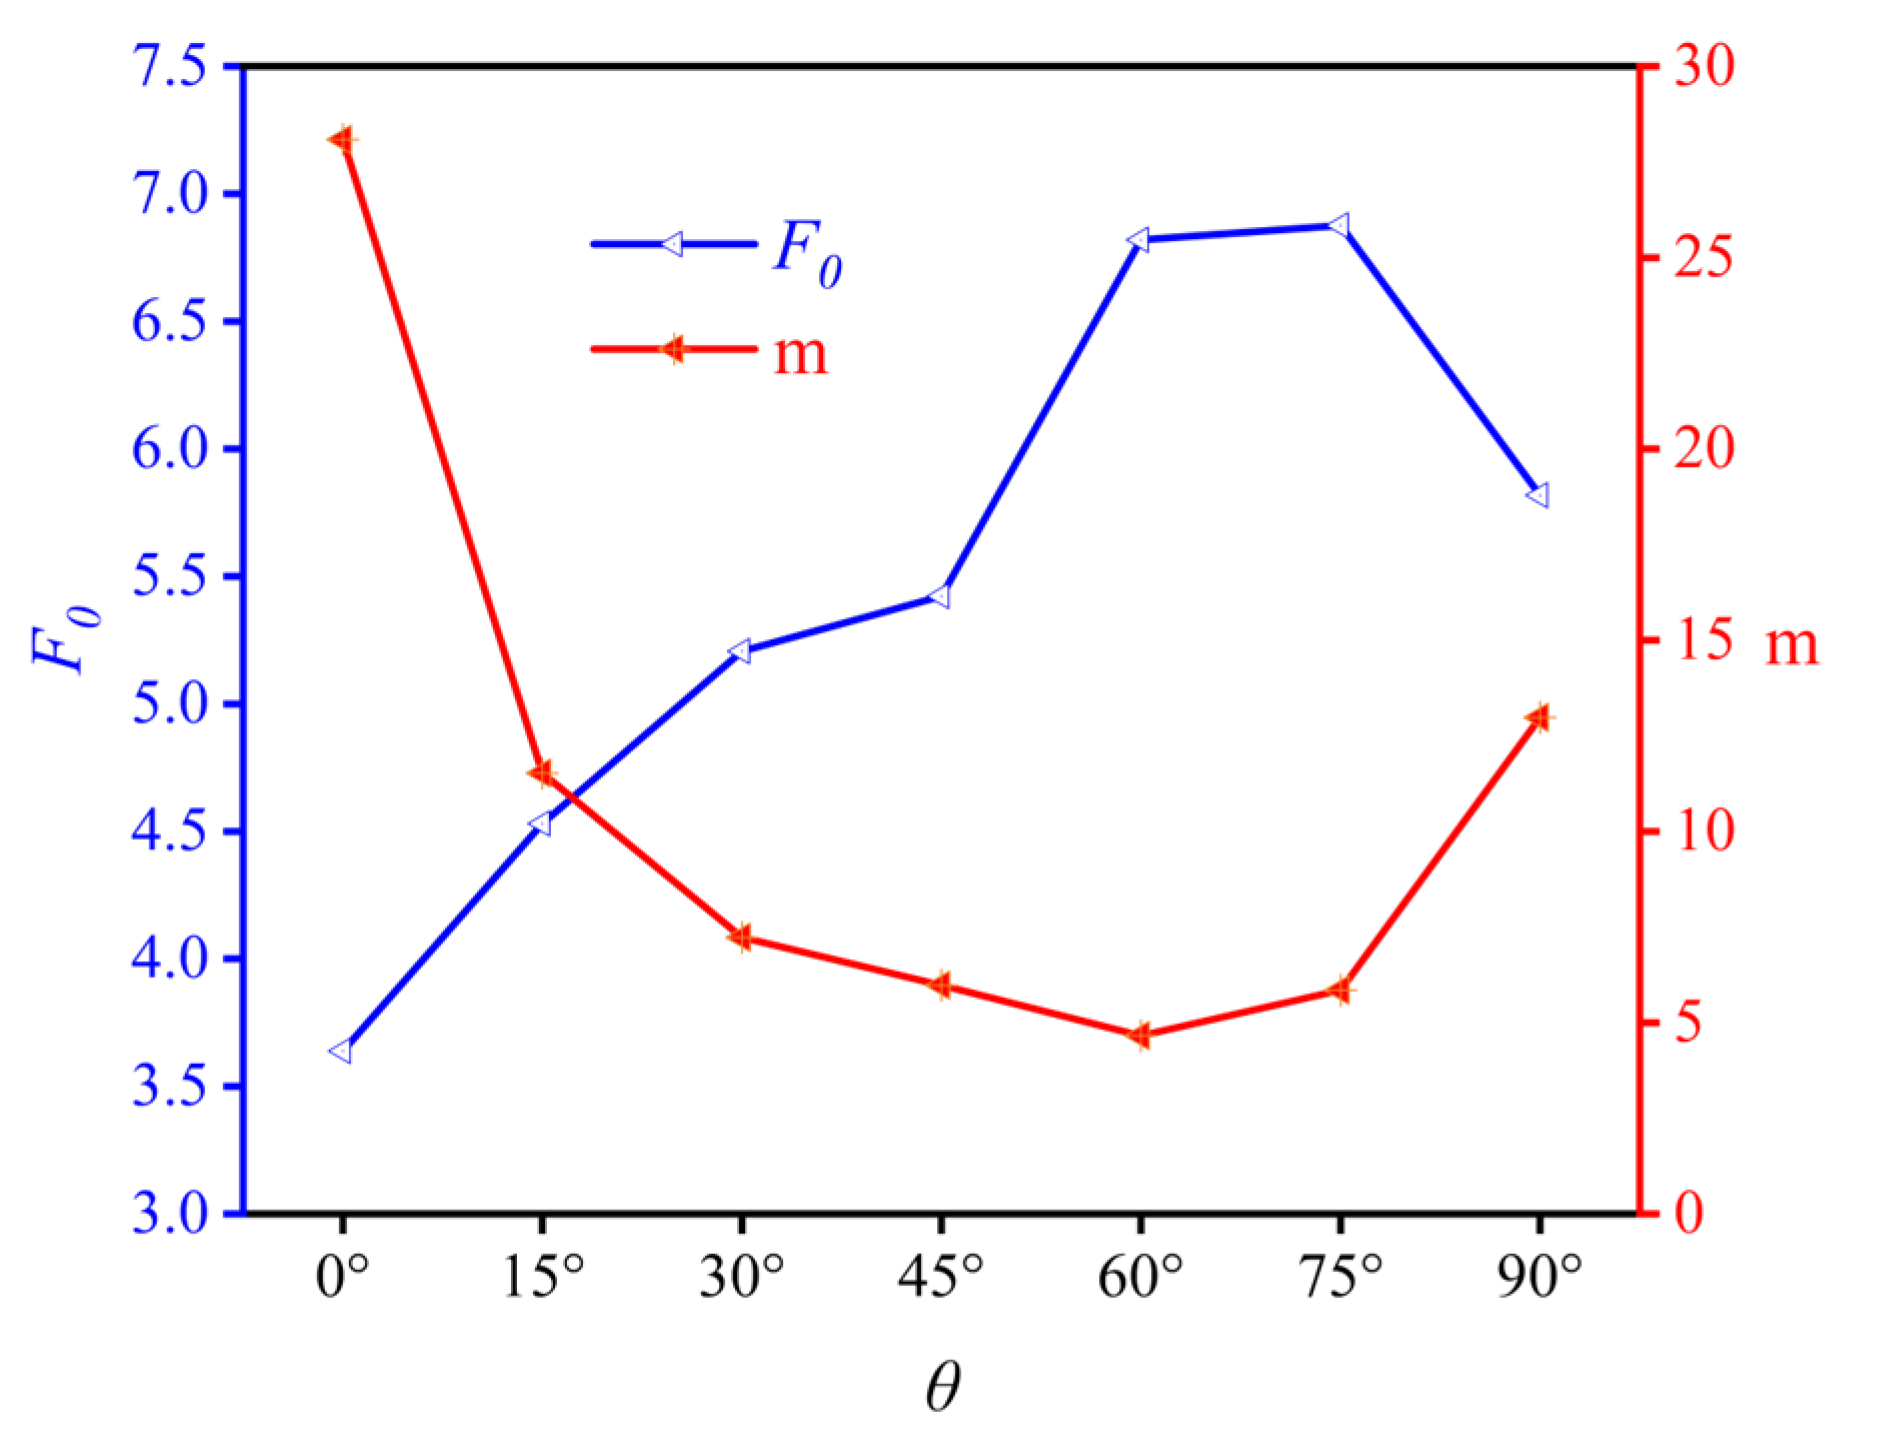
As can be seen from Figure 10, the parameter m first decreases and then increases with the prefabricated crack angle, reaching a maximum of 28.1 at 0° and a minimum of 5.97 at 45°. At θ = 0°, the specimen exhibits the strongest brittleness, with failure occurring as tensile fractures along the prefabricated crack, consistent with Figure 3. As θ increases, m decreases, indicating increased plasticity and more gradual failure, aligning with the observed wing-like crack propagation. For θ = 15° to 75°, the compaction stage in the stress–strain curves becomes more pronounced, with larger axial deformations. At θ = 90°, m increases again, signaling a return to brittleness, with failure occurring from the center rather than the crack tip. As the angle of the prefabricated crack increases, the F0 first increases and then decreases. Both peak strength and peak strain increase with the increase in F0. At θ = 0°, the average strength is minimum at 3.64, and it increases with the crack angle until it reaches a maximum of 6.88 at θ =75°. At θ =90°, the macroscopic statistical average strength of the sample slightly decreases to 5.82.

5. Conclusions

This study investigated the impact of interface crack angles on the mechanical behavior of rock–concrete (R–C) structures through radial compression tests. By combining statistical damage theory, fracture mechanics, and strain energy principles, a tensile strength prediction model for R–C specimens containing an interface crack was established. Key findings include the following:
(1)
The failure paths of R–C specimens are significantly influenced by interface crack angles (θ). At θ = 0°, the failure surface is parallel to the prefabricated crack. As θ increases to 15°, 30°, and 45°, cracks initiate from the tips of the prefabricated crack, expanding in a wing shape. For θ values of 60°, 75°, and 90°, cracks originate closer to the center. Moreover, RA/AF shows that fracture modes are tensile at θ = 0° and 90°, while tensile–shear fractures occur at θ = 15°, 30°, 45°, 60°, and 75°.
(2)
The mechanical properties of R–C specimens showed significant degradation with increasing inclination angle, with the most pronounced degradation observed at θ = 0°, where the tensile strength measured 1.06 MPa, compared to the highest tensile strength of 1.67 MPa at θ = 90°.
(3)
Both the total energy and elastic strain energy of the specimens increased with the angle of the prefabricated cracks, indicating an enhanced ability to store energy. Furthermore, the percentage of energy dissipation first increases and then decreases with increasing θ, reaching a maximum value of 14.39% at θ = 45°.
(4)
A tensile strength prediction model for R–C specimens was developed by combining the damage and fracture theories. With all correlation coefficients R2 > 0.95, the model aligns closely with experimental results, effectively predicting the mechanical behavior of prefabricated cracked R–C specimens. This model serves as a valuable tool for understanding tensile strength and optimizing the design of R–C structures.

Author Contributions

T.G.: Conceptualization, Data curation, Writing—original draft, Validation; H.W.: Methodology, Software, Validation, Writing—original draft; X.S.: Writing—review and editing, Funding acquisition; C.P.: Validation, Writing—review and editing; Z.L.: Visualization, Formal analysis; Q.Z.: Conceptualization, Data curation, Writing; W.L.: Software, Writing—review and editing, Supervision. All authors have read and agreed to the published version of the manuscript.

Funding

The work described in this paper was fully supported by the National Natural Science Foundation of China (Grant No. 52304227 and 52374107) and the Key Project of the Hunan Provincial Department of Education (Grant No. 21A0272). The authors are very grateful for the support of the fund and organization.

Data Availability Statement

The data that support the findings of this study are available on request from the corresponding author.

Conflicts of Interest

The authors declare no conflicts of interest.

References

  1. Chang, X.; Lu, J.Y.; Wang, S.Y.; Wang, S.R. Mechanical performances of rock-concrete bi-material disks under diametrical compression. Int. J. Rock. Mech. Min. 2018, 104, 71–77. [Google Scholar] [CrossRef]
  2. Lei, R.D.; Zhang, Z.Y.; Berto, F.; Ranjith, P.G.; Zhang, C.P. Strain localization and cracking behavior of sandstone with two gypsum-infilled parallel flaws. Theor. Appl. Fract. Mech. 2021, 112, 102873. [Google Scholar] [CrossRef]
  3. Ríos-Bayona, F.; Johansson, F.; Mas-Ivars, D. Prediction of Peak Shear Strength of Natural, Unfilled Rock Joints Accounting for Matedness Based on Measured Aperture. Rock. Mech. Rock. Eng. 2021, 54, 1533–1550. [Google Scholar] [CrossRef]
  4. Tang, W.Y.; Lin, H.; Chen, Y.F.; Feng, J.J.; Hu, H.H. Mechanical Characteristics and Acoustic Emission Characteristics of Mortar-Rock Binary Medium. Buildings 2022, 12, 665. [Google Scholar] [CrossRef]
  5. Guo, T.F.; Liu, K.W.; Li, X.; Jin, P.; Yang, J.C.; Zhang, A.M.; Zou, L.S. Effect of crack angle and concrete strength on the dynamic fracture behavior of rock-based layered material containing a pre-existing crack. Arch. Civ. Mech. Eng. 2023, 23, 198. [Google Scholar] [CrossRef]
  6. Song, X.P.; Hao, Y.X.; Wang, S.; Zhang, L.; Liu, W.; Li, J.B. Mechanical properties, crack evolution and damage characteristics of prefabricated fractured cemented paste backfill under uniaxial compression. Constr. Build. Mater. 2022, 330, 127251. [Google Scholar] [CrossRef]
  7. Chen, Y.; Li, M.; Zhou, L.; Deng, L.; Wang, J. Effects of Different Loading Angles on Brazilian Splitting Characteristics of Rock-Concrete Interface. Geotech. Geol. Eng. 2024, 42, 4285–4301. [Google Scholar] [CrossRef]
  8. Chen, J.; Zhou, L.; Zhu, Z.; Shui, X.; Ma, L.; Wang, M. Interface Stress Analysis and Failure Mechanism of Rock–Concrete Composite Structures Under Multi-directional Stress Waves. Rock. Mech. Rock. Eng. 2024, 57, 9651–9668. [Google Scholar] [CrossRef]
  9. Shams, G.; Rivard, P.; Moradian, O. Tensile strength and failure behavior of rock-mortar interfaces: Direct and indirect measurements. J. Rock. Mech. Geotech. Eng. 2023, 16, 41–55. [Google Scholar] [CrossRef]
  10. Yu, L.Y.; Wu, D.Y.; Su, H.J.; Li, S.C.; Liu, R.C.; Geng, S.T. Influences of Interface Roughness and Loading Direction on Tensile Behavior of Rock-Concrete Bimaterials Under Brazilian Test Conditions. Rock. Mech. Rock. Eng. 2023, 56, 5861–5883. [Google Scholar] [CrossRef]
  11. Selçuk, L.; Aşma, D. Experimental investigation of the Rock–Concrete bi materials influence of inclined interface on strength and failure behavior. Int. J. Rock. Mech. Min. 2019, 123, 104119. [Google Scholar] [CrossRef]
  12. Pan, X.; Huang, J.Z.; Gan, Z.Q.; Hua, W.; Dong, S.M. Investigation on mixed-mode II-III fracture of the sandstone by using eccentric cracked disk. Theor. Appl. Fract. Mech. 2021, 115, 103077. [Google Scholar] [CrossRef]
  13. Tian, Y.; Zhao, X.Y.; Tai, Y.T.; Chen, Y.Z.; Zhou, J.K. Crack extension at the concrete-rock interface damaged by high-pressure water environment: DIC research. Theor. Appl. Fract. Mech. 2023, 126, 103966. [Google Scholar] [CrossRef]
  14. Zhu, Q.; Li, D.; Li, X.; Han, Z.; Ma, J. Mixed mode fracture parameters and fracture characteristics of diorite using cracked straight through Brazilian disc specimen. Theor. Appl. Fract. Mech. 2023, 123, 103682. [Google Scholar] [CrossRef]
  15. Chang, X.; Guo, T.F.; Zhang, S. Cracking behaviours of layered specimen with an interface crack in Brazilian tests. Eng. Fract. Mech. 2020, 228, 106904. [Google Scholar] [CrossRef]
  16. Aranda, M.T.; Garcia, I.G.; Reinoso, J.; Mantic, V. Experimental evaluation of the similarity in the interface fracture energy between PMMA/epoxy/PMMA and PMMA/epoxy joints. Eng. Fract. Mech. 2022, 259, 108076. [Google Scholar] [CrossRef]
  17. Aliabadian, Z.; Sharafisafa, M.; Tahmasebinia, F.; Shen, L.M. Experimental and numerical investigations on crack development in 3D printed rock-like specimens with pre-existing flaws. Eng. Fract. Mech. 2021, 241, 107396. [Google Scholar] [CrossRef]
  18. Yu, S.; Yu, J.; Sun, Z.; Zhu, C.; Yang, J. Numerical investigation and experimental study on fracture processes of central flawed sandstone Brazilian discs. Int. J. Solids Struct. 2023, 262–263, 112054. [Google Scholar] [CrossRef]
  19. Aboayanah, K.R.; Popoola, A.K.; Abdelaziz, A.; Sun, L.; Ossetchkina, E.; Peterson, K.; Grasselli, G. Effect of pre-existing cracks on thermal cracking of granitic rocks under confinement. Geomech. Geophys. Geo 2022, 8, 126. [Google Scholar] [CrossRef]
  20. Hu, H.R.; Lu, Y.Y.; Xia, B.W.; Luo, Y.F.; Peng, J.J.; Li, Y. Damage characteristics of sandstone with different crack angles subjected to true triaxial cyclic loading and unloading. Theor. Appl. Fract. Mech. 2022, 121, 103444. [Google Scholar] [CrossRef]
  21. Zhong, J.C.; Wang, J.; Li, X.Y.; Chu, X.H. Macro- and meso- failure mechanism analysis for shale-like brittle materials under uniaxial compression. Eng. Anal. Bound. Elem. 2022, 141, 189–198. [Google Scholar] [CrossRef]
  22. Fu, M.; Zhao, G.F. A micro-macro constitutive model for compressive failure of rock by using 4D lattice spring model. Int. J. Rock. Mech. Min. 2022, 160, 105261. [Google Scholar] [CrossRef]
  23. Liu, X.S.; Tan, Y.L.; Ning, J.G.; Lu, Y.W.; Gu, Q.H. Mechanical properties and damage constitutive model of coal in coal-rock combined body. Int. J. Rock. Mech. Min. 2018, 110, 140–150. [Google Scholar] [CrossRef]
  24. Ren, C.H.; Yu, J.; Zhang, C.; Liu, X.Y.; Zhu, Y.L.; Yao, W. Micro-macro approach of anisotropic damage: A semi-analytical constitutive model of porous cracked rock. Eng. Fract. Mech. 2023, 290, 109483. [Google Scholar] [CrossRef]
  25. Tian, Y.K.; Weijermars, R.; Zhou, F.J.; Hu, L.Q.; Liu, T.Y.; Liu, H.T. Advances in stress-strain constitutive models for rock failure: Review and new dynamic constitutive failure (DCF) model using core data from the Tarim Basin (China). Earth-Sci. Rev. 2023, 243, 104473. [Google Scholar] [CrossRef]
  26. Kawamoto, T.; Ichikawa, Y.; Kyoya, T. Deformation and fracturing behaviour of discontinuous rock mass and damage mechanics theory. Int. J. Numer. Anal. Methods Geomech. 2005, 12, 1–30. [Google Scholar] [CrossRef]
  27. Chen, S.; Qiao, C.S. Composite damage constitutive model of jointed rock mass considering crack propagation length and joint friction effect. Arab. J. Geosci. 2018, 11, 283. [Google Scholar] [CrossRef]
  28. Pan, J.L.; Cai, M.F.; Li, P.; Guo, Q.F. A damage constitutive model of rock-like materials containing a single crack under the action of chemical corrosion and uniaxial compression. J. Cent. South. Univ. 2022, 29, 486–498. [Google Scholar] [CrossRef]
  29. Xia, B.W.; Li, Y.; Hu, H.R.; Luo, Y.F.; Peng, J.J. Effect of Crack Angle on Mechanical Behaviors and Damage Evolution Characteristics of Sandstone Under Uniaxial Compression. Rock. Mech. Rock. Eng. 2022, 55, 6567–6582. [Google Scholar] [CrossRef]
  30. Wang, C.S.; Liu, J.F.; Zhao, Y.W.; Han, S.J. Mechanical properties and fracture evolution process of Beishan granite under tensile state. B Eng. Geol. Env. Environ. 2022, 81, 274. [Google Scholar] [CrossRef]
  31. Pan, P.Z.; Feng, X.T.; Zhou, H. Research on the Failure Process of Rocks under Tensile Loading Using Elasto-Plastic CA Model. Key Eng. Mater. 2007, 340–341, 1145–1150. [Google Scholar] [CrossRef]
  32. Keawsawasvong, S.; Ukritchon, B. Undrained stability of an active planar trapdoor in non-homogeneous clays with a linear increase of strength with depth. Comput. Geotech. 2017, 81, 284–293. [Google Scholar] [CrossRef]
  33. Liao, Z.Y.; Zhu, J.B.; Tang, B.C.A. Numerical investigation of rock tensile strength determined by direct tension, Brazilian and three-point bending tests. Int. J. Rock. Mech. Min. 2019, 115, 21–32. [Google Scholar] [CrossRef]
  34. Zhu, J.; Deng, J.H.; Chen, F.; Wang, F. Failure analysis of water-bearing rock under direct tension using acoustic emission. Eng. Geol. 2022, 299, 106541. [Google Scholar] [CrossRef]
  35. Yuan, R.; Shi, B. Acoustic emission activity in directly tensile test on marble specimens and its tensile damage constitutive model. Int. J. Coal Sci. Technol. 2018, 5, 295–304. [Google Scholar] [CrossRef]
  36. Liu, D.Q. A Constitutive Model of Rocks under Uniaxial Tension. Adv. Mat. Res. 2014, 908, 103–106. [Google Scholar] [CrossRef]
  37. Zhang, Y.; Huang, M.; Jiang, Y.; Wang, Z. Mechanics, damage and energy degradation of rock-concrete interfaces exposed to high temperature during cyclic shear. Constr. Build. Mater. 2023, 405, 133229. [Google Scholar] [CrossRef]
  38. Guo, T.; Liu, K.; Li, X.; Wu, Y.; Yang, J. Effects of thermal treatment on the fracture behavior of rock-concrete bi-material specimens containing an interface crack. Theor. Appl. Fract. Mec. 2023, 127, 104071. [Google Scholar] [CrossRef]
  39. Guo, T.; Zhang, Q.; Liu, K.; Chang, X.; Zou, L. Co-effects of parallel flaws and interface characteristics on the fracture behavior of rock-concrete composite specimens. J. Build. Eng. 2024, 97, 110920. [Google Scholar] [CrossRef]
  40. Xie, Q.; Chen, D.L.; Liu, X.L.; Zeng, Y. Research on the effect of loading rate on the fracture characteristics of granite using cracked straight through Brazilian disc specimens. Theor. Appl. Fract. Mech. 2022, 122, 103581. [Google Scholar] [CrossRef]
  41. Liu, P.; Guo, C.; Cui, S.; Xia, W.; Wang, X.; Chen, X. Experimental study on crack propagation process of rock-concrete interface in hot-dry curing environment at different temperatures. Struct. Concr. 2023, 24, 5506–5521. [Google Scholar] [CrossRef]
  42. Wang, Q.Z.; Jia, X.M.; Kou, S.Q.; Zhang, Z.X.; Lindqvist, P.A. The flattened Brazilian disc specimen used for testing elastic modulus, tensile strength and fracture toughness of brittle rocks: Analytical and numerical results. Int. J. Rock. Mech. Min. 2004, 41, 245–253. [Google Scholar] [CrossRef]
  43. Qiu, H.; Zhu, Z.M.; Wang, M.; Wang, F.; Luo, C.S.; Wan, D.Y. Study of the failure properties and tensile strength of rock-mortar interface transition zone using bi-material Brazilian discs. Constr. Build. Mater. 2020, 236, 117551. [Google Scholar] [CrossRef]
  44. Teng, S.Y.; Yang, S.Q.; Huang, Y.H.; Tian, W.L. Experimental study of influence of crack filling on mechanical properties of Brazilian discs. Rock. Soil. Mech. 2018, 39, 4493–4507 and 4516. [Google Scholar] [CrossRef]
  45. Zhao, Y.; Deng, X.; Bi, J.; Shen, M.; Wang, C.; Zhang, Y.; Li, Y.; Ning, L. Study on the mixed fracture characteristics of concrete-rock Brazilian disks with different fracture angles. Theor. Appl. Fract. Mec. 2024, 133, 104614. [Google Scholar] [CrossRef]
  46. Chang, X.; Zhang, X.; Dang, F.N.; Zhang, B.F.; Chang, F.Q. Failure Behavior of Sandstone Specimens Containing a Single Flaw Under True Triaxial Compression. Rock. Mech. Rock. Eng. 2022, 55, 2111–2127. [Google Scholar] [CrossRef]
  47. Wang, J.; Li, J.T.; Shi, Z.M.; Chen, J.C. Fatigue damage and fracture evolution characteristics of sandstone under multistage intermittent cyclic loading. Theor. Appl. Fract. Mech. 2022, 119, 103375. [Google Scholar] [CrossRef]
  48. Wang, Y.; Feng, W.K.; Wang, H.J.; Li, C.H.; Hou, Z.Q. Rock bridge fracturing characteristics in granite induced by freeze-thaw and uniaxial deformation revealed by AE monitoring and post-test CT scanning. Cold Reg. Sci. Technol. 2020, 177, 103115. [Google Scholar] [CrossRef]
  49. Du, K.; Li, X.F.; Tao, M.; Wang, S.F. Experimental study on acoustic emission (AE) characteristics and crack classification during rock fracture in several basic lab tests. Int. J. Rock. Mech. Min. 2020, 133, 104411. [Google Scholar] [CrossRef]
  50. Zhang, Z.H.; Deng, J.H. A new method for determining the crack classification criterion in acoustic emission parameter analysis. Int. J. Rock. Mech. Min. 2020, 130, 104323. [Google Scholar] [CrossRef]
  51. Meng, Y.Y.; Jing, H.W.; Liu, X.W.; Yin, Q.; Wei, X.C. Experimental and numerical investigation on the effects of bedding plane properties on the mechanical and acoustic emission characteristics of sandy mudstone. Eng. Fract. Mech. 2021, 245, 107582. [Google Scholar] [CrossRef]
  52. Wu, W.X.; Gong, F.Q. Investigation on Energy Evolution and Storage Characteristic of CSTBD Red Sandstone during Mixed-Mode Fracture. Geofluids 2022, 2022, 9822469. [Google Scholar] [CrossRef]
  53. Peng, K.; Wang, Y.Q.; Zou, Q.L.; Liu, Z.P.; Mou, J.H. Effect of crack angles on energy characteristics of sandstones under a complex stress path. Eng. Fract. Mech. 2019, 218, 106577. [Google Scholar] [CrossRef]
  54. Xie, H.; Li, L.; Peng, R.; Ju, Y. Energy analysis and criteria for structural failure of rocks. J. Rock. Mech. Geotech. Eng. 2009, 1, 11–20. [Google Scholar] [CrossRef]
  55. Liu, X.X.; Li, Y.; Wang, W.W. Study on mechanical properties and energy characteristics of carbonaceous shale with different fissure angles under dry-wet cycles. B Eng. Geol. Environ. 2022, 81, 319. [Google Scholar] [CrossRef]
  56. Zhao, Y.X.; Liu, B. Deformation Field and Acoustic Emission Characteristics of Weakly Cemented Rock under Brazilian Splitting Test. Nat. Resour. Res. 2021, 30, 1925–1939. [Google Scholar] [CrossRef]
  57. Zheng, Z.; Su, H.; Wang, W.; Wang, Z.; Liu, Z.; He, B.; Mei, G. A new hydro-mechanical coupling constitutive model for brittle rocks considering initial compaction, hardening and softening behaviors under complex stress states. Geomech. Geophys. Geo 2023, 9, 68. [Google Scholar] [CrossRef]
  58. Wang, R.Q.; Wang, G.L.; Zhang, L.; Sun, F.; Cao, T.C.; Li, B.Y.; Xu, H. Coupled macro-meso damage constitutive model for fractured rocks based on logistic growth theory. Eng. Fract. Mech. 2023, 281, 109132. [Google Scholar] [CrossRef]
  59. Atkinson, C.; Smelser, R.E.; Sanchez, J. Combined mode fracture via the cracked Brazilian disk test. Int. J. Fract. 1982, 18, 279–291. [Google Scholar] [CrossRef]
  60. Rice, J.R. Elastic Fracture Mechanics Concepts for Interfacial Cracks. J. Appl. Mech. 1988, 55, 98–103. [Google Scholar] [CrossRef]
  61. Ayatollahi, M.R.; Aliha, M.R.M. On the use of Brazilian disc specimen for calculating mixed mode I-II fracture toughness of rock materials. Eng. Fract. Mech. 2008, 75, 4631–4641. [Google Scholar] [CrossRef]
  62. Liu, K.; Guo, T.; Yang, J.; Ma, S. Static and dynamic fracture behavior of rock-concrete bi-material disc with different interface crack inclinations. Theor. Appl. Fract. Mech. 2023, 123, 103659. [Google Scholar] [CrossRef]
  63. Pan, J.; Zhang, Y.; Li, P.; Wu, X.; Xi, X. Mechanical properties and thermo-chemical damage constitutive model of granite subjected to thermal and chemical treatments under uniaxial compression. Constr. Build. Mater. 2023, 390, 131755. [Google Scholar] [CrossRef]
  64. Liu, X.S.; Ning, J.G.; Tan, Y.L.; Gu, Q.H. Damage constitutive model based on energy dissipation for intact rock subjected to cyclic loading. Int. J. Rock. Mech. Min. 2016, 85, 27–32. [Google Scholar] [CrossRef]
  65. Zhou, Z.L.; Lu, J.Y.; Cai, X.; Rui, Y.C.; Tan, L.H. Water saturation effects on mechanical performances and failure characteristics of rock-concrete disc with different interface dip angles. Constr. Build. Mater. 2022, 324, 126684. [Google Scholar] [CrossRef]
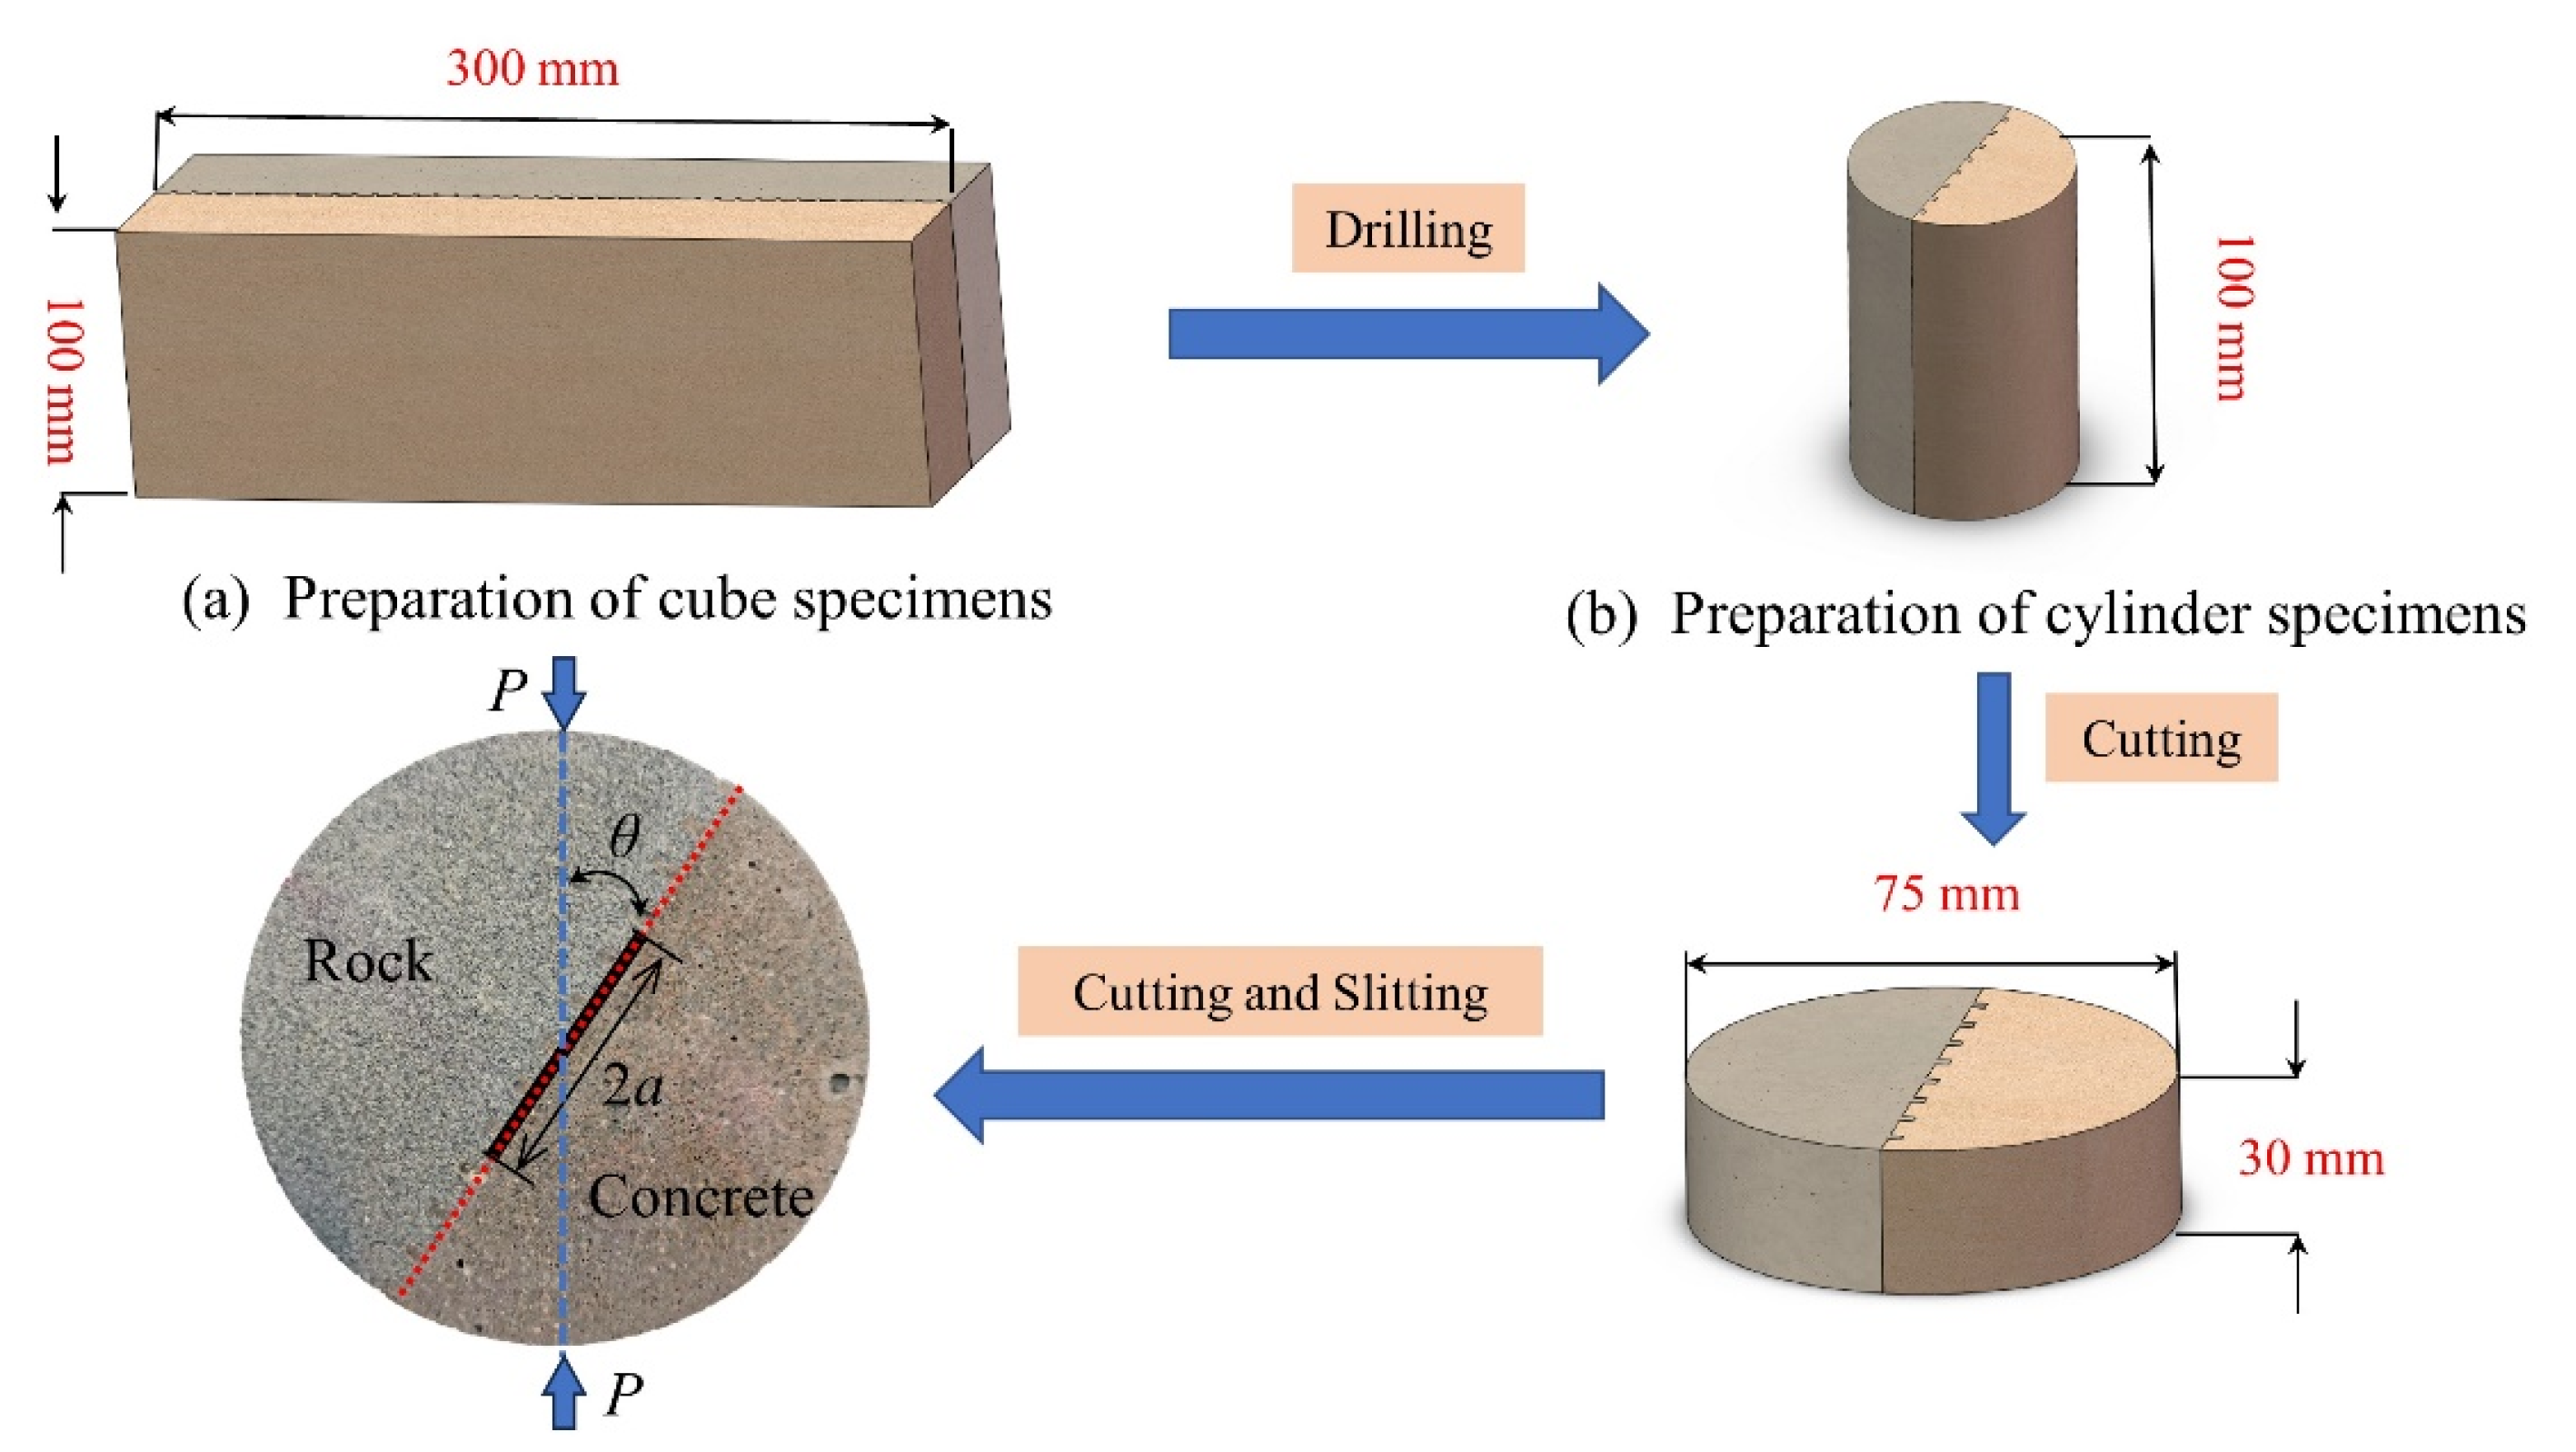
Figure 1. Preparation steps of the specimens.
Mathematics 12 03510 g001
Figure 2. MTS-322 electro-hydraulic servo-control test system.
Mathematics 12 03510 g002
Figure 3. Failure paths of R–C specimens containing different θ.
Mathematics 12 03510 g003
Figure 4. Nominal tensile stress–strain curves of R–C specimens.
Mathematics 12 03510 g004
Figure 5. Distributions of RA and AF of the specimens with different θ.
Mathematics 12 03510 g005
Figure 6. Calculations of elastic strain energy and dissipated energy.
Mathematics 12 03510 g006
Figure 7. Energy evolutions of the specimens with different θ.
Mathematics 12 03510 g007
Figure 8. Calculation process of the coupled damage variables for the specimens.
Mathematics 12 03510 g008
Figure 9. Comparisons of test curves and fitting curves.
Mathematics 12 03510 g009
Figure 10. Variations of m and F0 of the layered rock disc samples with different interface crack angles.
Mathematics 12 03510 g010
Table 1. Mechanical parameters of sandstone and concrete.
CategoryDensityElastic ModulusPoisson RatioCompressive StrengthTensile Strength
(kg/m3)(GPa)(MPa)(MPa)
Sandstone2512.3615.210.3068.582.68
Concrete2182.3614.380.2358.802.37
Table 2. Energy characteristics of the specimens with different θ.
θU/(kJ·m−3)Ue/(kJ·m−3)Ud/(kJ·m−3)
1.605191.4773540.127836
15°2.564932.3538090.211121
30°2.549672.2871760.262494
45°3.030972.5947570.436213
60°3.737593.4244710.313119
75°3.920563.5771730.343387
90°4.144973.8351650.309805
Table 3. Mechanical parameters of the R–C specimens.
θEt/MPa σ ¯ t /MPa ε ¯ t /%Poisson’s RatioYIYII
396.211.080.320.191.2450.006
15°469.151.500.370.210.7211.387
30°402.721.390.390.21−0.3852.079
45°463.961.540.400.21−1.4972.065
60°432.591.730.490.23−2.3501.603
75°418.751.670.510.24−2.8850.897
90°424.611.750.480.24−3.0890.074
Disclaimer/Publisher’s Note: The statements, opinions and data contained in all publications are solely those of the individual author(s) and contributor(s) and not of MDPI and/or the editor(s). MDPI and/or the editor(s) disclaim responsibility for any injury to people or property resulting from any ideas, methods, instructions or products referred to in the content.