Article

Dynamic Behavior of a 10 MW Floating Wind Turbine Concrete Platform under Harsh Conditions

College of Energy and Electrical Engineering, Hohai University, Nanjing 211100, China
*
Author to whom correspondence should be addressed.
Mathematics 2024, 12(3), 412; https://doi.org/10.3390/math12030412
Submission received: 20 December 2023 / Revised: 21 January 2024 / Accepted: 23 January 2024 / Published: 26 January 2024

Abstract

:
To ensure the safe and stable operation of a 10 MW floating wind turbine concrete platform under harsh sea conditions, the fluid–structure coupling theory was used to apply wind, wave, and current loads to a concrete semi-submersible floating platform, and strength analysis was performed to calculate its stress and deformation under environmental loads. Moreover, the safety factor and fatigue life prediction of the platform were also conducted. The results indicated that the incident angles of the environmental loads had a significant impact on motion response in the surge, sway, pitch, and yaw directions. As the incident angles increased, the motion response in the surge and pitch directions gradually decreased, the motion response in the sway direction gradually increased, and the yaw motion response showed a trend of first increasing and then decreasing. In addition, the maximum stress of the floating platform under harsh sea conditions was 12.718 MPa, mainly concentrated at the connection of the middle column and pontoon and the connection of the heave plate and Y-shaped pontoon, which meets the use strength requirements. However, the stress concentration zone exhibited a significantly shorter fatigue life with a magnitude of 106. This implies a higher susceptibility to fatigue damage and the potential occurrence of structural failure. This research holds paramount significance in ensuring the safe and stable operation of floating wind turbine platforms, particularly under harsh sea conditions.

1. Introduction

The rapid industrialization has led to a sharp decrease in traditional fossil energy reserves, and the combustion of traditional fossil fuels has caused a series of environmental problems, such as global warming, soil degradation, and water pollution. Therefore, seeking and developing renewable forms of energy have become increasingly widespread concerns around the world [1,2]. Offshore wind energy is considered one of the most promising renewable energy sources due to its green and clean features and wide distribution. According to the Global Wind Energy Council (GWEC), the installed capacity of offshore wind power has continuously expanded in the past decade. By the end of 2020, the cumulative installed capacity of global offshore wind power had reached 35.3 GW, and it is expected that by 2025, the new installed capacity of global offshore wind power will exceed 100 GW [3]. With the development of the offshore wind power industry, offshore wind power will gradually move from offshore to deep-sea. Compared with near shore wind power, deep-sea wind power has higher and more stable wind speeds, less turbulence, and a wider space, resulting in better wind energy quality. In the near-shore shallow water areas, the supporting structures for offshore wind turbines are mainly fixed supporting foundations [4], such as monopile, tripod, and jacket foundations. With the increase in water depth, the construction costs of offshore fixed supporting foundations will rise sharply. When the water depth exceeds 50 m, fixed supporting foundations cannot meet the economic requirements of offshore wind turbines, and floating platform foundations become the best choice for offshore wind power in deep-sea areas [5]. At present, based on the floating structures of ships and ocean engineering, offshore wind turbine floating platforms can be divided into spar-type, semi-submersible type, tension-leg type, and barge-type structures [6]. Compared to fixed supporting structures, floating platforms are constantly in motion under various external environmental loads due to their connection to the seabed through mooring systems. This leads to significant motion amplitudes and complex structural forces [7]. Therefore, it is necessary to conduct the structural verification analysis of the floating platforms to ensure their stability and sufficient strength during use.
In recent years, various designs of floating platforms for offshore wind turbines have been proposed and studied. In 2009, based on the Hywind project, the Norwegian National Oil Company installed the world’s first spar-type floating wind turbine prototype supporting a Siemens 2.3 MW wind turbine, 10 km off the coast of western Norway. Jonkman [8] modified the spar-type floating platform in the Hywind project to adapt it to a 5 MW offshore wind turbine at the National Renewable Energy Laboratory (NREL). Ahn and Shin [9] conducted a 1:128 scale model test in a wave tank to study the motion characteristics of a spar-type floating wind turbine under wind and wave loads and proposed a self-developed code. The code was verified by the experimental results. Yue et al. [10] studied the influence of heave plates on the dynamic response of a spar-type wind turbine platform under wind–wave coupling effects. When the heave plate is located in the middle and lower part of the platform, it can effectively suppress heave and pitch motion responses, significantly reducing the tension of mooring cables. Jiang et al. [11] proposed a novel stepped spar-type floating platform suitable for an NREL 5 MW wind turbine that can adapt well to medium water depth environments. Subsequently, NREL proposed the well-known OC4 semi-submersible floating platform in the DeepCwind project. The OC4 semi-submersible floating platform has been extensively studied through 1:50 scale model tank tests and numerical simulations [12]. The OC4 semi-submersible floating platform shows good pitch performance, and its motion response is conducive to the stable operation of the NREL 5 MW semi-submersible floating wind turbine. Liu et al. [13] optimized the OC4 semi-submersible floating platform structure and the mooring cable arrangement, which can effectively reduce the surge and heave motion. Jiang et al. [14] established the relationship between environmental loads and the dynamic response of floating offshore wind turbines using machine learning models, where the number of samples had a significant impact on the prediction of the mooring cable tension. Xu et al. [15] used a computationally efficient Monte Carlo method to estimate the extreme load or response statistical data of a 5 MW semi-submersible floating wind turbine, minimizing potential mechanical damage caused by excessive environmental loads. Wang et al. [16] proposed a robust method to design a steel semi-submersible platform for a 10 MW floating wind turbine and conducted structural strength verification and dynamic performance evaluation on the steel floating platform. In addition, Matha [17] proposed a tension-leg platform for the OC5 project and analyzed the dynamic response of a tension-leg type 5 MW wind turbine using FAST. Suzuki et al. [18] designed a tension-leg platform with a 2.4 MW wind turbine and conducted dynamic numerical analysis on the platform under different environmental loads. This platform can maintain a sufficient safety factor under extreme conditions without resonance with the wind turbine system. Goupee et al. [19] conducted 1:50 scale model experiments on the NREL 5 MW tension-leg floating wind turbine, which determined the free decay characteristics of the tension-leg platform and the dynamic response of the floating platform under different environmental loads, providing a large amount of experimental data for numerical analysis. Xu et al. [20] conducted a dynamic response study on the connection angle of a tension leg floating platform under environmental load conditions. The results showed that the improved floating platform effectively reduced the dynamic surge and pitch responses, improving the stability of the tension leg platform. Aboutalebi et al. [21] proposed a new type of barge platform structure for 5 MW floating offshore wind turbines with the aim of reducing these unexpected platform movements. M’zoughi et al. [22] integrated the oscillating water column into the barge platform of an offshore floating wind turbine and implemented complementary airflow control on it to reduce the platform pitch motion and tower top forward and backward displacement modes, thereby helping to stabilize the floating platform.
Most of the aforementioned wind turbines are limited to a capacity of less than 5 MW and are supported by steel structural floating platforms that are vulnerable to seawater corrosion. Once the capacity of wind turbines increases, a larger volume is required for floating platforms, which resulting in higher costs and higher construction requirements [23]. Therefore, some scholars have started to conduct research on concrete structure platforms with the following characteristics: good anti-corrosion performance, low cost, low maintenance expense, and environmentally friendly. Wang et al. [24,25] analyzed the dynamic behavior of the drivetrain system of a concrete semi-submersible 10 MW floating wind turbine and the ultimate internal stress of the floating platform columns based on numerical simulation methods. Ahn et al. [26] studied the dynamic response of a concrete semi-submersible floating wind turbine platform and found that changes in the wind–wave incident angle affected the motion response of the floating platform. Yang et al. [27] proposed a new multi-body concrete floating platform of a 10 MW wind turbine and numerically verified its dynamic performance under wind–wave coupling and non-coupling conditions. In order to accurately evaluate the performance of a multi-body concrete floating platform, it is necessary to consider the wind-–wave coupling effect.
At present, there is considerable research on the motion response of the new concrete platforms for floating wind turbines, but there is limited research on the structural strength, particularly considering the high-capacity wind turbines. An OO-Star semi-submersible concrete floating platform with a 10 MW wind turbine is considered in this paper. An aero-hydro-servo-elastic coupling numerical simulation of the 10 MW floating wind turbine was established using OpenFAST and AQWA in order to study the motion response of its translational freedom (surge, sway, and heave) and rotational freedom (roll, pitch, and yaw) in the South China Sea. At the same time, the structural strength and fatigue life of the floating platform were analyzed to validate whether the platform has good stability and strength reserves with different wind, wave, and current loading conditions considering severe sea states. The results will provide a reference for the design and promotion of 10 MW floating wind turbine concrete platforms in China.

2. Research Background

The OO-Star semi-submersible floating platform in this paper consists of a Y-shaped pontoon and a heave plate. A 10 MW wind turbine is supported by a conical column structure in the middle, with three columns outside. The vertical view of the platform is shown in Figure 1 together with two sectional views of each column. The schematic diagram of the 10 MW semi-submersible floating wind turbine is shown in Figure 2. The structural parameters of the 10 MW wind turbine are listed in Table 1, and the parameters of the floating platform and mooring system are presented in Table 2.

3. Theoretical Method

3.1. Environmental Loads

During the operation of a floating wind turbine, the external environmental loads mainly include the wind load, wave load, and current load.

3.1.1. Wind Load

The operating condition of the floating wind turbine in marine environments is affected by the turbulent wind, resulting in different wind speeds. The Kaimal spectrum is adopted in this study to describe the energy distribution of the fluctuating wind speed field in the frequency domain [28]. The Kaimal spectral density S ( f ) in the γ direction can be expressed as
S ( f ) = 4 σ γ 2 L γ V h u b 1 ( 1 + 6 f L γ V h u b 1 ) 5 / 3 , γ = u , v , w
where f is the frequency; σ r is the standard deviation of the speed; and L r is the turbulence integral scale.
The aerodynamic load is calculated by the blade element momentum (BEM) theory [29]. The wind turbine thrust force F and torque M can be expressed as
F = 0 R 1 2 ( C L cos φ + C D sin φ ) ρ W 2 c N d r
M = 0 R 1 2 ( C L sin φ C D cos φ ) ρ W 2 c N r d r
where C L is the lift coefficient; C D is the drag coefficient; c is the chord length of the airfoil; W is the relative velocity of the airflow; N is the number of blades; and R is the radius of the wind turbine.

3.1.2. Wave Load

The Pierson–Moscowitz (P–M) wave spectrum is adopted to consider irregular waves from the perspective of energy distribution [30]. The expression of spectral density is as follows:
S P M ( ω ) = 5 16 H S 2 ω P 4 ω 5 e ( 5 4 ( ω ω P ) 4 )
where H S is wave height; ω P = 2 π / T P , T P is the wave period.
The wave load of the platform is solved based on the potential flow theory [31].
ϕ ( x , y , z , t ) = ϕ I ( x , y , z , t ) + ϕ D ( x , y , z , t ) + ϕ R ( x , y , z , t )
where ϕ is the total velocity potential of the fluid; ϕ I is the velocity potential of the incident wave; ϕ D is the velocity potential of the diffracted wave; and ϕ R is the velocity potential of the radiation wave.
The wave force F and torque M acting on the structure can be obtained by integration along the wet surface of the floating body as
F = S ( P n ) d S
M = S P ( r × n ) d S
where P is the pressure of the floating body surface; S is the wet surface of the floating body; and n is the normal vector of the floating body surface.

3.1.3. Current Load

In ocean engineering, the dynamic current load can be expressed as
F c = 1 2 ρ w U c 2 C d A
where U c is the current speed; C d is the drag force coefficient; ρ w is the density of seawater; and A is the area facing the current.
The aerodynamic model and servo control model based on the blade variable pitch are established in OpenFAST. The hydrodynamic model based on potential flow theory is established in AQWA, and the lumped-mass method is employed in the dynamic mooring system. The dynamic model of the floating wind turbine structure is established with Kane’s equation [32]. The flowchart of this multi-physical coupled model is detailed in Figure 3.

3.2. Structural Strength Analysis

The static finite element equation for structural strength calculation is
K u = F s + F t
σ = D B u
where K is the stiffness matrix; u is the displacement vector; Fs and Ft represent the pressure generated from the fluid–structure coupling interface and the inertial force caused by gravity; σ is the stress; D is the elastic matrix; and B is the strain matrix.
The following conditions need to be met for data exchange on the fluid–structure coupling surface:
v s , f = v f , s
u s , f = u f , s
where v is the normal velocity component; u is the normal displacement component; f represents fluid; and s represents solid.
According to the fourth strength theory, the equivalent stress can be expressed as
σ e = ( σ 1 σ 2 ) 2 + ( σ 2 σ 3 ) 2 + ( σ 3 σ 1 ) 2 / 2 1 / 2
where σ 1 , σ 2 , and σ 3 are three principal stress values.

3.3. Fatigue Life Theory

During the design life of the floating platform, fluctuating loads can lead to cumulative fatigue damage. These fluctuating loads in the time series are decomposed into individual hysteresis cycles by using the rain flow counting method. Miner’s theory [33] is adopted during the fatigue life estimation by assuming that the damage is linearly cumulative. The total damage for all cycles is given by
D = i n i N i ( L i R F )
where N i is the number of cycles to failure, L i R F is the load range of the cycles under a fixed mean load; and n i is the cycle count. The relationship between the load range and cycles to failure (S–N curve) is represented by
N i = L u l t L M F 1 2 L i R F m
where L u l t is the ultimate design load of the component, L M F is the fixed mean load; and m is the Whöler index, which is specific to the component.
The load range of the fatigue cycles is corrected using the Goodman correction in order to analyze the data as if each cycle occurred about a fixed mean load.
L i R F = L i R L u l t L M F L u l t L i M
where L i R is the ith cycle’s range about a mean load of L i M .
In order to correctly estimate the total lifetime damage from these short input time series, we must extrapolate the time series damage cycle counts over the design life. Equations (14)–(16) were rewritten so that they can now account for the accumulation of damage using one or more input time series.
D j L i f e = i n j i L i f e N j i
D L i f e = j D j L i f e
N j i = L u l t L M F 1 2 L j i R F m
L j i R F = L j i R L u l t L M F L u l t L j i M
where D j L i f e is the extrapolated damage within the design life caused by the jth time series; n j i L i f e is the extrapolated cycle count; N j i is the number of cycles to failure; and L j i R is the range about a mean load of L j i M for the ith cycle in the jth time series.

4. Mesh Sensitivity Verification

During the multi-physical numerical simulation, the mesh quality plays an important role in the calculation accuracy. The total number of meshes of the OO-Star floating platform is set to 39,032.
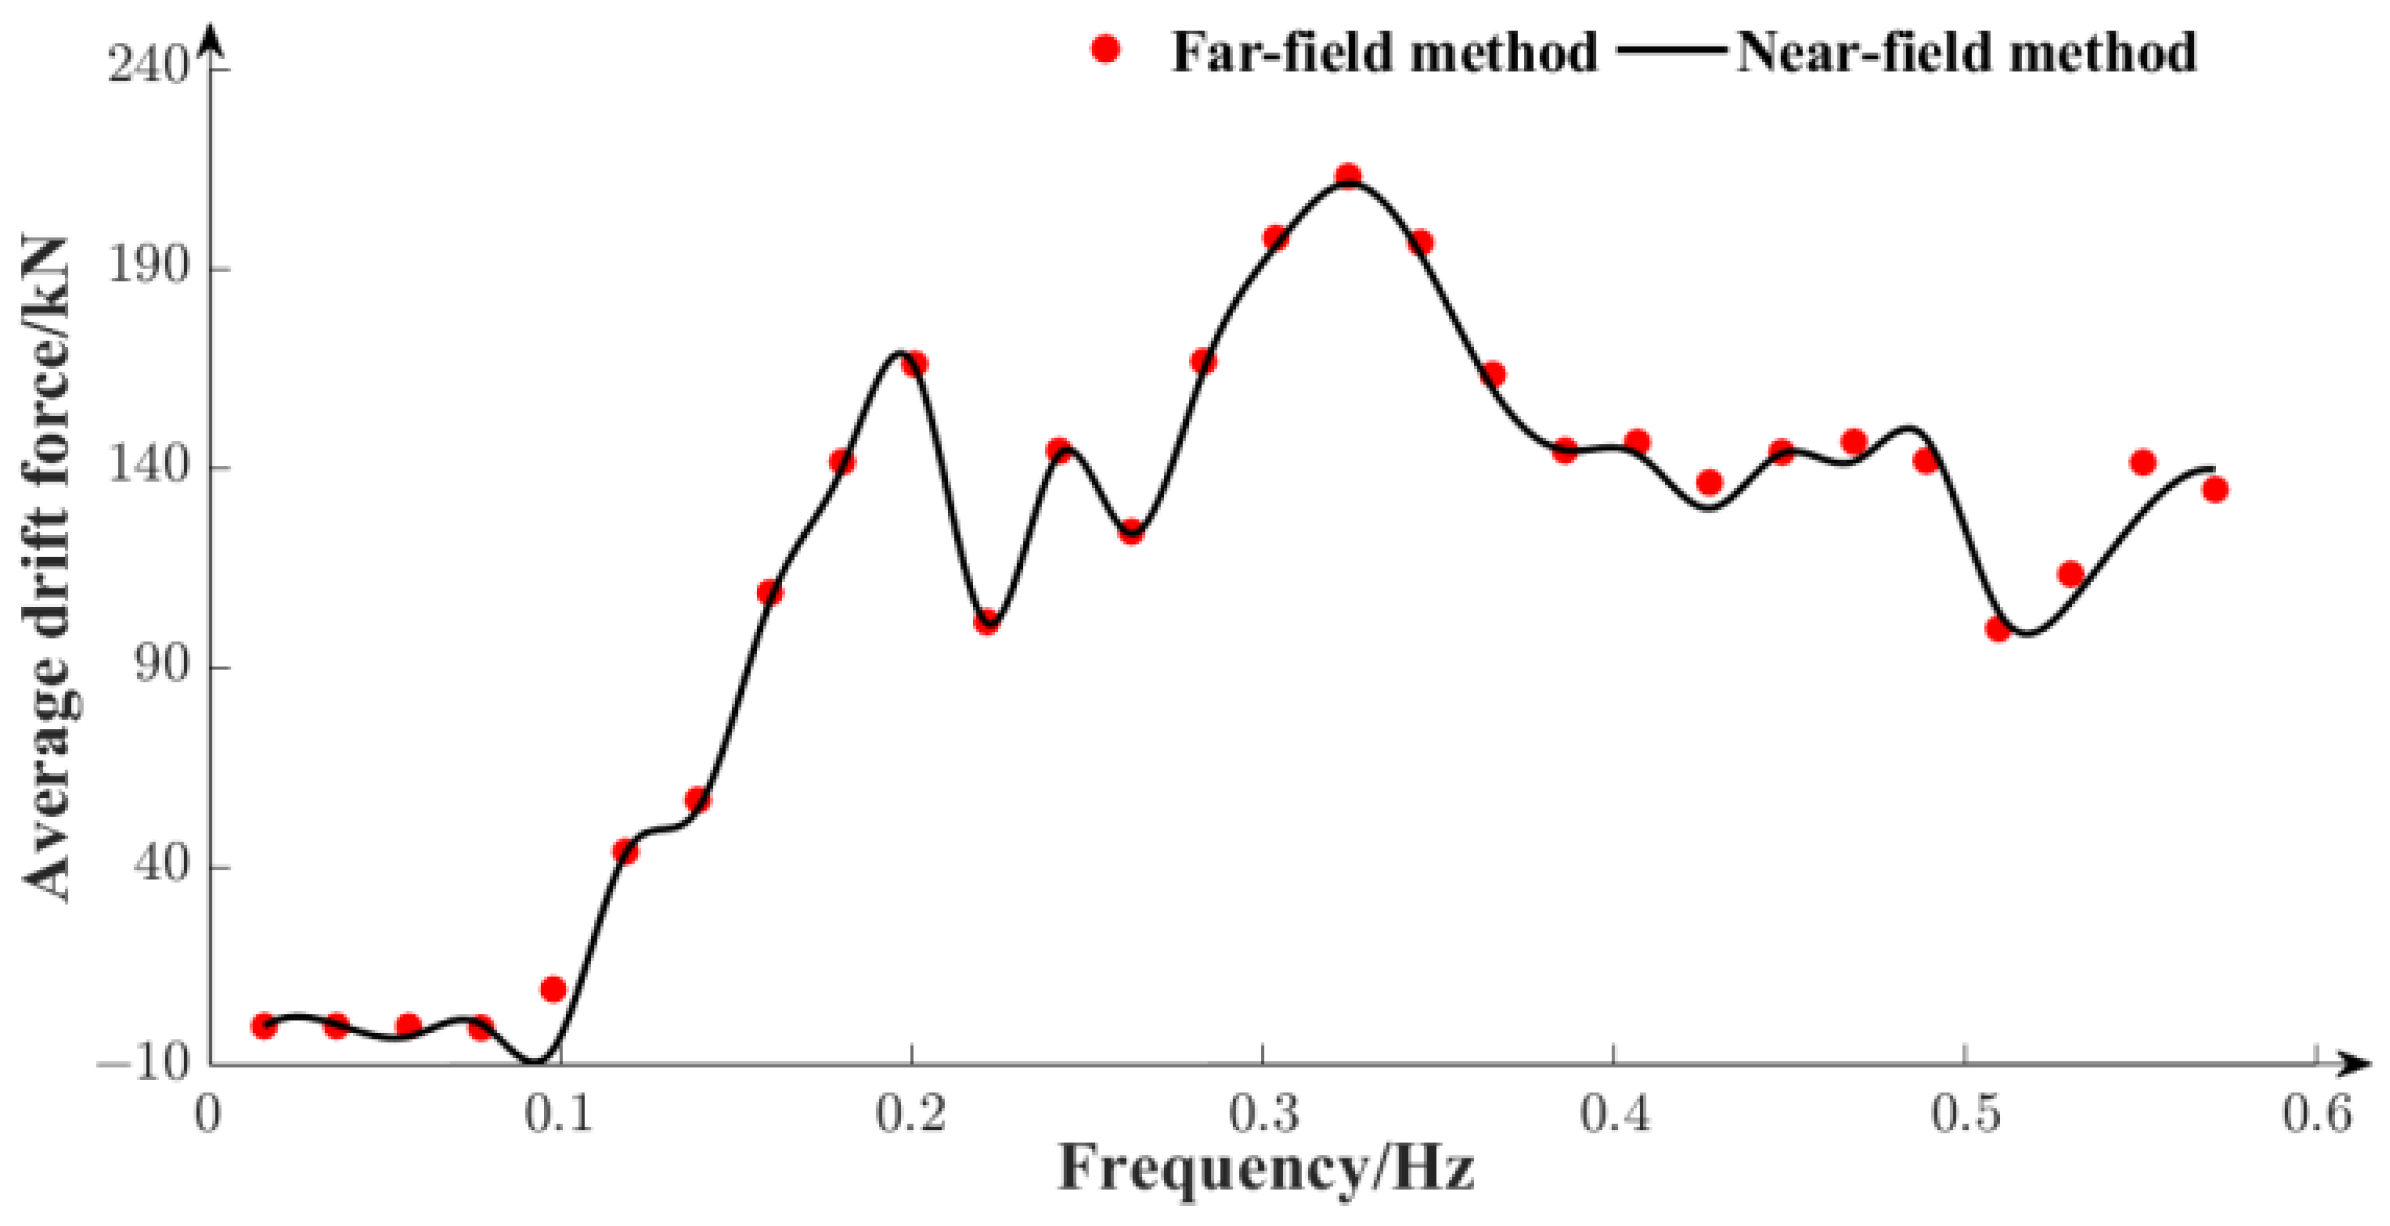
In AQWA, the near-field method is used to solve the average drift force of the floating body in six degrees of freedom by the wet surface integration, and the accuracy of this method depends strictly on the surface mesh quality. However, the far-field method employs the momentum equation to obtain the average drift force of the floating body in three degrees of freedom (surge, sway, and yaw). It exhibits high accuracy and is independent of the mesh quality. Hence, the mesh quality is verified by comparing the obtained average drift forces using the near-field method and far-field method [34]. Figure 4 depicts the average drift forces in the surge direction obtained by the two methods. In comparison, the numerical results obtained with the two methods show the same trend overall, and the errors between the two methods are acceptable. It can be concluded that the mesh quality of the floating platform meets the requirement of a high-accuracy hydrodynamic solution.

5. Results and Analysis

5.1. Free Decay of the Floating Wind Turbine

Regardless of external loads, the free decay numerical analysis of the fully coupled floating wind turbine model is carried out. The platform will experience sinusoidal free vibration. By using Fast Fourier Transform (FFT), the time domain simulation results are converted into frequency domain results to obtain the natural frequency of the floating platform in the six degrees of freedom. Figure 5 presents the free decay and frequency domain response curves in the surge direction. The natural period and frequency of six degrees of freedom are shown in Table 3.
The annual wave period in the South China Sea is mainly concentrated within 10 s, with a minimum wave frequency of 0.1 Hz [35]. The excitation frequency is much higher than the natural frequencies of various degrees of freedom of the floating platform, so resonance does not occur easily during the operation of the platform in the South China Sea.

5.2. Floating Platform Motion Response

5.2.1. Loading Condition

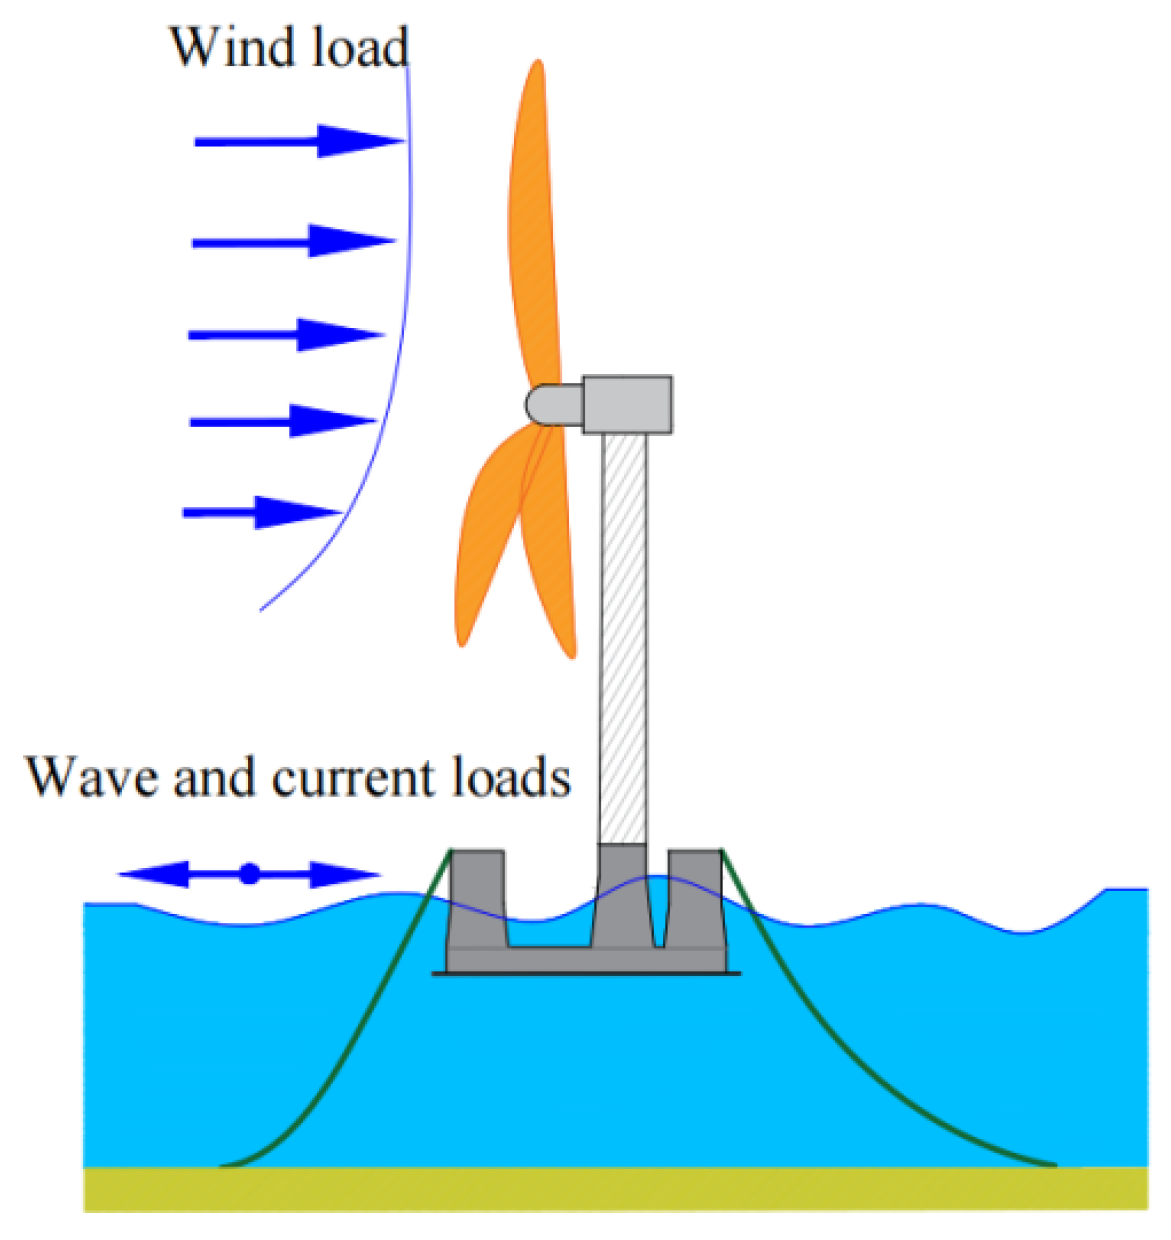
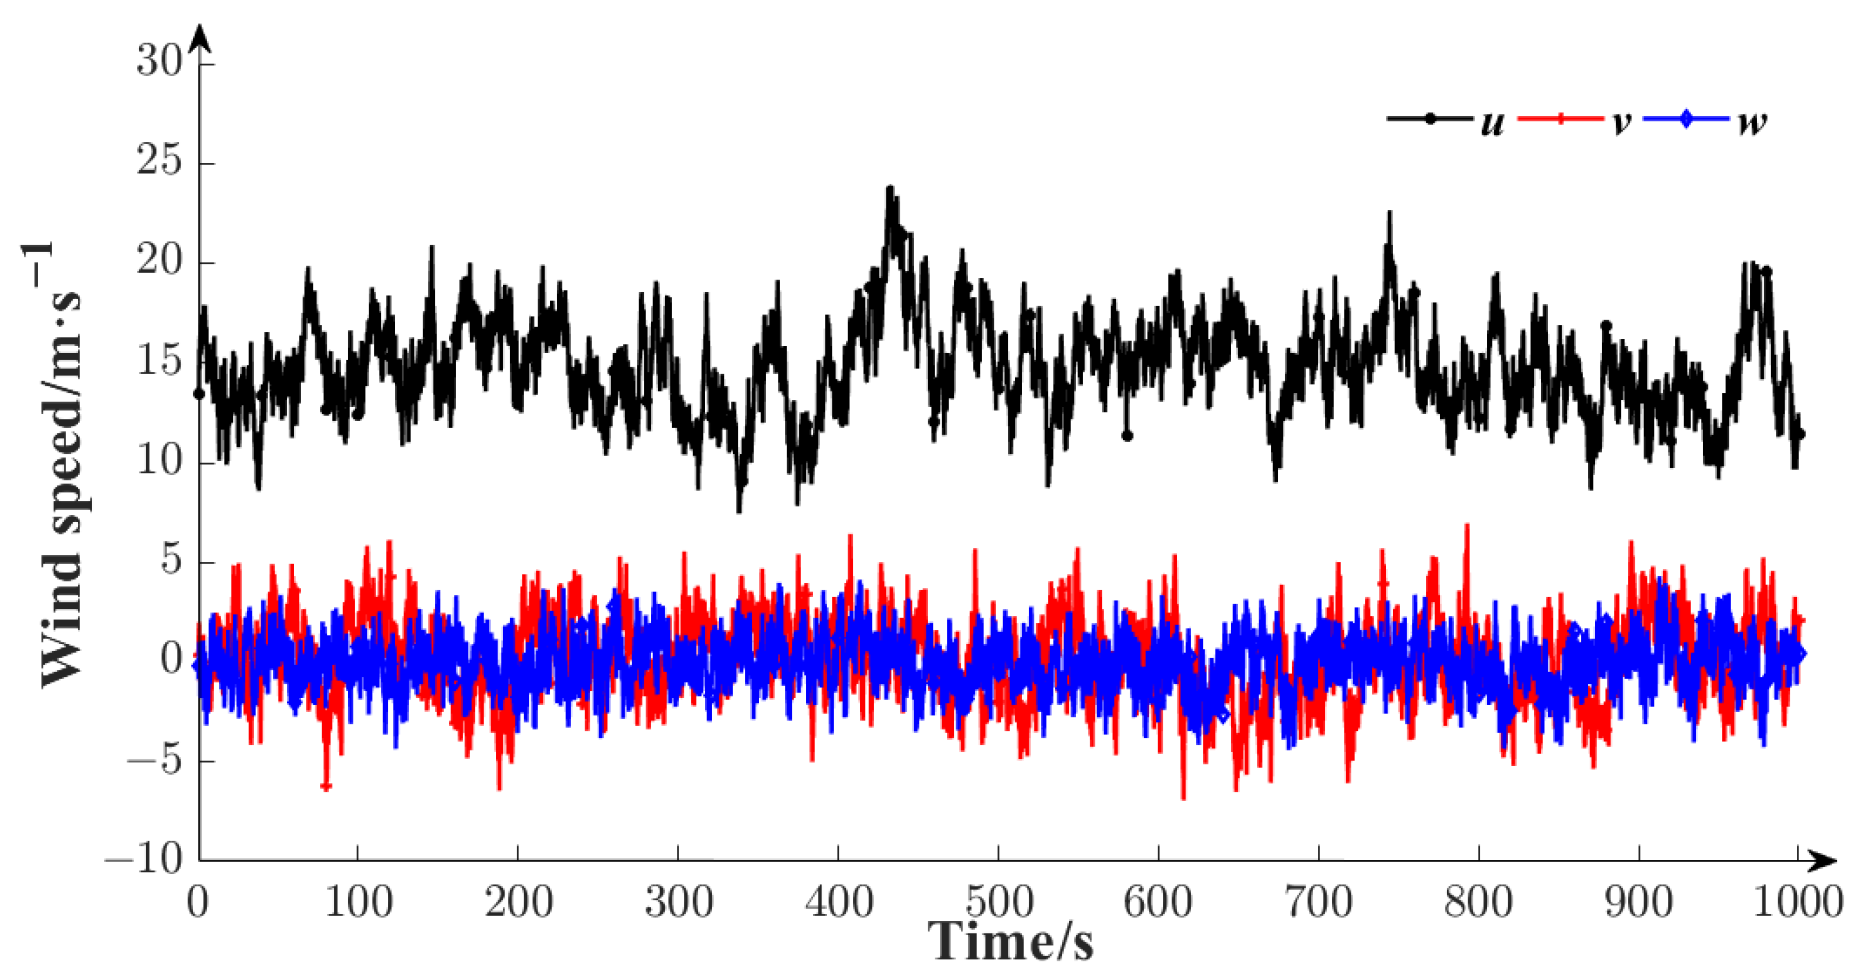
Considering the actual sea conditions, the main operating environmental loads of the floating wind turbine are depicted in Figure 6. Based on the specific environmental conditions in the South China Sea [35], three sets of different sea conditions are considered, with the specific parameters provided in Table 4. The three-dimensional turbulent wind field of 15 m/s generated based on the Kaimal turbulent wind spectrum with the hub center as the reference point is shown in Figure 7, where u, v, and w represent the wind speeds along the x, y, and z axes, respectively. During the simulation, 169 seeds are arranged (13 × 13 in horizontal and vertical directions). The total simulation time is 1000 s, and the time step is set as 0.1 s. The irregular wave time series with a wave height of 3.25 m and a wave period of 10 s generated based on the P–M spectrum is shown in Figure 8.

5.2.2. Motion Response Results and Analysis

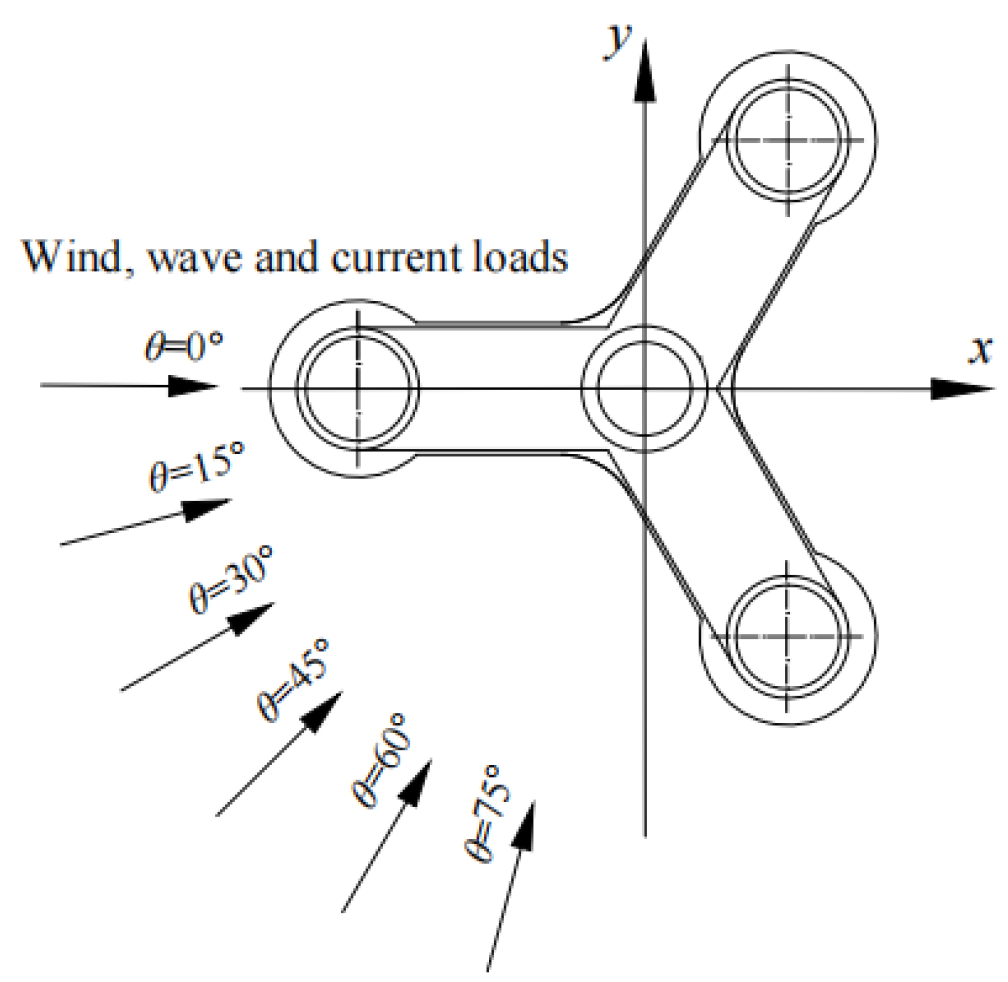
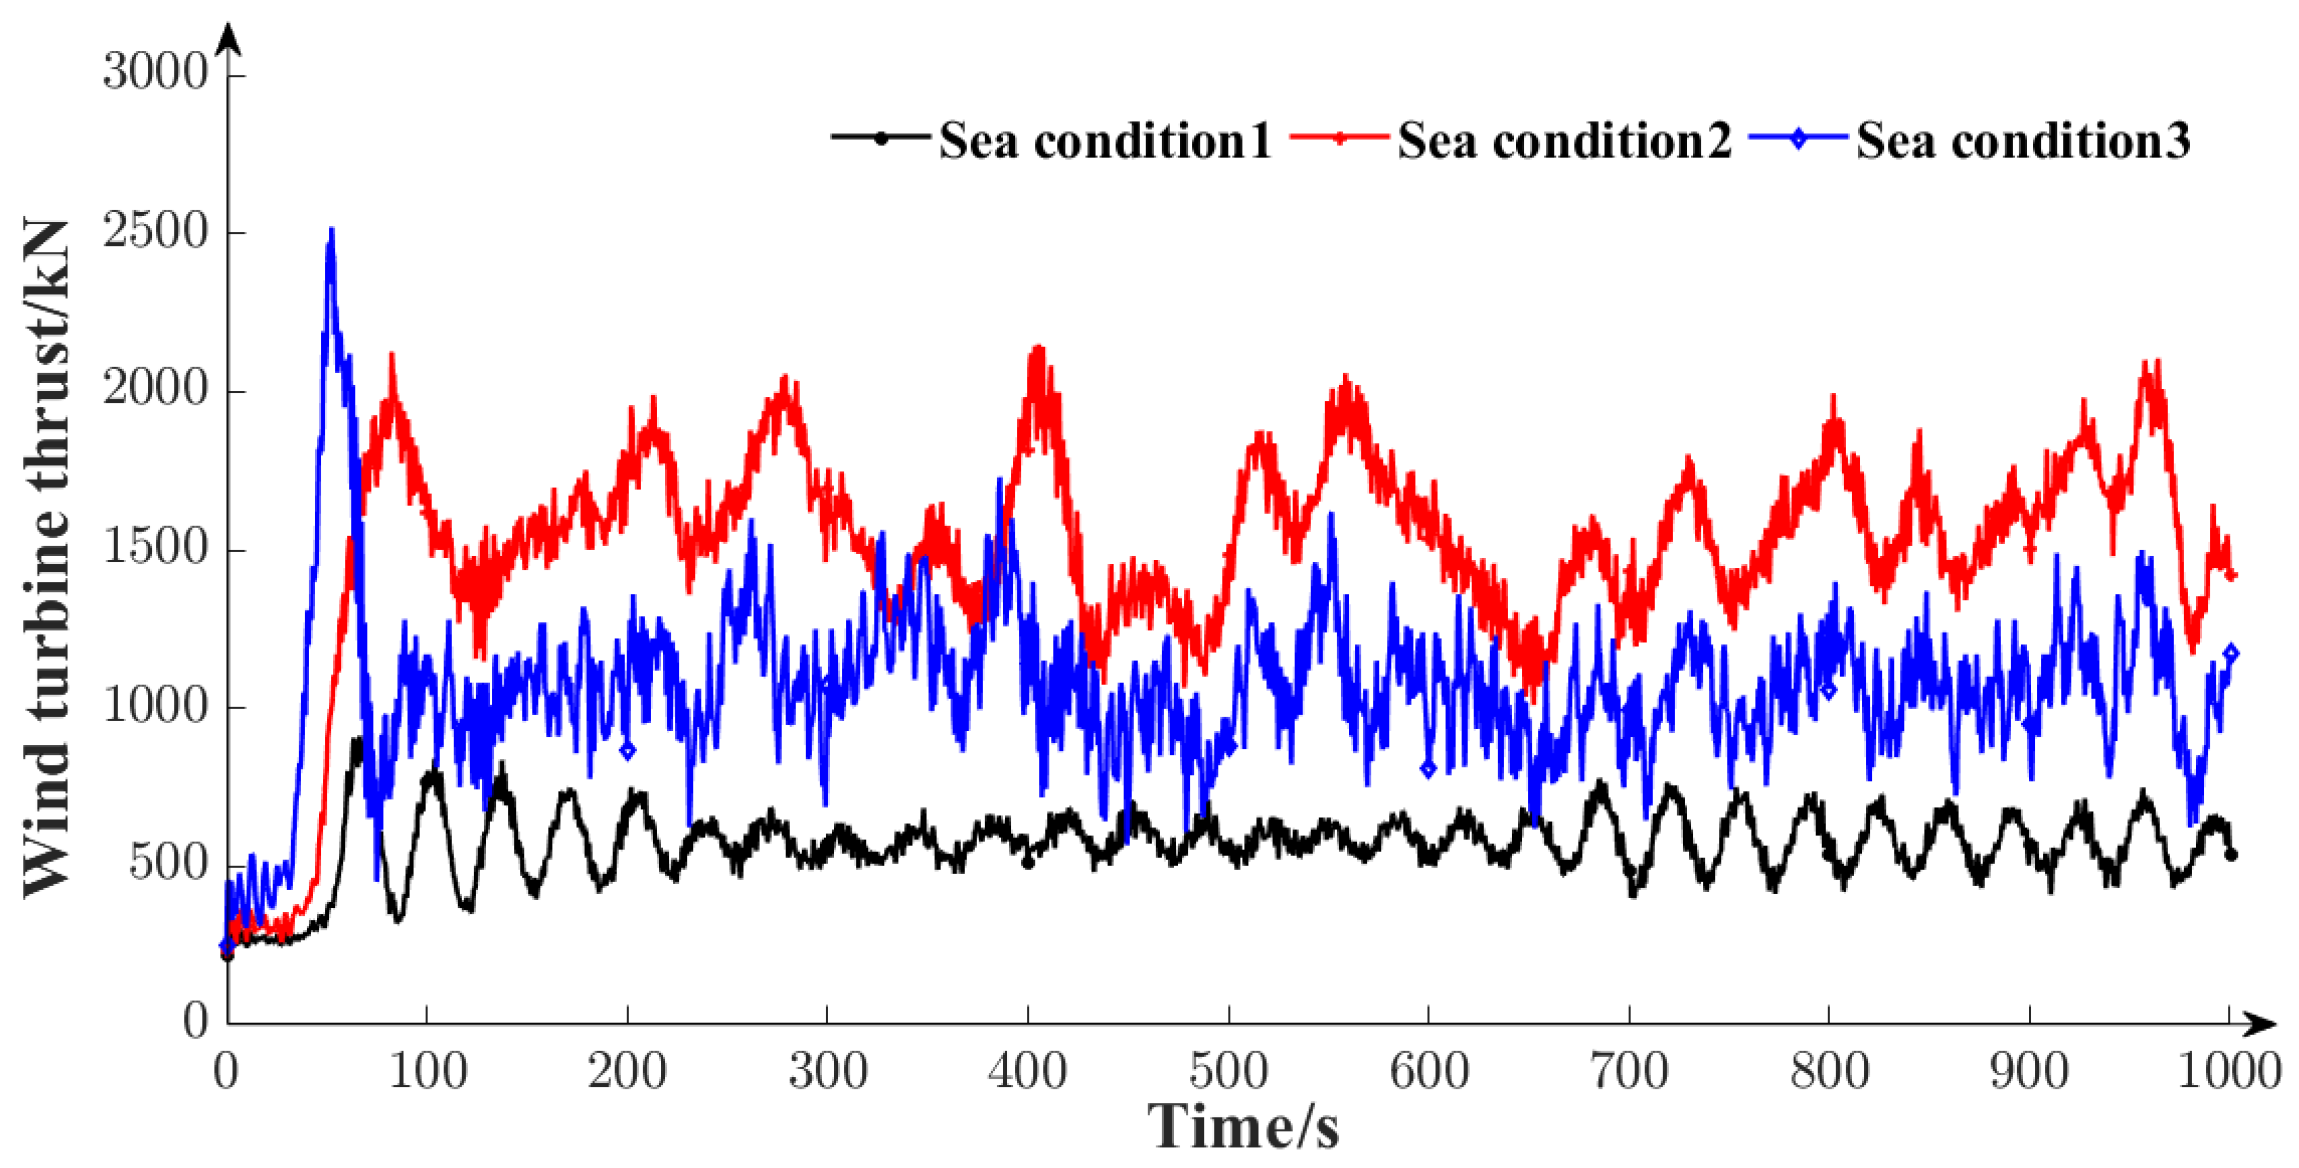
In general, it is challenging to determine the directions of the wind, wave, and current under realistic environmental conditions. Based on DNVGL OS E301 Position Mooring guidelines [36], the most unfavorable scenario occurs when the wind, wave, and current act in the same direction on the structure. Therefore, the environmental loads (wind, wave, and current loads) are assumed to be aligned with same direction on the floating platform, as shown in Figure 9. Considering the symmetry of the platform about the x-axis, the investigation focuses on the incident angles θ within one quadrant. Table 5 presents the motion response values of the floating platform for environmental loads with a 0° incident angle under various sea conditions. Additionally, Figure 10 displays the time domain response curve of the wind turbine thrust under different sea conditions with a 0° incident angle.
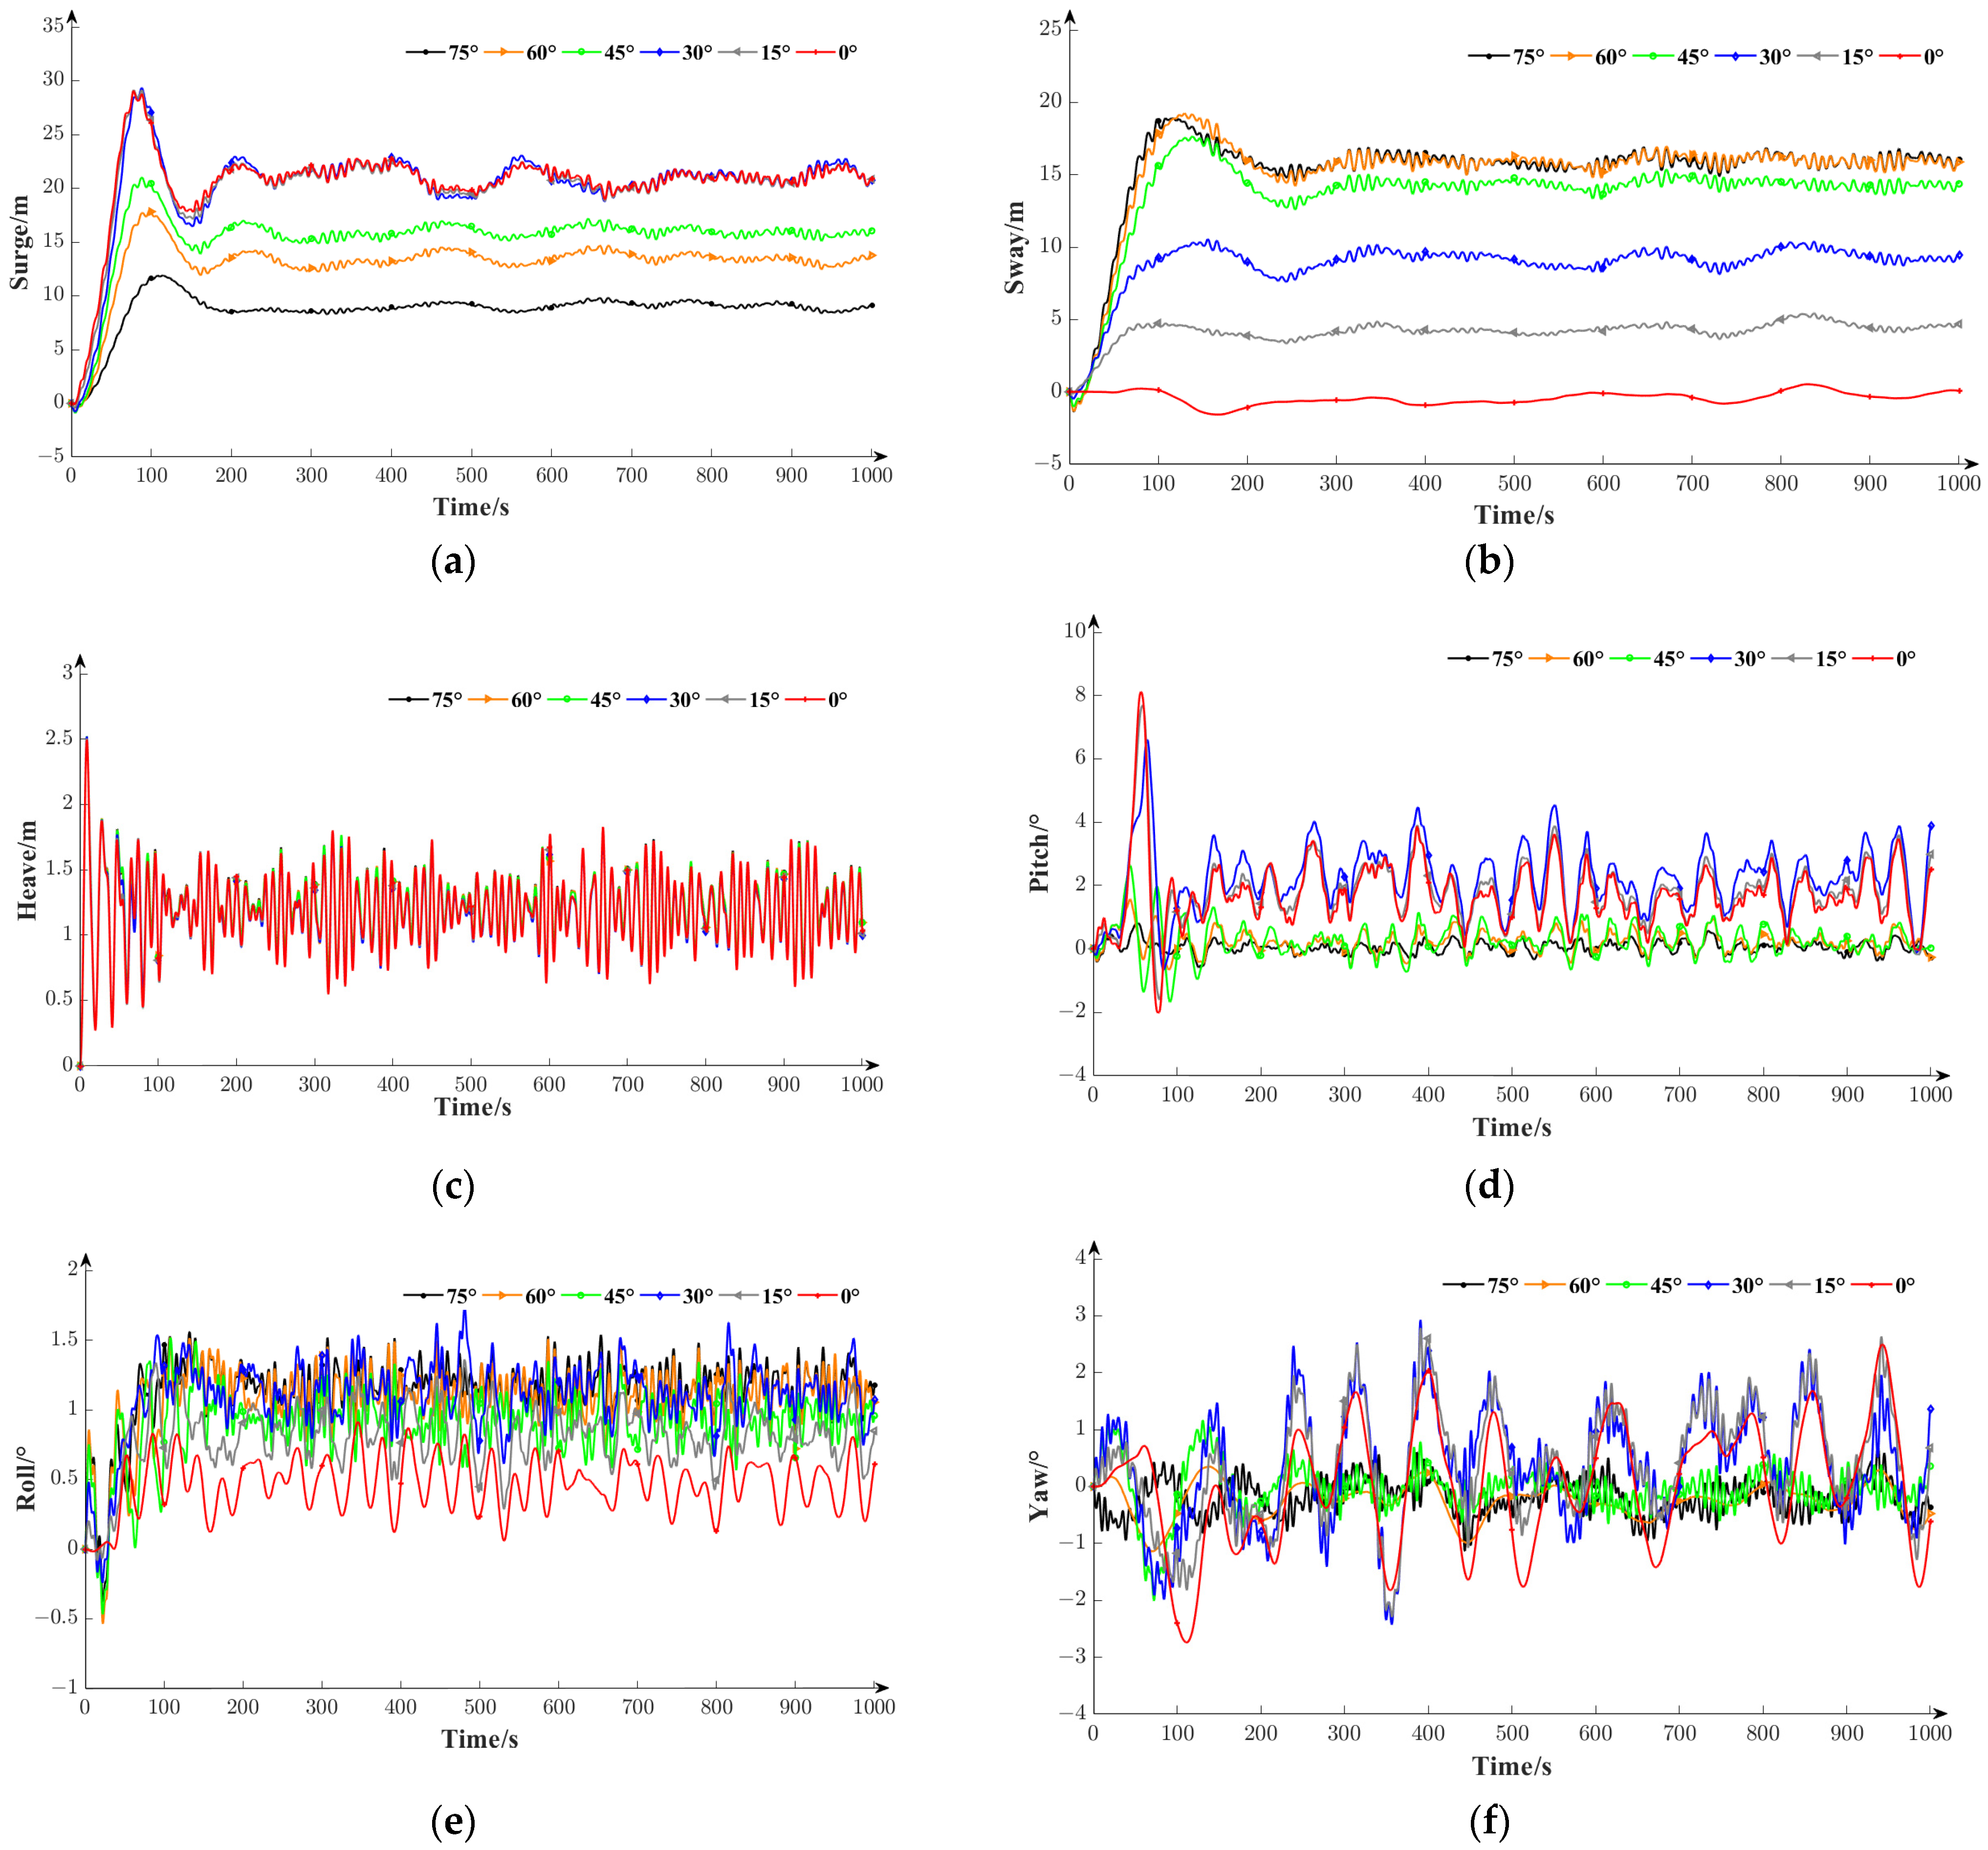
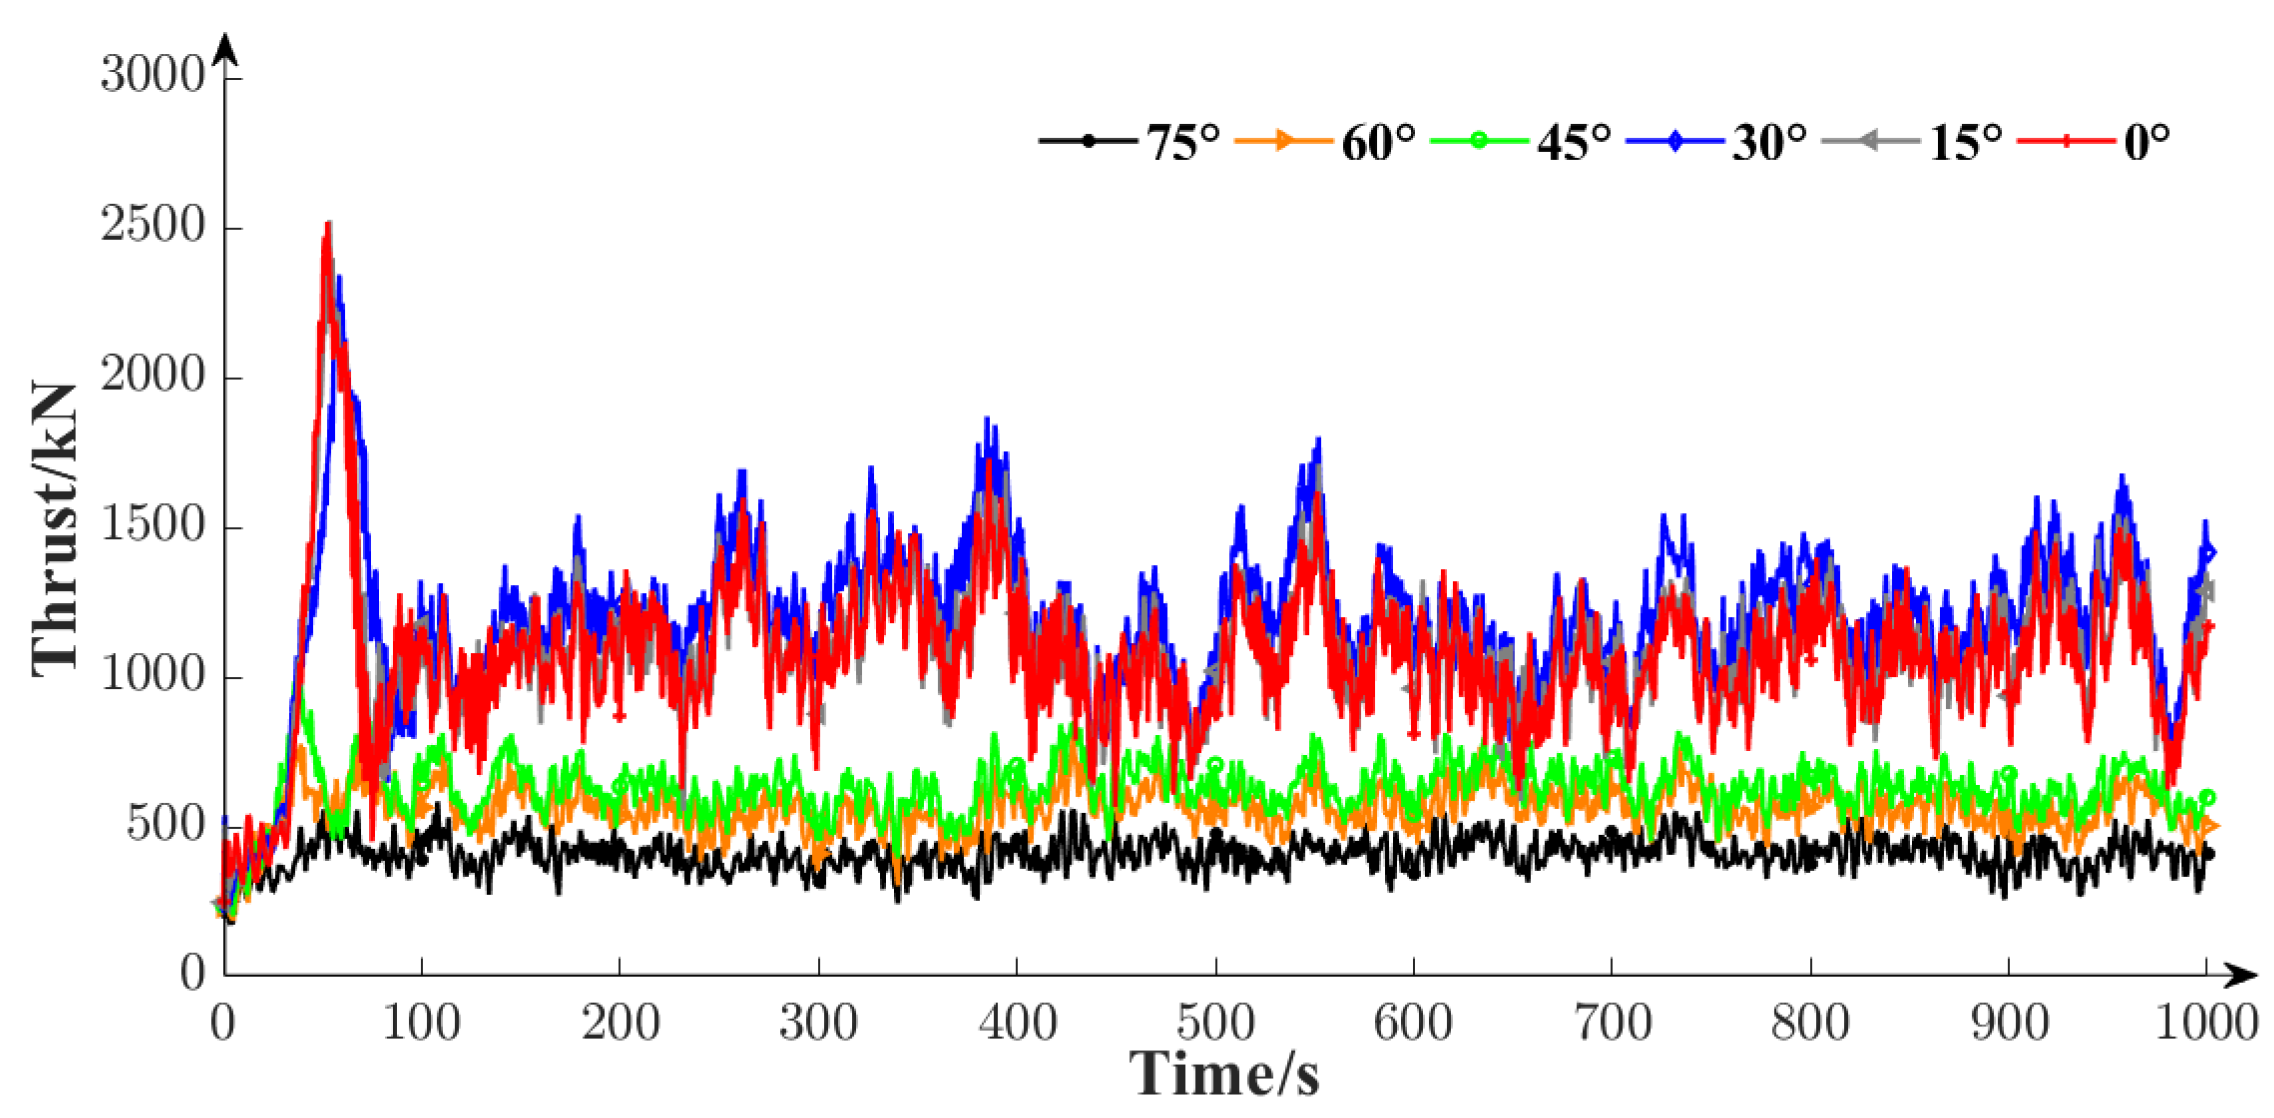
From Table 5, it can be observed that under sea condition 3, the motion response amplitudes of the six degrees of freedom of the floating platform increase to varying degrees compared to sea condition 1 and sea condition 2. Among them, the surge and pitch exhibit more significant changes with varying sea conditions. The motion response amplitudes under sea condition 3 are 29.1 m and 8.12°, respectively, which are 1.29 times and 1.56 times higher than those under sea condition 1 and 7.9% and 33.3% higher, respectively, than those under sea condition 2. Although the wind speed under sea condition 3 is higher than that under sea condition 2 (11.4 m/s), as shown in Figure 10, due to the pitch control of the wind turbine [37], the average thrust of the wind turbine is 1070 kN, which is 29.13% lower than that under sea condition 2. Therefore, under the combined effect of the wind, wave, and current loads, the increase in surge and pitch motion responses is slower compared to that under sea condition 1 but still exhibits an overall upward trend. Hence, sea condition 3 is considered the harsh condition for further studying the effect of the environmental loads’ incident angles on the motion response of the floating platform. The platform’s motion responses under different incident angles are shown in Figure 11. The time domain response curve of the wind turbine thrust under different incident angles is presented in Figure 12.
According to Figure 11, it can be observed that the motion responses of the six degrees of freedom of the floating platform exhibit different patterns with changes in the incident angles of the environmental loads. (1) In the surge and pitch directions, as the incident angle increases from 0° to 30°, the motion responses of the surge and pitch remain relatively stable, with amplitudes of 29.1 m and 8.12°, respectively. As the incident angle continues to increase, the motion responses of the surge and pitch decrease, with amplitudes decreasing to 11.9 m and 0.803°, respectively. Combined with the wind turbine thrust shown in Figure 12, when the incident angle increases from 0° to 30°, the average wind turbine thrust remains around 1070 kN. As the incident angle further increases, the wind turbine thrust gradually decreases, reaching its minimum value at a 75° incident angle. Accordingly, the motion response amplitudes of the floating platform in the surge and pitch directions also reach their minimum values. (2) In the sway and roll directions, the motion responses of the sway and roll gradually increase with increasing incident angle. At a 45° incident angle, the sway response amplitude significantly increases to 17.6 m, while the roll motion response reaches its maximum value of 1.75° at a 30° incident angle and then maintains at around 1.56°. (3) In the heave direction, the change in the incident angle has almost no effect on the motion response. In the yaw direction, the motion response initially increases and then decreases with increasing incident angle. At a 30° incident angle, the motion response amplitude in the yaw direction reaches its maximum value of 2.93°. (4) The maximum motion response amplitude in the pitch direction is observed when the incident angle is 0°, which is 8.12°, below 10°, and the average value is 1.70°, below 5°, satisfying the stability requirements specified by the relational guidelines [38]. Therefore, the platform meets the stability requirements for normal power generation operation.

5.3. Structural Strength Analysis of the Floating Platform

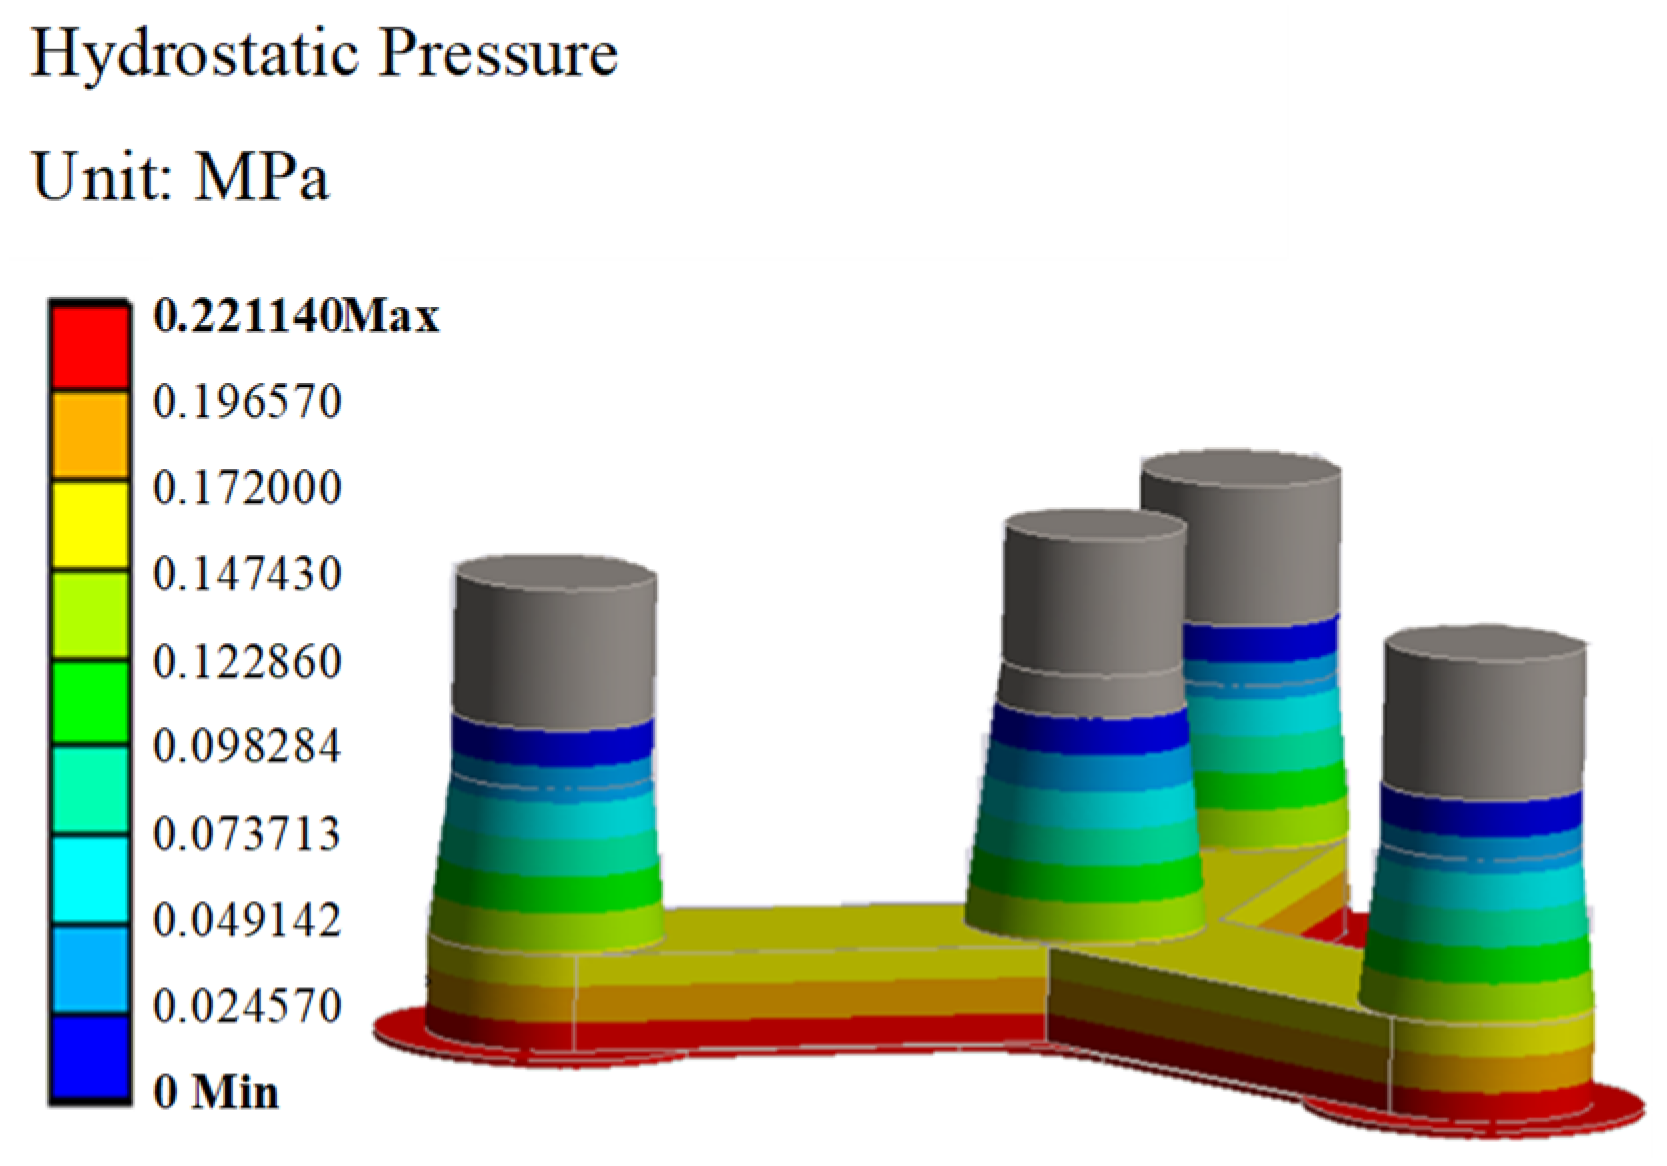
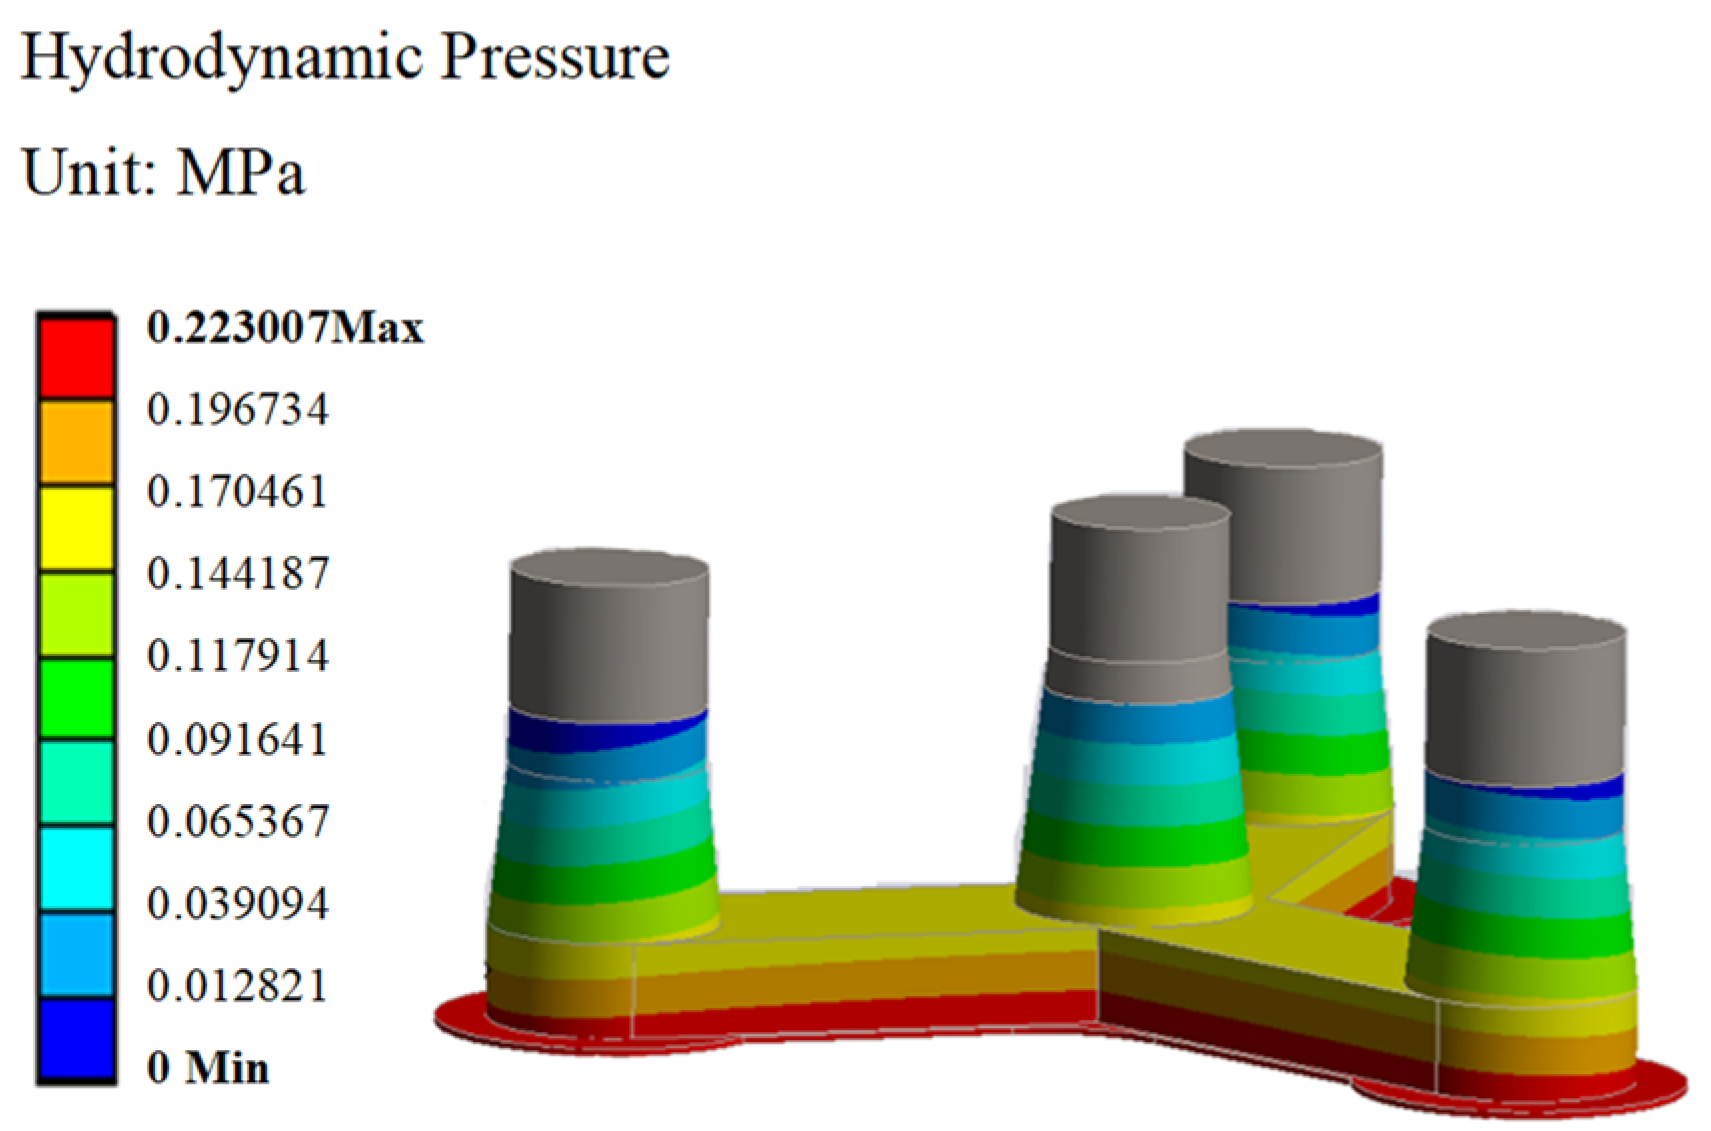
Taking harsh sea conditions into account, the structural strength analysis of the floating platform under harsh environmental conditions is conducted, considering the wind load on the blades, the wave load, the current load, and gravitational forces. The finite element analysis method is used. In the case of the floating platform, approximately two-thirds of its structure is submerged in seawater, and the wave load constitutes a significant part of the external environmental loads it experiences. Therefore, the accurate transfer of the hydrodynamic load to the structure is crucial for the structural strength analysis. The total hydrodynamic load consists of the hydrostatic pressure load and dynamic pressure load. When considering only the hydrostatic pressure load, as shown in Figure 13, the load transferred to the bottom of the floating platform is 0.22114 MPa. The formula for calculating the pressure exerted on the bottom of the floating platform is ρ w g h , where ρ w is the seawater density (1025 kg/m3), g is the gravitational acceleration (9.81 m/s2), and h is the draft depth of the platform (22 m); accordingly, the pressure on the bottom of the floating platform should be 0.221215 MPa. The accuracy of the hydrodynamic load transfer is preliminarily verified.
Subsequently, the dynamic pressure load at different phases (ψ) is further considered. The phases ψ are set at 0°, 30°, 60°, and 90°. The water pressure cloud image under the condition of a 0° wave direction, 10 s wave period, 3.25 m wave height, and ψ = 0° state is shown in Figure 14.
Therefore, in this study the hydrodynamic load data obtained from the AQWA analysis is extracted and transferred to the finite element structural model through the fluid–structure coupling interface. Additionally, the wind load on the 10 MW wind turbine blades, calculated using OpenFAST simulation, and the current load computed using Equation (8) are considered. The environmental loads (wind, wave, and current loads) are applied in the same direction, which represents the most unfavorable environmental conditions, for the structural strength analysis of the floating platform.

5.3.1. Deformation Analysis of the Floating Platform

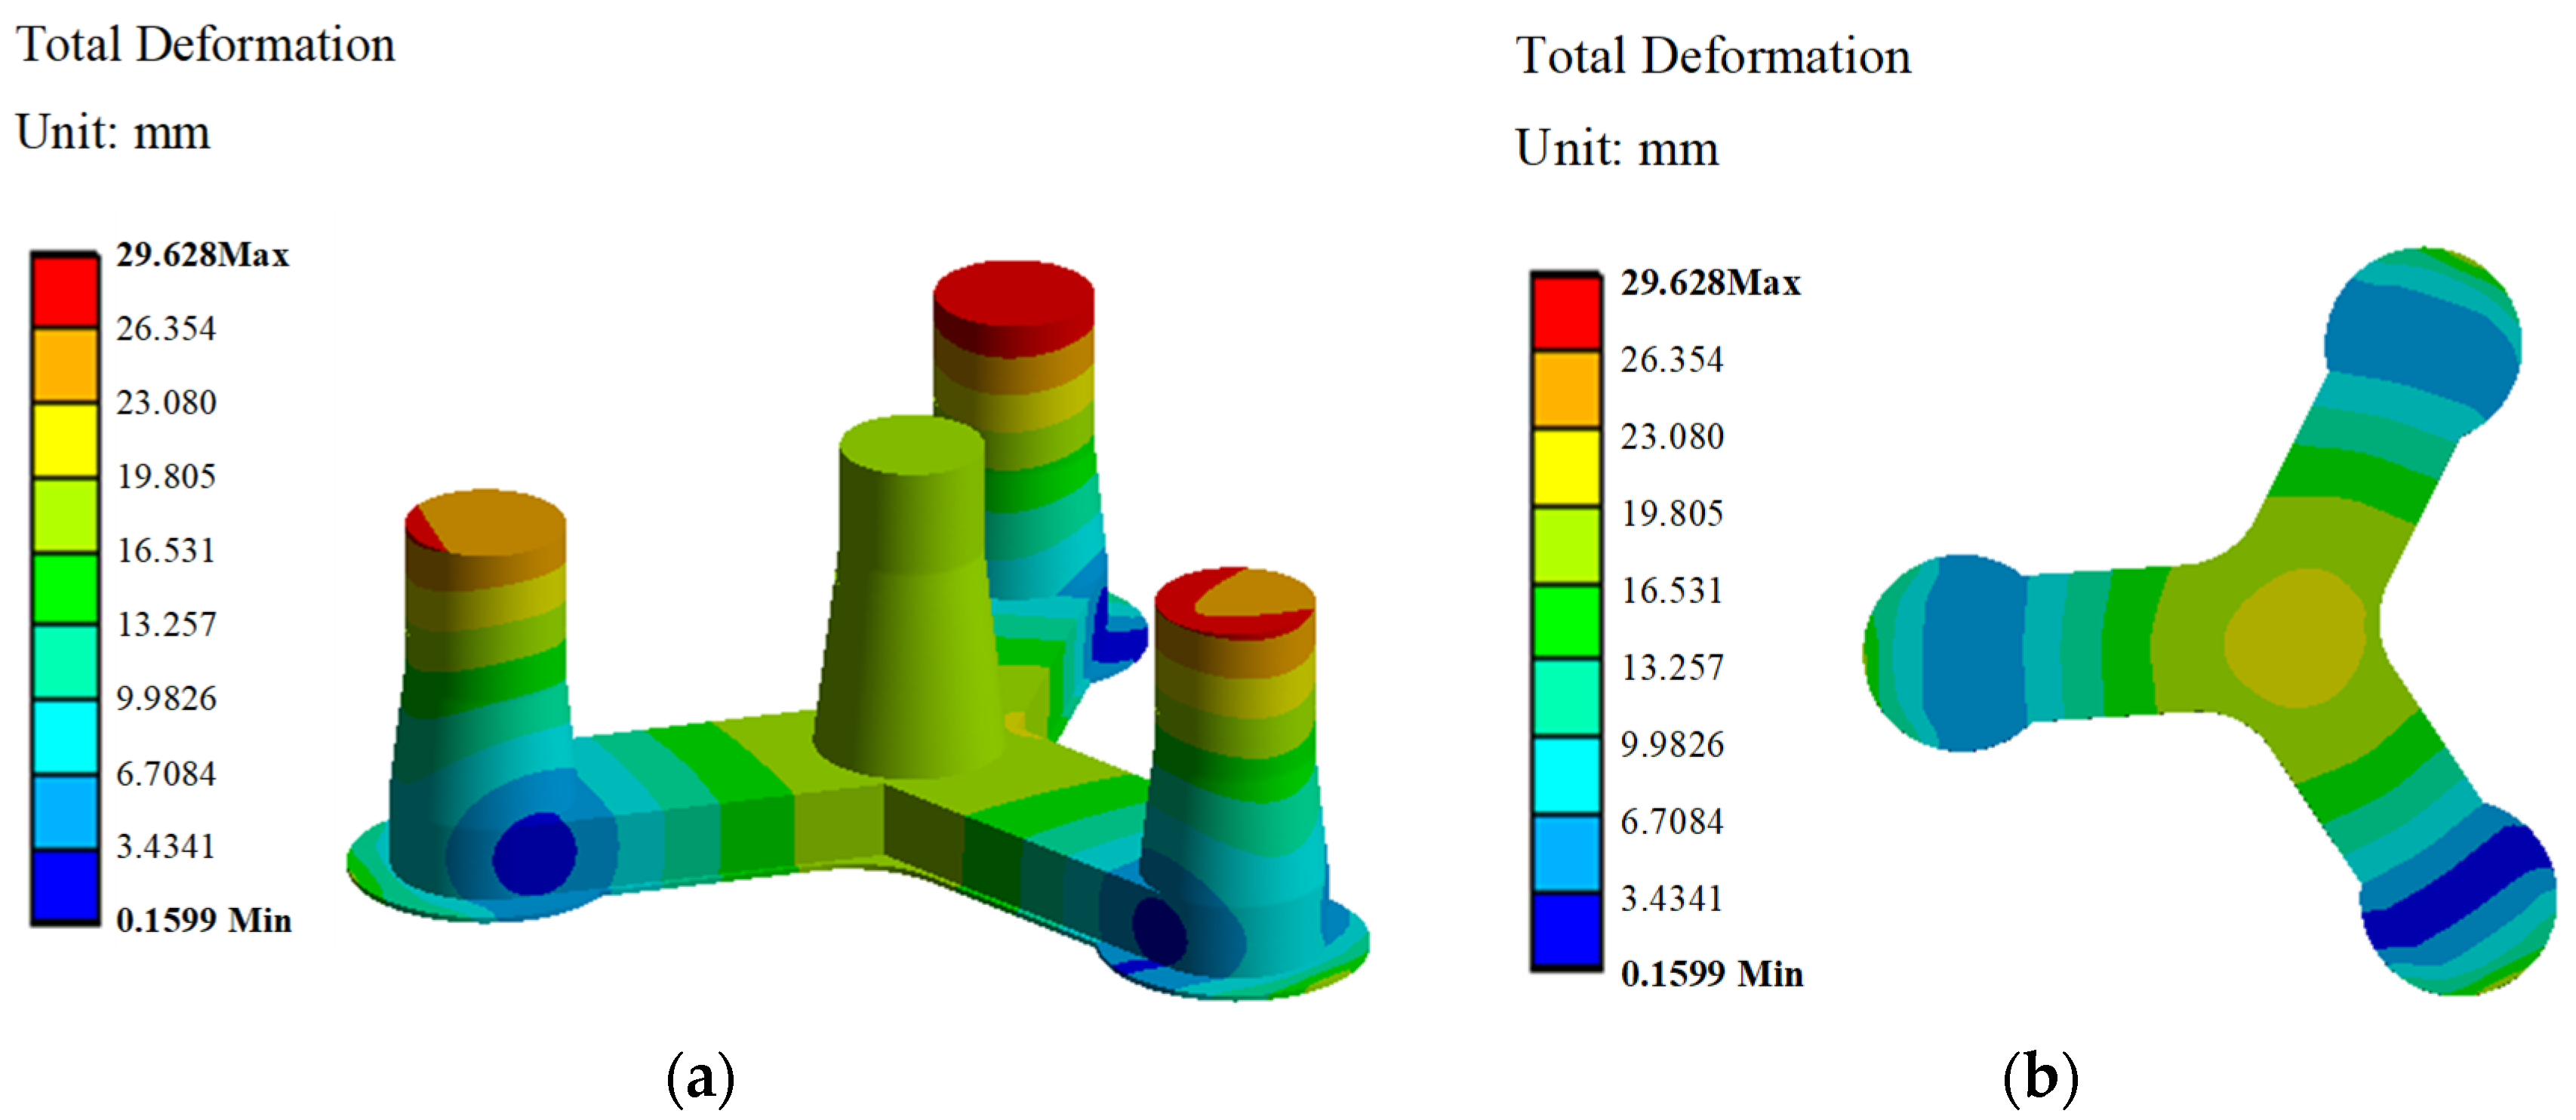
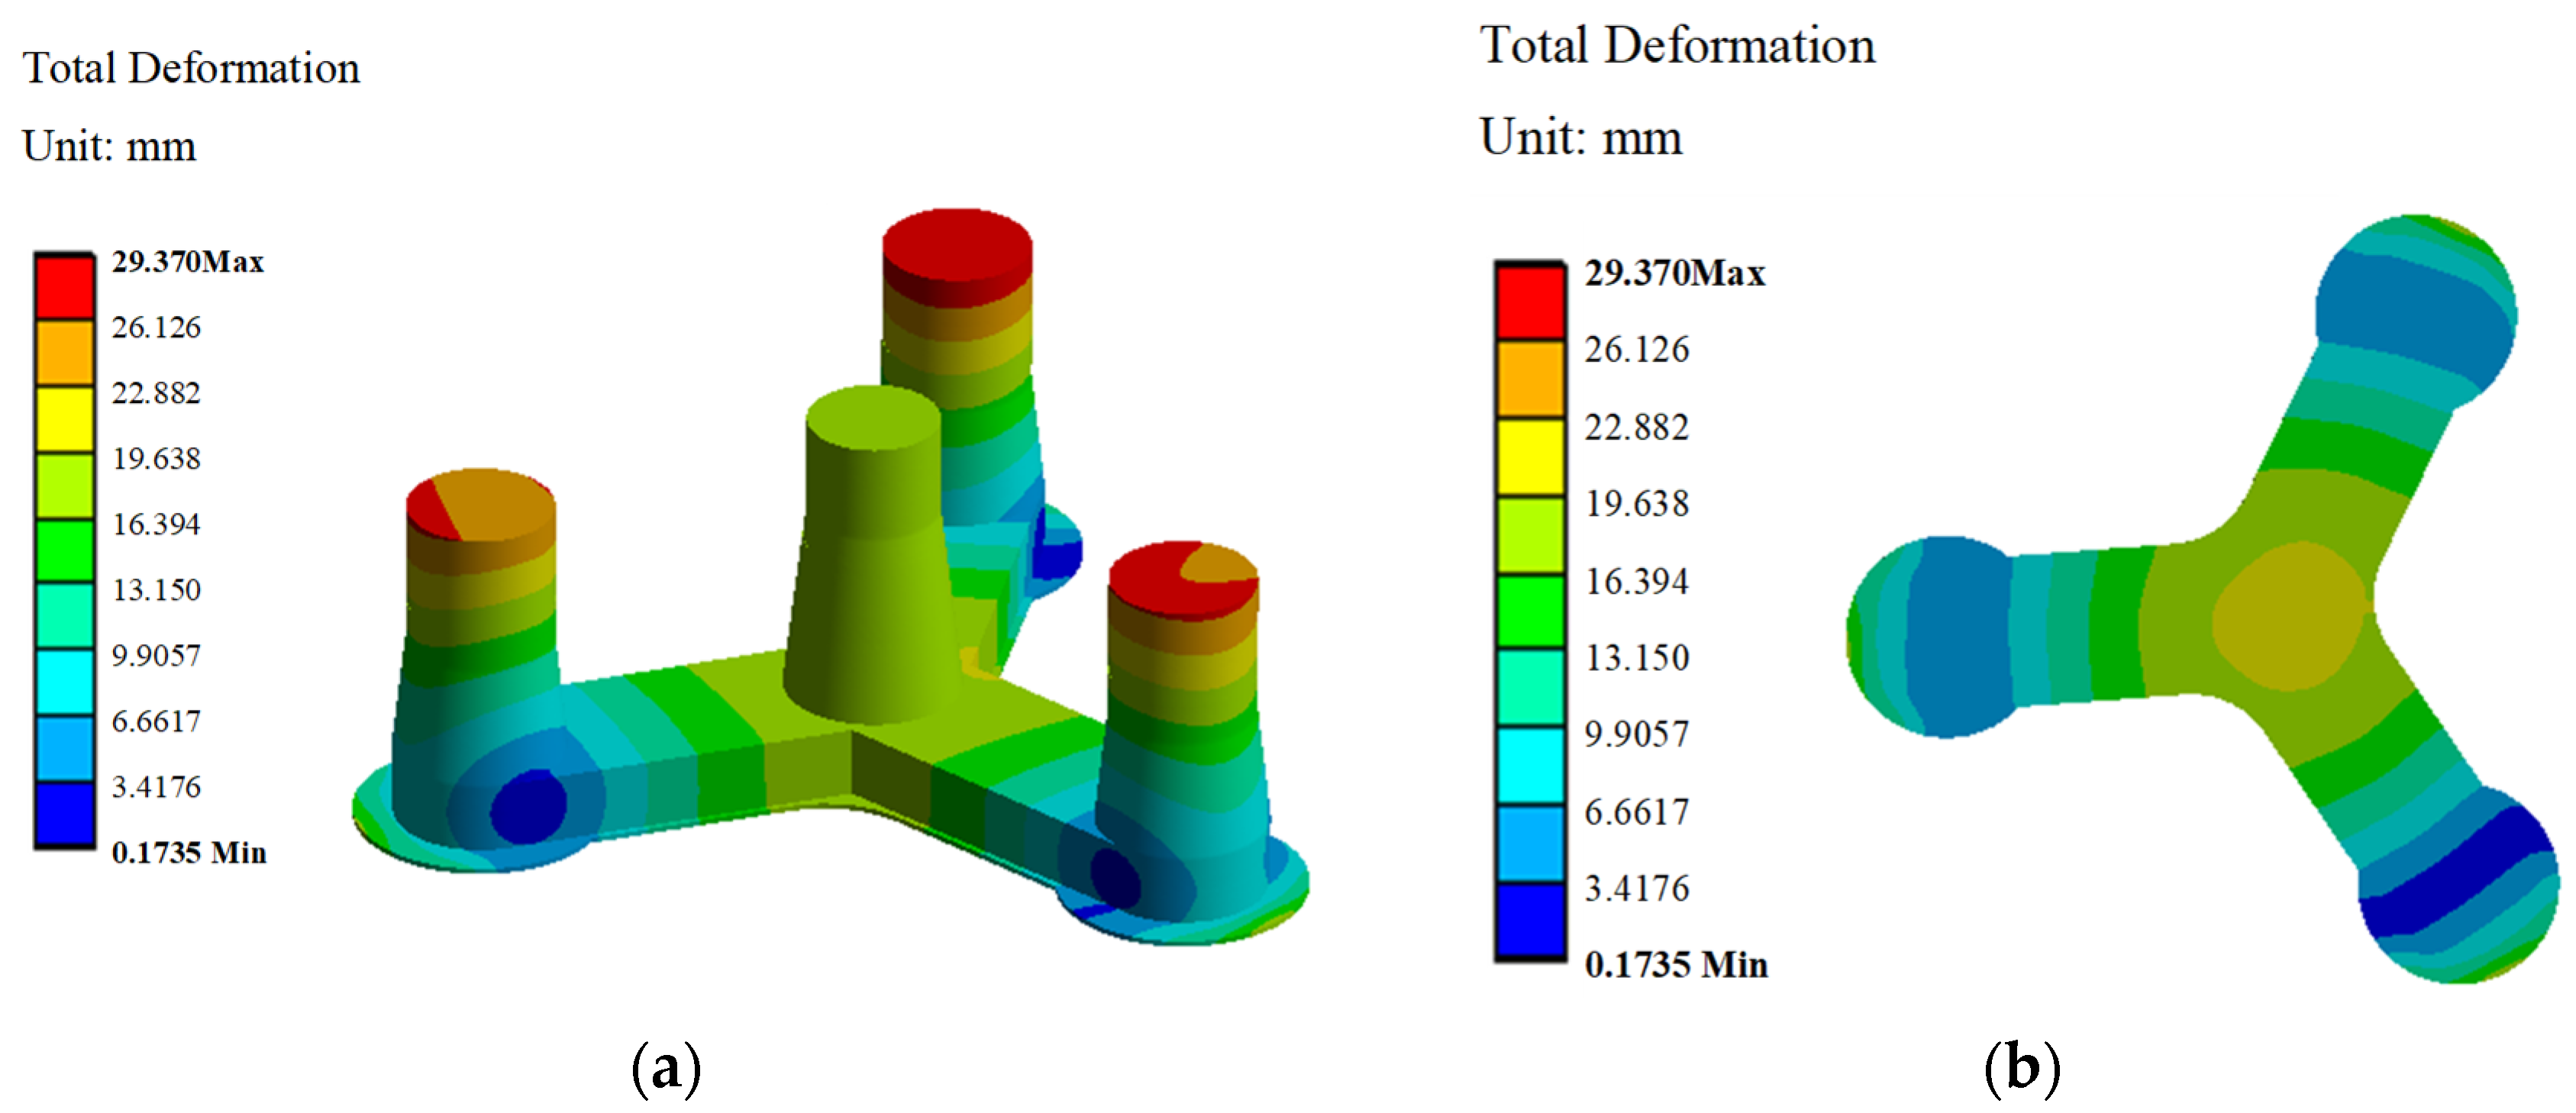
Table 6 shows the maximum deformation values of the floating platform under the wind load, wave load in different phases, and current load for different incident angles. Figure 15 and Figure 16 present the deformation cloud maps of the floating platform with θ = 0°, ψ = 0° state and θ = 60°, ψ = 90° state, respectively.
From the results show in Table 6 and Figure 15 and Figure 16, it can be observed that the incident angles of the environmental loads and the phases of the wave load have a certain influence on the deformation of the floating platform. (1) In terms of numerical values, or the environmental loads with θ = 0°, ψ = 0° state, the maximum deformation of the floating platform is 29.628 mm. For the same incident angles of environmental loads, as the phases of the wave load increase, the maximum deformation tends to decrease. For the environmental loads with θ = 60°, ψ = 90° state, the minimum deformation of the floating platform is 29.37 mm. (2) As shown in Figure 15 and Figure 16, under various environmental load conditions, the maximum deformation of the floating platform occurs at the top of the outer three columns.

5.3.2. Stress Analysis of the Floating Platform

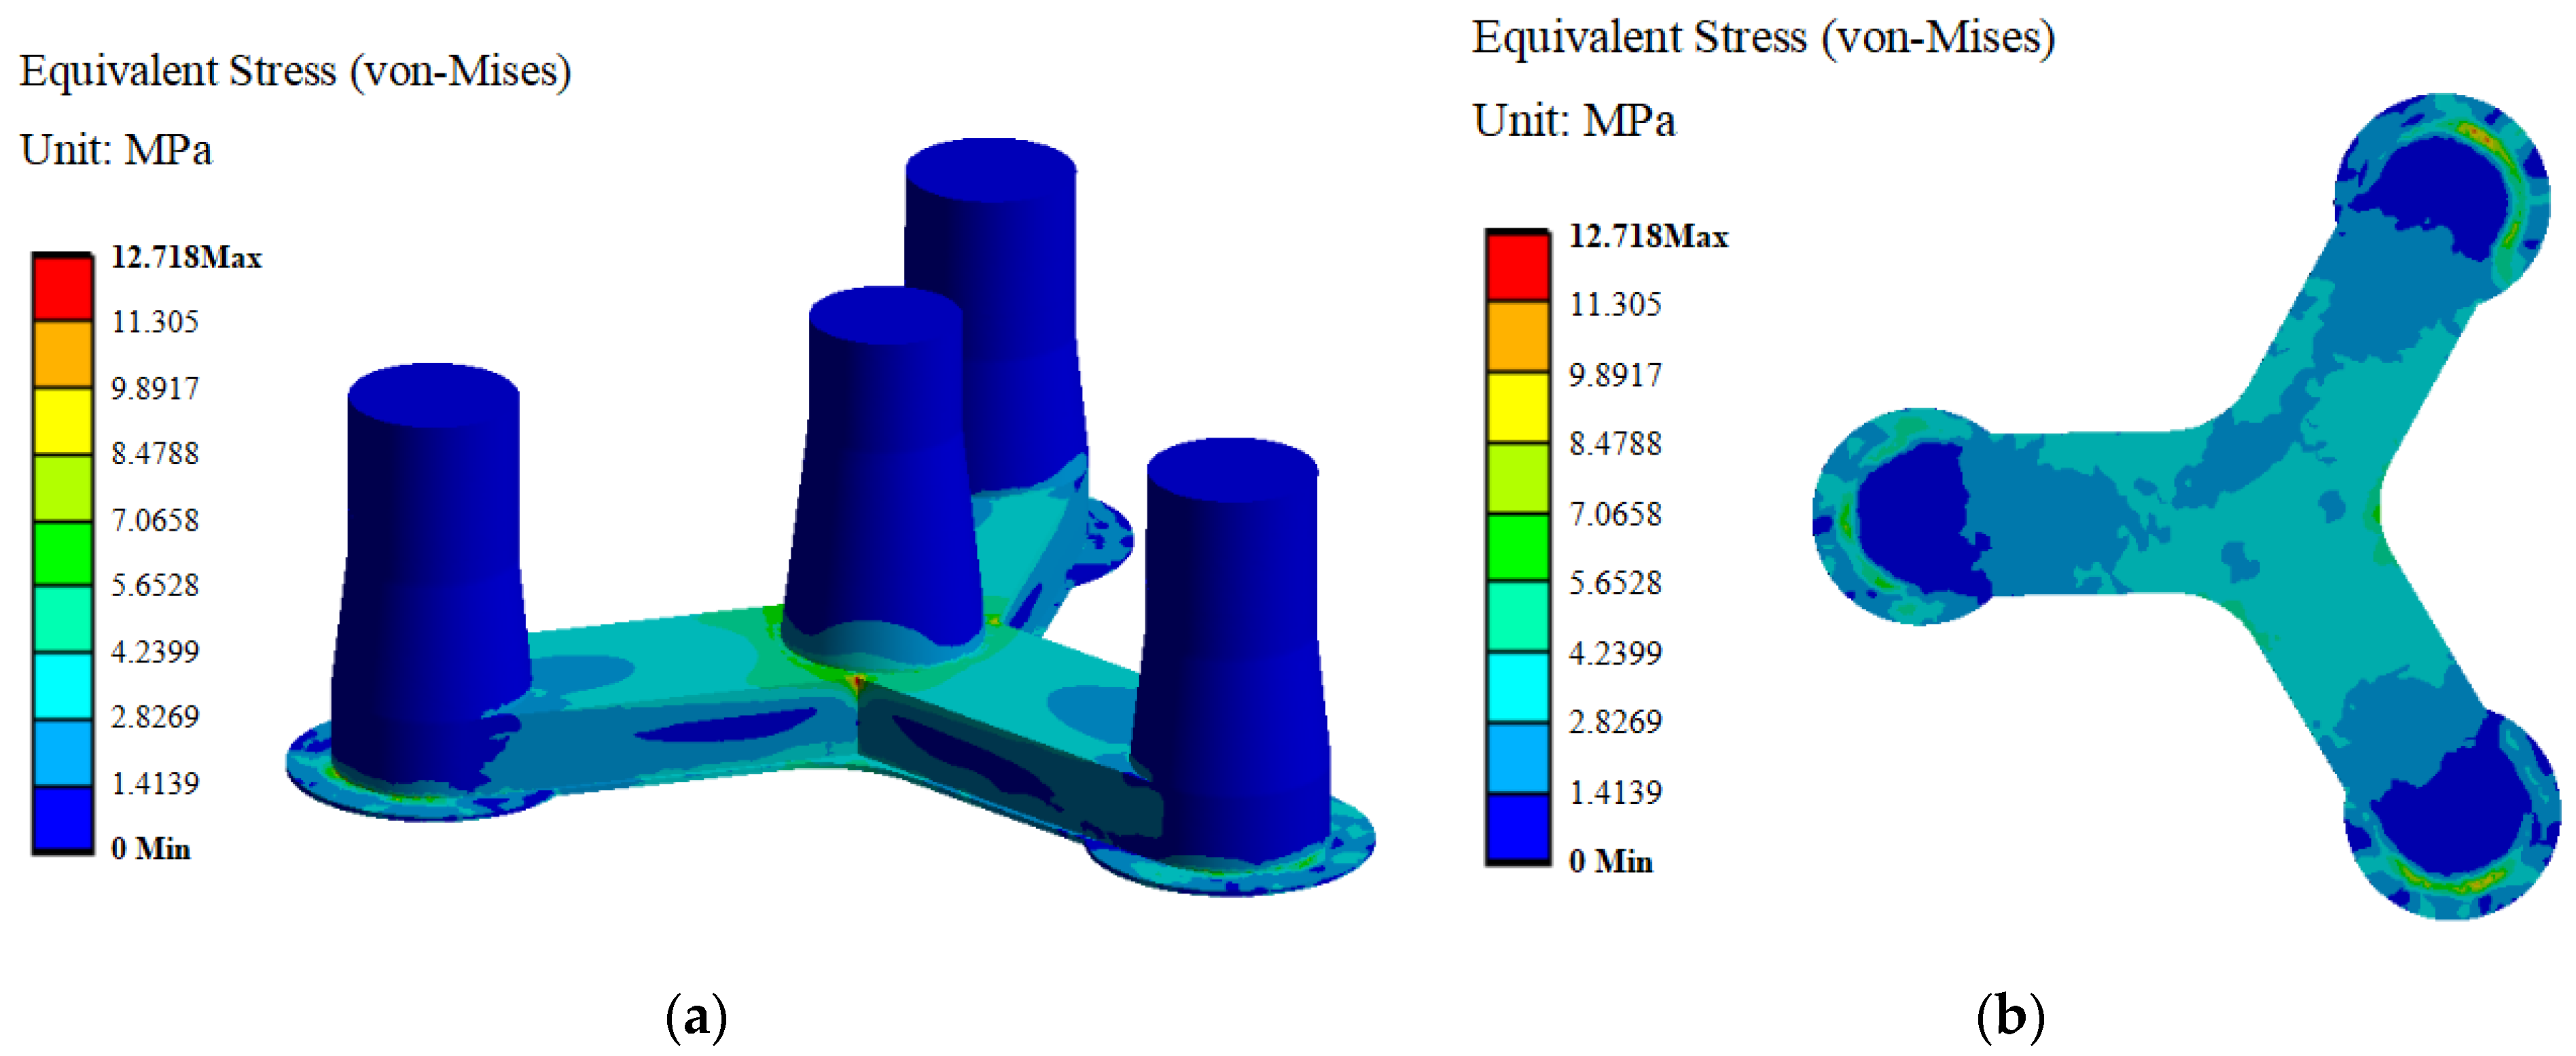
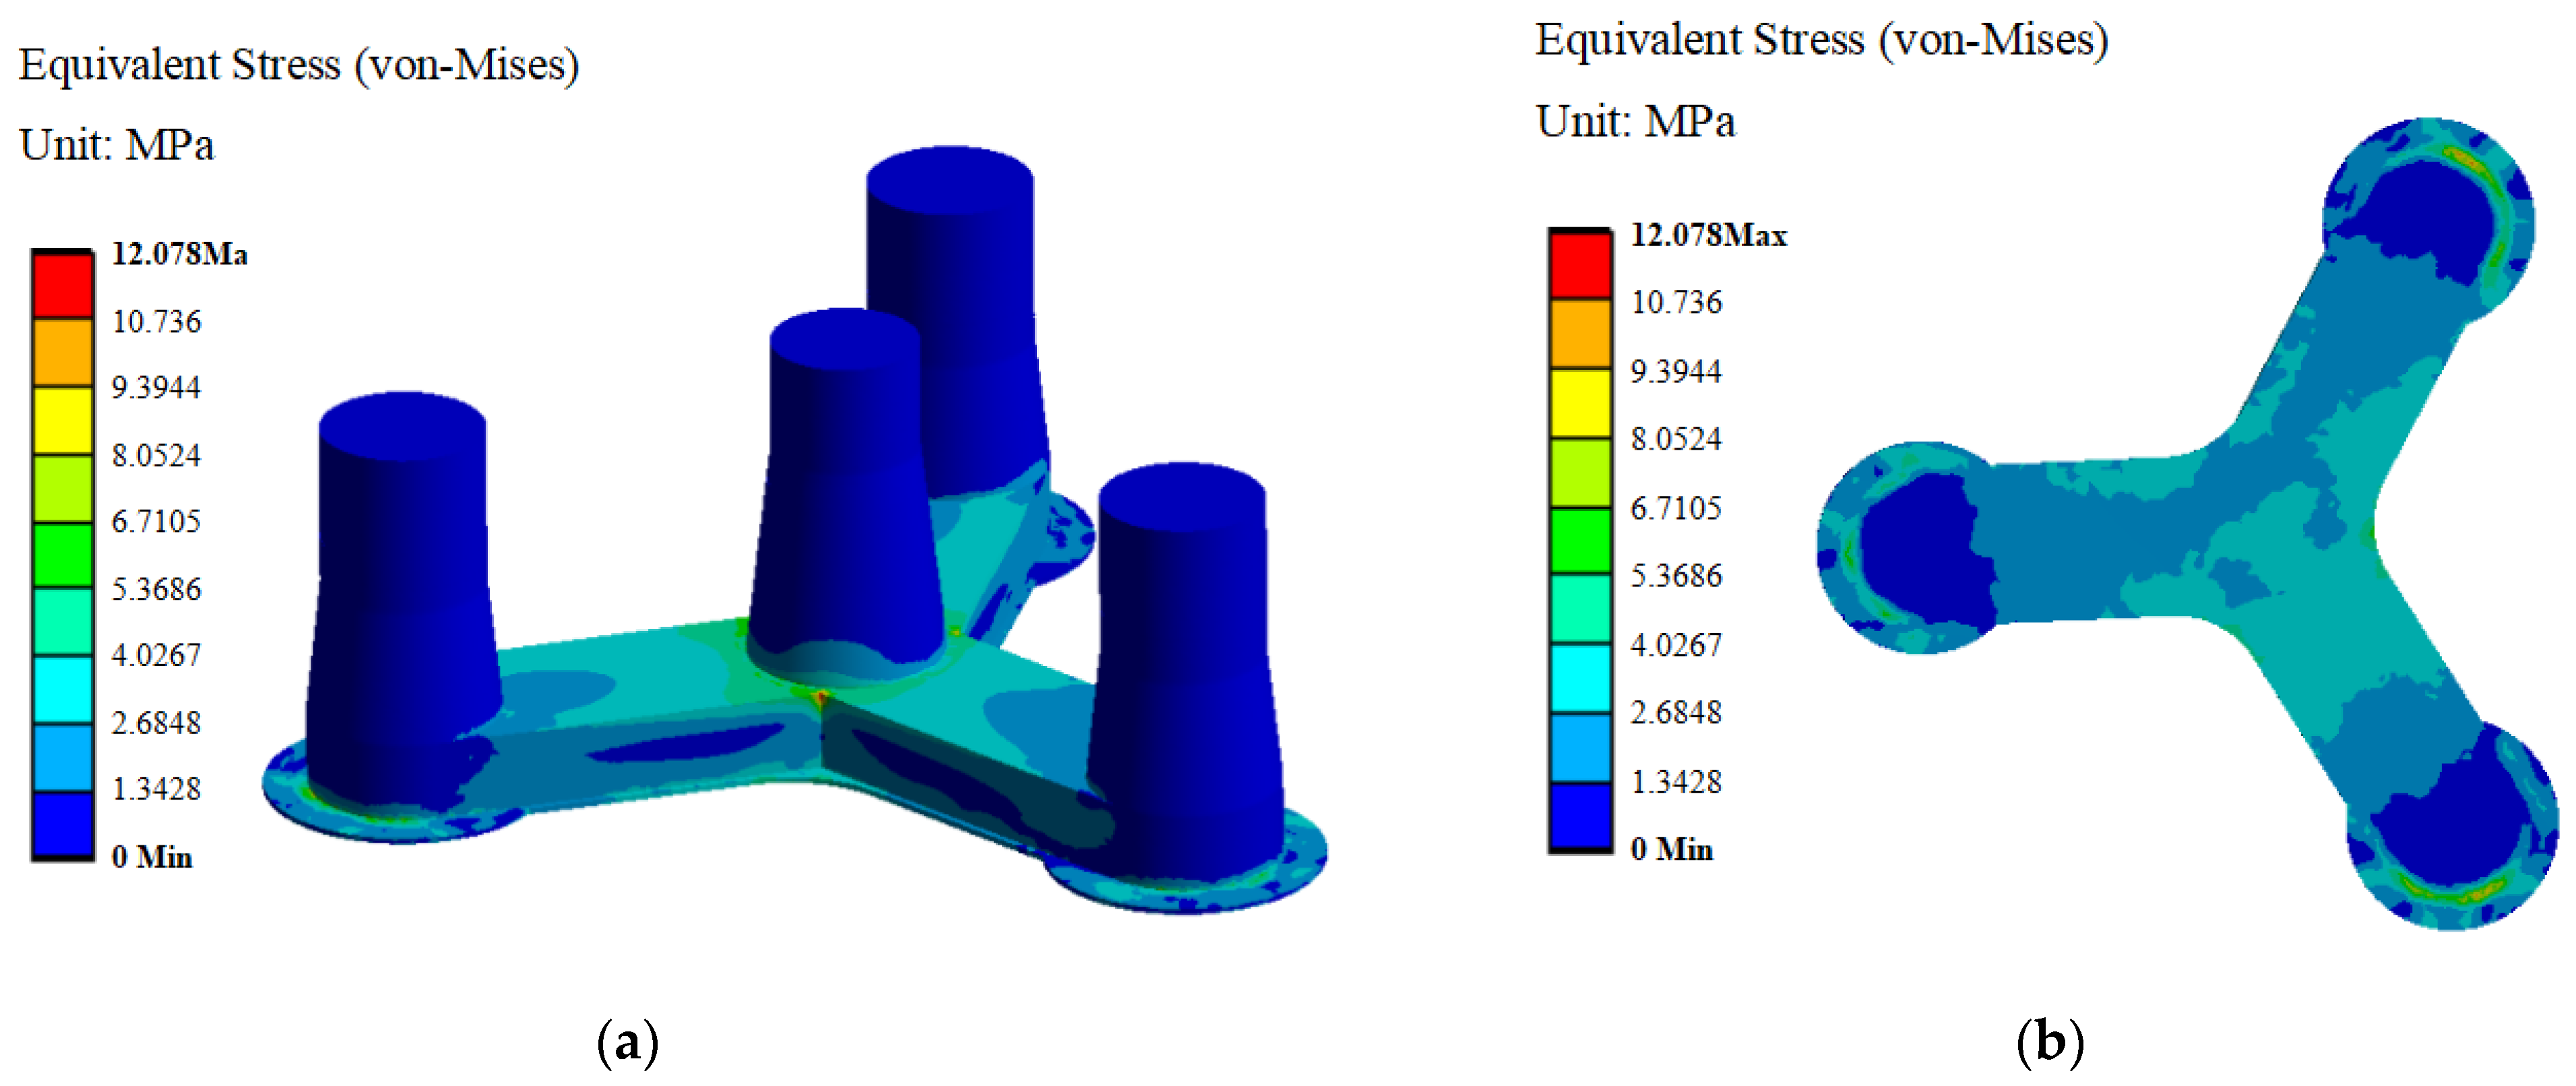
Table 7 shows the maximum equivalent stress values of the floating platform under the wind load, wave load at different phases, and current load incidence in different directions; Figure 17 and Figure 18 show the equivalent stress cloud maps of the floating platform with θ = 0°, ψ = 0° state and θ = 30°, ψ = 90° state, respectively.
According to the results in Table 7 and Figure 17 and Figure 18, (1) or the environmental loads with θ = 0°, ψ = 0° state, the maximum equivalent stress value of the floating platform is 12.718 MPa. When the environmental loads with θ = 30°, ψ = 90° state, the minimum equivalent stress value of the floating platform is 12.078 MPa. (2) Under different environmental loads conditions, the overall stress distribution of the floating platform is relatively uniform, but there is a certain stress concentration in the structural joint area, that is, the connection between the middle tapered column and the bottom Y-shaped pontoon and the connection between the heave plate and the Y-shaped pontoon are dangerous areas of the platform. (3) According to the allowable stress check criteria specified by the American Bureau of Shipping (ABS) [39] and the performance parameters of concrete materials [40], the structural safety factor is 2.0 and the allowable stress is 20.5 MPa. According to the above analysis, the maximum stress value of the floating platform is 12.718 MPa, so it meets the requirements for overall structural strength.

5.4. Fatigue Life Analysis of the Floating Platform

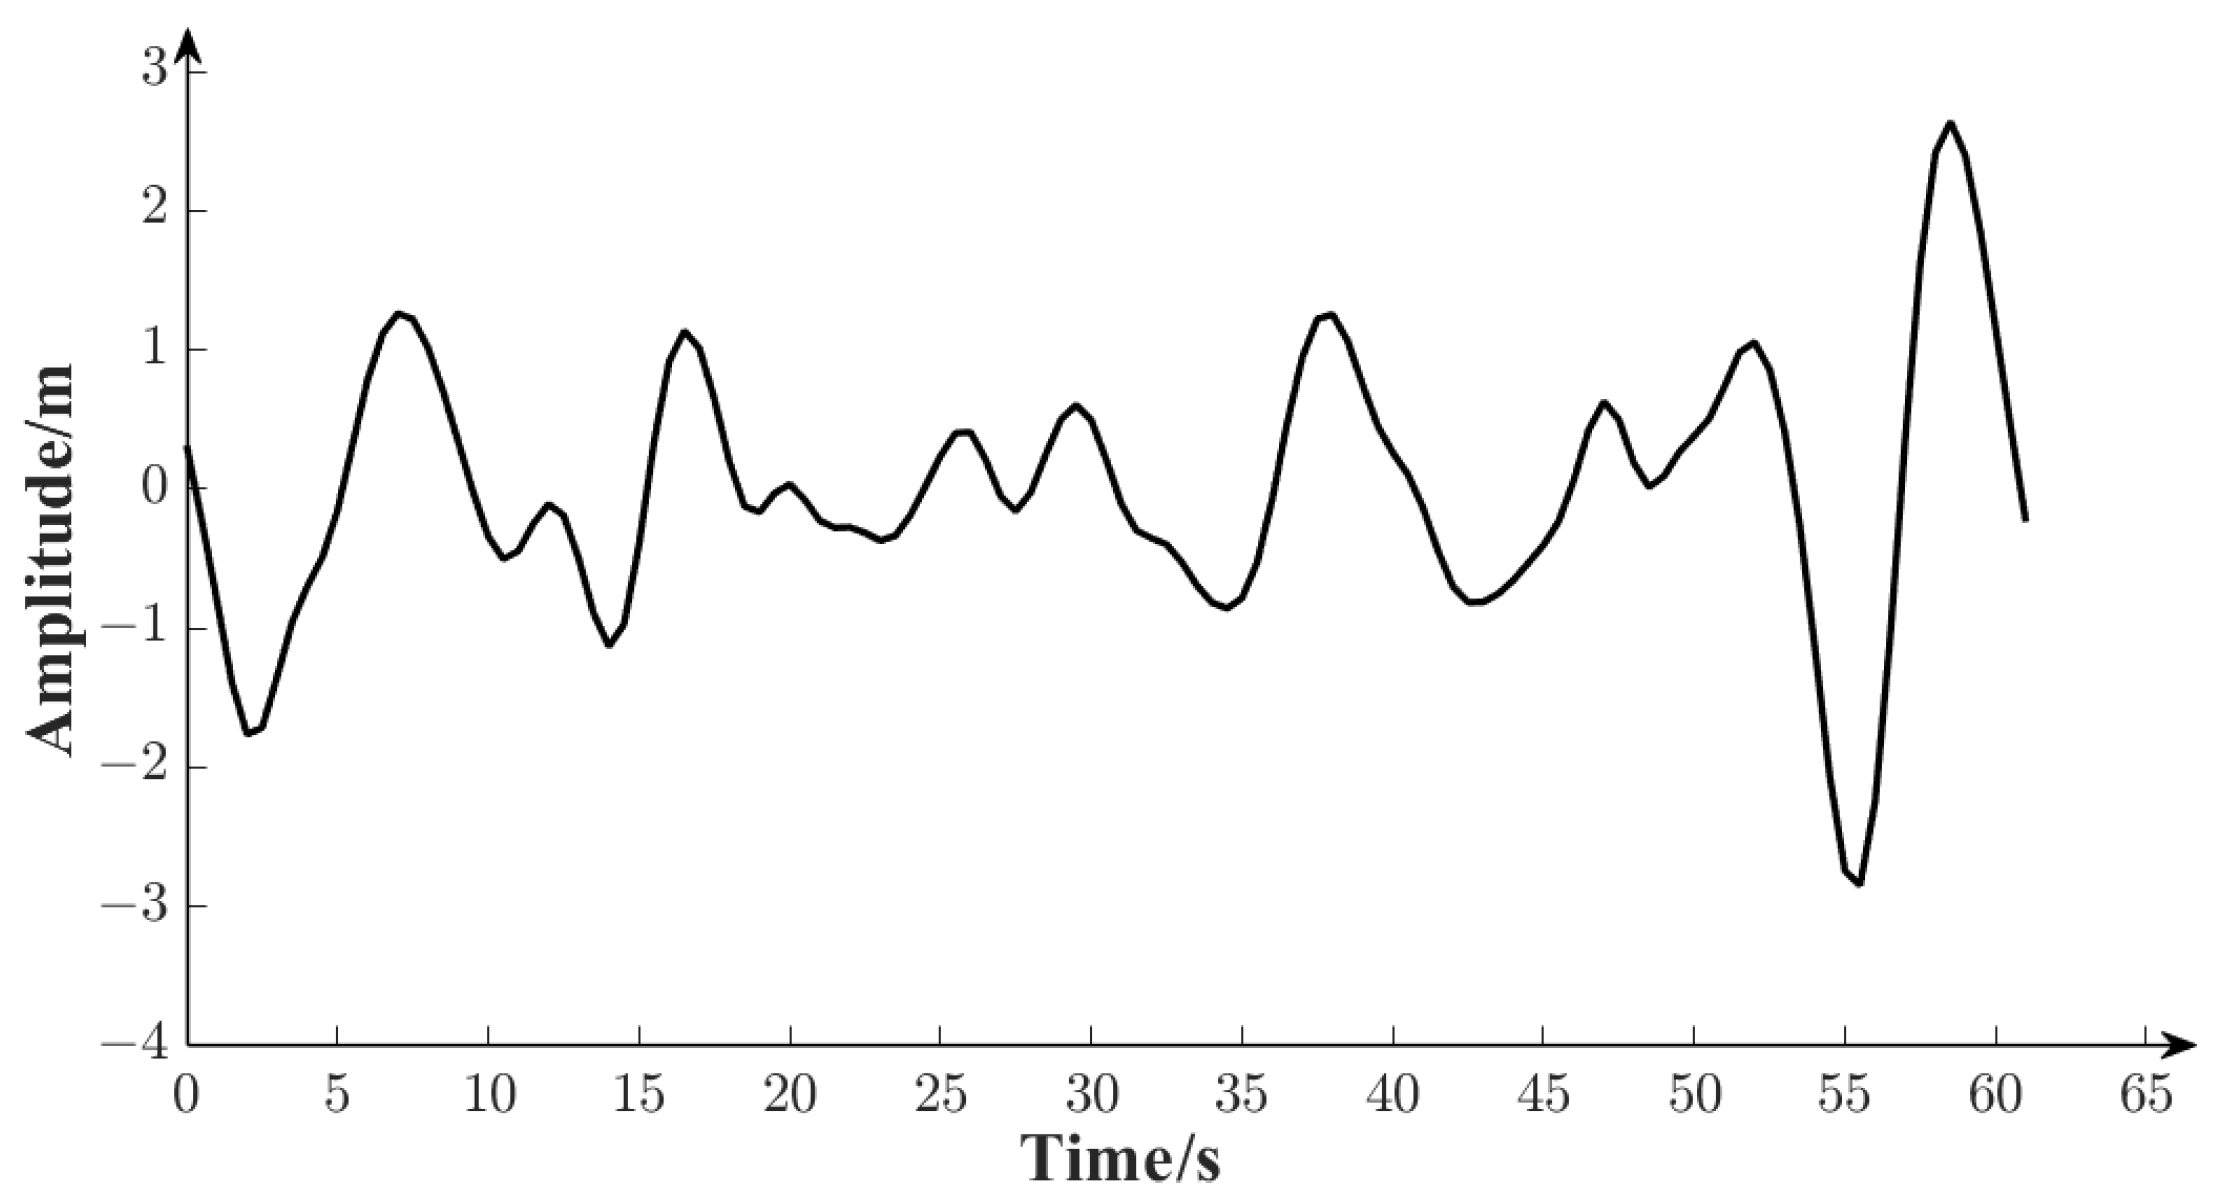
Based on the aforementioned structural analysis results, for the environmental loads with θ = 0°, ψ = 0° state, the stress state of the floating platform reaches its extreme value, compared with other working conditions. Considering the fact that fatigue failure mainly occurs in areas with high localized stress in the structure [41,42], the loading condition with θ = 0°, ψ = 0° is taken into consideration during the fatigue life analysis of the floating platform in this study. With the static structural analysis results, the time series loading spectrum obtained in Section 5.2 (shown in Figure 19) is applied to the floating platform. Miner’s theory is considered in this study using the rain flow counting method. Figure 20 illustrates the fatigue life cloud maps for the floating platform. The analysis reveals that the region with the minimum fatigue life is located at the connection between the middle tapered column and the Y-shaped pontoon. Additionally, a stress concentration is observed on the outer side of the bottom heave plate, indicating a higher susceptibility to fatigue damage in these areas. It is noteworthy that the fatigue life in these regions is significantly lower, approximately 106 times, compared to other parts of the platform.

6. Conclusions

This study focused on the concrete platform structural verification of a 10 MW floating wind turbine under harsh conditions using the OpenFAST and AQWA numerical simulation tools. The following conclusions can be drawn to ensure its safety under harsh sea conditions:
(1)
Different sea conditions and incidence directions of environmental loads have significant effects on the motion response in all six degrees of freedom. The motion response amplitudes are relatively large under harsh sea conditions but still meet the stability requirements for the normal power generation of floating wind turbines. Additionally, changes in the incident angles of the environmental loads have a noticeable impact on the motion response in the surge, sway, pitch, and yaw directions. When the incident angles increase to 75°, the amplitudes of the surge and pitch motion responses decrease by 59.1% and 90.1%, respectively, while the sway motion response increases by a factor of 14.6. In the yaw direction, the motion response initially increases and then decreases, reaching its maximum value of 2.93° at an incident angle of 30°.
(2)
Under harsh sea conditions, the maximum deformation occurs at the top of the external three columns of the concrete-based floating platform. To mitigate the corresponding deformation, it is recommended to consider the use of prestressed concrete construction techniques. The connection between the middle tapered column and the bottom Y-shaped pontoon, as well as the connection between the heave plate and the Y-shaped pontoon, is subjected to stress concentration. The maximum stress in these areas is 12.718 MPa, which is within the allowable stress limits and satisfies the structural integrity requirements of the floating platform.
(3)
Fatigue life analysis was conducted based on the Miner linear cumulative damage theory for the floating platform subjected to environmental loads with θ = 0°, ψ = 0° state. The results indicate that the shortest fatigue life occurs in the stress concentration areas at the connection between the middle tapered column and the Y-shaped pontoon, and on the outer side of the heave plate, the fatigue life is almost 106 times lower, making these areas prone to fatigue damage.
(4)
In the fatigue analysis, only normal operating conditions were considered, and the impact of unexpected situations such as emergency shutdowns on structural fatigue damage and life was not considered in this study.

Author Contributions

Conceptualization, Methodology, Validation, Writing—original draft preparation, X.C. and Q.W.; Resources, Y.Z. (Yuquan Zhang) and Y.Z. (Yuan Zheng); Data curation, Q.W.; Writing—review and editing, X.C., Q.W., and Y.Z. (Yuquan Zhang); Supervision, X.C. and Y.Z. (Yuan Zhang). All authors have read and agreed to the published version of the manuscript.

Funding

This research was funded by the National Natural Science Foundation of China (Grant Nos. 52271275, 52109152).

Data Availability Statement

Data are contained within the article.

Conflicts of Interest

The authors declare no conflicts of interest.

References

  1. Zhang, Y.Q.; Zang, W.; Zheng, J.H.; Cappietti, L.; Zhang, J.S.; Zheng, Y.; Rodriguez, E.F. The influence of waves propagating with the current on the wake of a tidal stream turbine. Appl. Energy 2021, 290, 116729. [Google Scholar] [CrossRef]
  2. Zhang, Y.Q.; Liu, Z.Q.; Li, C.Y.; Wang, X.M.; Zheng, Y.; Zhang, Z.; Emmanuel, F.R.; Rabea, J.M. Fluid–structure interaction modeling of structural loads and fatigue life analysis of tidal stream turbine. Mathematics 2022, 10, 3674. [Google Scholar] [CrossRef]
  3. Tavares, L.F.D.A.; Shadman, M.; Assad, L.P.D.F.; Estefen, S.F. Influence of the WRF model and atmospheric reanalysis on the offshore wind resource potential and cost estimation: A case study for Rio de Janeiro State. Energy 2022, 240, 122767. [Google Scholar] [CrossRef]
  4. Baquerizo, J.; Tutivén, C.; Puruncajas, B.; Vidal, Y.; Sampietro, J. Siamese neural networks for damage detection and diagnosis of jacket-type offshore wind turbine platforms. Mathematics 2022, 10, 1131. [Google Scholar] [CrossRef]
  5. Pérez-Collazo, C.; Greaves, D.; Iglesias, G. A review of combined wave and offshore wind energy. Renew. Sustain. Energy Rev. 2015, 42, 141–153. [Google Scholar] [CrossRef]
  6. Barooni, M.; Ashuri, T.; Sogut, D.V.; Wood, S.; Taleghani, S.G. Floating offshore wind turbines: Current status and future prospects. Energies 2023, 16, 2. [Google Scholar] [CrossRef]
  7. Li, W.J.; Ke, S.T.; Chen, J.; Zhu, T.R.; Ren, H.H. Hydrodynamic response and energy analysis in a very large floating structure supporting a marine airport under typhoon-driven waves. Ocean Eng. 2022, 266, 112987. [Google Scholar] [CrossRef]
  8. Jonkman, J. Definition of the Floating System for Phase IV of OC3; National Renewable Energy Laboratory: Golden, CO, USA, 2010. [Google Scholar]
  9. Ahn, H.J.; Shin, H. Model test and numerical simulation of OC3 spar type floating offshore wind turbine. Int. J. Nav. Archit. Ocean Eng. 2017, 11, 1–10. [Google Scholar] [CrossRef]
  10. Yue, M.; Liu, Q.S.; Li, C.; Ding, Q.W.; Cheng, S.S.; Zhu, H.T. Effects of heave plate on dynamic response of floating wind turbine spar platform under the coupling effect of wind and wave. Ocean Eng. 2020, 201, 107103. [Google Scholar] [CrossRef]
  11. Jiang, Z.H.; Wen, B.R.; Chen, G.; Xiao, L.F.; Li, J.; Peng, Z.K.; Tian, X.L. Feasibility studies of a novel spar-type floating wind turbine for moderate water depths: Hydrodynamic perspective with model test. Ocean. Eng. 2021, 233, 109070. [Google Scholar] [CrossRef]
  12. Matthew, H.; Andrew, G. Validation of a lumped-mass mooring line model with DeepCwind semisubmersible model test data. Ocean Eng. 2015, 104, 590–603. [Google Scholar]
  13. Liu, Z.Q.; Zhou, Q.S.; Tu, Y.G.; Wang, W.; Hua, X.G. Proposal of a novel semi-submersible floating wind turbine platform composed of inclined columns and multi-segmented mooring lines. Energies 2019, 12, 1809. [Google Scholar] [CrossRef]
  14. Jiang, H.R.; Wang, H.H.; Vaz, M.A.; Bai, X.L. Research on dynamic response prediction of semi-submersible wind turbine platform in real sea test model based on machine learning. Appl. Ocean Res. 2023, 142, 103808. [Google Scholar] [CrossRef]
  15. Xu, X.S.; Gaidai, O.; Naess, A.; Sahoo, P. Extreme loads analysis of a site-specific semi-submersible type wind turbine. Ships Offshore Struct. 2020, 15, S46–S54. [Google Scholar] [CrossRef]
  16. Wang, S.S.; Xing, Y.H.; Balakri, S.R.; Shi, W.; Xu, X.S. Design, local structural stress, and global dynamic response analysis of a steel semi-submersible hull for a 10-MW floating wind turbine. Eng. Struct. 2023, 291, 116474. [Google Scholar] [CrossRef]
  17. Matha, D. Model Development and Loads Analysis of an Offshore Wind Turbine on a Tension Leg Platform with a Comparison to Other Floating Turbine Concepts; National Renewable Energy Laboratory: Golden, CO, USA, 2010. [Google Scholar]
  18. Suzuki, K.; Yamaguchi, H.; Akase, M.; Imakita, A.; Ishihara, T.; Fukumoto, Y.; Oyama, T. Initial design of tension leg platform for offshore wind farm. J. Fluid Sci. Technol. 2011, 6, 372–381. [Google Scholar] [CrossRef]
  19. Goupee, A.J.; Koo, B.; Lambrakos, K.; Kimball, R. Model tests for three floating wind turbine concepts. In Proceedings of the Offshore Technology Conference, Houston, TX, USA, 30 April–3 May 2012. [Google Scholar]
  20. Xu, X.; Wei, N.Y.; Yao, W.J. The stability analysis of tension-leg platforms under marine environmental loads via altering the connection angle of tension legs. Water 2022, 14, 283. [Google Scholar] [CrossRef]
  21. Aboutalebi, A.; M’zoughi, F.; Garrido, I.; Garrido, A.J. Performance analysis on the use of oscillating water column in barge-based floating offshore wind turbines. Mathematics 2021, 9, 475. [Google Scholar] [CrossRef]
  22. M’zoughi, F.; Aboutalebi, P.; Garrido, I.; Garrido, A.J.; Sen, M.D.L. Complementary airflow control of oscillating water columns for floating offshore wind turbine stabilization. Mathematics 2021, 9, 1364. [Google Scholar] [CrossRef]
  23. Rubio, F.; Albert, L.C.; Pedrosa, M.A. Analysis of the influence of calculation parameters on the design of the gearbox of a high-power wind turbine. Mathematics 2023, 11, 4137. [Google Scholar] [CrossRef]
  24. Wang, S.S.; Moan, T.; Nejad, A.R. A comparative study of fully coupled and de-coupled methods on dynamic behaviour of floating wind turbine drivetrains. Renew. Energy 2021, 179, 1618–1635. [Google Scholar] [CrossRef]
  25. Wang, S.S.; Moan, T. Analysis of extreme internal load effects in columns in a semi-submersible support structure for large floating wind turbines. Ocean Eng. 2024, 291, 116372. [Google Scholar] [CrossRef]
  26. Ahn, H.; Ha, Y.J.; Cho, S.G.; Lim, C.H.; Kim, K.H. A numerical study on the performance evaluation of a semi-type floating offshore wind turbine system according to the direction of the incoming waves. Energies 2022, 15, 5485. [Google Scholar] [CrossRef]
  27. Yang, Y.; Bashir, M.; Wang, J.; Michailides, C.; Loughney, S.; Armin, M.; Hernandez, S.; Urban, J.; Li, C. Wind-wave coupling effects on the fatigue damage of tendons for a 10MW multi-body floating wind turbine. Ocean Eng. 2022, 217, 107909. [Google Scholar] [CrossRef]
  28. Nybø, A.; Nielsen, G.F.; Reuder, J.; Matthew, J.; Godvik, M. Evaluation of different wind fields for the investigation of the dynamic response of offshore wind turbines. Wind Energy 2020, 23, 1810–1830. [Google Scholar] [CrossRef]
  29. Leishman, J.G. Aerodynamics of horizontal-axis wind turbines. Environ. Sci. Eng. 2011, 1, 1–76. [Google Scholar]
  30. Pierson, W.J.; Moskowitz, L. A proposed spectral form for fully developed wind seas based on the similarity theory of S. A. Kitaigorodskii. J. Geophys. Res. Atmos. 1964, 69, 5181–5190. [Google Scholar] [CrossRef]
  31. Jiang, C.Q.; El, M.O.; Schellin, T.E. Capability of a potential-flow solver to analyze articulated multibody offshore modules. Ocean Eng. 2022, 266, 112754. [Google Scholar] [CrossRef]
  32. Jonkman, J. Modeling of the UAE Wind Turbine for Refinement of Fast_AD; National Renewable Energy Laboratory: Golden, CO, USA, 2010. [Google Scholar]
  33. Miner, M.A. Cumulative damage in fatigue. J. Appl. Mech. 1945, 12, 159–164. [Google Scholar] [CrossRef]
  34. Zhao, F.F.; Kinoshita, T.; Bao, W.G.; Wan, R.; Liang, Z.L.; Huang, L.Y. Hydrodynamics identities and wave-drift force of a porous body. Appl. Ocean Res. 2011, 33, 169–177. [Google Scholar] [CrossRef]
  35. Wang, Z.F.; Zhou, L.M.; Dong, S.; Wu, L.Y.; Li, Z.B.; Mou, L.; Wang, A.F. Wind wave characteristics and engineering environment of the south china sea. Ocean. Coast. Sea Res. 2014, 13, 893–900. [Google Scholar] [CrossRef]
  36. DNVGL-OS-E301; Position Mooring; DNV GL: Bærum, Norway, 2020.
  37. Jonkman, J.; Butterfield, S.; Musial, W.; Scott, G. Definition of a 5MW Reference Wind Turbine for Offshore System Development; National Renewable Energy Laboratory: Golden, CO, USA, 2009. [Google Scholar]
  38. Zambrano, T.; Maccready, T.; Kiceniuk, T.; Roddier, D.G.; Cermelli, C.A. Dynamic modeling of deepwater offshore wind turbine structures in gulf of mexico storm conditions. In Proceedings of the OMAE 2006 25th International Conference on Offshore Mechanics and Arctic Engineering, Hamburg, Germany, 4–9 June 2006. [Google Scholar]
  39. ABS. Guide for Building and Classing Floating Production Installations; American Bureau of Shipping: Houston, TX, USA, 2009. [Google Scholar]
  40. Yu, L.Z.; Wu, R.X. Using graphene oxide to improve the properties of ultra-high-performance concrete with fine recycled aggregate. Constr. Build. Mater. 2020, 259, 120657. [Google Scholar] [CrossRef]
  41. Gao, J.X.; Liu, Y.Y.; Yuan, Y.P.; Heng, F. Residual strength modeling and reliability analysis of wind turbine gear under different random loadings. Mathematics 2023, 11, 4013. [Google Scholar] [CrossRef]
  42. Chen, X.C.; Cui, Y.K.; Zheng, Y.; Zhang, Y.Q. Fatigue crack propagation simulation of vertical centrifugal pump runner using the extended finite element method. Mech. Adv. Mater. Struct. 2023, 5, 1–16. [Google Scholar] [CrossRef]
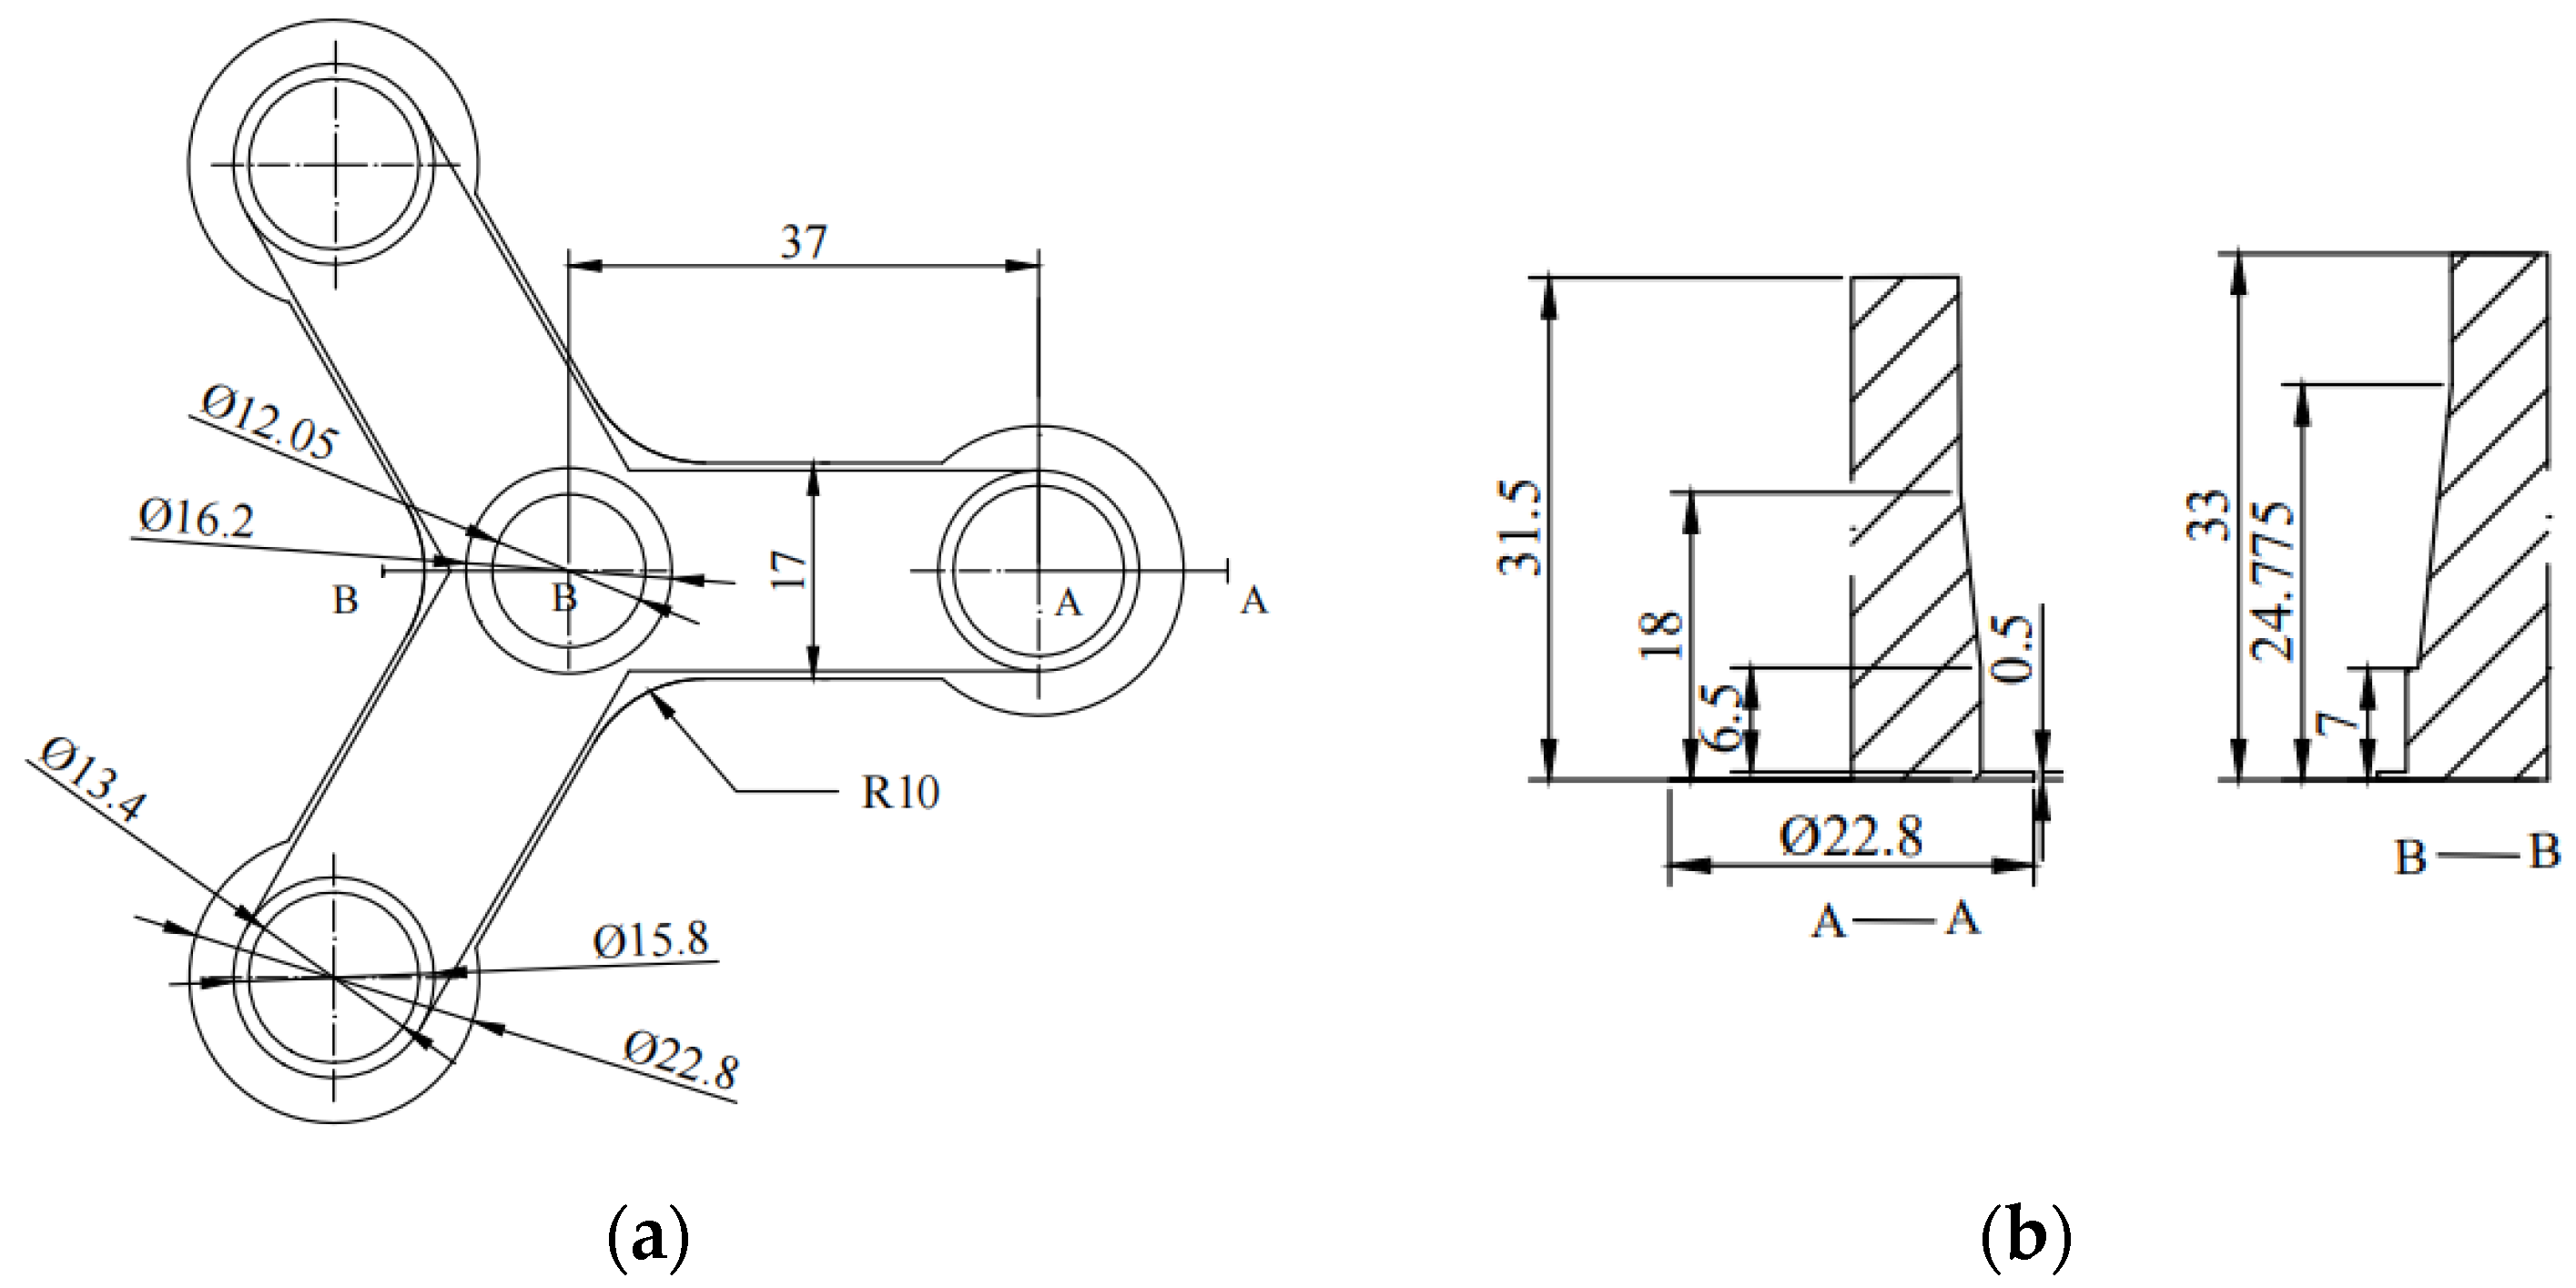
Figure 1. Diagram of the floating platform structure (Unit: m) (a) Top view (b) Sectional views of A–A and B–B.
Mathematics 12 00412 g001
Figure 2. The schematic diagram of the 10 MW semi-submersible floating wind turbine.
Mathematics 12 00412 g002
Figure 3. Flowchart of the multi-physical coupled numerical model.
Mathematics 12 00412 g003
Figure 4. The average drift force in the surge direction.
Mathematics 12 00412 g004
Figure 5. The free decay and frequency domain response in the surge direction. (a) Free decay (b) Frequency domain response.
Mathematics 12 00412 g005
Figure 6. Schematic diagram of the operation environment of the floating wind turbine.
Mathematics 12 00412 g006
Figure 7. Turbulent wind field.
Mathematics 12 00412 g007
Figure 8. Time series of irregular waves.
Mathematics 12 00412 g008
Figure 9. Schematic diagram of the incident angles θ of environmental loads.
Mathematics 12 00412 g009
Figure 10. Time domain response curve of the wind turbine thrust under different sea conditions.
Mathematics 12 00412 g010
Figure 11. Motion response under different incident angles of environmental loads. (a) Surge (b) Sway (c) Heave (d) Pitch (e) Roll (f) Yaw.
Mathematics 12 00412 g011
Figure 12. Time domain response curve of the wind turbine thrust under different incident angles.
Mathematics 12 00412 g012
Figure 13. Hydrostatic pressure load distribution.
Mathematics 12 00412 g013
Figure 14. Hydrodynamic load distribution under the ψ = 0° state.
Mathematics 12 00412 g014
Figure 15. Deformation cloud maps of the floating platform with θ = 0°, ψ = 0° state. (a) Deformation cloud map (overall) (b) Deformation cloud map (bottom).
Mathematics 12 00412 g015
Figure 16. Deformation cloud maps of floating platform with θ = 60°, ψ = 90° state. (a) Deformation cloud map (overall) (b) Deformation cloud map (bottom).
Mathematics 12 00412 g016
Figure 17. Equivalent stress maps of the floating platform with θ = 0°, ψ = 0° state. (a) Equivalent stress cloud map (overall) (b) Equivalent stress cloud map (bottom).
Mathematics 12 00412 g017
Figure 18. Equivalent stress maps of the floating platform with θ = 30°, ψ = 90° state. (a) Equivalent stress cloud map (overall) (b) Equivalent stress cloud map (bottom).
Mathematics 12 00412 g018
Figure 19. The time series loading spectrum (one cycle).
Mathematics 12 00412 g019
Figure 20. Fatigue life cloud maps of the floating platform with θ = 0°, ψ = 0° state. (a) Fatigue life cloud map (overall) (b) Fatigue life cloud map (bottom).
Mathematics 12 00412 g020
Table 1. Parameters of the DTU 10 MW wind turbine.
Parameter/UnitValue
Power/MW10.0
Rated wind speed/m·s−111.4
Cut-in wind speed/m·s−13.0
Cut-out wind speed/m·s−125.0
Rated speed/rpm9.6
Rotor diameter/m178.3
Hub diameter/m5.6
Tower height/m115.63
Hub height/m119.0
Rotor mass/kg2.31 × 105
Nacelle mass/kg4.46 × 105
Tower mass/kg1.26 × 106
Table 2. Parameters of the floating platform and mooring system.
Parameter/UnitValue
Platform mass/kg2.1709 × 107
Center of mass/m−15.225
Draft/m22.0
Displacement/m32.3509 × 104
Roll inertia/kg·m29.43 × 109
Pitch inertia/kg·m29.43 × 109
Yaw inertia/kg·m21.63 × 1010
Number of mooring lines3
Mass of clump weight/kg5.0 × 104
Fairlead depth/m9.5
Anchor depth/m−130
Distance to anchors from platform centerline/m691
Length of mooring lines/m703
Table 3. The natural period and natural frequency of six degrees of freedom.
SurgeSwayHeaveRollPitchYaw
Natural period/s182.6375182.62520.442831.408331.3583102.53
Natural frequency/Hz0.0054750.0054760.048920.031840.031890.00975
Table 4. Environmental sea conditions [35].
Sea ConditionsWind Speed Uw/m·s−1Wave Height Hs/mWave Period Tp/sCurrent Speed Uc/m·s−1
19.01.004.00.514
211.41.754.50.700
315.03.2510.01.028
Table 5. Motion response of the floating platform under different sea conditions with a 0° incident angle.
Surge/mSway/mHeave/mRoll/°Pitch/°Yaw/°
Sea condition
1
Maximum 12.700.3072.240.7783.170.326
Minimum 0.00−0.1520.00−0.042−1.97−0.474
Average 9.020.0931.230.2040.720.003
Sea condition
2
Maximum26.970.5242.240.7026.091.97
Minimum 0.00−1.4300.00−0.027−0.085−2.22
Average 19.400.0311.170.4083.470.09
Sea condition
3
Maximum 29.101.312.490.9128.122.50
Minimum −0.12−1.570.00−0.016−2.02−2.74
Average 20.50−0.421.190.4661.700.031
Table 6. Maximum deformation values of the floating platform under environmental loads (Unit: mm).
Wave Phase ψψ = 0°ψ = 30°ψ = 60°ψ = 90°
Incident Angle θ
θ = 0°29.62829.59929.56529.536
θ = 15°29.61429.56329.51629.487
θ = 30°29.61229.53429.46929.433
θ = 45°29.61729.51729.43429.390
θ = 60°29.61829.50829.41729.370
θ = 75°29.61129.50629.42229.380
Table 7. Maximum equivalent stress values of the platform under environmental loads (Unit: MPa).
Wave Phase ψ ψ = 0°ψ = 30°ψ = 60°ψ = 90°
Incident Angle θ
θ = 0°12.71812.57712.51712.553
θ = 15°12.58812.34412.24312.311
θ = 30°12.53612.18212.10212.078
θ = 45°12.54412.15012.19512.208
θ = 60°12.55412.11512.26412.363
θ = 75°12.53312.09512.35812.546
Disclaimer/Publisher’s Note: The statements, opinions and data contained in all publications are solely those of the individual author(s) and contributor(s) and not of MDPI and/or the editor(s). MDPI and/or the editor(s) disclaim responsibility for any injury to people or property resulting from any ideas, methods, instructions or products referred to in the content.