Abstract
Streptococcus pneumonia is the primary cause of morbidity and mortality in infants and children globally. Invasive pneumococcal disease (IPD) incidence is affected by various risk factors such as age and comorbidities. Additionally, this bacterium is a major cause of community-acquired pneumonia (CAP), leading to higher rates of hospitalization, especially among older adults. Vaccination with pneumococcal conjugate vaccines (PCVs) has proven effective, but the demographic transition in Germany poses a challenge. This study introduces a novel stochastic approach by integrating a population forecast model into a transmission dynamic model to investigate the future burden of pneumococcal diseases in three age groups (0–4, 5–59, and 60 and older). Our simulations, presented through mean predictions and 75% prediction intervals, indicate that implementing PCV13 (13-valent pneumococcal conjugate vaccine) until the year 2050 results in reduced cases of IPD and CAP in all age groups compared to scenarios without infant vaccination. However, cases with non-vaccine serotypes may persist at higher levels compared to scenarios without infant vaccination. Consequently, there may be a need for improvement in the current national vaccine policy, such as implementing the use of higher-valent PCVs and strengthening adult vaccination uptake.
Keywords:
pneumococcal disease burden; stochastic forecasting; PCV13 pneumococcal vaccination; stochastics; cohort component method; principal component analysis; autoregressive integrated moving average models; Monte Carlo simulation; demography; epidemiology MSC:
92D30
1. Introduction
1.1. Motivation and Background
Severe bacterial infection caused by Streptococcus pneumonia (pneumococcus) is the major cause of morbidity and mortality in infants and children worldwide [1]. According to the Global Burden of Disease Study, pneumococcal pneumonia was responsible for 1.5 million deaths in 2015, where 55.4% of all deaths were caused by lower respiratory tract infections [2]. Pneumococcal diseases are classified into two main categories: invasive pneumococcal disease (IPD) and noninvasive pneumococcal disease (NIPD) [3,4]. IPD is diagnosed when the bacterium is typically identified in sterile bodily fluids, leading to severe infections such as meningitis, sepsis, or bacteremic pneumonia [3,5]. In contrast, NIPD leads to less severe infections, including acute otitis media, bronchitis, and non-bacteremic pneumonia [6]. IPD incidence is impacted by various factors, including vaccination coverage, geographical location, underlying health conditions, smoking, and age [7]. Young children, infants, immunocompromised individuals, and the elderly bear the highest disease burden, both in developed and less developed countries [4,7,8,9]. Specifically, children under 5 years old and elderly individuals aged 65 and above are particularly susceptible to developing pneumococcal disease [10]. Thus, these three age groups show distinct infection patterns and should be considered individually. We will return to this point in the results section.
The latest annual epidemiological report on pneumococcal diseases for Europe, focusing on IPD cases, was published by the European Centre for Disease Prevention and Control in 2020 [11]. That report presents data for the year 2018, during which, among the 23 European countries included in the report, were 29 reported confirmed cases of IPD [11]. Notably, Germany was among the European countries that did not report any surveillance data on IPD cases [11]. This absence of data from Germany presents challenges when comparing with data from other countries. A study in 2017/2018 reported that there were approximately 5.94 IPD cases per 100,000 in children under two years old and 10.08 IPD cases per 100,000 in adults aged 60 and older in Germany [12]. However, actual IPD infections are believed to be around 2 to 3.5 times higher [12,13], where the 30-day mortality of IPD cases is greater than 30% in adults over the age of 65 years [14].
S. pneumonia is the primary cause of community-acquired pneumonia (CAP) [15]. CAP refers to an acute lung infection that occurs outside the hospital in a patient who has not had recent hospitalization [16]. In 2012, S. pneumonia was identified as the causative agent in approximately 30% of all CAP cases (a total of 7400 patients) in Germany [17]. A population-incidence study conducted in 2021 indicated that the overall burden of CAP in German adults ranges between 1061 and 1560 cases per 100,000 person-years, and this is particularly significant for CAP hospitalizations among older adults [18]. Overall, there is a lack of consistent reporting on the current incidence of CAP in Germany due to differences in time periods, case definitions, study populations, and study designs [18].
Despite advancements in medical treatment, the morbidity and lethality of pneumococcal infections among elderly patients remain high, with factors such as age, and comorbidities, playing a more prominent role than the infection itself [19,20]. Vaccination remains the most effective measure to fundamentally reduce the disease burden; in particular, vaccination with pneumococcal conjugate vaccines (PCVs) in children has been shown to be the most effective strategy for disease prevention in the general population [21]. Current PCVs such as PCV10 (10-valent pneumococcal conjugate vaccine) and PCV13 (13-valent pneumococcal conjugate vaccine) bring down disease transmission by targeting vaccine-type serotypes [22]. While they are effective against a significant number of the over 90 identified serotypes, the most clinically important ones are covered in terms of disease burden [23]. In turn, there is a renewed increase in the incidence of IPD caused by the replacement (non-vaccine) serotypes [24]. Among individuals aged 60 years and older, demographic effects and limitations of present adult vaccination strategies reinforce this increased trend in IPD incidence. Childhood immunization with PCVs induce indirect herd effects, i.e., they reduce the disease incidence not only among vaccinated individuals but also in the unvaccinated population across all age groups [25]. Due to the indirect herd effects of childhood immunization with PCV13, PCV13 serotypes cover just over 30% of all IPD and CAP cases in individuals aged 60 years and older [12,26].
The demographic transition in Germany includes an aging of the population [27] and for certain regions, a population decline [28]. These demographic changes are leading to increasing challenges for inpatient care or hospitalizations [29]. In this study, we aim to investigate the future burden of pneumococcal diseases in Germany by integrating a population forecast model and transmission dynamic model. This approach considers the ongoing demographic change in the German population.
The structure of our paper is as follows: Section 1.2 provides an overview of the recent literature on mathematical modeling and forecasting of pneumococcal diseases, particularly in Germany. In Section 2.1, we describe our population forecast approach. Section 2.1.1 explains how demographic data were prepared for the population forecast model, detailing the required data structure. In Section 2.1.2, we explain the calculations and structure of the population forecast model. Section 2.2 covers an overview of the transmission dynamic model, utilizing outputs from the population forecast model to estimate the future burden of pneumococcal diseases in Germany. In the final sections, we discuss the results of our study (Section 3) and explore the limitations of our model (Section 4), offering insights for potential improvement of our approach.
1.2. State of the Literature
Various methodologies have been employed to understand and predict the burden of pneumococcal diseases. However, a critical gap in the existing literature becomes evident when considering methodological aspects. A literature review by Løchen and Anderson [30] examined 23 dynamic transmission models and 21 economic models of PCVs. While the reviewed models indicated a reduction in the disease burden with PCVs, they were contingent on assumptions on the cost-effectiveness of PCVs, as well as the epidemiology and infection characteristics of the disease [30]. Much of the data used to estimate the burden of pneumococcal disease were drawn from various sources, including prevalence data, incidence data, active surveillance, epidemiological surveys, and community vaccine trials [30]. Hence, the previous models were tailored to the specific country or region from which the data originated.
A study in 2013 by Link-Gelles et al. [31] focused on forecasting IPD trends in the United States after the introduction of PCV13. That study spanned a 10-year period (2010–2020) and utilized a statistical model to predict IPD cases [31]. Active surveillance data from PCV7 (7-valent pneumococcal conjugate vaccine) introduction in 2000 were used to create and validate a Poisson model [31]. The study’s conclusion suggested that serotype replacement was unlikely to significantly impact the number of cases prevented by PCV13 [31]. Despite lacking data on PCV13 at the time, the model served as a valuable benchmark for forecasting IPD trends.
A noteworthy mathematical modeling study carried out in 2019 by Choi, Andrews, and Miller [32] examined the potential impact of altering the infant PCV13 schedule on IPD and CAP in England and Wales. They developed an age-structure, dynamic, deterministic model of pneumococcal diseases, utilizing population data and model fitting based on past trends in cases, to predict the impact of transitioning from a 2 + 1 schedule (two infant doses and one at 12 months old) to a 1 + 1 schedule (one infant dose and one at 12 months old) [32]. Consequently, that analysis identified the optimal vaccination strategy, contributing to the improvement of the overall vaccine program by reducing the number of vaccines to be purchased. That study, while offering insights into the optimization of vaccine policies in high-income countries, may not be directly applicable to Germany. Although Germany and the United Kingdom share certain demographic similarities, such as an aging population, low birth rates, and urbanization [33,34,35], notable differences exist. Germany, with its larger population, distinct migration patterns and regional variations, experiences demographic shifts that differentiate it from the United Kingdom [33,36]. Moreover, Germany has experienced lowest-low fertility for four decades, contributing to a unique demographic structure that remains unmatched in Europe [37,38,39].
A recent mathematical modeling study conducted in Germany by Horn et al. [40] concluded that adult vaccination with PCV15 and PCV20 would considerably reduce adult IPDs. That model was adapted from earlier models [41,42,43] and served as the foundation for our transmission dynamic model. The model comprised an epidemiological submodel and a demographic submodel to capture the age structure and population dynamics in Germany [40]. The demographic submodel utilized pre-calculated age distributions from 2006 to 2030 (regardless of gender) provided by the German Federal Statistical Office (Destatis) [40]. This contrasts with our study, since we used population data from the Human Mortality Database (HMD) and computed a stochastic population forecast based on a model recently developed for the case of Germany [27]. We provide an updated and adjusted population forecast as detailed in Section 2.1. Our population forecast model encompasses the future and long-term demographic structure in Germany, addressing uncertainties that are specifically captured in predictions related to demographic shifts.
Previous studies highlight the main uncertainties related to the biology and epidemiology of pneumococcal diseases, emphasizing the necessity for methodological improvements to address the complexities inherent in forecasting. These studies demonstrate the importance of accurate data for disease forecasting. Our objective is to contribute to the progress of modeling and forecasting strategies for pneumococcal diseases in Germany by introducing the integration of a population forecast model with a transmission dynamic model. This brief literature review highlights a gap in existing approaches, indicating an absence of an integrated study that combines both models. Our approach distinguishes itself by integrating the demographic shifts in the population with forecasting of pneumococcal diseases, diverging from previously studied methods.
2. Materials and Methods
2.1. Population Forecast Approach
2.1.1. Demographic Data (Preparation)
To create a population forecast for our pneumococcal projection, we collected annual German data on national population estimates, births, international migration, and deaths. We obtained population data by gender and years of age (0, 1, …, 109, 110+) from the HMD. Data before 1990 are available separately for the Federal Republic of Germany [44] and the German Democratic Republic [45]. We combined these to create age- (0, 1, …, 94, 95+ years) and gender-specific end-of-year estimates for the whole of Germany. For the years 1989 to 2020, we downloaded population data from the HMD for Germany [46]. Note that the HMD data refer to 01 January, which corresponds to 31 December of the previous year. As of the time of writing this paper, the HMD did not include population data beyond 2020. However, year-end population estimates for 2021 are available from Destatis’ database GENESIS-Online [47]. Since the HMD data primarily originate from Destatis as well, the data are consistent. The major difference is that the HMD data before the 2011 census have been census-adjusted by Klüsener et al. [48]. Therefore, in contrast to the official statistics [38], the HMD data do not exhibit a structural break in 2011 [27].
We obtained annual birth numbers categorized by mothers’ years of age (≤12, 13, 14, …, 54, 55+ years) from the Human Fertility Database for the years 1956–2017 [49] and from GENESIS-Online for 2018–2021 [50]. Additionally, we obtained annual birth numbers by babies’ genders spanning from 1950 to 2022 [51]. Following the approach recommended by Vanella and Deschermeier [37], we computed age-specific fertility rates (ASFRs) using the estimated average female populations within the corresponding age groups:
with
: births during year y to mothers aged a years on year-end y;
: female population aged a years on year-end y;
: average female population aged a years in year y.
We checked both the time series and age schedules of the ASFRs to ensure consistency. As a result, we defined the age groups for the ASFRs, spanning from 17 to 46. The bands of the age range include births to mothers younger than 17 as well as those older than 46, respectively. Consequently, we have established 30 ASFR time series covering the period from 1956 to 2021.
We obtained annual death statistics, categorized by the ages (0, 1, …, 109, 110+ years) and genders of the deceased, for the years 1956–1989, separately for West and East Germany, and for 1990–2020 for unified Germany from the HMD [46,52,53]. For 2021, we obtained the corresponding data from GENESIS-Online [54]. Using this age-specific death data, we computed age- and sex-specific survival rates (ASSSRs) according to the approach by Vanella [55]. The ASSSR for individuals of sex g, age a, and in year y is defined as follows:
with
: population aged a years of sex g on year-end y;
: number of deaths by persons of sex g during year y who would have been of age a on year-end y.
The specified method for calculating ASSSRs offers an advantage in that it is not influenced by migration movements that often introduce bias into most mortality statistics [27]. Moreover, the integration of survival rates into population forecast models is more straightforward, as discussed in Section 2.1.2. After checking the time series and inter-age group relationships within the ASSSRs for consistency, we defined the sex-specific age groups for the mortality model. These age groups range from 0 to 94 years, with a separate category for individuals aged 95 and above, resulting in a total of 192 time series from 1956 to 2021.
All data on international migration were obtained from Destatis. Annual gross migration flows, categorized by years of age and gender for the years 2000–2021, are accessible through GENESIS-Online [56]. Data prior to 2000 are not available online; however, the data for the years 1991–1999 had been provided to one of the authors for a previous study [57].
Consistent with the approach used for mortality data, we defined age groups for the migration flows spanning from 0 to 94 and a separate category for individuals aged 95 and above. This resulted in a total of 384 migration flow time series (96 age groups × 2 genders × 2 directions − inflow or outflow). The migration count to Germany by individuals aged a of sex g in year y is referred to as ; the corresponding outflow is called . These time series cover the period from 1991 to 2021.
All model simulations, calculations, and data visualizations in this study were performed using RStudio® 2023.03.0 “Cherry Blossom” (RStudio, Boston, MA, USA).
2.1.2. Population Forecast Model
The population forecast is based on a stochastic cohort component model proposed in a previous study [27]. In this paper, we provide a brief description of the demographic model. We conduct simulations with 1000 trajectories for each demographic component, including ASSSRs, ASFRs, and migrations, using principal component-based models outlined in previous studies [37,55].
The fertility model follows Vanella and Deschermeier [37]. As suggested by the authors, we performed principal component analysis (PCA) on logistic transformations of the ASFRs with an upper bound close to the empirical maximum of the ASFR matrix. However, the data cover the whole period since 1956. In Germany, that period covered a variety of geographic changes, including the separation of Germany into two countries until 1990. Moreover, Germany witnessed a demographic transition with strong increases in fertility in the 1950s and strong declines between the mid-1960s and the early 1970s. Furthermore, the reproductive behavior in East Germany diverged strongly from West Germany between the early 1970s and the late 1980s [38]. As suggested by Vanella and Deschermeier [37], we checked the time series of the first two PCs to determine the optimal baseline period to include in the model. Since there occurred a structural break in 1980, we only used the ASFRs for 1980–2021 for the model. Following the mentioned paper, we applied a logistic transformation with an upper bound close to the historical maximum ASFR during that period, which was close to 1/8. Therefore, the input data for which PCA was performed were as follows:
with being the ASFR of females aged years at year-end The transformation makes sure that simulations from the model cannot result in unrealistically huge ASFRs (qualitatively the model assumes not more than every eighth female in a cohort to give birth to a child in a specific year) and avoids negative values. The resulting PCs are simulated using fitted time series models (trend and ARIMA [autoregressive integrated moving average] models). More details on the fertility model are given by Vanella and Deschermeier [37].
The migration model used here is a national version of a regional migration model recently developed in another study by Vanella et al. [58]. This model generates 1000 trajectories for the year-end population in each age group (0–95+) and both sexes through Monte Carlo simulations. In these trajectories, the population aged , of sex , and in year is computed as shown in Equation (4) [59].
The determination of newborn sexes is computed by Monte Carlo simulation, specifically by estimating the male proportion among all live births, following the approach in another study [27]. It is important to note that both births and deaths in the model rely on the baseline population that is subject to risk, and the models for these two components are rate-based rather than count-based. Therefore, the live births, in trajectory t and year y were calculated as follows:
with
: (row) vector of all ASFRs in trajectory t;
: (column) vector of the average female population by years of age in the reproductive age range in trajectory t.
The live birth simulations by sex of the newborn are then
for males and
for females. Here, denotes the share of males among all live births in year y and trajectory t.
Finally, we introduced one condition into our forecast model. As described earlier, our model incorporates migration flows instead of rates. However, Fuchs et al. highlighted a significant limitation of migration flow forecasting: in models where migration is not linked to a baseline population, stochastic migration forecasts can sometimes lead to unrealistically large or small (or even negative) population estimates for specific subgroups in certain trajectories [60]. To address this issue, we included two conditions within the forecast algorithm. These conditions, in each step, restrict the subpopulation in all age groups to fall within the range of 3000 to 800,000 persons. This range roughly aligns with the historical extreme values for unified Germany. This serves as an indirect adjustment to the net migration simulations, ensuring that they remain within a realistic range and prevent the generation of unrealistic population estimates.
The population forecast model utilized the following R packages for all calculations: boot [61,62], MASS [63], and tseries [64].
2.2. Transmission Dynamic Model to Estimate the Burden of Pneumococcal Disease
To estimate the burden of pneumococcal disease, we used a transmission dynamic model as outlined in a previous study [41]. In this paper, we provide a brief description of the transmission dynamic model. The model addressed four pneumococcal diseases: invasive pneumococcal disease (IPD), severe community-acquired pneumonia (sCAP), fatal IPD, and fatal CAP. The model (Figure 1) consisted of 400 age classes (), ranging from 0 months to 99 years and 9 months. Each age class represented a 3-month interval, and the model simulated aging every 3 months, essentially dividing each year into quarters. Thus, accounting for quarterly intervals, the age range from 0 to 100 years multiplied by 4 (for quarterly years) resulted in 400 age classes.
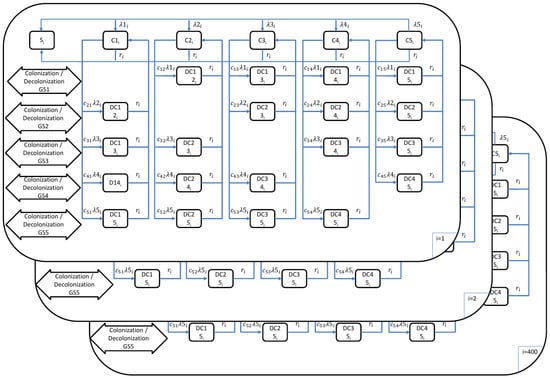
Figure 1.
Mathematical model outline for the transmission of pneumococcal disease (: 1, …, 400 age groups; : age groups; : force of infection in age group for serotype groups 1–5; : probability of transmission per contact in age group for serotype groups 1–5; : population weight of age class ; = 1/duration of carriage in age class ; : competition parameters).
In the model, five groups of pneumococcal serotypes (GS) were considered to account for the competition among them during host colonization. These five groups are as follows:
GS1: 4, 6B, 9V, 14, 18C, 19F, 23F (PCV7)
GS2: 1, 5, 6A, 7F, 19A (PCV13, PCV7, Serotype 3)
GS3: Serotype 3
GS4: 2, 8, 9N, 10A, 11A, 12F, 15B, 17F, 20, 22F, 33F (PPSV23 [23-valent polysaccharide pneumococcal vaccine], PCV13)
GS5: Other serotypes
The model also considered the various possible carrier states, including: (a) no carriage; (b) carriers of one group of serotypes (SC1: Carrier GS1, SC2: Carrier GS2, SC3: Carrier GS3, SC4: Carrier GS4, SC5: Carrier GS5); and (c) carriers of two different groups of serotypes ().
The model incorporated differential equations for the force of infection (Equations (8)–(12)) and non-vaccinated individuals (Equations (13)–(28)). More detailed information on the parameters and equations used in this study can be found in the report by Kuhlmann, Treskova, and Graf von der Schulenburg [41]. Simulations were conducted in quarterly intervals, with the age-class shifts implemented outside the differential equations. PCV13 (13-valent pneumococcal conjugate vaccine) was included in the model to simulate infant vaccination, while mortality was not factored in. Transmission risk for each age class was calculated by weighting carriers of pneumococcal serotypes based on the population structure in 2006, as determined by the POLYMOD study conducted in Germany [65].
Force of Infection:
Non-Vaccinated Individuals
Susceptible:
Carriers of single group of serotypes:
Carriers of double groups of serotypes:
The differential equations utilized LSODE from the deSolve R package, and outcomes were visualized using the ggplot2 R package [66,67]. The simulations spanned from 2001 to 2050, incorporating 1000 iterations and utilizing inputs from the population forecast model (Section 2.1.2). As the model involved 1000 iterations for each outcome, we calculated the mean projection of cases, along with the 75% prediction intervals (PIs), for the four pneumococcal diseases. To enhance visualizations, readability, and comparability, we combined IPD and sCAP cases to represent hospitalizations, while fatal IPD and fatal CAP were aggregated to represent fatal cases of pneumococcal diseases. In addition, for pneumococcal serotype groups, we combined GS4 and GS5 to facilitate comparison with the other groups (GS1, GS2, and GS3). Additional equations, calculations, and figures are provided in the Supplementary Materials.
3. Results
Figure 2 illustrates the population trend over time for Germany. Data points from 2001 to 2021 represent observed data, while data points from 2022 to 2050 depict the mean population projection. The PIs monotonically increase for an increasing distance in the future. This is a logical phenomenon, since the far future exhibits more uncertainty than the near future. For Germany, migration is especially volatile and difficult to predict, creating a large share of future uncertainty [68]. The population forecast emulates this well.
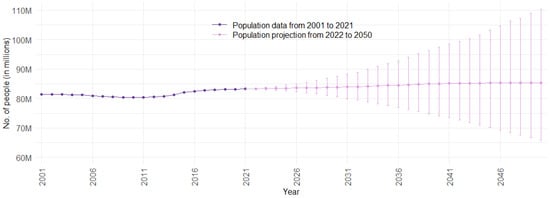
Figure 2.
Population data and projection for Germany from 2001 to 2050, with 75% prediction intervals (Sources: [46]; authors’ computation and illustration).
Figure 3 illustrates the impact of PCV13 (13-valent pneumococcal conjugate vaccine) infant vaccination on hospitalizations over time, including 75% PIs. With PCV13 infant vaccination, the mean projection of hospitalizations consistently remains lower, stabilizing at approximately 60,000 cases per year. In contrast, without infant vaccination, our model indicates a gradual increase in hospitalizations. Starting at around 60,000 hospitalizations per year, the cases increase to 90,000 per year. This trend shows the potential effect of not implementing PCV13 infant vaccination, resulting in a significant rise in hospitalizations.
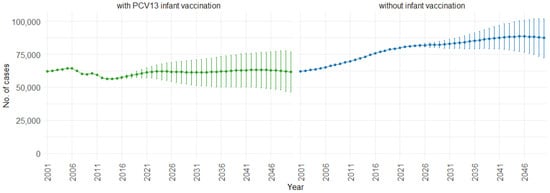
Figure 3.
Mean hospitalization projection with 75% prediction intervals (2001–2050) for all ages, with and without infant vaccination (Source: Authors’ computation and illustration).
When examining the three age groups (0–4, 5–59, and 60 and older) shown in Figure 4, Figure 5 and Figure 6, the presence of PCV13 infant vaccination consistently results in lower mean hospitalizations across the years compared to the absence of infant vaccination. For ages 0 to 4 years (Figure 4), mean hospitalizations decrease from approximately 9000 to a plateau of 2500. In contrast, without infant vaccination, mean hospitalizations increase over time, reaching above 10,000. In the 5 to 59 years age group (Figure 5), mean hospitalizations decrease gradually from around 16,000 to just above 10,000 with PCV13 infant vaccination. Without infant vaccination, mean hospitalizations remain stable at around 16,000. For individuals aged 60 and older (Figure 6), mean hospitalizations increase from just below 40,000 to 50,000 with PCV13 infant vaccination. However, according to our simulations, without infant vaccination, the numbers would be notably higher, ranging from just below 40,000 to 60,000 hospitalizations.
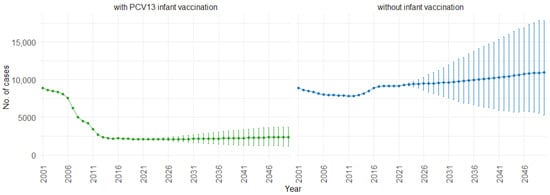
Figure 4.
Mean hospitalization projection with 75% prediction intervals (2001–2050) for ages 0–4, with and without infant vaccination (Source: Authors’ computation and illustration).
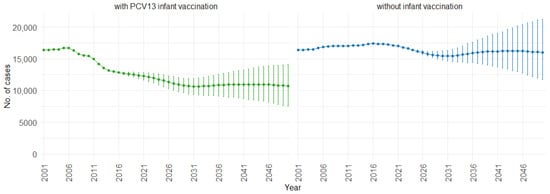
Figure 5.
Mean hospitalization projection with 75% prediction intervals (2001–2050) for ages 5–59, with and without infant vaccination (Source: Authors’ computation and illustration).
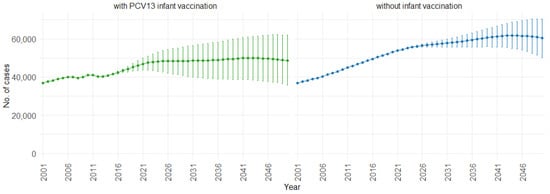
Figure 6.
Mean hospitalization projection with 75% prediction intervals (2001–2050) for ages 60 and older, with and without infant vaccination (Source: Authors’ computation and illustration).
Figure 7 illustrates the impact of PCV13 infant vaccination on fatal cases of IPD (invasive pneumococcal disease) and CAP (community-acquired pneumonia) over time. With PCV13 infant vaccination, the mean projection of fatal cases increases gradually from 7000 to approximately 9000 cases per year. In the absence of infant vaccination, there is a steeper increase, rising from 7000 to approximately 11,000 cases per year. This trend shows the potential impact of not implementing PCV13 infant vaccination, leading to a higher increase in fatal cases over time.
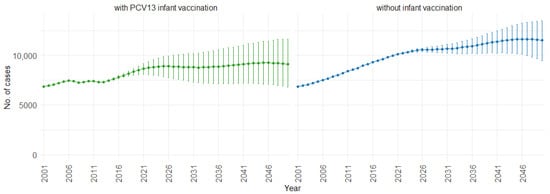
Figure 7.
Mean projection of fatal IPD and CAP cases with 75% prediction intervals (2001–2050) for all ages, with and without infant vaccination (Source: Authors’ computation and illustration).
According to our simulations, for the three age groups (0–4, 5–59, and 60 and older), the presence of PCV13 infant vaccination consistently leads to lower mean fatal cases across the years compared to the absence of infant vaccination. For individuals aged 0 to 4, mean fatal cases remain consistently low, with a slight decrease in the presence of infant vaccination, staying below 60 in both scenarios. Similarly, in the 5 to 59 age group (Figure 8), mean fatal cases are slightly lower with vaccination compared to without vaccination (750 cases vs. 1000 cases). For individuals aged 60 and older (Figure 9), mean fatal cases increase from around 6000 to 8000 with PCV13 infant vaccination. However, without infant vaccination, mean fatal cases would be notably higher, ranging from approximately 6000 to more than 10,000 cases. This trend emphasizes the potential impact of not implementing PCV13 infant vaccination, resulting in higher fatal cases of IPD and CAP over time.
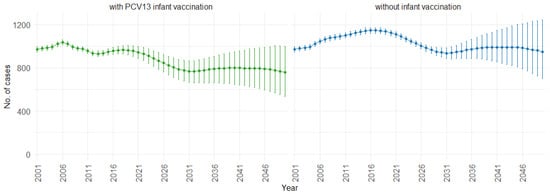
Figure 8.
Mean projection of fatal IPD and CAP cases with 75% prediction intervals (2001–2050) for ages 5–59, with and without infant vaccination (Source: Authors’ computation and illustration).
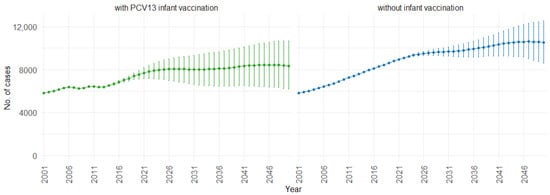
Figure 9.
Mean projection of fatal IPD and CAP cases with 75% prediction intervals (2001–2050) for ages 60 and older, with and without infant vaccination (Source: Authors’ computation and illustration).
Figure 10 demonstrates the impact of PCV13 infant vaccination on hospitalizations over time, categorized by pneumococcal serotype groups. For GS1 and GS2, the mean hospitalizations continuously remain lower, stabilizing at around 300 per year. In contrast, without infant vaccination, the numbers gradually increase, from 50,000 to 70,000 hospitalizations per year for GS1 and from 12,500 to 25,000 hospitalizations per year for GS2. For GS3, mean hospitalizations remain similar with or without PCV13 vaccination (12,500 per year). However, for GS4 and GS5, mean hospitalizations are considerably higher with PCV13 vaccination (from 20,000 to 70,000 per year) compared to without vaccination (roughly 25,000 hospitalizations per year).
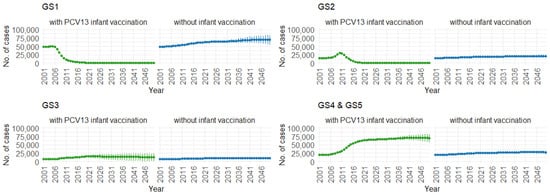
Figure 10.
Mean hospitalizations with 75% prediction intervals (2001–2050) for all age groups, with and without infant vaccination, by pneumococcal serotype group (Source: Authors’ computation and illustration).
Correspondingly, when examining the three age groups (0–4, 5–59, and 60 and older) in Figure 11, Figure 12 and Figure 13, the presence of PCV13 infant vaccination consistently results in lower mean hospitalization rates over the years, specifically for GS1 and GS2. For GS3 in all three age groups, mean hospitalizations remain consistent, regardless of the presence of PCV13 vaccination. However, for GS4 and GS5, mean hospitalizations are significantly higher with PCV13 vaccination.
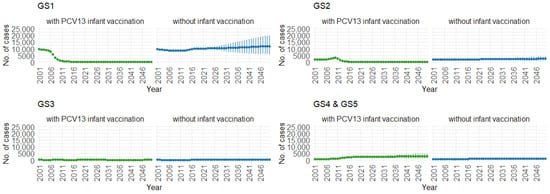
Figure 11.
Mean hospitalizations with 75% prediction intervals (2001–2050) for ages 0–4, with and without infant vaccination, by pneumococcal serotype group (Source: Authors’ computation and illustration).
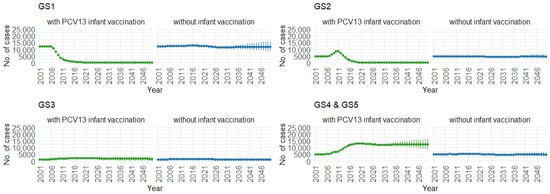
Figure 12.
Mean hospitalizations with 75% prediction intervals (2001–2050) for ages 5–59, with and without infant vaccination, by pneumococcal serotype group (Source: Authors’ computation and illustration).
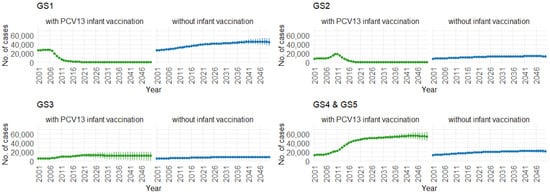
Figure 13.
Mean hospitalizations with 75% prediction intervals (2001–2050) for ages 60 and older, with and without infant vaccination, by pneumococcal serotype group (Source: Authors’ computation and illustration).
4. Discussion
In this study, we estimate the future burden of pneumococcal diseases in Germany up to the year 2050. We focus on IPD (invasive pneumococcal disease) and sCAP (severe community-acquired pneumonia) cases as hospitalizations, and fatal cases of IPD and CAP, exploring these outcomes for three age groups (0–4, 5–59, and 60 and older). Overall, the presence of PCV13 (13-valent pneumococcal conjugate vaccine) infant vaccination consistently lowers hospitalizations, as well as fatal cases, compared to scenarios with no infant vaccination. This aligns with the existing literature, where the administration of infant vaccination contributes to reduced disease transmission of pneumococcal disease in the population, particularly in children and in unvaccinated older age groups [69,70,71,72].
We introduced a novel approach by integrating a stochastic cohort component population forecast model into our disease transmission dynamic model for the German population. Our population forecast model utilized national demographic data, including estimates for births, migration, and deaths, as well as specific parameters for sex and age. By employing age-specific fertility rates and sex-specific age groups for mortality, we generated 1000 trajectories for the year-end population in each age group and both sexes through Monte Carlo simulations. The submodels covered both long-term trends and autocorrelations in fertility, mortality, and migration by time series analysis and cross-correlations between age groups and genders in the three demographic components by principal component analysis. The stochasticity in the future demographic developments was included by Monte Carlo simulation of ARIMA (autoregressive integrated moving average) models, which was illustrated via 75% PIs (prediction intervals). Generating 1000 trajectories for each age group annually from 2022 to 2050 allowed us to conduct 1000 iterations of our transmission dynamic model, enabling us to derive age-specific case numbers for pneumococcal disease. This approach differs from other notable forecasting models for pneumococcal disease in the literature. Some of these models involve the use of surveillance data and Poisson model validations in the United States [31], past incidence of pneumococcal disease and observed trends from surveillance data in Belgium [73], Poisson regression models fitted to monthly pneumococcal rates in Quebec, Canada [74], and carriage prevalence and case-fatality data estimates using negative binomial regression in England and Wales [75]. Employing our combined approach, we suggest a novel, completely stochastic approach for long-term forecasting of hospitalizations and deaths associated with pneumococcal disease that accounts for demographic and epidemiological trends, as well as the effects of vaccinations.
Our study had several limitations. While our transmission dynamic model focused on five specific serotype groups, representing only a fraction of the more than 90 serotypes of S. pneumonia [76], it does not cover the complete range of circulating pneumococcal serotypes present in the population. Identifying prominent serotypes is challenging due to the lack of routine data on serotype distributions for IPD and CAP. Even with PCV13 infant vaccination in place, our simulations showed that case numbers for the pneumococcal serotype group GS3 remain unchanged compared to scenarios without vaccination. GS3 contains serotype 3, a component of the PCV13. The model calibration demonstrated a quicker waning of vaccine protection for serotype 3 against pneumococcal carriage and pneumococcal diseases. Our model indicates limited indirect herd effects for PCV13, a finding supported by an empirical study on the vaccine’s effectiveness [77]. Additionally, PCV13 covers 13 serotypes including 19A and 3, which were found to be one of the most prominent IPD serotypes among adults aged 60 and older in Germany in 2017/2018 (19A at 7.0%, 9N at 7.0%, 22F at 7.6%, 8 at 9.8%, and 3 at 20.9%) [12]. The prevalence of PCV (pneumococcal conjugate vaccine) serotypes, particularly 19A and 3, in adult IPDs suggests a potential need for individual PCV13 immunization among those with chronic illnesses and elderly individuals [7].
Another limitation of our study is the absence of adult vaccination in any of the scenarios. Our simulations reveal that for pneumococcal serotype groups GS4 and GS5, case numbers are higher compared to scenarios without PCV13 infant vaccination. GS4 includes serotypes covered by both PCV13 and PPSV23 (23-valent pneumococcal polysaccharide vaccine), while GS5 contains other pneumococcal serotypes not addressed by PCV7 (7-valent pneumococcal conjugate vaccine), PCV13, and PPSV23 vaccinations. The absence of PPSV23 adult vaccination in our model is a contributing factor to the observed increase in cases for these serotypes. Future improvements to this study could explore scenarios involving routine PCV13 infant vaccination, along with PPSV23 adult vaccination. PPSV23 has been recommended by the German Standing Committee on Vaccination (STIKO, Ständige Impfkommission) for individuals aged 60 and above in Germany [78]. However, there is a low uptake of this vaccine; a claims data-based cohort study by Braeter et al. [79] in 2016 reported that only 10.2% of statutory health insurance (SHI)-insured individuals aged 60–64 years received the vaccine [78].
In addition, our analysis only considered the impact of infant vaccination with PCV13 until 2050, neglecting other available vaccinations such as PCV15 (15-valent pneumococcal conjugate vaccine), which could influence overall disease dynamics in the population. Areas for further investigation could also explore the potential impact of infant vaccination with PCV15, as well as the potential impact of adult vaccination with PCV13, PCV15, and PCV20 (a 20-valent pneumococcal conjugate vaccine). Both PCV15 and PCV20 are licensed for use in adults, while PCV15 has also been licensed for use in children [80,81]. PCV15 includes all serotypes of PCV13 plus serotypes 22F and 33F, and PCV20 includes PCV13 serotypes along with serotypes 8, 10A, 11A, 12F, 15B, 22F and 33F [82].
The 2023 mathematical modeling study in Germany [40], which considered seven serotype groups, demonstrated that adult vaccination with PCV15 and PCV20 would prevent a considerable number of adult IPDs. The study by Horn et al. also concluded that PCV20 would offer the most extensive protection against pneumococcal disease [40]. Additionally, the study suggested that if the current vaccine policy (PPSV23 vaccination in adults and PCV15 vaccination in children) is maintained until 2031, there would still be a 20% increase in IPD cases due to serotypes in individuals aged 60 and older [40]. Concurrently, there would be a continual reduction in IPD cases among individuals aged 16–59, while the number of cases in children under 2 years old would remain unchanged [40]. A recent study on serotype-specific IPD surveillance data from 30 high-income countries, including Germany, also found that a considerable proportion of IPD is associated with serotypes covered by PCV15 and PCV20 [22]. Thus, incorporating these vaccines into the national policy could potentially contribute to a greater reduction in pneumococcal disease.
Based on these considerations regarding pneumococcal vaccinations, there is a need to not only advocate for the recommendation of higher-valent PCVs, such as PCV13 for infants and PCV15 and PCV20 for older adults [40], but also to improve vaccination uptake among older adults to reduce the overall disease burden. A recent scoping study encompassing 39 studies across seven high-income countries, including Germany, indicated that interventions linked with increased pneumococcal vaccination uptake include multifaceted educational interventions, comprehensive health checklists, nurse-directed vaccination directives, hospital-based vaccination protocols, electronic medical records with decision support tools, and regular health assessments [83]. Furthermore, additional studies, such as randomized-controlled trials, are needed to directly compare the effectiveness of various intervention methods [83].
Another limitation is the inability to conduct statistical tests such as a chi-square test between the vaccination and non-vaccination groups for each year due to the presence of 1000 projections annually from 2022 to 2050. Pairing each projection between the two groups for a paired t-test would be impractical and would result in generating p-values for each pair of projections, making the analysis complex. As an alternative method to illustrate significance, 75% PIs were presented in the results.
Moreover, we need to stress that the model does not include the circularity of pneumococcal-associated fatality in the different scenarios with the overall mortality that is included in the population forecast model, since the non-vaccination scenarios are primarily based on a hypothetical approach that is not actually observed in the historical population data. However, this limitation appears negligible since the differences in the cumulative deaths between the two scenarios (about 2000 mean deaths in 2050) are minor in comparison to the overall prediction of 1.24 million deaths in Germany in 2050.
Our study offers insights into the trends of the pneumococcal disease burden in Germany up to the year 2050, focusing on the impact of PCV13 infant vaccination, based on a stochastic population forecast model. The utilization of this population forecast model not only aids in understanding the demographic developments in Germany but also serves as a valuable tool for assessing trends in different countries with similar settings and healthcare resources. Furthermore, this information provides valuable insights into potential areas of improvement in national vaccine policies and programs, aiming to further reduce the transmission and burden of pneumococcal disease.
Supplementary Materials
The following supporting information can be downloaded at: https://www.mdpi.com/article/10.3390/math12060796/s1. Table S1: Parameters and variables of the differential equation system. Figure S1: Mean projection of fatal IPD and CAP cases with 75%–prediction intervals (2001–2050) for ages 0–1, with and without infant vaccination. Figure S2: Mean projection of fatal IPD and CAP cases with 75%–prediction intervals (2001–2050) for ages 2–4, with and without infant vaccination. Figure S3: Mean projection of fatal IPD and CAP cases with 75%–prediction intervals (2001–2050) for ages 5–14, with and without infant vaccination. Figure S4: Mean projection of fatal IPD and CAP cases with 75%–prediction intervals (2001–2050) for ages 15–44, with and without infant vaccination. Figure S5: Mean projection of fatal IPD and CAP cases with 75%–prediction intervals (2001–2050) for ages 45–59, with and without infant vaccination. Figure S6: Mean projection of fatal IPD and CAP cases with 75%–prediction intervals (2001–2050) for ages 60–74, with and without infant vaccination. Figure S7: Mean projection of fatal IPD and CAP cases with 75%–prediction intervals (2001–2050) for ages 75–84, with and without infant vaccination. Figure S8: Mean projection of fatal IPD and CAP cases with 75%–prediction intervals (2001–2050) for ages 85–99, with and without infant vaccination. Figure S9: Mean hospitalization projection with 75%–prediction intervals (2001–2050) for ages 0–1, with and without infant vaccination. Figure S10: Mean hospitalization projection with 75%–prediction intervals (2001–2050) for ages 2–4, with and without infant vaccination. Figure S11: Mean hospitalization projection with 75%–prediction intervals (2001–2050) for ages 5–14, with and without infant vaccination. Figure S12: Mean hospitalization projection with 75%–prediction intervals (2001–2050) for ages 15–44, with and without infant vaccination. Figure S13: Mean hospitalization projection with 75%–prediction intervals (2001–2050) for ages 45–59, with and without infant vaccination. Figure S14: Mean hospitalization projection with 75%–prediction intervals (2001–2050) for ages 60–74, with and without infant vaccination. Figure S15: Mean hospitalization projection with 75%–prediction intervals (2001–2050) for ages 75–84, with and without infant vaccination. Figure S16: Mean hospitalization projection with 75%–prediction intervals (2001–2050) for ages 85–99, with and without infant vaccination. Figure S17: Mean hospitalizations with 75%–prediction intervals (2001–2050) for ages 0–1, with and without infant vaccination, by pneumococcal serotype group. Figure S18: Mean hospitalizations with 75%-prediction intervals (2001–2050) for ages 2–4, with and without infant vaccination, by pneumococcal serotype group. Figure S19: Mean hospitalizations with 75%–prediction intervals (2001–2050) for ages 5–14, with and without infant vaccination, by pneumococcal serotype group. Figure S20: Mean hospitalizations with 75%–prediction intervals (2001–2050) for ages 15–44, with and without infant vaccination, by pneumococcal serotype group. Figure S21: Mean hospitalizations with 75%–prediction intervals (2001–2050) for ages 45–59, with and without infant vaccination, by pneumococcal serotype group. Figure S22: Mean hospitalizations with 75%–prediction intervals (2001–2050) for ages 60–74, with and without infant vaccination, by pneumococcal serotype group. Figure S23: Mean hospitalizations with 75%–prediction intervals (2001–2050) for ages 75–84, with and without infant vaccination, by pneumococcal serotype group. Figure S24: Mean hospitalizations with 75%–prediction intervals (2001–2050) for ages 85–99, with and without infant vaccination, by pneumococcal serotype group.
Author Contributions
Conceptualization, P.V. and A.K.; Methodology, M.H.S., K.M., P.V. and A.K.; Formal analysis, M.H.S., K.M., P.V. and A.K.; Data curation, M.H.S., K.M., P.V. and A.K.; Writing—original draft, M.H.S., P.V. and A.K.; Writing—review and editing, M.H.S., K.M., P.V. and A.K.; Visualization, M.H.S.; Supervision, P.V. and A.K. All authors have read and agreed to the published version of the manuscript.
Funding
This research received no external funding.
Data Availability Statement
The data prepared for this study are based on the raw data from the Human Mortality Database [46]. Further data, as well as model parameters used in this study, are available from the corresponding authors on reasonable request.
Acknowledgments
We appreciate the timely and helpful comments by the three anonymous reviewers of the papers that helped us to improve the initial version of the manuscript.
Conflicts of Interest
The authors have declared that they have no known competing interests.
Abbreviations
The following abbreviations are used in this manuscript:
| IPD | Invasive pneumococcal disease |
| NIPD | Noninvasive pneumococcal disease |
| CAP | Community-acquired pneumonia |
| PCVs | Pneumococcal conjugate vaccines |
| PCV7 | 7-valent pneumococcal conjugate vaccine |
| PCV10 | 10-valent pneumococcal conjugate vaccine |
| PCV13 | 13-valent pneumococcal conjugate vaccine |
| PCV15 | 15-valent pneumococcal conjugate vaccine |
| PCV20 | 20-valent pneumococcal conjugate vaccine |
| PPSV23 | 23-valent pneumococcal polysaccharide vaccine |
| HMD | Human Mortality Database |
| ASFRs | Age-specific fertility rates |
| ASSSRs | Age- and sex-specific survival rates |
| GS | Groups of pneumococcal serotypes |
| GS1 | Pneumococcal serotypes: 4, 6B, 9V, 14, 18C, 19F, 23F (PCV7) |
| GS2 | Pneumococcal serotypes: 1, 5, 6A, 7F, 19A (PCV13, PCV7, Serotype 3) |
| GS3 | Pneumococcal serotypes: 3 |
| GS4 | Pneumococcal serotypes: 2, 8, 9N, 10A, 11A, 12F, 15B, 17F, 20, 22F, 33F (PPSV23, PCV13) |
| GS5 | Pneumococcal serotypes: other |
| PIs | Prediction intervals |
| ARIMA | Autoregressive integrated moving average |
References
- Wahl, B.; O’Brien, K.L.; Greenbaum, A.; Majumder, A.; Liu, L.; Chu, Y.; Luksic, I.; Nair, H.; McAllister, D.A.; Campbell, H.; et al. Burden of Streptococcus pneumoniae and Haemophilus influenzae type b disease in children in the era of conjugate vaccines: Global, regional, and national estimates for 2000–2015. Lancet Glob. Health 2018, 6, e744–e757. [Google Scholar] [CrossRef]
- GBD 2015 LRI Collaborators. Estimates of the global, regional, and national morbidity, mortality, and aetiologies of lower respiratory tract infections in 195 countries: A systematic analysis for the Global Burden of Disease Study 2015. Lancet Infect. Dis. 2017, 17, 1133–1161. [Google Scholar] [CrossRef]
- Ludwig, E.; Bonanni, P.; Rohde, G.; Sayiner, A.; Torres, A. The remaining challenges of pneumococcal disease in adults. Eur. Respir. Rev. 2012, 21, 57–65. [Google Scholar] [CrossRef]
- Teixeira, R.; Kossyvaki, V.; Galvez, P.; Mendez, C. Pneumococcal Serotype Evolution and Burden in European Adults in the Last Decade: A Systematic Review. Microorganisms 2023, 11, 1376. [Google Scholar] [CrossRef] [PubMed]
- Chen, H.; Matsumoto, H.; Horita, N.; Hara, Y.; Kobayashi, N.; Kaneko, T. Prognostic factors for mortality in invasive pneumococcal disease in adult: A system review and meta-analysis. Sci. Rep. 2021, 11, 11865. [Google Scholar] [CrossRef] [PubMed]
- Imohl, M.; Perniciaro, S.; Busse, A.; van der Linden, M. Bacterial Spectrum of Spontaneously Ruptured Otitis Media in a 7-Year, Longitudinal, Multicenter, Epidemiological Cross-Sectional Study in Germany. Front. Med. 2021, 8, 675225. [Google Scholar] [CrossRef] [PubMed]
- Yoon, J.G.; Jang, A.Y.; Kim, M.J.; Seo, Y.B.; Lee, J.; Choi, Y.H.; Kim, Y.K.; Jeong, E.J.; Kim, H.S.; Kwon, K.T.; et al. Persistent serotype 3 and 19A invasive pneumococcal diseases in adults in vaccine era: Serotype-dependent difference in ceftriaxone susceptibility. Vaccine 2022, 40, 2258–2265. [Google Scholar] [CrossRef]
- GBD Lower Respiratory Infections Collaborators. Estimates of the global, regional, and national morbidity, mortality, and aetiologies of lower respiratory infections in 195 countries, 1990–2016: A systematic analysis for the Global Burden of Disease Study 2016. Lancet Infect. Dis. 2018, 18, 1191–1210. [Google Scholar] [CrossRef] [PubMed]
- Bogaert, D.; De Groot, R.; Hermans, P.W. Streptococcus pneumoniae colonisation: The key to pneumococcal disease. Lancet Infect. Dis. 2004, 4, 144–154. [Google Scholar] [CrossRef]
- Centers for Disease Control and Prevention. About Pneumococcal Disease. Available online: https://www.cdc.gov/pneumococcal/about/risk-transmission.html#:~:text=Young%20children%20and%20older%20adults,adults%2065%20years%20or%20older (accessed on 22 February 2024).
- European Centre for Disease Prevention and Control. Invasive Pneumococcal Disease—Annual Epidemiological Report for 2018; ECDC: Solna, Sweden, 2020. [Google Scholar]
- van der Linden, M.; Imohl, M.; Perniciaro, S. Limited indirect effects of an infant pneumococcal vaccination program in an aging population. PLoS ONE 2019, 14, e0220453. [Google Scholar] [CrossRef]
- Reinert, R.R.; Haupts, S.; van der Linden, M.; Heeg, C.; Cil, M.Y.; Al-Lahham, A.; Fedson, D.S. Invasive pneumococcal disease in adults in North-Rhine Westphalia, Germany, 2001–2003. Clin. Microbiol. Infect. 2005, 11, 985–991. [Google Scholar] [CrossRef] [PubMed]
- van Hoek, A.J.; Andrews, N.; Waight, P.A.; George, R.; Miller, E. Effect of Serotype on Focus and Mortality of Invasive Pneumococcal Disease: Coverage of Different Vaccines and Insight into Non-Vaccine Serotypes. PLoS ONE 2012, 7, e39150. [Google Scholar] [CrossRef] [PubMed]
- File, T.M., Jr. Streptococcus pneumoniae and community-acquired pneumonia: A cause for concern. Am. J. Med. 2004, 117 (Suppl. 3A), 39S–50S. [Google Scholar] [CrossRef]
- Shoar, S.; Musher, D.M. Etiology of community-acquired pneumonia in adults: A systematic review. Pneumonia 2020, 12, 11. [Google Scholar] [CrossRef] [PubMed]
- Pletz, M.W.; von Baum, H.; van der Linden, M.; Rohde, G.; Schutte, H.; Suttorp, N.; Welte, T. The burden of pneumococcal pneumonia—Experience of the German competence network CAPNETZ. Pneumologie 2012, 66, 470–475. [Google Scholar] [CrossRef] [PubMed]
- Theilacker, C.; Sprenger, R.; Leverkus, F.; Walker, J.; Hackl, D.; von Eiff, C.; Schiffner-Rohe, J. Population-based incidence and mortality of community-acquired pneumonia in Germany. PLoS ONE 2021, 16, e0253118. [Google Scholar] [CrossRef] [PubMed]
- Welte, T. New antibiotic development: The need versus the costs. Lancet Infect. Dis. 2016, 16, 386–387. [Google Scholar] [CrossRef]
- Welte, T. Pneumococcal Conjugate Vaccine—Equally Effective for Everyone? Dtsch. Arztebl. Int. 2016, 113, 137–138. [Google Scholar] [CrossRef][Green Version]
- Lagousi, T.; Papadatou, I.; Strempas, P.; Chatzikalil, E.; Spoulou, V. Pneumococcal Immunization Strategies for High-Risk Pediatric Populations Worldwide: One Size Does Not Fit All. Vaccines 2021, 9, 1390. [Google Scholar] [CrossRef]
- Grant, L.R.; Slack, M.P.E.; Theilacker, C.; Vojicic, J.; Dion, S.; Reinert, R.R.; Jodar, L.; Gessner, B.D. Distribution of Serotypes Causing Invasive Pneumococcal Disease in Children from High-Income Countries and the Impact of Pediatric Pneumococcal Vaccination. Clin. Infect. Dis. 2023, 76, e1062–e1070. [Google Scholar] [CrossRef]
- Nisar, M.I.; Jehan, F.; Shahid, S.; Ahmed, S.; Shakoor, S.; Kabir, F.; Hotwani, A.; Muneer, S.; Khalid, F.; Muhammad, S.; et al. Serotype-specific effectiveness against pneumococcal carriage and serotype replacement after ten-valent Pneumococcal Conjugate Vaccine (PCV10) introduction in Pakistan. PLoS ONE 2022, 17, e0262466. [Google Scholar] [CrossRef] [PubMed]
- Lochen, A.; Croucher, N.J.; Anderson, R.M. Divergent serotype replacement trends and increasing diversity in pneumococcal disease in high income settings reduce the benefit of expanding vaccine valency. Sci. Rep. 2020, 10, 18977. [Google Scholar] [CrossRef] [PubMed]
- Goldblatt, D. The indirect effect of pneumococcal conjugate vaccine. Lancet Glob. Health 2017, 5, e6–e7. [Google Scholar] [CrossRef] [PubMed]
- Forstner, C.; Kolditz, M.; Kesselmeier, M.; Ewig, S.; Rohde, G.; Barten-Neiner, G.; Rupp, J.; Witzenrath, M.; Welte, T.; Pletz, M.W.; et al. Pneumococcal conjugate serotype distribution and predominating role of serotype 3 in German adults with community-acquired pneumonia. Vaccine 2020, 38, 1129–1136. [Google Scholar] [CrossRef]
- Vanella, P.; Deschermeier, P. A probabilistic cohort-component model for population forecasting: The case of Germany. J. Popul. Ageing 2020, 13, 513–545. [Google Scholar] [CrossRef]
- Maretzke, S.; Hoymann, J.; Schlömer, C.; Stelzer, A. Raumordnungsprognose 2040; Bundesinstitut für Bau-, Stadt- und Raumforschung im Bundesamt für Bauwesen und Raumordnung: Bonn, Germany, 2021. [Google Scholar]
- Nowossadeck, E.; Prutz, F.; Teti, A. Population change and the burden of hospitalization in Germany 2000–2040: Decomposition analysis and projection. PLoS ONE 2020, 15, e0243322. [Google Scholar] [CrossRef] [PubMed]
- Lochen, A.; Anderson, R.M. Dynamic transmission models and economic evaluations of pneumococcal conjugate vaccines: A quality appraisal and limitations. Clin. Microbiol. Infect. 2020, 26, 60–70. [Google Scholar] [CrossRef]
- Link-Gelles, R.; Taylor, T.; Moore, M.R.; Active Bacterial Core Surveillance Team. Forecasting invasive pneumococcal disease trends after the introduction of 13-valent pneumococcal conjugate vaccine in the United States, 2010–2020. Vaccine 2013, 31, 2572–2577. [Google Scholar] [CrossRef]
- Choi, Y.H.; Andrews, N.; Miller, E. Estimated impact of revising the 13-valent pneumococcal conjugate vaccine schedule from 2 + 1 to 1 + 1 in England and Wales: A modelling study. PLoS Med. 2019, 16, e1002845. [Google Scholar] [CrossRef]
- Meintrup, D.; Nowak-Machen, M.; Borgmann, S. A Comparison of Germany and the United Kingdom Indicates That More SARS-CoV-2 Circulation and Less Restrictions in the Warm Season Might Reduce Overall COVID-19 Burden. Life 2022, 12, 953. [Google Scholar] [CrossRef]
- Heider, B.; Stroms, P.; Koch, J.; Siedentop, S. Where do immigrants move in Germany? The role of international migration in regional disparities in population development. Popul. Space Place 2020, 26, e2363. [Google Scholar] [CrossRef]
- Dembski, S.; Sykes, O.; Couch, C.; Desjardins, X.; Evers, D.; Osterhage, F.; Siedentop, S.; Zimmermann, K. Reurbanisation and suburbia in Northwest Europe: A comparative perspective on spatial trends and policy approaches. Prog. Plan. 2021, 150, 100462. [Google Scholar] [CrossRef]
- Sander, N. Internal Migration in Germany, 1995–2010: New Insights into East-West Migration and Re-urbanisation. Comp. Popul. Stud. 2014, 39, 2. [Google Scholar] [CrossRef]
- Vanella, P.; Deschermeier, P. A principal component simulation of age-specific fertility: Impacts of family and social policy on reproductive behavior in Germany. Popul. Rev. 2019, 58, 78–109. [Google Scholar] [CrossRef]
- Vanella, P.; Hassenstein, M.J. Stochastic Forecasting of Regional Age-Specific Fertility Rates: An Outlook for German NUTS-3 Regions. Mathematics 2023, 12, 25. [Google Scholar] [CrossRef]
- Bujard, M. Consequences of Enduring Low Fertility—A German Case Study. Demographic Projections and Implications for Different Policy Fields. Comp. Popul. Stud. 2015, 40, 131–164. [Google Scholar] [CrossRef]
- Horn, M.; Theilacker, C.; Sprenger, R.; von Eiff, C.; Mahar, E.; Schiffner-Rohe, J.; Pletz, M.W.; van der Linden, M.; Scholz, M. Mathematical modeling of pneumococcal transmission dynamics in response to PCV13 infant vaccination in Germany predicts increasing IPD burden due to serotypes included in next-generation PCVs. PLoS ONE 2023, 18, e0281261. [Google Scholar] [CrossRef]
- Kuhlmann, A.; Treskova, M.; von der Schulenburg, J.M. Pneumococcal Disease in Adults: Health Economic Evaluation of Different Vaccination Scenarios in Germany. Available online: https://www.rki.de/DE/Content/Infekt/Impfen/Forschungsprojekte/abgeschlossene_Projekte/Pneumokokkenerkrankungen/Abschlussbericht.pdf?__blob=publicationFile (accessed on 3 November 2023).
- Choi, Y.H.; Miller, E. Impact of COVID-19 social distancing measures on future incidence of invasive pneumococcal disease in England and Wales: A mathematical modelling study. BMJ Open 2021, 11, e045380. [Google Scholar] [CrossRef]
- Melegaro, A.; Choi, Y.H.; George, R.; Edmunds, W.J.; Miller, E.; Gay, N.J. Dynamic models of pneumococcal carriage and the impact of the Heptavalent Pneumococcal Conjugate Vaccine on invasive pneumococcal disease. BMC Infect. Dis. 2010, 10, 90. [Google Scholar] [CrossRef]
- Human Mortality Database. West Germany, Population Size (Abridged). 2023. Available online: www.mortality.org/Country/Country?cntr=DEUTW (accessed on 19 June 2023).
- Human Mortality Database. East Germany, Population Size (Abridged). 2023. Available online: www.mortality.org/Country/Country?cntr=DEUTE (accessed on 19 June 2023).
- Human Mortality Database. Germany, Population Size (Abridged). 2023. Available online: www.mortality.org/Country/Country?cntr=DEUTWNP (accessed on 19 June 2023).
- Destatis. 12411-0006: Bevölkerung: Deutschland, Stichtag, Altersjahre, Nationalität/Geschlecht/Familienstand; Destatis: Wiesbaden, Germany, 2023; Available online: https://www-genesis.destatis.de/genesis//online?operation=table&code=12411-0006 (accessed on 19 June 2023).
- Klüsener, S.; Grigoriev, P.; Scholz, R.D.; Jdanov, D.A. Adjusting inter-censal population estimates for germany 1987–2011: Approaches and impact on demographic indicators. Comp. Popul. Stud. 2018, 43, 31–64. [Google Scholar] [CrossRef]
- Human Fertility Database. Germany, Live Births by Calendar Year, Age Reached during the Year (Ardy) and Birth Cohort (Vertical Parallelograms). 2023. Available online: https://www.humanfertility.org/Country/Country?cntr=DEUTNP (accessed on 19 June 2023).
- Destatis. 12612-0005: Lebendgeborene: Deutschland, Jahre, alter der Mutter, Lebendgeburtenfolge; Destatis: Wiesbaden, Germany, 2023; Available online: https://www-genesis.destatis.de/genesis//online?operation=table&code=12612-0005 (accessed on 19 June 2023).
- Destatis. 12612-0001: Lebendgeborene: Deutschland, Jahre, Geschlecht; Destatis: Wiesbaden, Germany, 2023; Available online: https://www-genesis.destatis.de/genesis//online?operation=table&code=12612-0001 (accessed on 19 June 2023).
- Human Mortality Database. East Germany, Deaths (Period 1x1). 2023. Available online: www.mortality.org/Country/Country?cntr=DEUTE (accessed on 19 June 2023).
- Human Mortality Database. West Germany, Deaths (Period 1x1). 2023. Available online: www.mortality.org/Country/Country?cntr=DEUTW (accessed on 19 June 2023).
- Destatis. 12613-0003: Gestorbene: Deutschland, Jahre, Geschlecht, Altersjahre; Destatis: Wiesbaden, Germany, 2023; Available online: https://www-genesis.destatis.de/genesis//online?operation=table&code=12613-0003 (accessed on 19 June 2023).
- Vanella, P. A principal component model for forecasting age- and sex-specific survival probabilities in Western Europe. Z. Gesamte Versicherungswiss. 2017, 106, 539–554. [Google Scholar] [CrossRef]
- Destatis. 12711-0006: Wanderungen Zwischen Deutschland und dem Ausland: Deutschland, Jahre, Nationalität, Geschlecht, Altersjahre; Destatis: Wiesbaden, Germany, 2023; Available online: https://www-genesis.destatis.de/genesis//online?operation=table&code=12711-0006 (accessed on 19 June 2023).
- Destatis. Wanderungen Zwischen Deutschland und dem Ausland 1991–1999; Destatis: Wiesbaden, Germany, 2020; Data provided on demand on 2 September 2015. [Google Scholar]
- Vanella, P.; Hellwagner, T.; Deschermeier, P. Parsimonious stochastic forecasting of international and internal migration on the NUTS-3 level—An outlook of regional depopulation trends in Germany. Vienna Yearb. Popul. Res. 2023, 21, 361–415. [Google Scholar] [CrossRef]
- Vanella, P.; Wilke, C.B.; Söhnlein, D. Prevalence and Economic Costs of Absenteeism in an Aging Population—A Quasi-Stochastic Projection for Germany. Forecasting 2022, 4, 371–393. [Google Scholar] [CrossRef]
- Fuchs, J.; Söhnlein, D.; Vanella, P. Migration Forecasting—Significance and Approaches. Encyclopedia 2021, 1, 689–709. [Google Scholar] [CrossRef]
- Canty, A.; Ripley, B.D. boot: Bootstrap r (s-Plus) Functions. R Package Version 1.3-30. 2024. Available online: https://cran.r-project.org/web/packages/boot/citation.html (accessed on 19 June 2023).
- Davison, A.C.; Hinkley, D.V. Bootstrap Methods and Their Applications; Cambridge University Press: Cambridge, UK, 1997. [Google Scholar]
- Venables, W.N.; Ripley, B.D. Modern Applied Statistics with s, 4th ed.; Springer: Berlin/Heidelberg, Germany, 2002. [Google Scholar]
- Trapletti, A.; Hornik, K. Tseries: Time Series Analysis and Computational Finance. 2020. Available online: https://cran.r-project.org/web/packages/tseries/index.html (accessed on 19 June 2023).
- Mossong, J.; Hens, N.; Jit, M.; Beutels, P.; Auranen, K.; Mikolajczyk, R.; Massari, M.; Salmaso, S.; Tomba, G.S.; Wallinga, J.; et al. Social Contacts and Mixing Patterns Relevant to the Spread of Infectious Diseases. PLoS Med. 2008, 5, e74. [Google Scholar] [CrossRef] [PubMed]
- Soetaert, K.; Petzoldt, T.; Setzer, R.W. Solving Differential Equations in R: Package deSolve. J. Stat. Softw. 2010, 33, 1–25. [Google Scholar] [CrossRef]
- Wickham, H. Ggplot2: Elegant Graphics for Data Analysis; Springer: New York, NY, USA, 2016. [Google Scholar]
- Vanella, P.; Deschermeier, P. A Stochastic Forecasting Model of International Migration in Germany. In Familie–Bildung–Migration. Familienforschung im Spannungsfeld zwischen Wissenschaft, Politik und Praxis. Tagungsband zum 5. Europäischen Fachkongress Familienforschung; Kapella, O., Schneider, N.F., Rost, H., Eds.; Verlag Barbara Budrich: Opladen, Germany; Berlin, Germany; Toronto, ON, Canada, 2018; pp. 261–280. [Google Scholar]
- Perdrizet, J.; Horn, E.K.; Hayford, K.; Grant, L.; Barry, R.; Huang, L.; McDade, C.; Wilson, M. Historical Population-Level Impact of Infant 13-Valent Pneumococcal Conjugate Vaccine (PCV13) National Immunization Programs on Invasive Pneumococcal Disease in Australia, Canada, England and Wales, Israel, and the United States. Infect. Dis. Ther. 2023, 12, 1351–1364. [Google Scholar] [CrossRef]
- Chapman, R.; Sutton, K.; Dillon-Murphy, D.; Patel, S.; Hilton, B.; Farkouh, R.; Wasserman, M. Ten year public health impact of 13-valent pneumococcal conjugate vaccination in infants: A modelling analysis. Vaccine 2020, 38, 7138–7145. [Google Scholar] [CrossRef]
- Harboe, Z.B.; Dalby, T.; Weinberger, D.M.; Benfield, T.; Molbak, K.; Slotved, H.C.; Suppli, C.H.; Konradsen, H.B.; Valentiner-Branth, P. Impact of 13-valent pneumococcal conjugate vaccination in invasive pneumococcal disease incidence and mortality. Clin. Infect. Dis. 2014, 59, 1066–1073. [Google Scholar] [CrossRef]
- van der Linden, M.; Falkenhorst, G.; Perniciaro, S.; Imohl, M. Effects of Infant Pneumococcal Conjugate Vaccination on Serotype Distribution in Invasive Pneumococcal Disease among Children and Adults in Germany. PLoS ONE 2015, 10, e0131494. [Google Scholar] [CrossRef]
- Wilson, M.R.; McDade, C.L.; Perdrizet, J.E.; Mignon, A.; Farkouh, R.A.; Wasserman, M.D. Validation of a Novel Forecasting Method for Estimating the Impact of Switching Pneumococcal Conjugate Programs: Evidence from Belgium. Infect. Dis. Ther. 2021, 10, 1765–1778. [Google Scholar] [CrossRef] [PubMed]
- Zhou, Z.; Deceuninck, G.; Lefebvre, B.; De Wals, P. Forecasting Trends in Invasive Pneumococcal Disease among Elderly Adults in Quebec. Can. J. Infect. Dis. Med. Microbiol. 2017, 2017, 4347206. [Google Scholar] [CrossRef] [PubMed]
- Weinberger, D.M.; Harboe, Z.B.; Flasche, S.; Scott, J.A.; Lipsitch, M. Prediction of serotypes causing invasive pneumococcal disease in unvaccinated and vaccinated populations. Epidemiology 2011, 22, 199–207. [Google Scholar] [CrossRef] [PubMed]
- Wantuch, P.L.; Avci, F.Y. Current status and future directions of invasive pneumococcal diseases and prophylactic approaches to control them. Hum. Vaccines Immunother. 2018, 14, 2303–2309. [Google Scholar] [CrossRef] [PubMed]
- Savulescu, C.; Krizova, P.; Valentiner-Branth, P.; Ladhani, S.; Rinta-Kokko, H.; Levy, C.; Mereckiene, J.; Knol, M.; Winje, B.A.; Ciruela, P.; et al. Effectiveness of 10 and 13-valent pneumococcal conjugate vaccines against invasive pneumococcal disease in European children: SpIDnet observational multicentre study. Vaccine 2022, 40, 3963–3974. [Google Scholar] [CrossRef]
- Sprenger, R.; Hackl, D.; Kossack, N.; Schiffner-Rohe, J.; Wohlleben, J.; von Eiff, C. Pneumococcal vaccination rates in immunocompromised patients in Germany: A retrospective cohort study to assess sequential vaccination rates and changes over time. PLoS ONE 2022, 17, e0265433. [Google Scholar] [CrossRef] [PubMed]
- Braeter, U.; Schulz, M.; Goffrier, B.; Schulz, M.; Ihle, P.; Bätzing-Feigenbaum, J. Pneumokokkenimpfung bei GKV-Versicherten im Altersbereich 60 bis 64 Jahre. Regionalisierte Analyse zur Umsetzung der Empfehlungen der Ständigen Impfkommission Anhand Bundesweiter Vertragsärztlicher Abrechnungsdaten. 2016. Available online: https://www.versorgungsatlas.de/fileadmin/ziva_docs/74/VA-74_Bericht_Pneumokokkenimpfung_V4.pdf (accessed on 1 January 2024).
- Essink, B.; Sabharwal, C.; Cannon, K.; Frenck, R.; Lal, H.; Xu, X.; Sundaraiyer, V.; Peng, Y.; Moyer, L.; Pride, M.W.; et al. Pivotal Phase 3 Randomized Clinical Trial of the Safety, Tolerability, and Immunogenicity of 20-Valent Pneumococcal Conjugate Vaccine in Adults Aged ≥18 Years. Clin. Infect. Dis. 2022, 75, 390–398. [Google Scholar] [CrossRef] [PubMed]
- Two New Pneumococcal Vaccines-Prevnar 20 and Vaxneuvance. JAMA 2021, 326, 2521–2522. [CrossRef]
- Meroc, E.; Fletcher, M.A.; Hanquet, G.; Slack, M.P.E.; Baay, M.; Hayford, K.; Gessner, B.D.; Grant, L.R. Systematic Literature Review of the Epidemiological Characteristics of Pneumococcal Disease Caused by the Additional Serotypes Covered by the 20-Valent Pneumococcal Conjugate Vaccine. Microorganisms 2023, 11, 1816. [Google Scholar] [CrossRef]
- Kirubarajan, A.; Lynch, M.; Nasreen, S.; Gebretekle, G.B.; Fadel, S.A.; Crowcroft, N.S.; Allin, S. Increasing pneumococcal vaccine uptake in older adults: A scoping review of interventions in high-income countries. BMC Geriatr. 2023, 23, 2. [Google Scholar] [CrossRef]


Disclaimer/Publisher’s Note: The statements, opinions and data contained in all publications are solely those of the individual author(s) and contributor(s) and not of MDPI and/or the editor(s). MDPI and/or the editor(s) disclaim responsibility for any injury to people or property resulting from any ideas, methods, instructions or products referred to in the content. |
© 2024 by the authors. Licensee MDPI, Basel, Switzerland. This article is an open access article distributed under the terms and conditions of the Creative Commons Attribution (CC BY) license (https://creativecommons.org/licenses/by/4.0/).