1. Introduction
Mega sports events bring together the world’s top athletes to compete in international competitions and represent their countries at the highest level of sports. Examples of such events include the Olympic Games and the FIFA World Cup (FWC). These events receive significant media coverage and can bring economic benefits and enhance the host country’s global profile [
1]. However, hosting a mega-sport is a challenging undertaking that requires significant planning, resources, and investment [
2]. The success of these events is often determined by the number of fans who attend and their satisfaction level [
3]. Therefore, accurately predicting the number of fans expected to attend from each country is crucial for the host nation. This can help optimize the planning process and ensure a positive experience for both fans and players.
Over the years, attendance at FWC tournaments has steadily increased. In this regard, from 1930 to 1950, average FWC attendance ranged from fewer than 10,000 to around 25,000 [
4]. By the 1970s and 1980s, average attendance had increased from around 40,000 to 50,000 and reached an all-time high of almost 60,000 in the 1990s and early 2000s [
4]. Overall, total attendance has grown dramatically, from under 500,000 in 1930 to over 2 million at the World Cup held in Russia in 2018 and Qatar in 2022. The rising number of spectators is due in large part to the growth of the global economy and the rise of the middle class in many countries, making it affordable for more people to attend these events [
5]. Additionally, improvements in transportation and communication technology have made it easier for people to travel and follow their teams [
5]. Despite the COVID-19 pandemic fears, the 2022 World Cup in Qatar saw a relatively high attendance, with 3,404,252 fans [
6].
Ref. [
7] highlights that planning an FWC event usually involves identifying a suitable location and facilities to host the event, securing funding and managing the budget, coordinating transportation, housing, and other logistics for athletes, officials, and fans, and ensuring the safety and security of all participants and attendees. For example, the planning process for the 2018 FWC in Russia first took into consideration the expected numbers of fans from different countries [
8]. The Russian government then collaborated with local and international transportation providers to ensure that fans from all over the world could easily and safely travel to and from the tournament venues.
Additionally, Russia secured enough hotel rooms and other types of accommodations to host all fans [
8]. Furthermore, the local organizing committee provided fans with multilingual support and information to assist them in navigating the tournament and the host city. They also made certain that a wide range of food and beverage options were available to meet the diverse dietary needs and preferences of fans from different cultures [
8]. Overall, the 2018 FWC provided a positive and memorable experience for all participants and attendees, regardless of their cultural backgrounds [
9]. This is attributable to good planning for the expected number of fans from all over the world. However, there is still room for improvement in fan prediction models, which is what this study aims to address.
In recent years, the significance of big data and predictive analytics has soared [
10]. Organizations now handle vast volumes of data due to the proliferation of digital devices and the increased availability of big data. Predictive analytics, a subset of data analytics, involves using historical data, machine learning algorithms, and statistical models to predict future events or outcomes [
11]. Widely applied across industries, predictive analytics drives data-driven decision-making to improve business outcomes [
11]. By employing prediction models, organizations effectively utilize predictive analytics to inform their decisions.
On the other hand, prediction models use historical data to forecast events. Trained on historical data comprising inputs and outputs, these models generate predictions based on new inputs [
12]. They aim to estimate outcomes based on inputs, enabling accurate predictions to guide decision-making and anticipate future trends [
12]. Designed using various statistical techniques and tools, the accuracy of prediction models relies on data quality, availability, choice of model, and validation methods [
13]. Thus, prediction models are valuable for enhancing decision-making and anticipating trends.
To achieve the expected economic benefits, nations that host mega sports events strive to maximize fan attendance and their level of satisfaction [
14]. However, predicting fan attendance at these events is a complex task due to various factors that can impact the number of attendees. Specifically, for the FWC, fan attendance can be influenced by factors such as team qualification, football popularity in the host nation, event location, and travel and accommodation costs, to quote just a few.
Accurate prediction of fan attendance is crucial for optimizing FWC planning and resource utilization. Understanding these factors allows organizers to enhance the overall fan experience and maximize the event’s impact. This study utilizes various prediction models to develop the optimal fan attendance prediction model, including linear regression, logistic regression, decision trees, random forests, gradient boosting, and neural networks [
15]. The choice of prediction model depends on the data type and prediction goals [
15]. Some models are suitable for linear relationships, while others handle non-linear relationships or data with many variables [
16].
Recent advancements in predictive analytics and data science have significantly impacted the development of models that forecast fan attendance at mega sporting events [
17,
18]. The integration of various innovative methodologies and technologies is pushing the boundaries of existing research, offering new insights and approaches, as follows.
Advanced machine learning and AI applications: The application of cutting-edge machine learning and AI technologies has marked a significant shift in predictive analytics. These technologies facilitate nuanced analysis and forecasting, offering a more dynamic understanding of fan behavior [
19].
Exploitation of big data: The exponential growth in data generation and the strategic utilization of big data analytics have enabled researchers to harness diverse datasets, providing a multifaceted view of fan engagement and preferences [
20].
Adoption of real-time data analytics: Leveraging real-time data has become crucial for timely and relevant insights, enabling stakeholders to make informed decisions rapidly as event dynamics unfold [
21].
Focus on personalization and fan engagement: Emphasizing personalization, researchers are exploring how targeted strategies can enhance fan experiences, thereby potentially increasing attendance and satisfaction [
22].
Comprehensive economic and social impact assessments: The economic and social ramifications of mega sports events are being examined in greater detail, providing a holistic view of their impact and informing better planning and execution strategies [
23].
Sustainability and ethical frameworks: The integration of sustainability and ethics into predictive analytics underscores the field’s progression toward responsible and conscientious research practices [
24].
Interdisciplinary research approaches: The convergence of various fields, including economics, psychology, and data science, is enriching the research landscape, fostering a deeper and more comprehensive understanding of fan attendance dynamics [
25].
In recent research, the importance of integrating domain knowledge in machine learning applications for sports predictions has been emphasized, particularly in soccer [
26]. One study highlights the nuanced ways domain expertise can enhance the predictive accuracy of machine learning models and tailoring algorithms to better understand and anticipate the outcomes of soccer matches. Furthermore, ref. [
27] provide an innovative perspective by analyzing a soccer team’s adaptive behaviors through an entropy-based framework. This approach offers a deeper insight into the dynamics and variability of team performance, suggesting that a team’s ability to adapt and vary its strategies is crucial for success. These findings underscore the potential of combining advanced data analysis techniques with expert insights to refine predictive models in sports analytics.
1.1. Paper’s Objective
Specifically, the primary objective of this study is to introduce a novel application for machine learning, enabling accurate predictions of fan attendance at the FIFA World Cup. The machine learning model takes into consideration a wide range of factors that can significantly influence the number of fans attending the tournament. By leveraging data from the FIFA World Cup Russia 2018, this model is constructed to forecast the expected fan attendance at the FIFA World Cup Qatar 2022. The overarching aim of this research is to provide a valuable tool that future FWC hosts can utilize to optimize their planning, ultimately enhancing the overall fan experience.
The study uses automated machine learning (AutoML) to experiment with different models and validate the results. AutoML is a method of automating the machine learning model selection and hyperparameter tuning process, making it easier and faster for non-experts to develop predictive models [
28]. With AutoML, the system can automatically search for the best combination of algorithms and parameters to use based on the data being analyzed and the goals of the prediction model [
28]. This helps in reducing the time and effort required to develop a predictive model, as well as improving its accuracy [
29]. However, we are aware that AutoML is not a silver bullet and still requires careful data preparation, feature engineering, and validation to ensure that the results are reliable and accurate.
This study aims to advance sports event management by developing a comprehensive and accurate prediction model for fan attendance that is not limited to the FIFA World Cup, but can be applied to other major sporting events as well. By providing future hosts with a valuable tool, this research enables them to optimize planning, allocate resources efficiently, and ultimately enhance the fan experience. The findings will contribute to the development of best practices for predicting fan attendance at mega sports events, benefiting both researchers and practitioners in the fields of sports event management and fan behavior.
1.2. Paper’s Organization
The remainder of the paper is organized as follows. In
Section 2, we present the methodology and data used for this study. In
Section 3, we present the findings of the study and discuss the implications. In
Section 4, we present the limitations of the study and the work that needs to be done. Finally, in
Section 5, we conclude the paper and summarize the key findings.
2. Materials and Methods
During the FIFA World Cup qualification process, the 211 member associations of FIFA compete for a spot in the tournament. The FIFA World Cup spots are allocated to the six confederations in the following manner: AFC (Asia: four or five), CAF (Africa: five), CONCACAF (North, Central America, and the Caribbean: three or four), CONMEBOL (South America: four or five), OFC (Oceania: zero or one), and thirteen for UEFA. Additionally, host nations currently qualify automatically for the World Cup. Our objective is to leverage machine learning techniques to accurately forecast the number of visitors from each country prior to the start of the qualifying matches. By utilizing the FIFA rankings of the participating teams and various socio-economic factors of the countries, we aim to provide the host nation with valuable insights that will assist in the efficient planning and execution of the tournament.
To accurately predict visitor counts for World Cup tournaments, access to historical data from previous events is crucial. Unfortunately, this information is not readily available to the public. Despite this challenge, we were able to obtain data for the 2018 Russia World Cup by contacting Russian delegates and for the 2022 Qatar World Cup by contacting the Qatar Supreme Committee. Although we attempted to gather data from other delegates for previous World Cups, we were unfortunately unable to do so. This shortage of data significantly limits our ability to construct a machine learning model that can be generalized to unseen data well. It is important to consider this limitation when evaluating the results of our study.
2.1. Overview
The study involved a thorough data collection approach from numerous sources, followed by data wrangling and feature engineering in order to create a machine learning model to estimate the number of visitors from each country at least one year before the tournament. We carried out experiments with Python Scikit Learn and chose the best-performing model with AutoML in order to build an ideal machine learning model.
To enhance a model’s resilience against overfitting, especially in scenarios where certain predictors wield substantial influence, a few measures were implemented. Firstly, employing a technique known as data splitting, the dataset is partitioned into distinct subsets for training, validation, and testing purposes. This segmentation ensures that the model is not assessed on data it has already encountered, thereby providing a more accurate evaluation of its generalizability. Secondly, following the utilization of cross-validation techniques, whereby the dataset is divided into multiple folds, the model is then trained on all but one fold and validated on the excluded fold, iteratively rotating through each partition. This iterative validation process aids in obtaining a more reliable assessment of the model’s performance while mitigating variance in performance estimation. Lastly, feature selection strategies play a pivotal role in curbing overfitting by identifying and retaining only the most pertinent predictors. By incorporating these methodologies, the robustness of a model against overfitting, particularly in scenarios with influential predictors, can be substantially fortified.
2.2. System Setup
We used a Dell Precision 7920 Tower Workstation with an Intel Xeon Gold 6244 16-core processor, 64 GB of RAM, and an NVIDIA Quadro RTX 5000 graphics card to carry out the tasks related to this article. To make sure that our work can be replicated on any hardware setup, we used Docker containers to run the AutoML pipeline and Jupyter notebooks for data manipulation.
2.3. Training Dataset
In order to effectively train and validate our machine learning model, we obtained various datasets pertaining to each country. These datasets included historical visitor count data from past World Cups, FIFA rankings of the participating teams, geographical information, and socio-economic data from the World Bank. By incorporating a diverse range of data sources, we aimed to build a robust and comprehensive model that accurately predicts the visitor count for future tournaments.
2.3.1. Historical Dataset
In order to train and validate our model, we collected historical data on past World Cups. However, the availability of these data are limited, and we were able to acquire information specifically only for the 2018 World Cup held in Russia. The dataset we obtained includes the country names and the corresponding visitor count for 75 countries for the 2018 World Cup as shown in
Table 1 below:
2.3.2. FIFA Rankings Dataset
Men’s national teams are ranked by their performance in games under the FIFA ranking system, which has been in place since 1992. The teams with the best records are given the highest rankings. These rankings are released internationally within predetermined windows. We obtained the team rankings prior to the commencement of the World Cup qualifiers in order to conduct our analysis. The World Cup was held on the following dates: 1994 (31 December 1992), 1998 (21 February 1996), 2002 (16 February 2000), 2006 (27 August 2003), 22 August 2007, 2014 (18 May 2011), 12 March 2015, and 2022 (4 April 2019). To collect the rankings information from the FIFA website, we utilized Python requests and the Pandas packages. The dataset contains data about team names, confederations, current and past points, and rankings. The dataset comprises 8 columns and 1544 rows.
2.3.3. Historical Performance Data
We used specialized sections that include details on the qualification procedure, match schedules, and outcomes to compile data on World Cup qualifiers. We used information from these pages, including the qualification date, the number of times a team has qualified in the past, the most recent qualification, the team’s current streak of consecutive appearances, and the team’s previous best results. In order to extract this information from the Wikipedia website, we used the Python Pandas and Beautiful Soup 4 tools. A dataset with 336 rows and 9 columns with information on World Cup qualifiers from 1978 to 2022 was created. Earlier World Cup data were utilized for feature engineering and to impute missing values.
2.3.4. Geographical Information Data
In order to incorporate geographical information into our model, we obtained a curated dataset from a CSV file provided as a gist file (Discover gists · github). This dataset includes various geographical attributes, such as the average latitude, average longitude, and ISO country codes of each country. The inclusion of this information allows us to take into account the geographical location of each country and its potential impact on visitor count. We will be using these data to generate meaningful features as shown below in
Table 2.
2.3.5. World Bank Data
We leveraged the World Bank’s Python package, wbgapi, to gather a range of socio-economic indicators that can potentially impact visitor count [
30]. These data were used to gain insight into the economic and social conditions of each country, including population, GDP, remittance, working population, employment percentage, employee percentage, tourism expenses, purchasing power parity, and unemployment percentage. We utilized the Python library wbgapi along with Pandas to access and organize this dataset from the year 2000 to 2022. Our goal was to consider a broad range of socio-economic factors that could affect visitor count and inform our machine learning model.
To achieve this, we initially analyzed 120 features from the World Bank data to determine their potential impact on visitor count. However, after further analysis of the percentage of missing values, some of these features were not deemed useful and were excluded from our study. Some of the features we considered had annual data, while others were only published every 5 years. Some of the features had low data, making them unsuitable for our analysis. Our selection of features was based on the information provided by the World Bank site (indicators). By incorporating these selected socio-economic indicators into our machine learning model, we aimed to provide a more comprehensive and accurate prediction of visitor count from each country.
2.4. Dataset Wrangling
Dataset wrangling, which entails cleaning, preparing, and organizing data so that it is ready for analysis and modeling, is a crucial phase in the data science process.
2.4.1. Dataset Cleaning
We carried out a number of data-cleaning activities to get the data ready for analysis. These procedures were created to make sure the data were reliable, consistent, and prepared for inclusion in our machine learning model. We performed several measures, one of which was to find and fix inconsistencies in the naming of country codes that existed in multiple datasets. Some datasets used ISO codes, while others used country name abbreviations. For instance, the country code for Germany was listed as GER in some datasets, while the ISO country code for Germany is DEU. We standardized the country codes by converting all country codes to the ISO format, which is widely accepted and recognized. This standardization process allowed us to seamlessly integrate the data from different sources and ensure that all data were consistent and accurate.
Removing hyperlink information and other non-numeric data from the Wikipedia dataset was another crucial step we took. In order to make the data consistent, several columns in this dataset that had hyperlinks had to be cleaned. To exclude this information and guarantee that numerical columns contained just numerical data, we used Pandas and regular expressions. In order to improve the quality of the World Bank dataset, we conducted an analysis of all columns to assess the percentage of missing data for each country. We found that many columns had a high number of missing values, which could potentially affect the accuracy of our results. Features with high missing values were removed.
2.4.2. Feature Engineering
The practice of adding new features to a dataset or changing already existing features is known as feature engineering. It is a crucial phase in the data science process because it has the potential to enhance the effectiveness of machine learning algorithms and assist in extracting useful information from the data.
Historical Dataset
We enhanced the historical dataset obtained from Russia in 2018 by adding the necessary information to perform data merging and analysis. To begin with, we added a column for ISO country codes using the python package pycountry to ensure consistent country identification across all datasets. Additionally, we added a year column, with 2018 as the value, to differentiate between the World Cup events. To prepare for predictions for the Qatar 2022 World Cup, we duplicated the country data and added it to the end of the dataset, with the “Visitor Count” column left empty for future predictions. This standardized format enabled us to effectively utilize the historical data and merge them with other relevant data sources for accurate predictions.
Geographical Dataset
A major factor that greatly impacts the number of visitors is the geographical distance between their home country and the host country. This affects various factors, such as travel mode, cost, and time of travel, as well as climate conditions. To capture these factors, various features were generated, such as travel costs, climate comparisons, visa restrictions, and the number of expatriates living in the host country. These expatriates could serve as potential sources of accommodation during the tournament, leading to reduced costs. However, obtaining data for these factors for all previous World Cup tournaments is a challenge due to limited availability.
To capture the geographical proximity, we introduced a new feature—the distance between the source country and the host country. This feature considers the impact of various factors like mode of travel, cost and time of travel, and climatic conditions. To calculate the distance, we used the Haversine formula, which measures the angular distance between two points on the surface of a sphere. The latitude and longitude coordinates of the source country (x1 and y1) and the host country (x2 and y2) were utilized to calculate the distance between them. This was done using the Haversine distance metric from the Scikit Learn Python package. The distance was then converted to kilometers for ease of interpretation. The Haversine formula provides a reliable approximation of the surface distance between two points on Earth, with an average error of less than 1%.
The latitude and longitude coordinates (
x1,
y1) of the source country
S and the host country
H, with coordinates (
x2,
y2), were utilized to calculate the distance
D(
S,
H) between them. This was achieved using the following Haversine distance metric:
The distance was then converted to kilometers for ease of interpretation. The Haversine formula provides a reliable approximation of the surface distance between two points on Earth, with an average error of less than 1%.
2.5. Dataset Merging
Through the use of the country code and the years as the key, we combined all the datasets into one. As a result, we were able to include significant information for each country from all datasets. To make our predictions as accurate as possible, we took into consideration the most recent available socio-economic data from the World Bank. Specifically, we used the data from the last year prior to the tournament year to reflect real-time conditions. For example, when predicting the visitor count for the 2022 World Cup, we used the data from 2021. In cases where data were not available for a specific year, we used the last available data. For instance, since there was no purchasing power parity (PPP) data for Venezuela after 2011, we used the same data for both the 2018 and 2022 World Cup predictions. This approach allowed us to incorporate the latest socio-economic information into our predictions.
We detected missing values that had been added as a result of the merging procedure and eliminated them. These missing values were present in recently established columns of historical performance data that had a value of 0 imputed to them. Missing values for the “Total Times Qualified” column were imputed using the most recent data or, in the absence of data, assigned a value of 0. The backfilling procedure contributed to the merged dataset’s accuracy and completeness.
2.6. Data Visualization
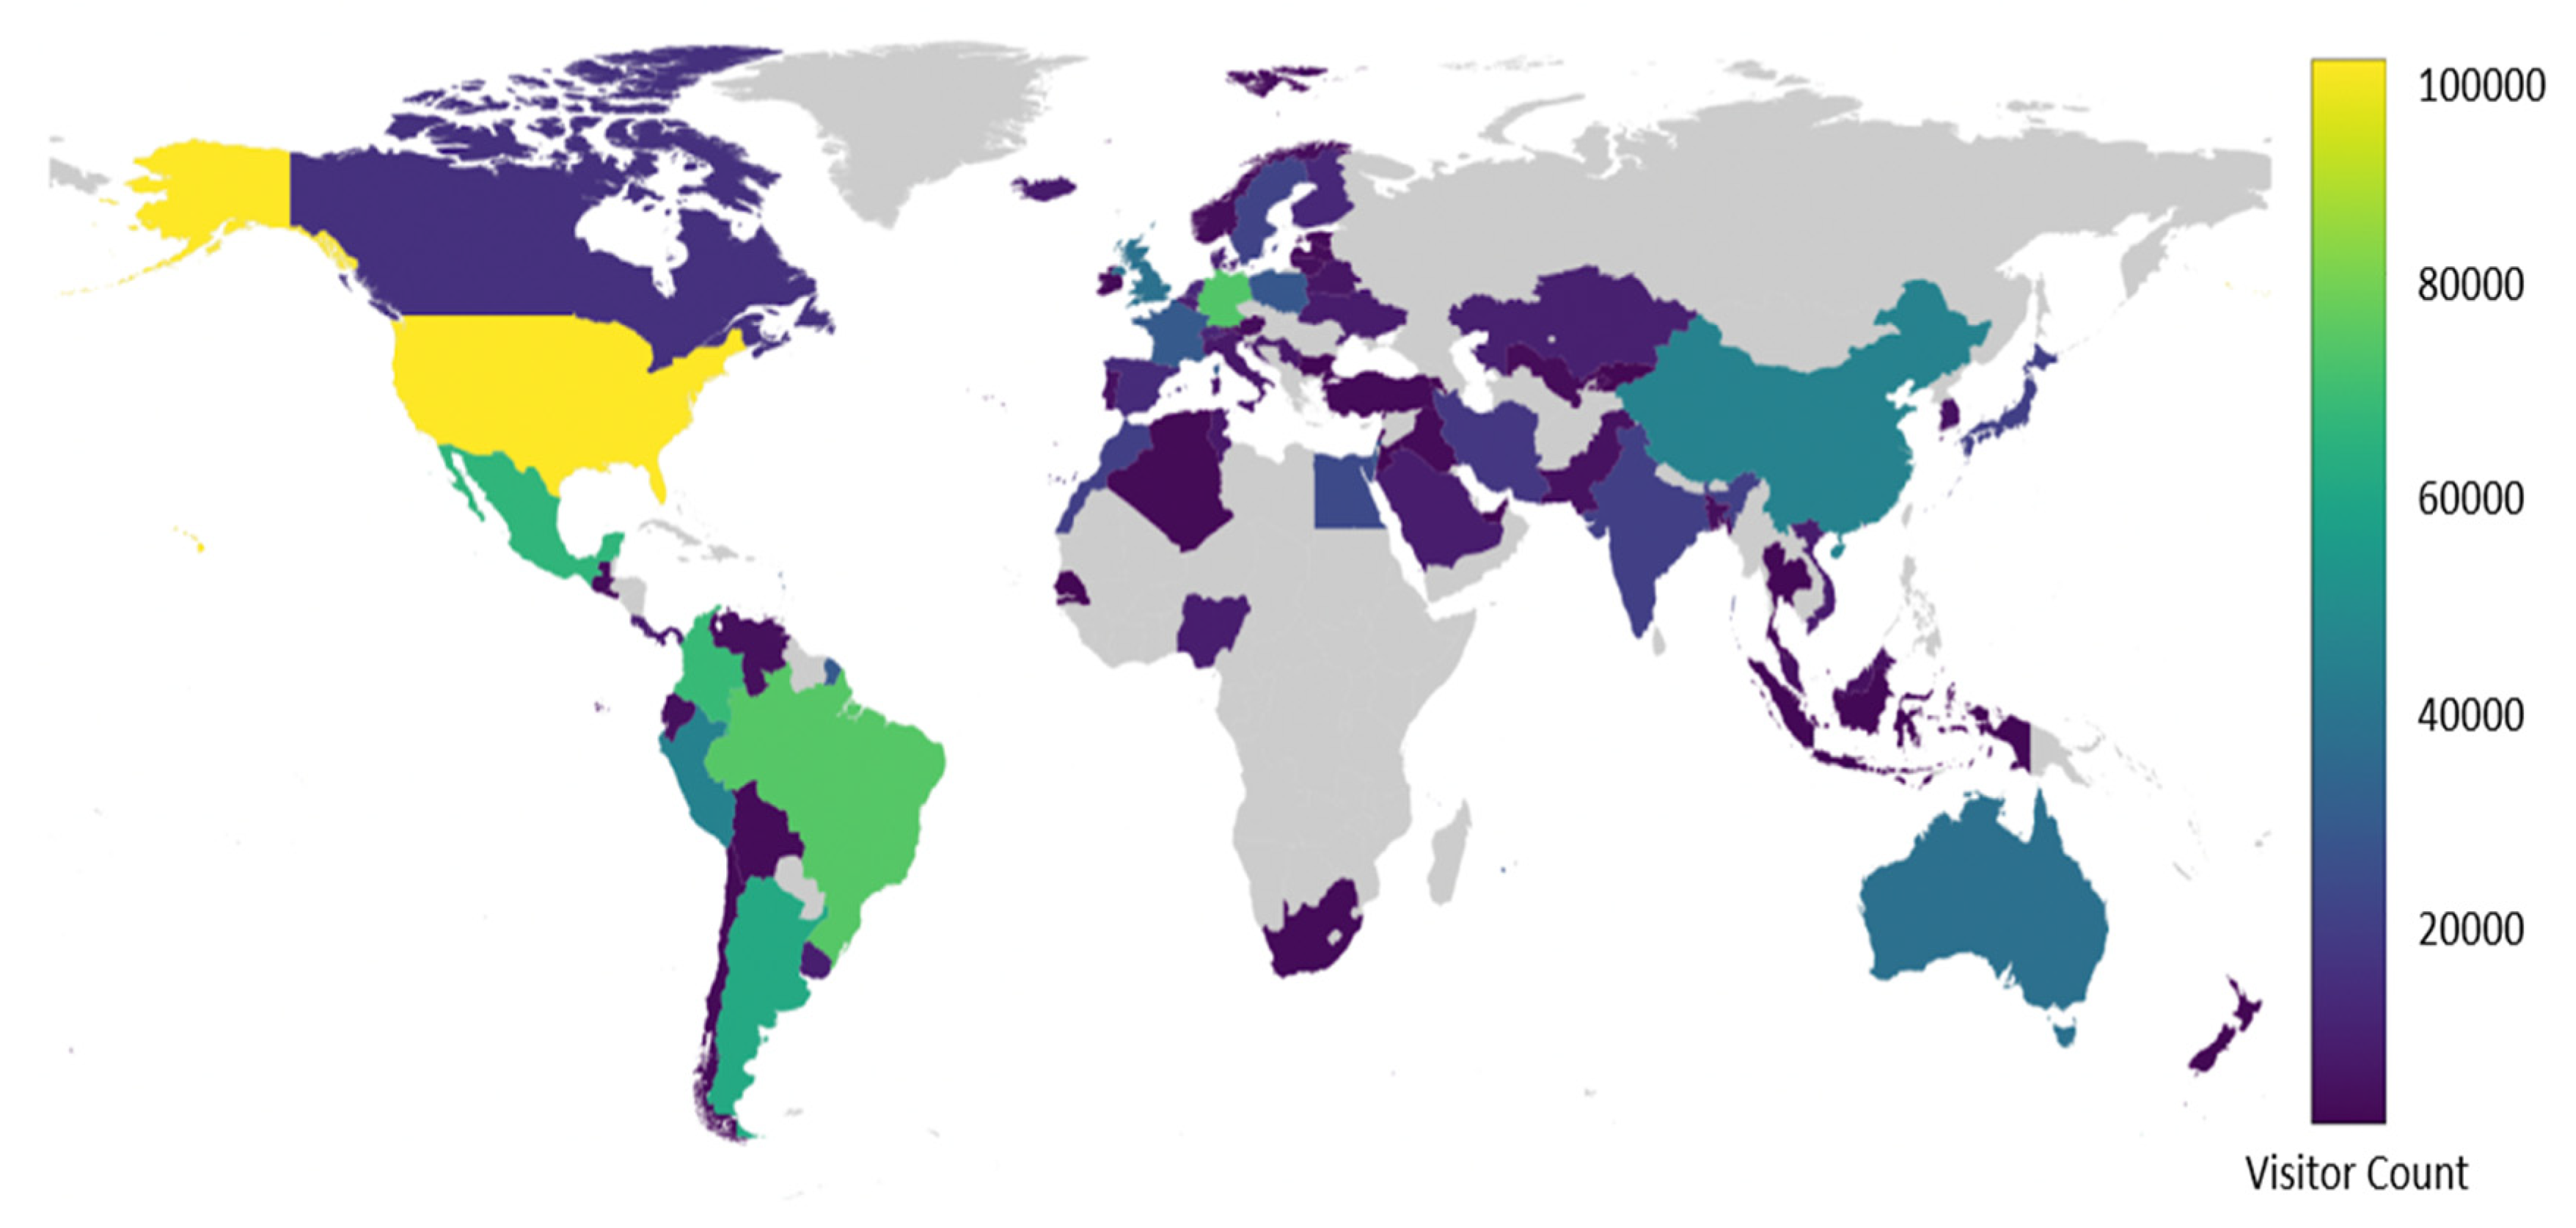
We utilized a variety of data visualization techniques to analyze and understand the data. Some of the key visualizations used in this study are as follows
Figure 1.
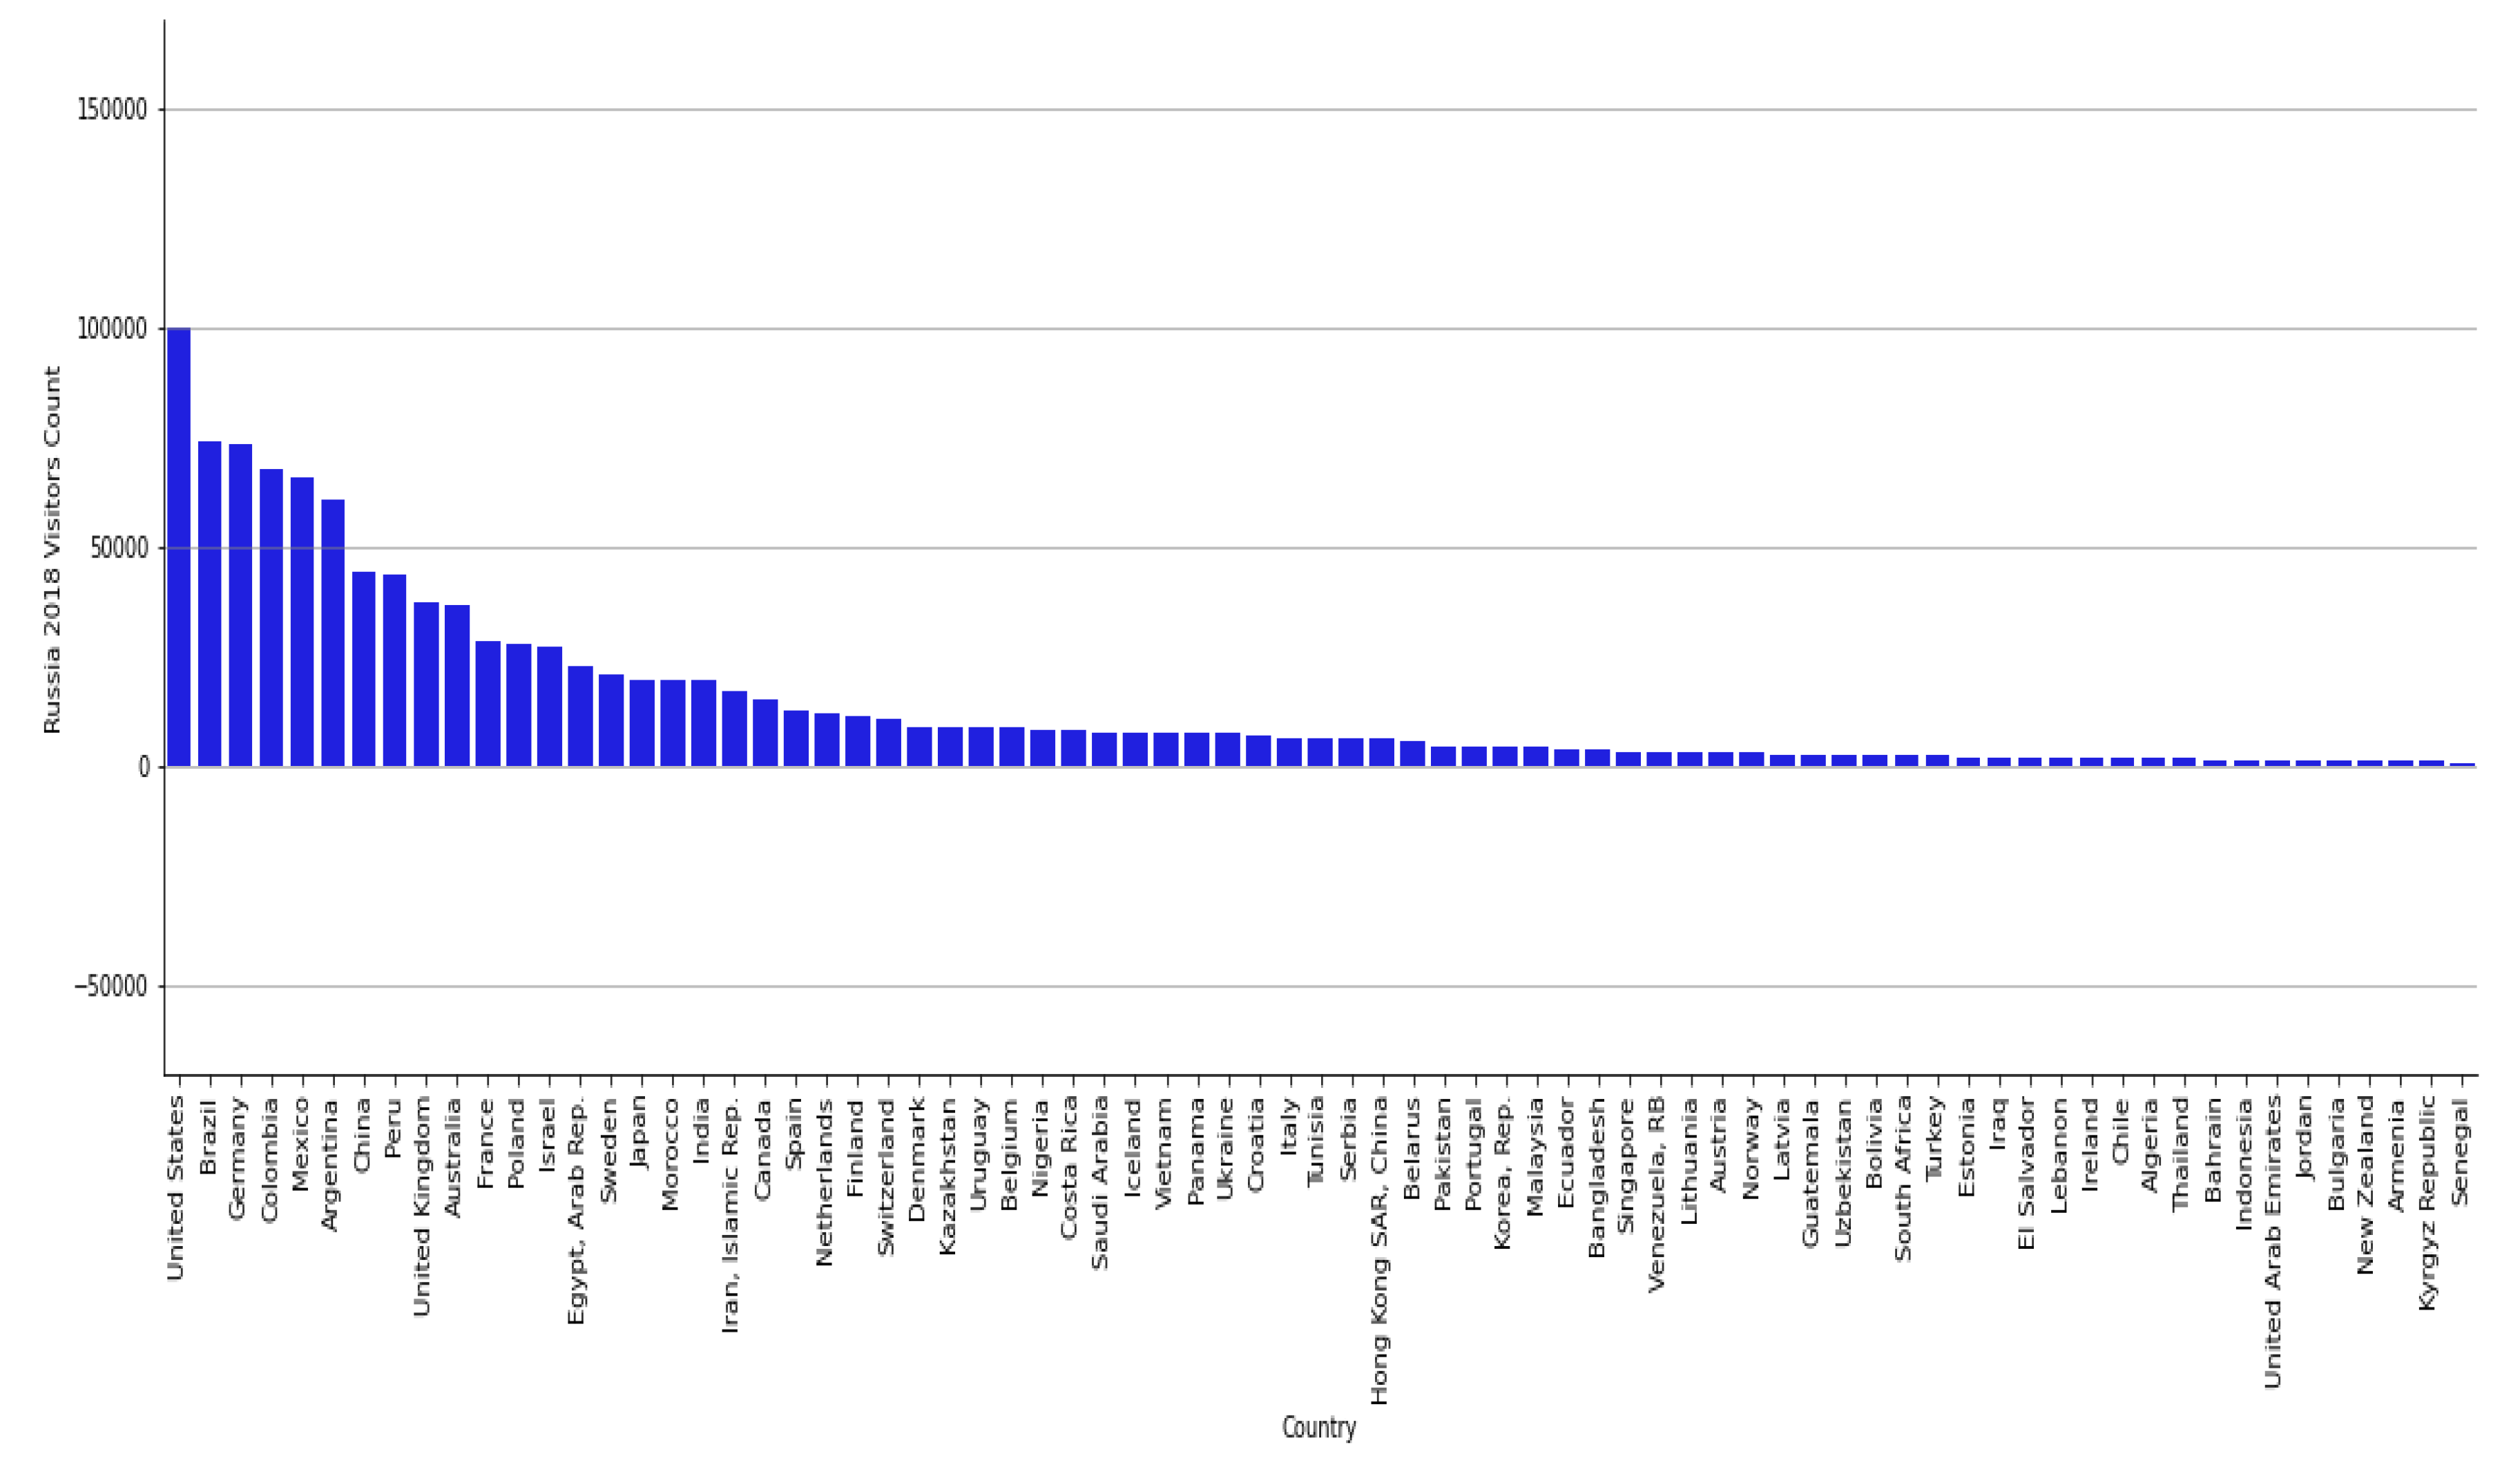
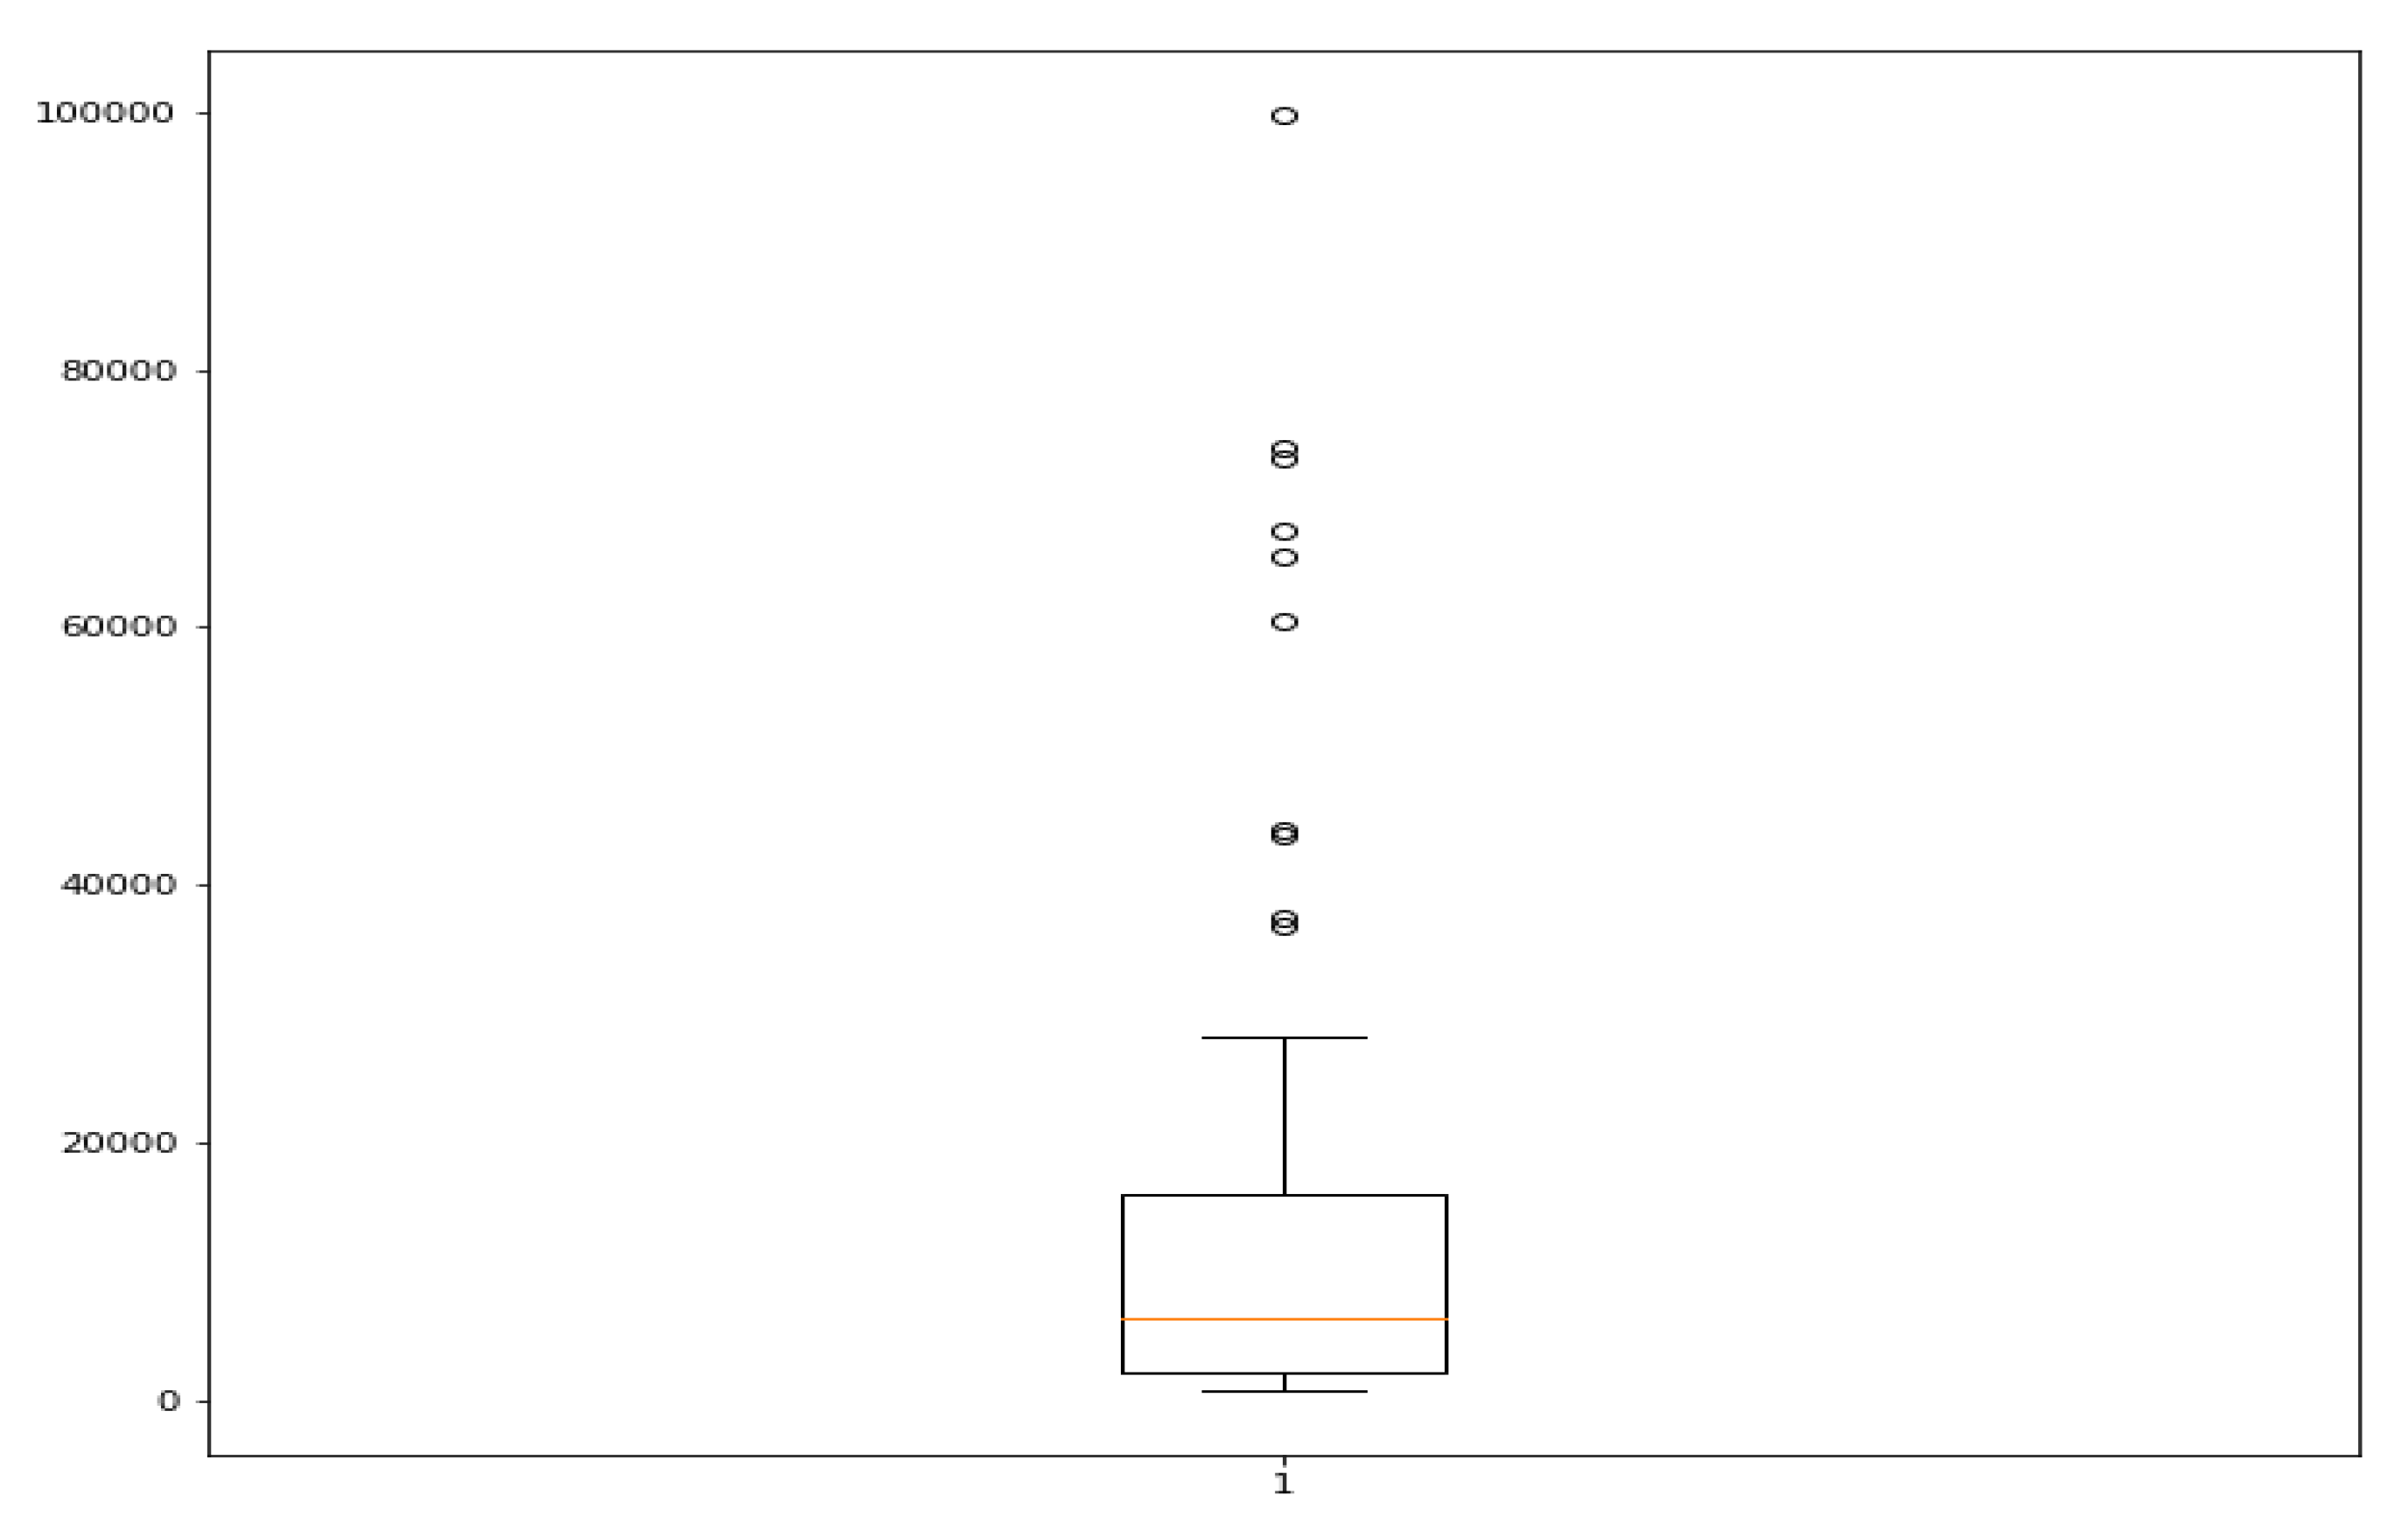
From
Figure 2 and
Figure 3, it can be observed that the data are highly skewed, with the top country (USA) having more visitors than the number of visitors from the bottom 35 countries combined. The mean number of visitors is 14,289, while the USA has 99,799 visitors.
The scatterplot in
Figure 4 reveals the relationship between the GDP per capita and the number of visitors per continent. This visualization was critical in gaining insight into how economic prosperity affects the number of visitors from different continents attending the World Cup. A noticeable cluster of four countries—Brazil, Colombia, Mexico, and Argentina—can be seen in the top left of the plot, highlighting that fans participate in the World Cup even from countries with poorer economies.
2.7. Validation Technique
To assess the performance of our machine learning models, it is ideal to use a holdout validation dataset. This involves training the model on historical data and evaluating its performance on a separate, unseen dataset. In order to evaluate the performance of our machine learning models, we will be using the Qatar 2022 data as a holdout validation dataset and training with the Russia 2018 dataset.
There are several validation techniques that are widely used in the industry. One of the most common techniques is the train–test split, where the dataset is split into two parts—the training set and the testing set. The training set is used to train the model and the testing set is used to evaluate its performance. There are two variations of this technique, one with shuffling of the data and one without shuffling. When the data are shuffled, the model is trained on a random subset of the data, and this helps in avoiding bias due to any patterns in the data. On the other hand, when the data are not shuffled, the model is trained on a contiguous subset of the data, which can help in understanding the model’s behavior over time.
Another popular validation technique is k-fold cross-validation, where the dataset is split into k-folds. The model is trained on k-1 folds and tested on the remaining folds. This process is repeated k times with different folds as the testing set, providing a more robust evaluation of the model’s performance. There are other validation techniques, such as leave-one-out cross-validation, stratified k-fold cross-validation, and more, each with its own strengths and weaknesses.
Using a 5-fold cross-validation technique, we assess the models while they are being trained. To do this, divide the training data into 5 equal folds, train the model on 4 of those folds, and then evaluate it on the 5th fold. Five repetitions of this process are carried out, with one of each fold serving as the evaluation set. By averaging the assessment scores across each of the five folds, we may obtain a more precise measure of the model’s performance (
Figure 5).
2.8. Evaluation Metric
The coefficient of determination, abbreviated R2, is the optimization metric that we will be using. This is the percentage of the dependent variable’s variance that is predicted by the independent variable(s). Based on the percentage of overall variation in outcomes that the model accounts for, it provides a gauge of how well-observed results are duplicated by the model. The maximum score is 1.0, which may be unfavorable. The coefficient of determination, which can be expressed as a percentage while the other measures have arbitrary ranges, can be more intuitively instructive than the MAE (mean absolute error), MSE (mean squared error), MSLE (mean squared log error), MedAE (median absolute error), and RMSE (root mean squared error) in the evaluation of regression analysis. However, we will also be considering other metrics such as MAE, MSE, MSLE, MedAE, and RMSE to get a more comprehensive understanding of the model’s performance.
2.9. Modeling
To develop outstanding features, we used an iterative experimentation process with a variety of machine learning models. Using the Python Scikit Learn module, we put this technique to use. We started by building simple models to understand which features the models were emphasizing and to examine their predictions. We used AutoML to fine-tune the parameters and increase model accuracy to create the final high-quality model. In our experimentations, we used the Scikit Learn algorithms with default parameters.
As shown in
Figure 3 the target column of the visitor count is highly skewed. This poses a challenge for regression algorithms to fit the data. To overcome this challenge and improve the model performance, we performed a log transformation on the target variable (visitor count) to normalize the data. The log transform of the target variable is a technique used to normalize skewed data. In this technique, the target variable is transformed by taking its logarithmic value. The log transform helps to reduce the impact of outliers and skewness in the data, making the dataset more suitable for regression algorithms. The log transform also helps to convert exponential growth into linear growth, making it easier for the model to understand and predict the target variable. This leads to improved model performance and more accurate predictions. After obtaining the predictions, we will perform an inverse log transformation to obtain the actual visitor count values. This is because the log transformation was applied to normalize the skewed data and improve the model performance, but the actual visitor count values should be in their original format for meaningful interpretation.
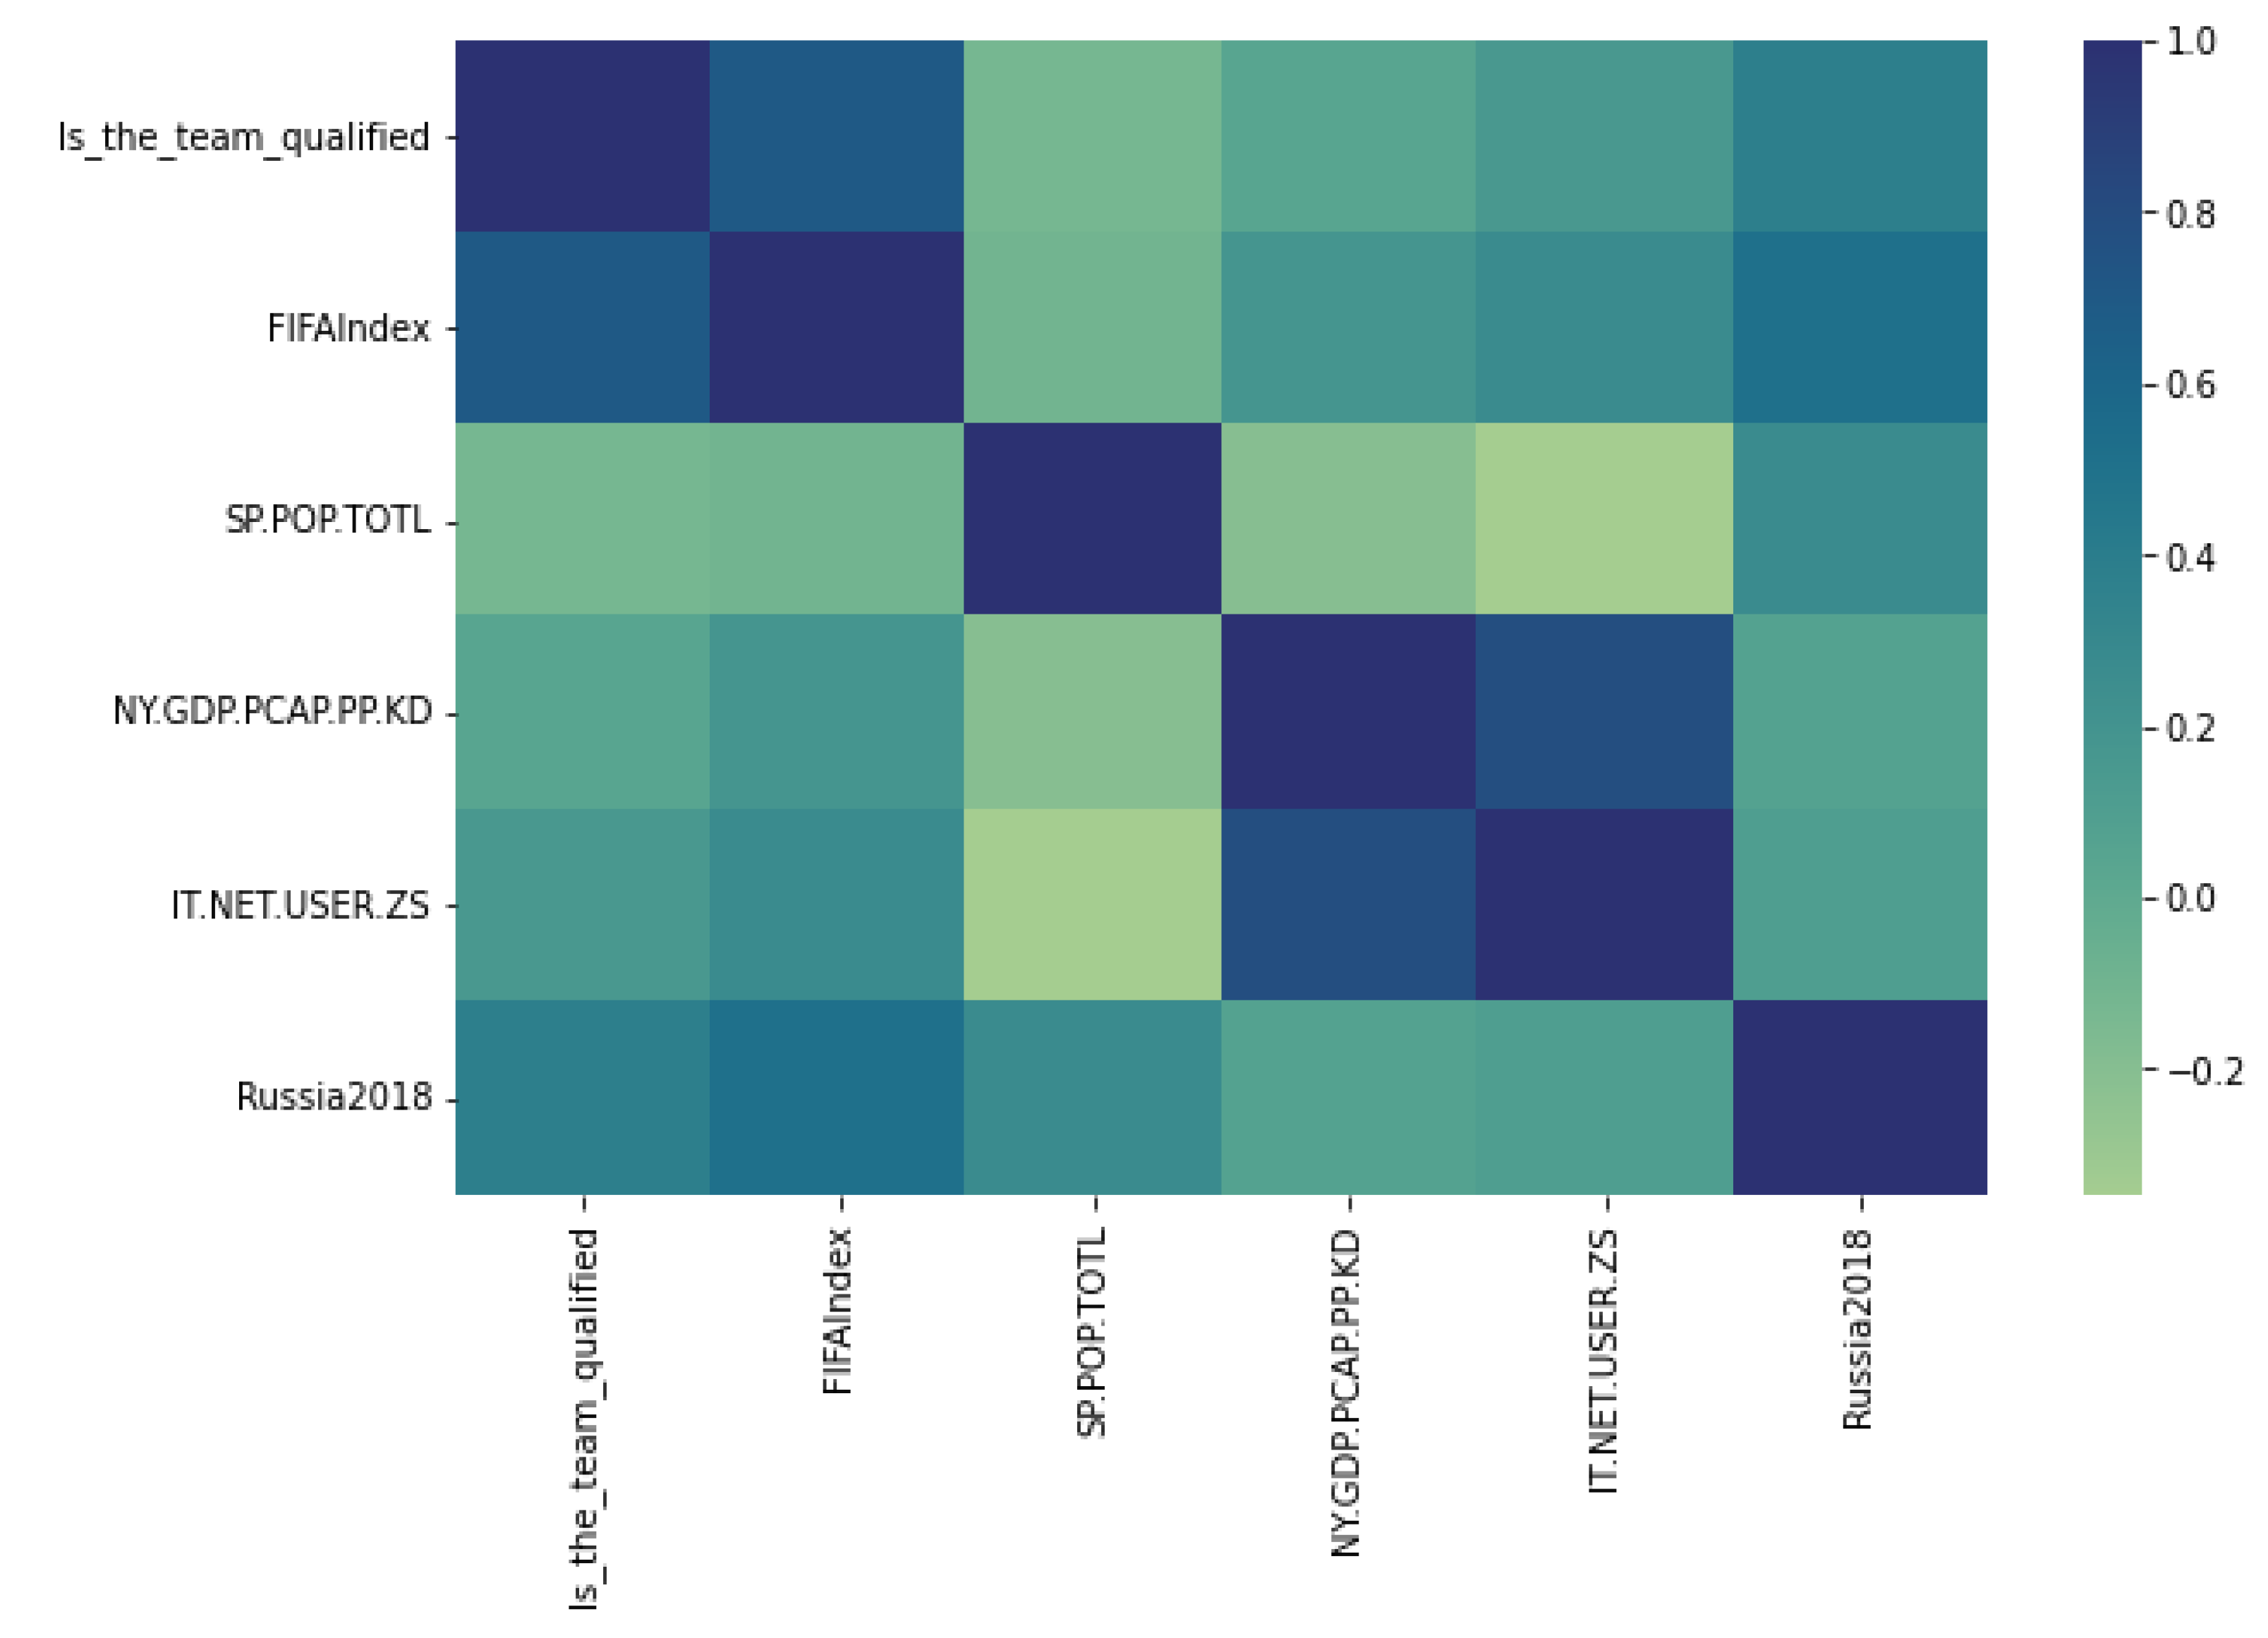
We experimented with four sets of features: a selected small set of columns, all columns, highly correlated columns, and important features selected by the models. This enabled us to evaluate how the algorithms are learning from a diverse set of features. We started our experiments with a small subset of features and eventually added more features for experimentation.
Figure 6,
Figure 7,
Figure 8 and
Figure 9 show the correlations for each dataset.
2.10. AutoML
The thesis model showcases several innovative aspects of automated machine learning (AutoML), highlighting its ability to simplify and accelerate the entire machine learning pipeline. Key strengths include the following.
End-to-end automation: AutoML automates key steps like data preprocessing, feature engineering, model training, and hyperparameter tuning, enabling faster development of robust models.
Enhanced data quality: Advanced algorithms address data issues like missing values, outliers, and scaling, ensuring data consistency and quality.
Sophisticated feature engineering: AutoML automates feature selection, reduction, and generation, leading to better prediction accuracy by extracting more meaningful insights from the data.
Optimized model selection and training: This evaluates various algorithms, finds the best fit for the data, compares them, and selects the optimal one for deployment, improving model accuracy and reliability.
Diverse optimization techniques: By employing different optimization strategies (like Bayesian optimization, genetic algorithms, and neural architecture search), AutoML demonstrates adaptability and precision in navigating the search space.
Small-dataset proficiency: The model emphasizes AutoML’s effectiveness in handling limited data, effectively finding suitable model and hyperparameter combinations while preventing overfitting, ensuring robustness and generalizability.
Accessibility and breadth: By integrating Auto-Sklearn, the model provides accessible APIs and supports a wide range of machine learning models, offering broader applicability.
Comprehensive model assessment: This includes diverse model types like linear models, KNNs, decision trees, ensemble methods, SVMs, and MLPs, facilitating adaptation to different data and tasks.
Innovative training techniques: Techniques like SGD training, ensemble methods, and multilayer perceptrons highlight the model’s innovative approach to learning, offering various strategies for improved prediction accuracy and reliability.
By combining these techniques, the thesis model significantly advances AutoML, establishing a robust platform that democratizes access to advanced machine learning capabilities and empowers better decision-making across various domains.
3. Results
We conducted several experiments with various configurations of our machine learning models to optimize performance. We explored different factors, such as the number of columns used, target column transformations, run time, and ensembling. We tested models using all columns, highly correlated columns, and important features selected by the models. We evaluated the impact of target column transformations, including log transformation, quantile transformation, and power transformation from the Scikit Learn preprocessing module. Our results showed that log transformation improved model performance the most. As we increased the run time for Auto-Sklearn, performance continued to improve. This could have been the result of hyperparameters being optimized for individual data points. Ensembling of models also improved the performance of the models. Based on our experiments, we selected the best-performing model for this study: an ensembled model trained on important columns with a log-transformed target column, run for 12 h.
The Auto-Sklearn experiment, which lasted for 12 h, evaluated 2523 models using a diverse range of algorithms and optimizing their hyperparameters. Specifically, we addressed the following key areas.
Data preprocessing techniques:
- •
- •
Preprocessing steps were meticulously executed as specified in
Section 2.4.2. These steps ensured that the data were suitably prepared for feeding into the AutoML optimization process.
- •
The AutoML process automatically applied additional preprocessing techniques, including feature scaling, during the optimization phase. Given the small size of the dataset, these preprocessing steps remained an integral part of the model pipeline and were not further explored.
Algorithms and hyperparameters evaluated:
- •
Our AutoML process, as outlined in
Section 2.10, systematically evaluated various algorithms and their corresponding hyperparameters.
- •
Notably, we did not define a custom range of hyperparameters. Instead, we utilized the default configurations provided by Auto Sklearn regressors.
Auto Sklearn configurations:
- •
We explored a variety of configurations, including:
Algorithms evaluated:
- •
Our evaluation encompassed the following algorithms:
The results of the experiment are analyzed and displayed in
Table 3, showcasing the top 10 models for each algorithm.
The ranking was based on the R2 metric, which is a commonly used measure of the goodness of fit in regression problems. The top-performing algorithm was stochastic gradient descent (SGD), which dominated the top 300 ranks with a slight improvement in the R2 metric. The best SGD model had an R2 metric of 0.633, while the 300th SGD model had an R2 metric of 0.578. This highlights the focus of Auto-Sklearn in optimizing the hyperparameters of the best-identified algorithm over a longer period of time.
Table 4 shows how the permutation feature importance calculation approach from Scikit Learn was used to determine the feature importance of the best-performing model. The feature significance score indicates the impact of each feature on the performance of the model. A higher score means that the feature in the study has a bigger impact on the model’s prediction result. We can acquire insight into the data, improve the model, and improve its interpretability by comprehending the significance of the feature.
The permutation feature importance in Scikit Learn provides a feature importance score that is a normalized sum of 1. This means that the relative importance of features derived from permutation is proportional and add up to a total of 1. Given that the relative value of each attribute is measured using the same scale, this can be helpful in situations where you want to compare their respective importance. It can be used to get a rough understanding of the relevance of features independently of the model being used because the feature importance is also calculated without relying on the specific model characteristics.
The contribution of each feature to the prediction generated by the stochastic gradient descent model is shown in
Table 4. In almost all studies, a significant amount of weight has consistently been placed on the “Is the team qualified?” element.
Table 4 explains the meaning of other features from the World Bank dataset.
We tested the robustness of the best-performing model by evaluating its performance on a holdout validation dataset. The results presented in
Table 5 showed that the model was not generalized well with the holdout dataset.
Additionally, we evaluated how the different validation mechanisms would have performed in evaluating the performance of the models. We experimented with different feature subsets, target column transformations, ensemble configurations, and validation mechanisms.
Table 6 and
Table 7 present some of the results from our experimentation.
4. Discussion
Using Auto-Sklearn, as shown in
Table 3, the best fivefold cross-validation score for top-performing algorithms revealed that the algorithm focused heavily on optimizing the hyperparameters of the stochastic gradient descent model with R
2 of 0.633 and MAE of 0.556. The model was tested with different validation techniques like train–test shuffled, train–test not shuffled, and fivefold and tenfold cross-validation in order to observe the best results. According to Yamashita et al. (2022), regardless of the size of the sports, the use of empirical prediction techniques leads to inaccurate results and therefore poor decisions by the organizers. We can confirm this statement when comparing the results against the results of King and Rice (2018), where they examined different prediction techniques and a best result MAE of 1219.
4.1. Reasons for Discrepancies
The deficiency in diverse examples available for learning directly impacts our models’ capacity to distinguish meaningful trends and generate reliable predictions. Despite our efforts to enrich the dataset with a diverse array of columns encompassing factors such as geographical distance, FIFA rankings, historical World Cup performances and other socio-geopolitical dynamics, the underlying training data pertain solely to the year 2018. Consequently, our models lack exposure to patterns spanning different years, thereby causing some difficulties in capturing the evolving behavioral trends. As a result, the scarcity of training data serves as a definitive explanation for the disparities observed in our predictions.
The comparison of predicted and actual visitor counts in the Qatar 2022 World Cup can be seen in
Figure 10.
Figure 11 and
Figure 12 reveal that Saudi Arabia and India had higher visitor counts than expected, while there was a significant reduction in visitors from top countries in the Russia 2018 World Cup. This could be attributed to factors such as distance, number of expatriates, visa restrictions, and other socio-geopolitical factors. These findings highlight the need for caution when making predictions based on limited data and suggest the importance of further study to better understand the factors that influence World Cup attendance. The section below discusses the possible causes of the difference between the predicted and actual attendance for Qatar 2022 World Cup.
4.1.1. COVID-19 Pandemic
It was observed that the actual fan attendance from East Asian countries such as China, Japan, and South Korea was lower than the prediction, and this may be attributed to the COVID-19 pandemic impact on these countries. This is more evident in China, where they had imposed travel restrictions on citizens to travel outside China until January 2023. In addition, COVID-19 caused some financial issues where individuals and employees were dismissed from their work, which affected their ability to travel for tourism and fun. The number of Chinese fans dropped by more than 30,000 when comparing Russia in 2018 and Qatar in 2022.
4.1.2. Unexpected Team Performance during the Tournament
Another factor that seems to have played a role in the difference between actual and predicted fan attendance is the unexpected performance of a team during the tournament. This can be observed in Morocco and Saudi Arabia fans’ attendance, whose teams performed very well, which encouraged many fans to travel and attend. Saudi Arabia won the first game against Argentina and later performed strongly against Poland and Mexico. Morocco performed well too, and eliminated Spain and Portugal during the knockout stages and later faced France in the semifinal. The number of chartered flights was organized by the Moroccan government to transport the fans willing to travel and support their team.
4.1.3. Culture and Traditions
As Qatar was the first Middle Eastern and Arab country to host such an event, there will be some factors that could be different from any other tournament. In the case of the Qatar 2022 World Cup, it was observed that some Arab countries contributed more to fan attendance than the model predicted. This is evident in the cases of Morocco, Egypt, Bahrain, UAE, Lebanon, Jordan, and Saudi Arabia. Therefore, factors such as tradition and cultural similarity might play a big role in attracting fans from different countries having similar traditions and cultures.
4.1.4. Number of Residents in the Host Country
The FIFA World Cup in Qatar showed an important factor that could affect the tendency of fans to come to the host country. Qatar has a large number of different communities that make up more than 80 percent of the total population. The impact of this factor can be seen by observing the number of fans who attended the FWC 22 from countries such as India, Pakistan, and Egypt. Indian fans numbered 90,000 more than in Russia in 2018, which might be due to the fact that Indian residents are present in large numbers in Qatar.
4.1.5. Political and Negative Media Coverage
As with any other major sporting event, political controversies and negative media coverage can impact the attendance of fans from certain countries. At the 2022 FIFA World Cup in Qatar, factors unrelated to sports led to lower attendance from countries such as Germany and the Netherlands compared to the 2018 tournament in Russia. These factors are challenging to predict, as the relationships between countries and the media are volatile and can change rapidly. For example, more than 60,000 German fans attended the 2018 FIFA World Cup, but did not attend the Qatar 2022 tournament.
Global uncertainties undeniably affect the accuracy of prediction models. However, those using the approach presented in this paper can take measures to mitigate these uncertainties. For example, political conflict uncertainty can be mitigated by adjusting restrictions and incorporating additional input data, such as the nature of the conflict and travel bans. Training the model requires similar situations from previous tournaments to ensure accurate results. Additionally, postprocessing can involve expert judgment to determine reduction factors for model results.
Regarding pandemic situations, the model can incorporate factors like the number of vaccinated individuals, travel restrictions, and financial impacts. However, requiring similar situations to be included in the training data is crucial for accurate results.
While this paper does not incorporate these mitigation strategies, it is noteworthy that the model is primarily intended for use in the early planning stages, where pandemic regulations and political changes occur rapidly and unexpectedly.
The outcome of our feature importance analysis, which is shown in
Table 4, indicates that the model heavily relies on a team’s qualification status as a predictor of World Cup attendance. This is a reasonable observation, as fans of qualified teams are more likely to be incentivized to attend the event. However, observations from our holdout data also highlight that other factors such as the distance of the host country, the number of expatriates, and socio-geopolitical factors also play a role in determining visitor counts. To gain a deeper understanding of these factors, more historical data would be necessary. Additionally, the analysis shows that the model places significant importance on socio-economic factors such as employment rate, population size, and mobile phone usage. These factors demonstrate the impact of modern technology and economic stability on travel patterns from different countries.
The validation techniques utilized in our analysis demonstrate that cross-validation, particularly fivefold validation, is an effective method in ensuring stable and reliable results in both training and holdout sets. The transformation of the target column played a crucial role in stabilizing the results, as the holdout set often possesses a different data distribution from the training set. On the other hand, using a traditional train–test split has proven to be unreliable, as the results are heavily dependent on the presence of skewed data in the test or holdout set. The use of k-fold cross-validation mitigates this issue by distributing the data evenly across all iterations. A tenfold cross-validation, however, was found to be slightly less reliable than fivefold, as the validation set size in each iteration was too small.
Incorporating real-time data up to the event starting date could potentially improve the model’s results, particularly as team qualification status was the most significant predictor. Access to this real-time information might enhance the model’s accuracy and its output.
4.2. Limitations
It is crucial to recognize the limitations of our model in order to fully comprehend its capabilities and limitations. Our approach has several restrictions that must be taken into consideration. Firstly, our dataset consists only of data from a single year, which limits our ability to generalize the model for future World Cup events. As the patterns that influence fans’ travel can vary greatly from year to year, it is imperative that a model trained on data from multiple World Cup events is used to truly understand the factors that drive attendance. The feature importance analysis shows that the model heavily relies on socio-economic factors rather than historical performance or distance of travel, which could only be confirmed if the model were trained on data from different World Cups. Additionally, our data are highly skewed, which could mean that the model optimizes for reducing errors in countries with high attendance, rather than generalizing. This issue could be mitigated by incorporating more data from different tournaments. Lastly, it is important to keep in mind that the World Cup is a unique event, and each host country may have its own set of factors that influence the rate of travel. For instance, a European country hosting the event will have different influencing factors from a Middle Eastern country hosting the event. With the expansion of the World Cup to 48 participating countries in 2026, these intricacies must be taken into consideration when making decisions based on the model’s output.
While the applicability of this model is currently limited, its methodology can be adapted for future tournaments and further data collection efforts. This adaptation will enhance the accuracy and usability of the model. We hope that this research will inspire additional studies on the use of machine learning in predicting visitor counts for major sports events. Importantly, the model’s versatility extends beyond the FIFA World Cup: it can be applied to various sports events such as continental nations cups and the UEFA Champions League, and with minor adjustments, the model can be used for other team sports like basketball, cricket, or volleyball. However, predicting individual sports outcomes remains challenging. Factors such as qualified players and the presence of a fan base in each country significantly impact attendance. Consequently, individual sports events tend to attract primarily citizens and residents of the host country.
5. Conclusions
This paper aimed to enhance the planning of mega sports events by accurately predicting fan attendance from each country. Leveraging attendance data from the 2018 FIFA World Cup in Russia, this research identified several key factors that contributed to the prediction of fan attendance at the 2022 FIFA World Cup in Qatar, utilizing a range of models. Among the models tested, stochastic gradient descent (SGD) emerged as the most suitable, achieving an R2 value of 0.633. However, it is important to note that the predicted attendance exhibited a discrepancy with the actual attendance, with an R2 value of 0.259. This discrepancy can be attributed to the limited availability of sufficient data. To achieve higher accuracy in attendance prediction, it is essential to incorporate data from a more diverse range of tournaments. By doing so, the models can capture the nuances and dynamics of different sporting events and fan behaviors, leading to improved predictive performance.
Furthermore, it is crucial to acknowledge that factors beyond the scope of sports can significantly impact attendance at mega events. Political disputes, pandemics, cultural and racial factors, as well as global acceptance or resistance to the event, all play a role in shaping attendance patterns. To enhance prediction accuracy, it is recommended that further research be conducted to explore the influence of these non-sports-related factors on attendance at mega events. By considering a more comprehensive range of variables, future models can provide more nuanced and robust predictions, contributing to better planning and decision-making for host countries. In summary, this study highlights the potential of machine learning in predicting fan attendance at mega sports events. While the stochastic gradient descent model demonstrated promise, the research underscores the need for more extensive data inputs and the inclusion of non-sports-related factors to achieve higher accuracy in attendance prediction. These efforts are encouraged for host countries, as accurate estimation of potential visitors is essential for effective planning, resource allocation, and ensuring a successful and enjoyable experience for fans and players alike.


