Abstract
Finding reliable and robust criteria for the detection of broken bars in induction motors is key for the maintenance of industrial engines, and some of the most efficient methods analyze the stator start-up current. Due to the transitory characteristics and short duration of the signal, suitable time-frequency mathematical tools are very useful for this purpose. We propose here algorithms based on the discrete wavelet and wavelet packet transform, combined with other tools in signal processing, to offer an accurate quantitative method for failure detection due to broken bars in induction motors. A good selection of the wavelet family is important for a good performance of the indicator, and the discrete approximation of the Meyer wavelet, ‘dmeyer’, consistently demonstrates the most favorable results. Our findings highlight the effectiveness of both the wavelet and wavelet packet transforms in accurately detecting broken bars in induction motors. This fact allows optimal monitoring strategies in industrial applications.
Keywords:
wavelet transform; wavelet packet transform; faults detection; electrical machine; broken bars MSC:
42C40; 47N70; 65T60; 94A13
1. Introduction
Induction motors play a crucial role in numerous industrial applications, and their reliable operation is essential for maintaining productivity and minimizing downtime. Effective failure detection and condition monitoring techniques are vital for ensuring the motor’s optimal performance and preventing catastrophic failures. The issue of diagnosing bar breakage in electrical induction cage machines has become a growing concern in recent times since they are extensively used in the industry [1].
Different methods for failure detection of induction electrical machines have been used in the literature (see, e.g., [2,3] for reviews on the topic), which range from using time-frequency methods like the wavelet and wavelet packet transform [4,5,6,7,8] to convolutional neural networks and other machine learning techniques [9,10,11].
The startup transient of an induction motor encompasses the period immediately following its activation. Then, the motor accelerates from a standstill to the rated speed. The startup current changes in amplitude, with 50 Hz of typical supply frequency sinusoidal signal. Figure 1 shows three examples of signals exhibiting the typical startup currents, corresponding to a healthy machine, one with a broken bar, and one with two broken bars, respectively.
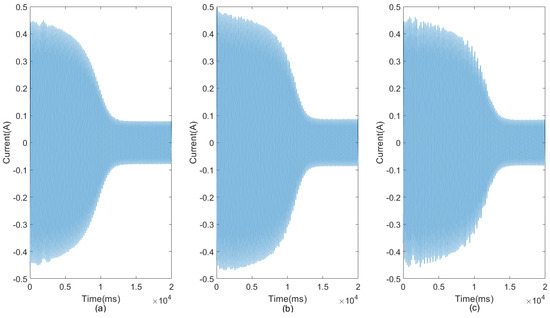
Figure 1.
Startup current signals for (a) a healthy machine, (b) one broken bar, and (c) two broken bars.
In the event of a rotor bar breakage, one can appreciate a distortion in the air-gap field, which leads to the induction of various frequency components in the stator current spectrum. Among these components, the left sideband harmonic is crucial for diagnosing broken rotor bars in induction machines. Throughout the startup transience, this harmonic undergoes an evolution, decreasing the frequency from a value that equals the 50 Hz supply frequency when we connect the machine and reaching 0 Hz when the rotor speed is half the synchronous speed. Then, the frequency increases again up to a value close to 50 Hz when the steady-state regime is achieved (see [4] for a more detailed description of the physical phenomenon). Therefore, many of the methods that target rotor bar breakage in induction electric motors are based on analyzing the presence of these harmonics in the signal. The problem is that it is not feasible to directly distinguish between the current for a faulty machine and that of a healthy one because of the low amplitude of the sideband harmonic compared to the current.
This paper presents a novel approach for failure detection in induction motors by utilizing wavelet packets as well as the discrete wavelet transform. The advantage of the wavelet packet transform is the possibility of better localizing different frequency bands, which allows the extraction of both low and high-frequency components with varying levels of detail. The ‘dmeyer’ wavelet, derived from the Meyer wavelet, is employed due to its desirable properties such as orthogonality, symmetry, and compact support. By decomposing the motor’s electrical signals using wavelet packets, fault-related patterns and specific frequency components associated with motor faults can be effectively identified and characterized. The frequency localization and multi-resolution capabilities of wavelet packets provide valuable insights into the motor’s frequency content, enabling efficient fault diagnosis and classification. The advantages of using wavelet packets, particularly the ‘dmeyer’ wavelet, include the ability to extract relevant features from the motor’s signals, computational effectiveness for real-time monitoring applications, and adaptability to different fault scenarios. In the case of the discrete wavelet transform we selected the ‘dmeyer’ wavelet family too and, although we do not have the same flexibility as in the wavelet packet in order to select a suitable band of frequencies, we also obtained very good results once we minimized the boundary effects. We compared the performance of the Meyer’s wavelet with that of one from the Daubechies wavelet family, namely Daubechies 40, which has been demonstrated in previous works [4,5] to be very efficient in extracting the frequency information of the signal.
The main objective of the work is to define quantitative indicators based on the coefficients of the discrete wavelet transform or the wavelet packet transform that allows for the detection and classification of rotor bar breakages. Experimental results demonstrate the efficacy of the proposed approach in accurately detecting and diagnosing various motor failures. The findings highlight the potential of wavelet packets as a powerful tool for failure detection in induction motors, as well as the discrete wavelet transform combined with the algorithm to reduce the boundary effects, paving the way for improved condition monitoring and maintenance strategies in industrial settings.
2. DWT and Wavelet Packet Transform and Frequency Based Analysis
2.1. Discrete Wavelet Transform
The discrete wavelet transform (DWT) is a very useful mathematical tool for analyzing signals in both time and frequency domains. It provides a multi-resolution analysis, allowing for the extraction of both low-frequency and high-frequency components of a signal using a set of scaling and wavelet functions (see, e.g., [12,13,14,15] for key references containing the basic theory).
Let us consider a discrete time signal of length N. The DWT decomposes this signal into a set of wavelet coefficients and , where j represents the scale or level of decomposition and k represents the translation or shift parameter. The discrete wavelet transform (DWT) of a signal can be introduced with respect to the (father) scaling function and the (mother) wavelet function , which are related with some low-pass and high-pass filters, respectively. These and functions must satisfy a set pf conditions, admissibility, orthogonality, finite support, etc, which ensure that the discrete wavelet transform exhibits properties like energy conservation, good localization in time and frequency, regularity, etc. The finite support property is crucial for efficient implementation of the wavelet transform, especially in the discrete domain. The different conditions that we can impose on the wavelet and scaling functions lead to different families of wavelets, such as Haar wavelets, Daubechies wavelets, Coiflets, etc.
Let be a wavelet function and be a scaling function in , both of which are finite supported. In the discrete time approach, it is common to assume that N is an even number, or even more, for dyadic decomposition. The scaled and translated versions of the scaling and wavelet functions are given by:
where j and k are integer parameters representing the scale and translation.
The decomposition of , at scale j is given by:
where and are, respectively, the wavelet and the scaling functions corresponding to the scale j and parameter of translation k. The detail coefficients capture the details or rapid changes in the signal; in particular, they represent the high-frequency components of the signal at a specific scale and translation. On the other hand, the approximation coefficients capture the smooth variations or trends in the signal, in other words, these coefficients represent the low-frequency components of the signal.
Let us analyze in more detail this decomposition. At the first level, , the discrete wavelet transform of a signal is defined as follows:
The coefficients represent the approximation of the signal at scale 1 and position k, while represents the details or high-frequency components of the signal at the same scale and position. The level one DWT decomposes the original signal into two sub-signals and , both of which are of a length of .
The second-order transformation, or scale , is obtained by applying a first-order transform to the approximation sub-signal and leaving the detail sub-signal unchanged. In this way, the second-order transformation divides the signal into three sub-signals: the second-level approximation, namely , the second-level details, denoted by , both signals of length , and the first-level details.
Analogously, higher-level transformations are constructed. At scale J, we apply a first-level transformation to the sub-signal , obtaining the approximation and details of level J and leaving the rest of the -level transformed unchanged.
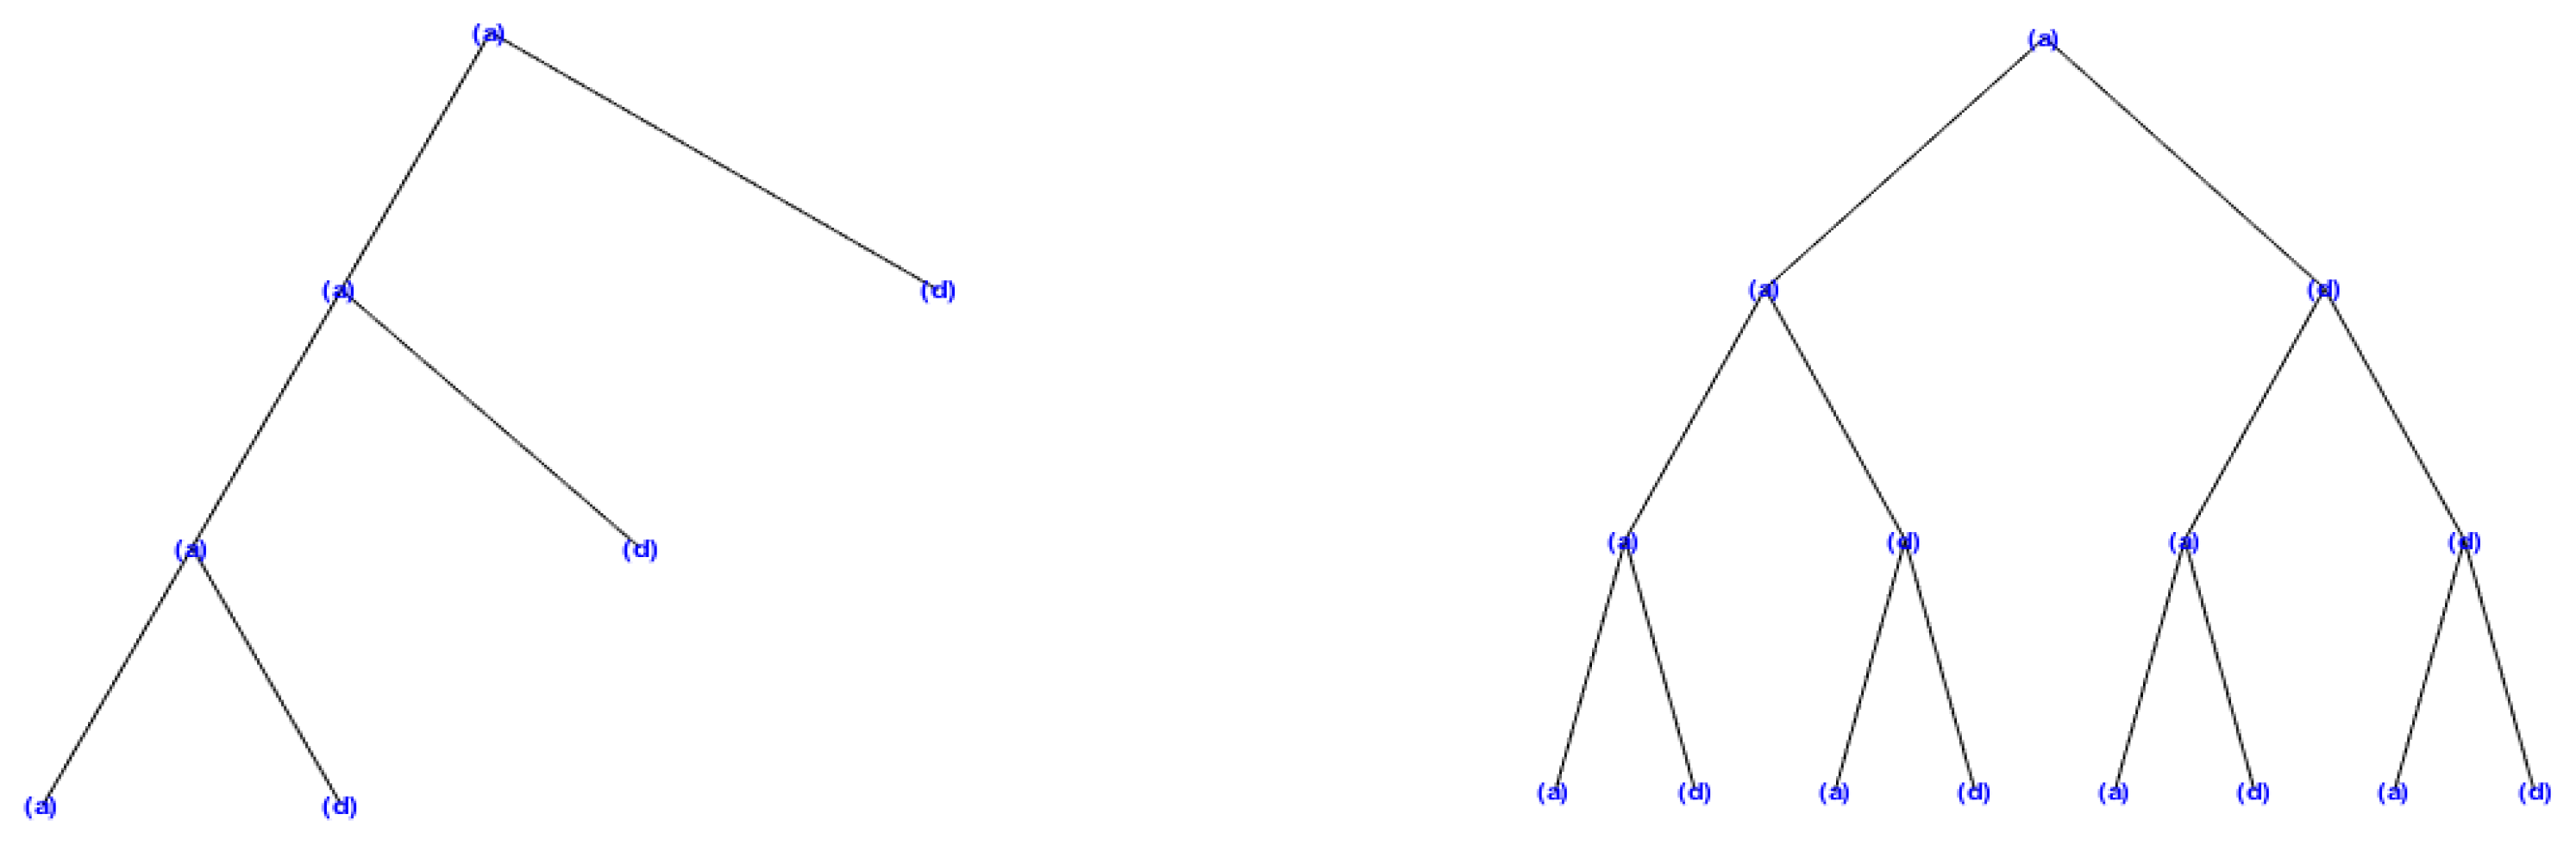
This way, at level J, the DWT of a signal produces a decomposition into sub-signals: a sub-signal of approximation and sub-signals of detail , , , ..., . In Figure 2, we can see the structure of this decomposition. For each of the previous sub-signals we have a predefined frequency band, which depend on the sampling rate and on the level of decomposition. This means that the DWT acts as a band-pass filter of the signal so that each sub-signal has the frequencies within its associated band. Thus, for level J of the wavelet transform and for sampling frequency , the approximation and detail coefficients and contain the frequency components into the intervals:
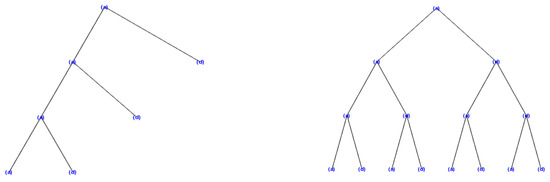
Figure 2.
Wavelet decomposition vs. wavelet packet decomposition.
One of the key advantages of the DWT is its ability to perform a multi-resolution analysis of a signal. By decomposing a signal into different scales, the DWT captures both local details and global trends in the signal.
The DWT differs from traditional Fourier-based frequency analysis methods, such as the discrete Fourier transform (DFT), by providing time-frequency localization. While the DFT yields frequency information for the entire signal, the DWT localizes frequency information in both time and scale domains. This localization enables the detection of transient events or localized frequency changes in a signal.
Another important feature of the DWT is the multi-resolution analysis (MRA), which plays a central role in wavelet-based signal processing, involving a hierarchical decomposition of signals into approximations and details.
Beginning with the original signal as , each subsequent level, where we denote for approximation and for detail, is built by decomposing the previous approximation vector , in such a way that the m-level MRA is given by:
This decomposition distinguishes between low-frequency content captured in and high-frequency corrections represented by , .
2.2. Wavelet Packets
Wavelet packets are a powerful tool in signal analysis that allow for a flexible representation of signals in both time and frequency domains. Wavelet packets extend the concept of wavelets by allowing further decomposition and reconstruction of a signal. Unlike traditional wavelet transforms, which split a signal into two sub-bands (approximations and details), wavelet packets allow the subdivision of a signal into multiple sub-bands at each decomposition level. This enhanced decomposition capability provides a more detailed analysis of the signal’s frequency content, making wavelet packets particularly useful in various applications, including failure detection in induction motors.
The wavelet packet transform uses the same families of wavelets as the DWT; however, it applies the decomposition differently. At each decomposition level, it applies a level one transform to each of the sub-signals from the previous step. Thus, the wavelet packet transform and the DWT at level 1 are identical. However, at level 2, the wavelet packet transform applies a level 1 transformation to both and , resulting in four sub-signals, each a length of .
where , , and are the sub-signals given by, where and are the scaling and wavelets in and ,
Similarly, the higher-level wavelet packet transform is constructed. The decomposition of a signal using wavelet packets results in a tree-like structure, known as a wavelet packet tree (Figure 2), where each node represents a sub-band of frequency. Wavelet packets offer an efficient way to analyze the frequency content of a signal due to their inherent connection with frequency analysis. From the nodes of the wavelet packet tree, one can obtain detailed information about the frequency content of different sub-bands at various decomposition levels. This frequency localization property allows for effective detection and extraction of specific frequency components in a signal.
The terminal nodes of the wavelet packet tree are associated with the last level of frequency resolution of the transform. That is, for level J and for sampling frequency , the terminal nodes of the wavelet packet tree are associated with the following bandpass filters:
This means that the transform divides the interval from 0 to the Nyquist frequency into bands of the width about when we arrive at the terminal level of the wavelet packet tree.
2.3. Considered Wavelet Family
It is important to note that different wavelet families have different sets of scaling and wavelet functions, each with specific properties and applications. The choice of the wavelet family depends on the characteristics of the signal and the desired analysis goals. We wanted to select a suitable wavelet family that, on the one hand, has good smooth properties, and on the other hand, adapts well to the kind of signals that we considered in our study.
In the analysis of signals from the transient period of the motor startup, we have considered the Meyer wavelet because of its good frequency localization, in order to appropriately filter frequency components of signals below 50 Hz. The Meyer wavelet is a continuous wavelet, infinitely differentiable with infinite support. However, given the discrete nature of the signals, we have considered a discrete approximation with compact support.
Both the Meyer’s wavelet and scaling functions are defined in the frequency domain in terms of an auxiliary function as [12,15]
where , con , which was proposed by Daubechies [12], and this is the Meyer wavelet implemented in the MATLAB software, version R2023a. There exist different ways for defining the auxiliary function , which yields variants of the Meyer wavelet.
The Meyer scaling function is defined as
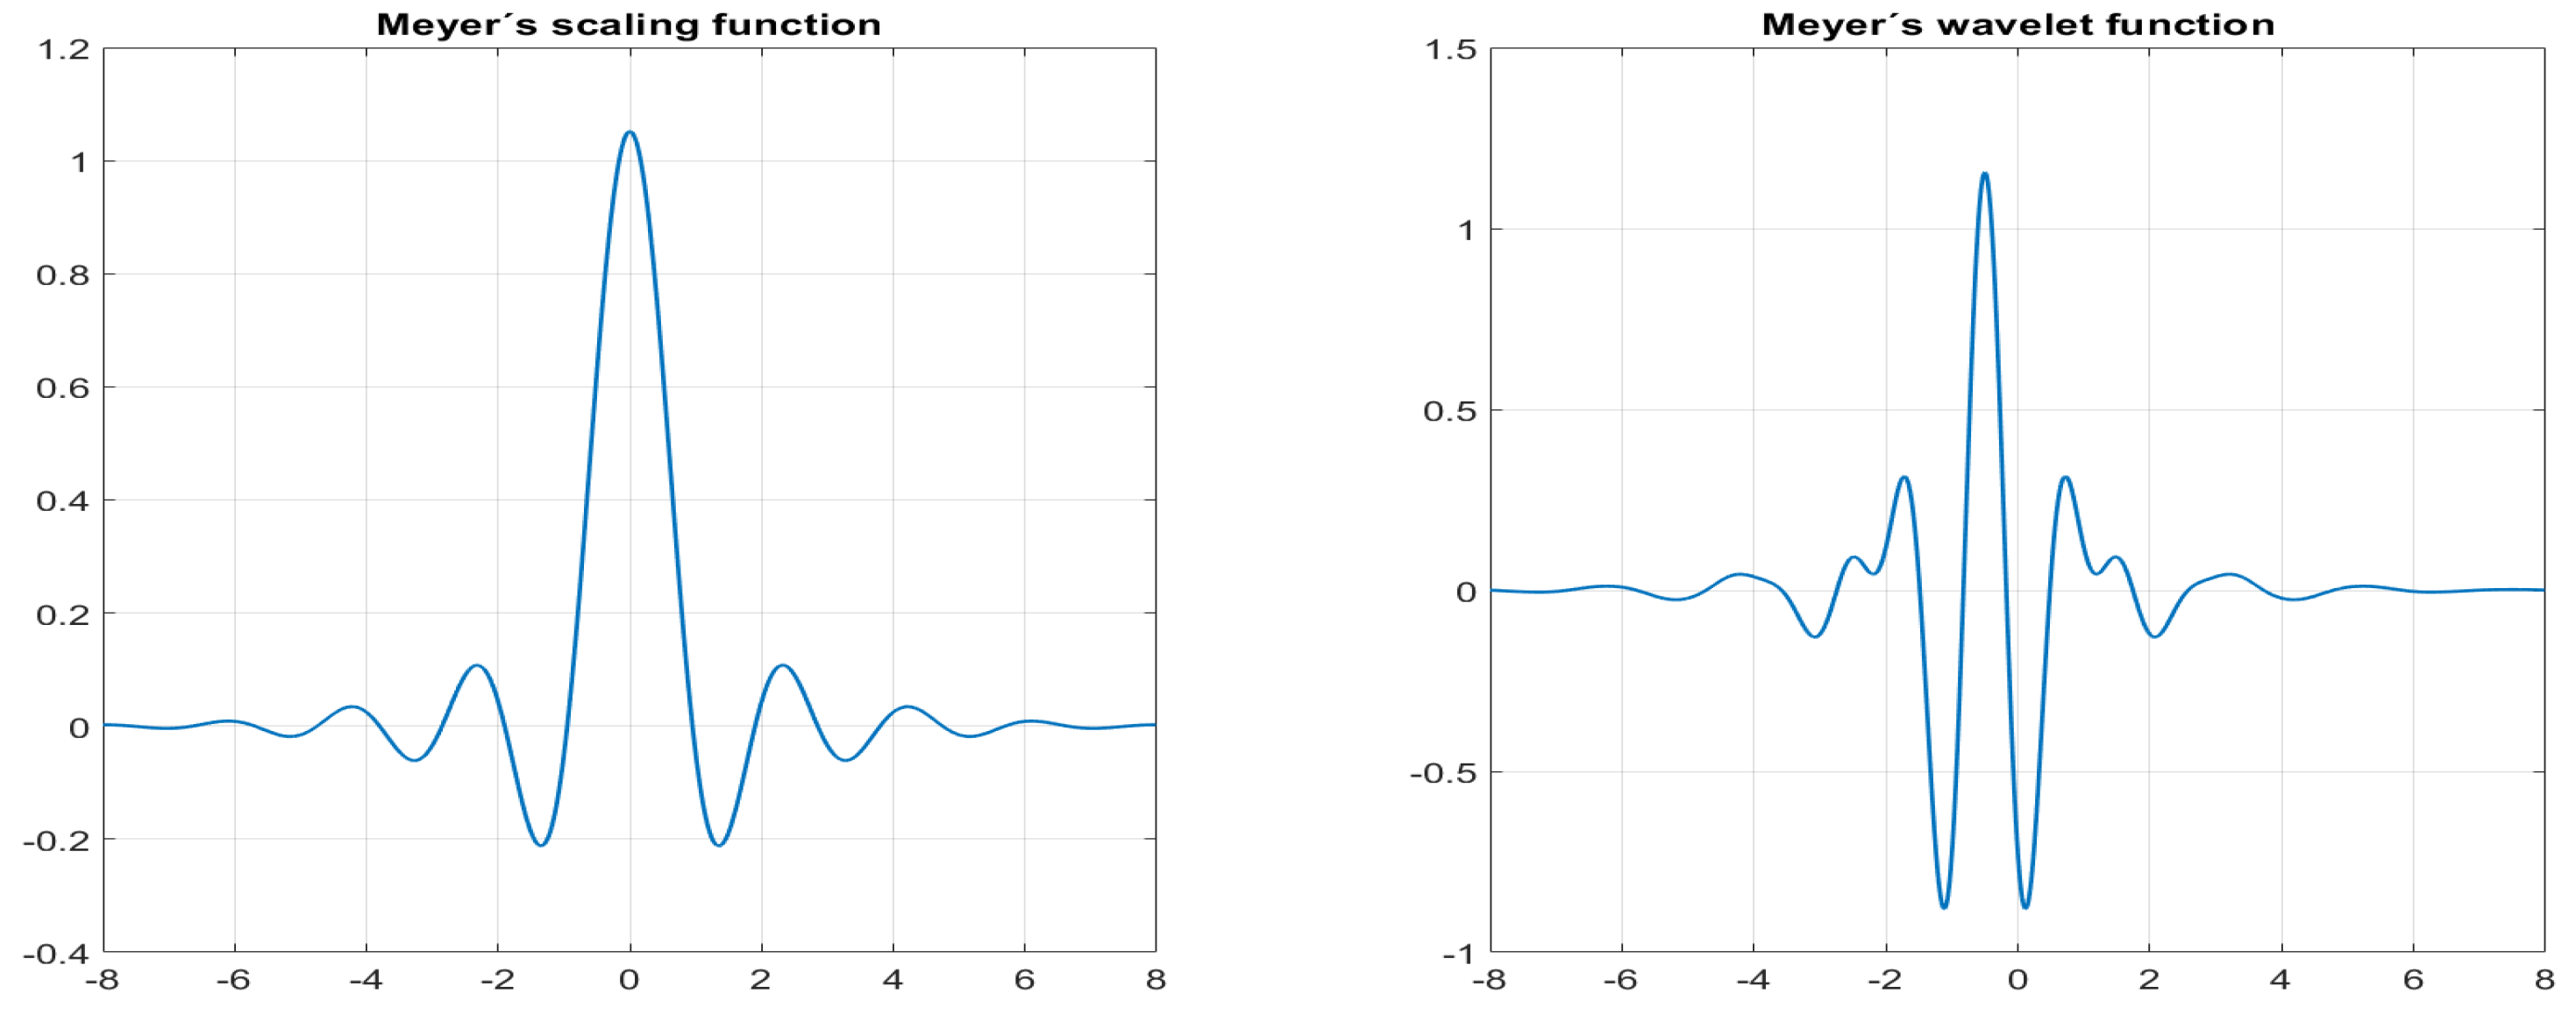
When we apply the Fourier transform to either the continuous wavelet mother or the scaling function , the smoothness provides a faster asymptotic decay in time. Actually, the wavelet mother has an infinite number of vanishing moments. In the time domain, the waveform of the Meyer scaling and wavelet functions have a shape as shown in Figure 3.
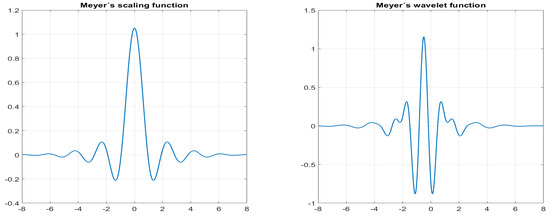
Figure 3.
Meyer’s scaling and wavelet functions.
Although the Meyer wavelet is not compactly supported, there exists a good discretized version that you can use in the discrete wavelet analysis. The discretized version of the Meyer’s wavelet, let us denote it by ‘dmeyer’, also exhibits good frequency localization properties, has compact support, and possesses desirable properties such as symmetry, vanishing moments, and orthogonality, which ensure that the energy of the signal is preserved during the decomposition and reconstruction processes. Additionally, the ‘dmeyer’ wavelet allows for perfect reconstruction, meaning that the original signal can be accurately reconstructed from its wavelet coefficients, making it suitable for various signal analysis tasks.
In order to asses the choice of the Meyer’s wavelet, we compare the performance of our algorithm by using one wavelet from the Daubechies family, namely the Daubechies 40, which was used in previous works [4,5], showing good frequency filtering properties.
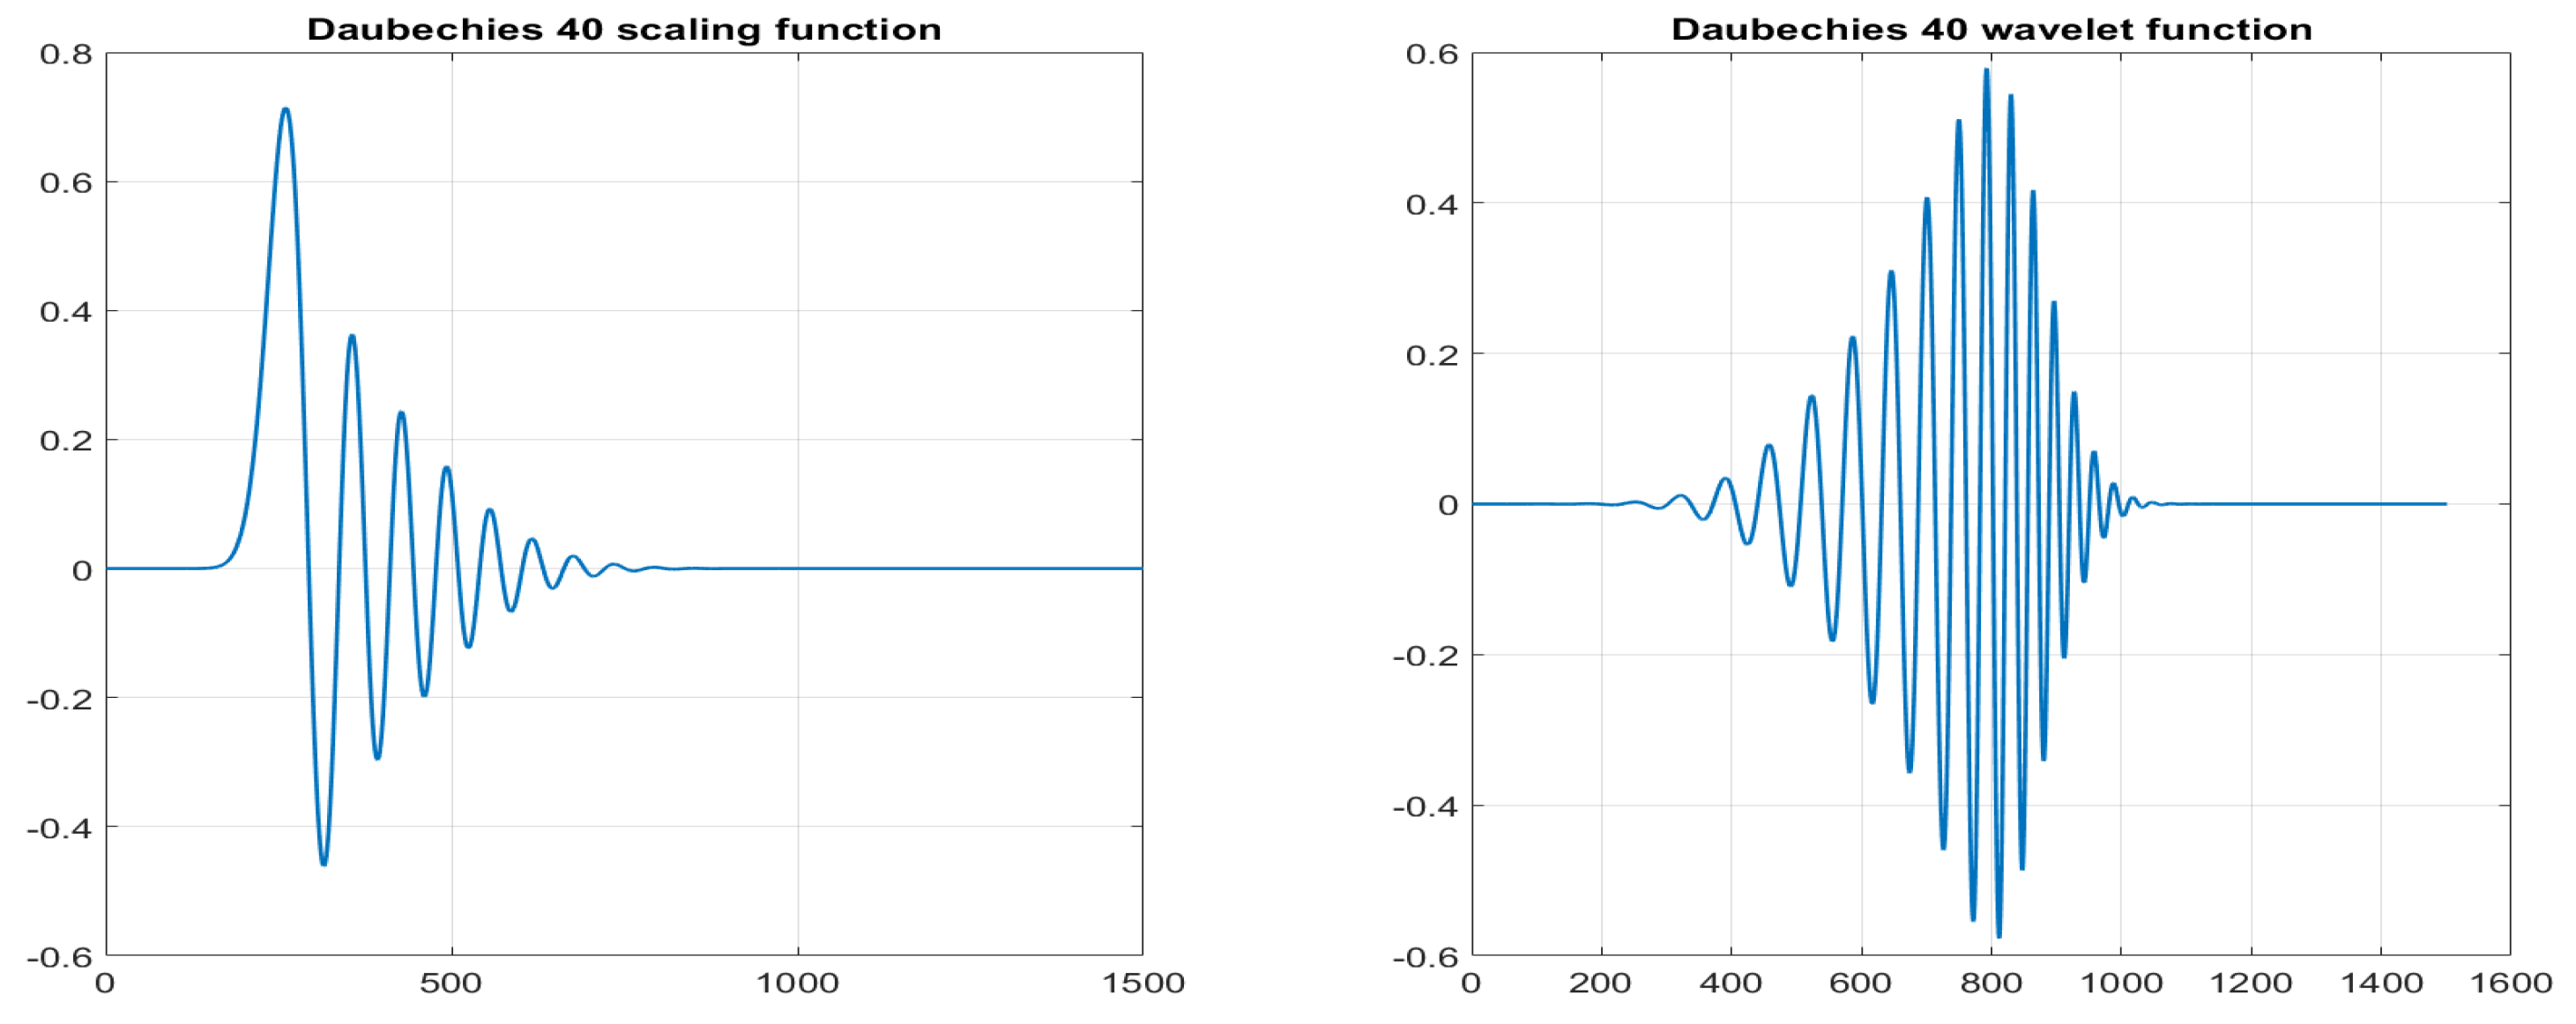
Daubechies wavelets [12] are a class of wavelets known for their orthogonality, compact support, and vanishing moments, making them optimal for signal processing tasks. Their compact support ensures efficient computation and localization of signal features, while the number of vanishing moments ensures the detail coefficient have close to zero values for regular signals. Additionally, Daubechies wavelets exhibit asymmetry with respect to the center of their support, enhancing their effectiveness in representing certain types of signals. We consider the Daubechies 40, which is a high order wavelet into the family and whose scaling and wavelet functions have a shape as shown in Figure 4.
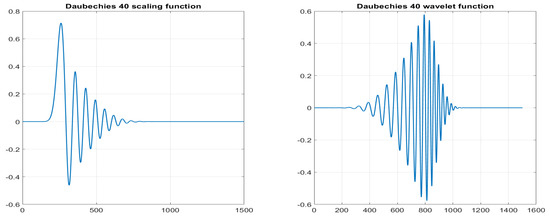
Figure 4.
Daubechies 40 scaling and wavelet functions.
3. Methodology
3.1. Algorithms and Fault Indicator Definition
In this section we describe the algorithms to carry out the main objective of the work, namely to define a quantitative indicator from the coefficients of wavelet and wavelet packet decompositions of the signal in order to detect and classify rotor bar breakage failures in electrical induction motors from the study of start-up current signals.
We construct three indicators and compare the results; the first one utilizes the coefficients of the DWT at level 9, the second employs the wavelet packet transform at level 9, and the third uses wavelet packet decomposition at level 10. The goal of our algorithm is to accurately identify faults in the motors by extracting and analyzing the low-frequency component, typically below 50 Hz, that arises when a motor exhibits a fault. In all cases, we have employed the ‘dmeyer’ wavelet due to its favorable time and frequency localization properties.
First, the algorithm used for the discrete wavelet transform-based indicator combines a previous smooth symmetrization of the signals, in order to reduce the boundary effects, with a transform at level 9, in which the harmonics of the broken bar signals are clearly visible in the detail signals at this level, the frequency band for detail coefficents at level 9 goes approximately from 9 to 20 Hz. Then, a moving windowed energy is performed on the details, compared with the corresponding normalization for the approximation, in order to extract a fault indicator, which we will call the DWT9 indicator.
As for the wavelet packet analysis, it extends the capabilities of the discrete wavelet transform by providing a more detailed decomposition of signals into sub-bands, allowing for a finer analysis of the frequency content. The wavelet packet decomposition of start-up transient signals offers a powerful and efficient tool to extract relevant features from the transient signals, which allows us obtain a quantitative indicator of the condition of the motor’s rotor bars.
The algorithm follows a systematic approach, outlined as follows:
- Step 1: Wavelet Packet TransformWe begin by computing the wavelet packet transform of the motor’s startup transient signals. This involves applying the wavelet packet decomposition at level 9, additionally, we also have developed the algorithm for level 10 decomposition. To mitigate any edge effects, we symmetrize the signals before performing the transform.
- Step 2: Frequency SelectionNext, we sort the terminal nodes of the wavelet packet decomposition in ascending order of frequency. We then choose the nodes that correspond to a frequency band approximately ranging from 10 to 40 Hz. This selection allows us to focus on the low-frequency components relevant to fault detection. In particular, this refers to nodes 2, 3, and 4 for the level 9 WP decomposition and it spans from node 3 to node 7 in the case of the level 10 WP transform.
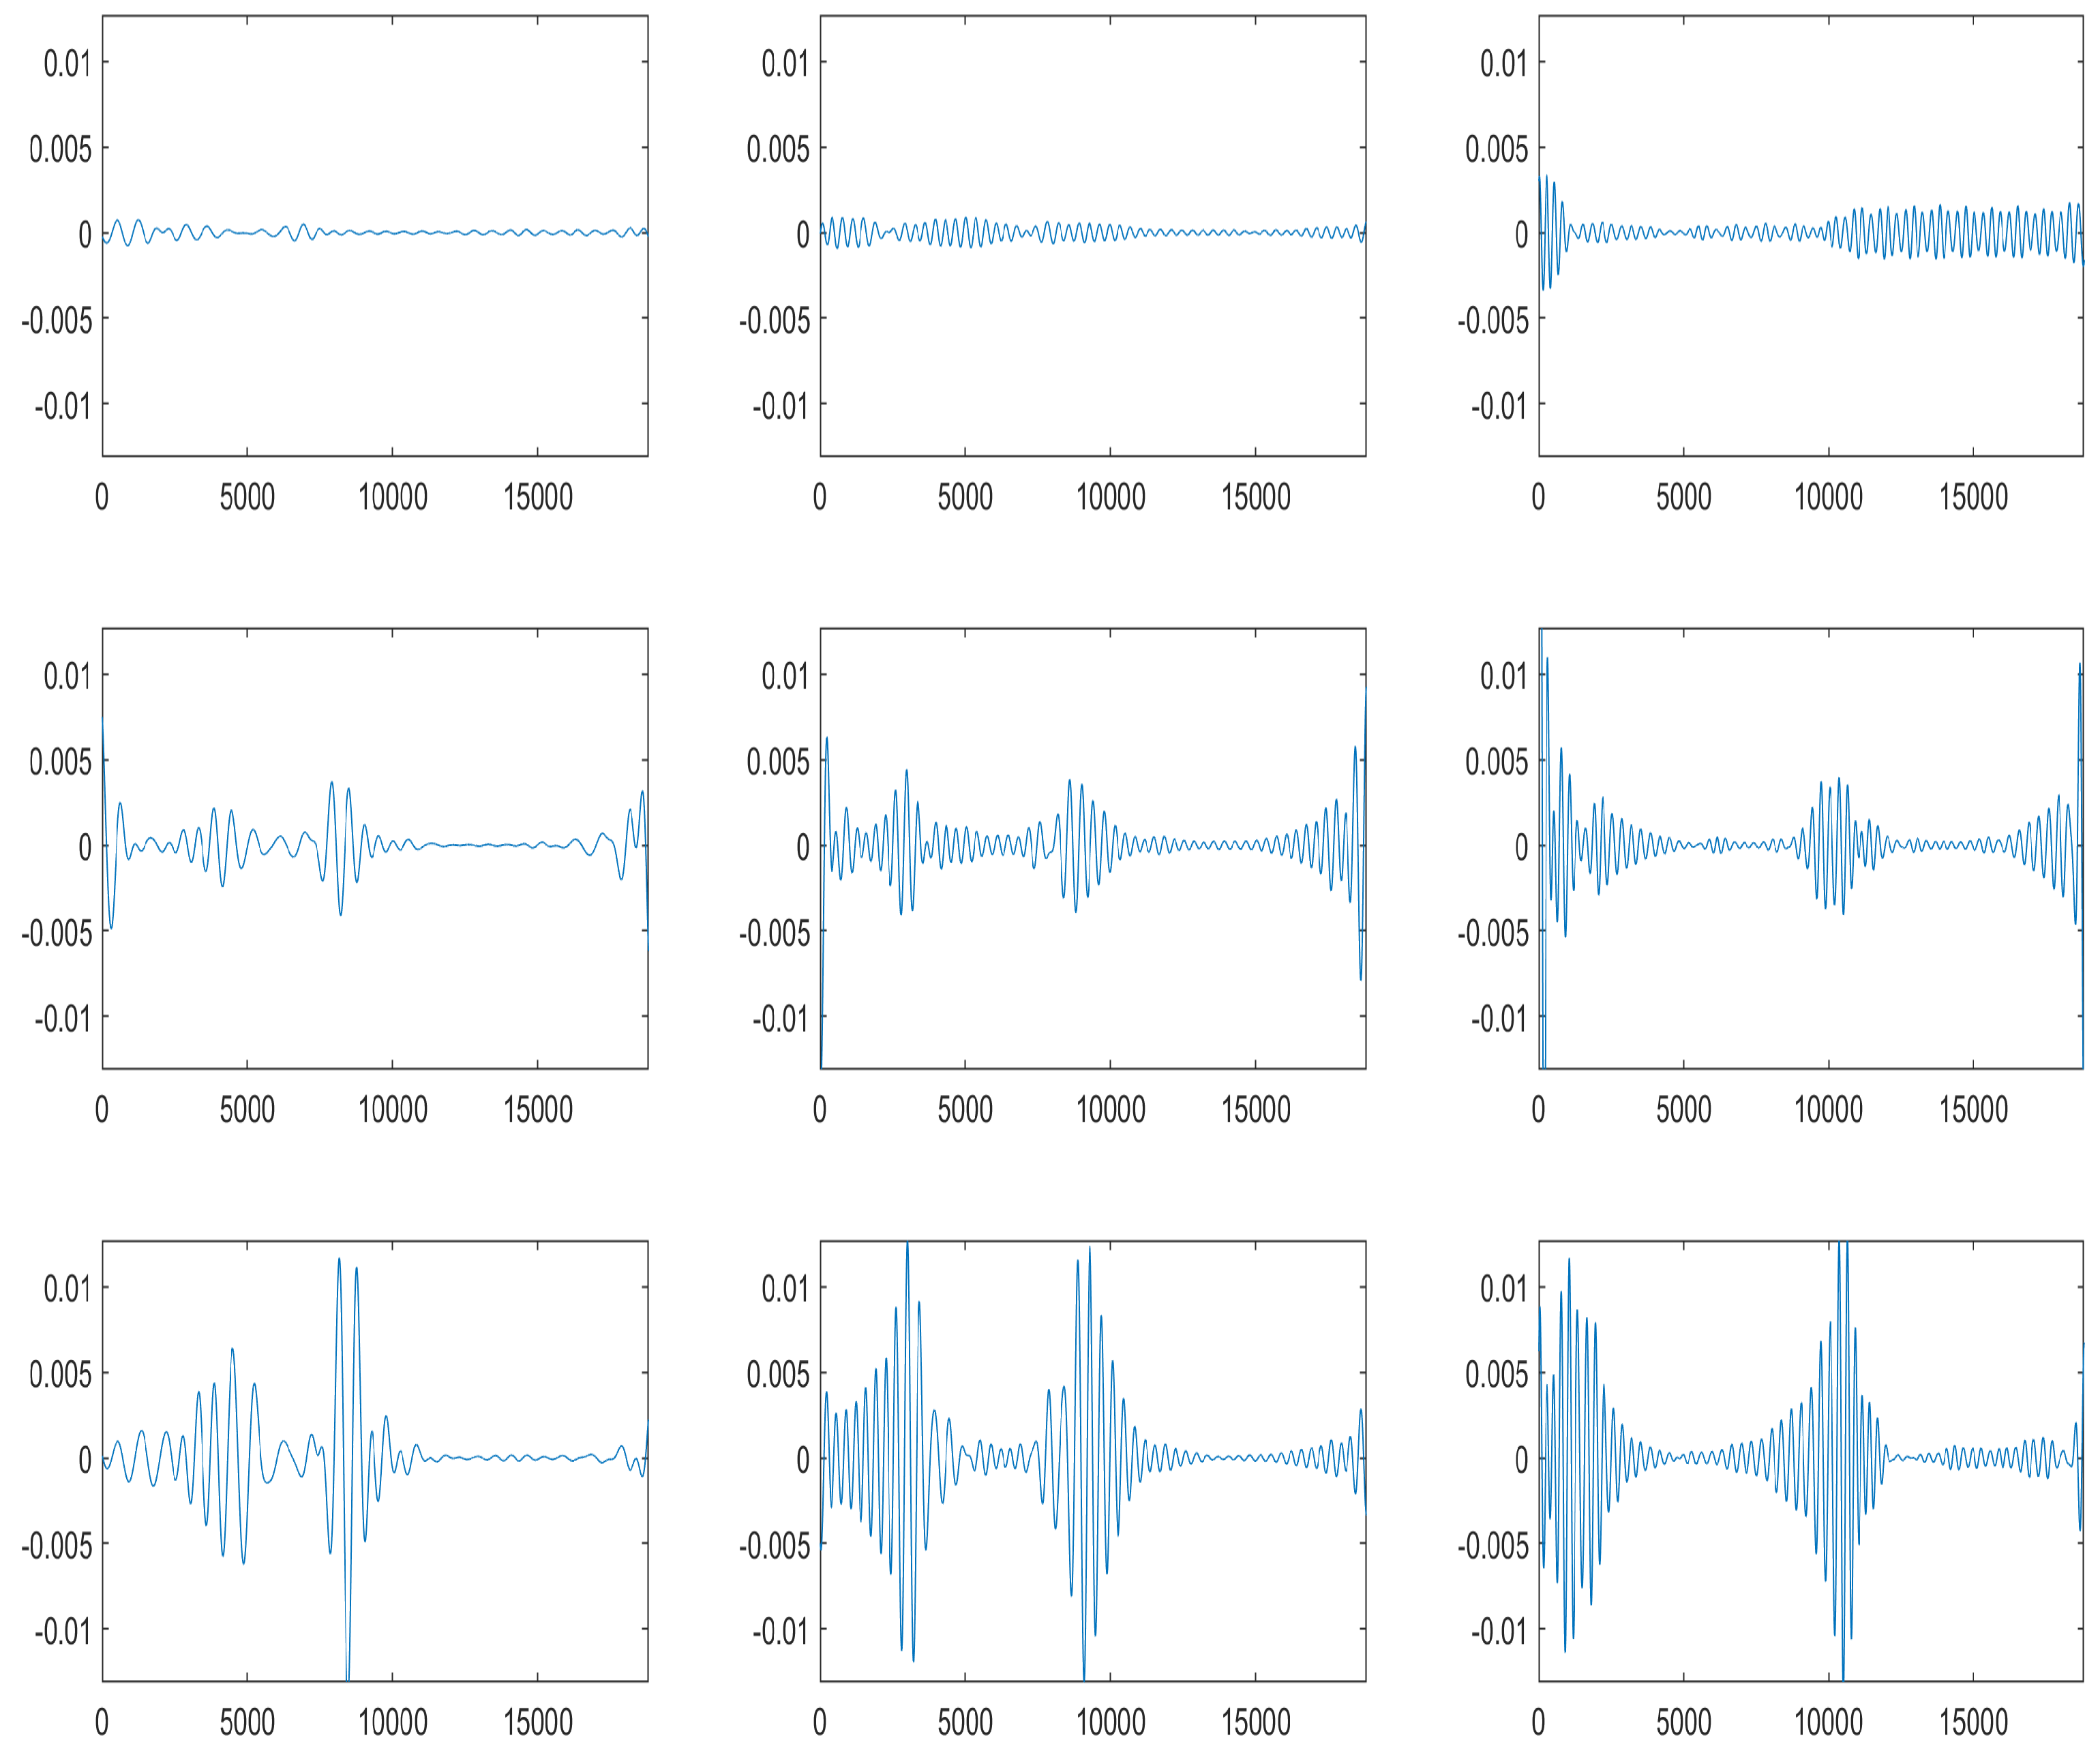
- Step 3: Node Reconstruction and NormalizationWe reconstruct the selected nodes, and an example of these reconstructed nodes is shown in Figure 5. Next, we normalize the coefficients of the selected nodes utilizing the first node (representing the lowest frequency) as the reference for normalization. This normalization step ensures consistent and meaningful comparisons across the different nodes.
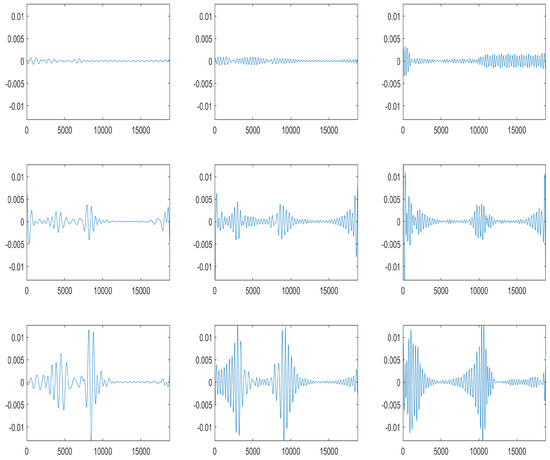 Figure 5. Reconstructed nodes 2, 3, and 4 of the level 9 WP decomposition using a ‘dmeyer’ wavelet for the first row correspond to a healthy motor signal, the second row to a one broken bar motor signal, and the third row corresponds to a two broken bars motor signal.
 - Step 4: Energy CalculationTo capture the fault-related information, we define a suitable window size, such as 2000 points, and calculate the energy of the reconstructed nodes within a moving window. Specifically, we consider the energy of the nodes between 10 and 40 Hz, as this frequency range is particularly indicative of faults in induction motors.
- Step 5: Fault Indicator CalculationWe identify the maximum energy value among the normalized nodes. The fault indicator value for each node corresponds to the unnormalized energy value at this maximum. Finally, to obtain the global fault indicator, we normalize the indicator values of all nodes and calculate their mean. Using the nodes described above in Step 2, we define the WP9 indicator for the level 9 WP decomposition and the WP10 indicator for the level 10 WP tranform.
The results below show that the fault indicator effectively captures the presence of faults in induction motors by detecting anomalies in the low-frequency component associated with faults. Through the analysis of these indicator values, we can accurately distinguish between healthy and faulty motor signals.
3.2. Experiments
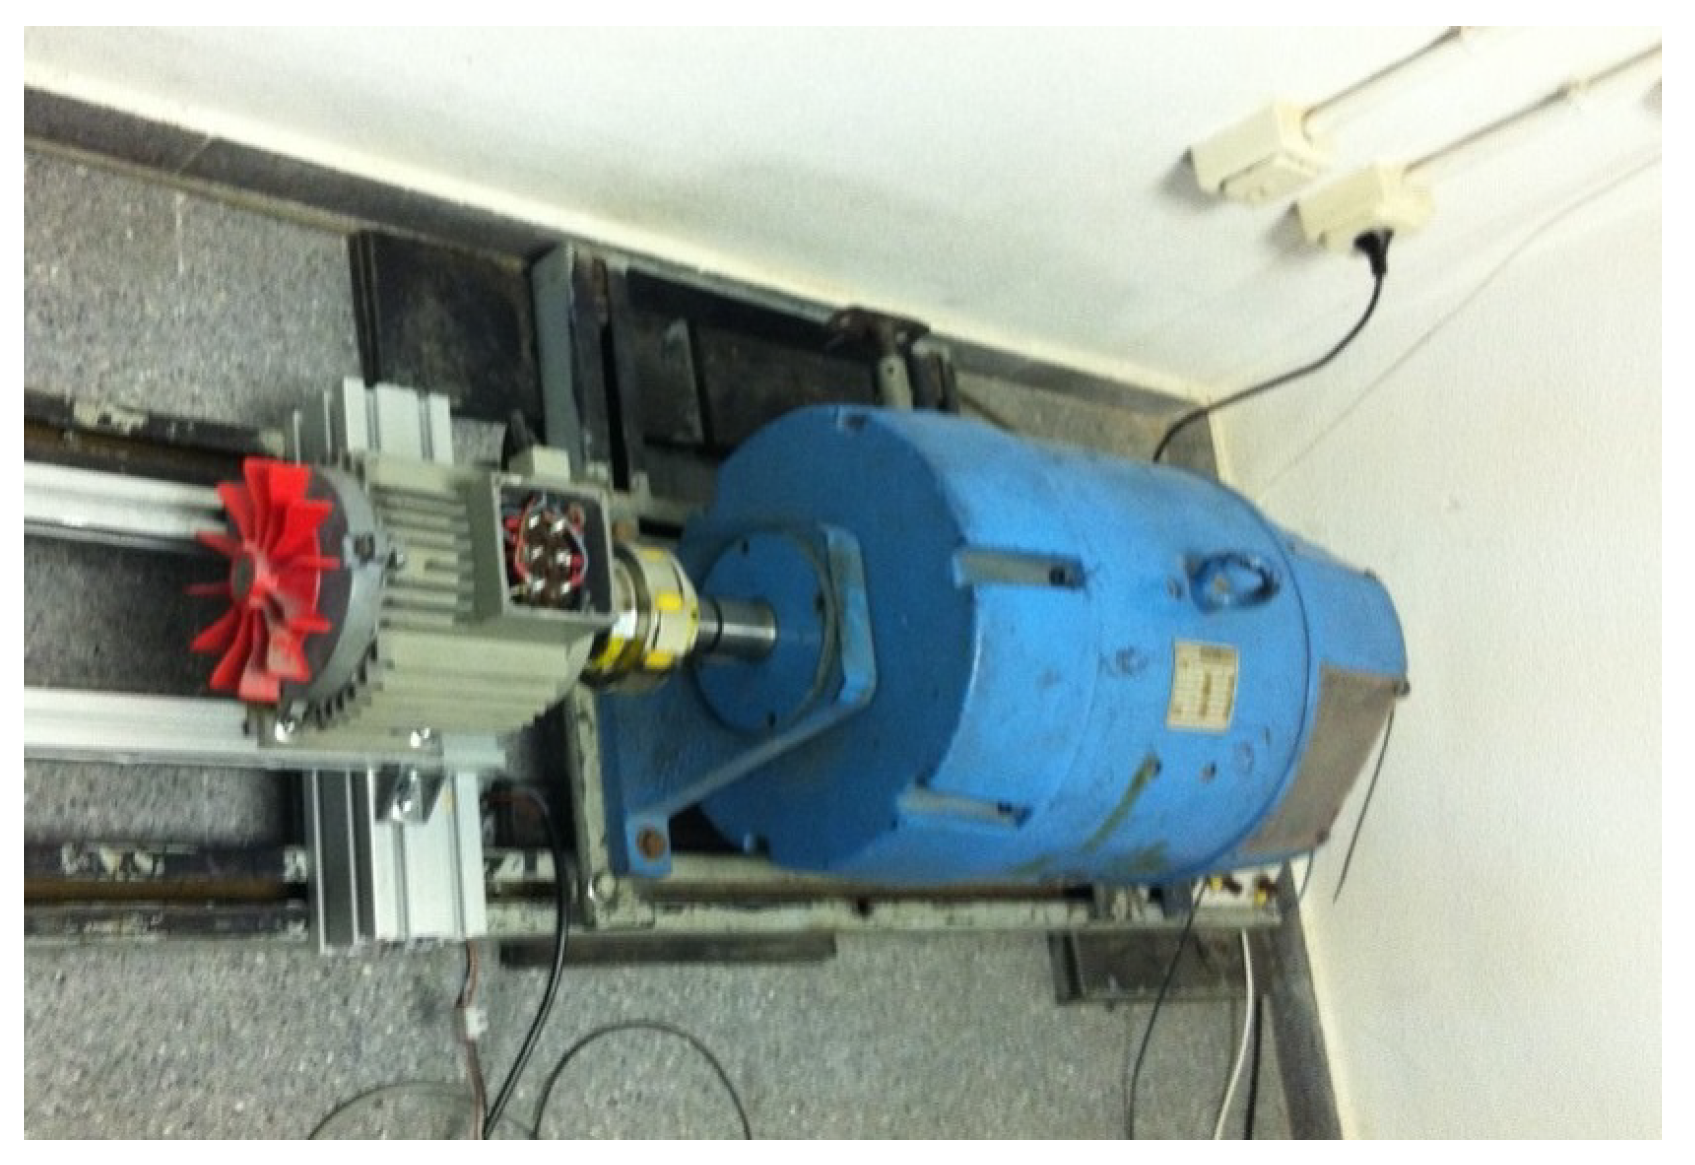
The experiments that we carried out in the laboratory used commercial cage motors with 28 rotor bars, 4 poles, and rated 1.1 kW, 400 V, and 50 Hz. They were coupled to a D.C. machine acting as the load (see Figure 6). In order to produce the bar breakages, we artificially drilled holes in the junction point between each bar and the short-circuit end-ring.

Figure 6.
Induction motor coupled to the D.C. load in the experimental test bench.
A Yokogawa Scopecorder and a current clamp were used in the phase of start-up current. The sampling rate was = 10.000 samples/s for the current signal. The Wavelet Toolbox of MATLAB was used in order to perform the DWT and the wavelet packet transform of the signals for the analyses.
We analyzed 21 signals (seven healthy, seven with a broken bar, and seven with two broken bars) with a duration of 2 seconds extracted from the startup of the engine. Our indicators show a robust good performance to distinguish between the three types of signals. Figure 1 shows three examples (healthy, one broken bar, and two broken bars) of signals exhibiting a typical example of these startup currents, and we can see that they are practically identical. This makes visual classification impossible, necessitating the design of more sophisticated tools.
4. Results
In Table 1 we present the results for the indicator based on the reconstructed level 9 detail coefficients of the wavelet transform of the set of signals. we have considered the discrete ‘dmeyer’ wavelet transform and the Daubechies 40 wavelet. As it has been mentioned above, this level corresponds to frequency components in the interval Hz.

Table 1.
Indicator values using the DWT-based algorithm at level 9.
A graphic comparison of the results is given in Figure 7. To better visualize the scale of the indicator values for each type of signal (healthy, one broken bar, or two broken bars), for each type of wavelet, we have considered two graphs. The first graph compares the indicator values for healthy signals and signals with one broken bar, while the second graph compares signals with one and two broken bars. We will do the same when representing the indicators based on wavelet packet.

Figure 7.
DWT9 indicator (a,b) for Meyer’s wavelet and (c,d) for Daubechies 40. (a,c) Healthy vs. one broken bar and (b,d) one broken bar vs. two broken bars.
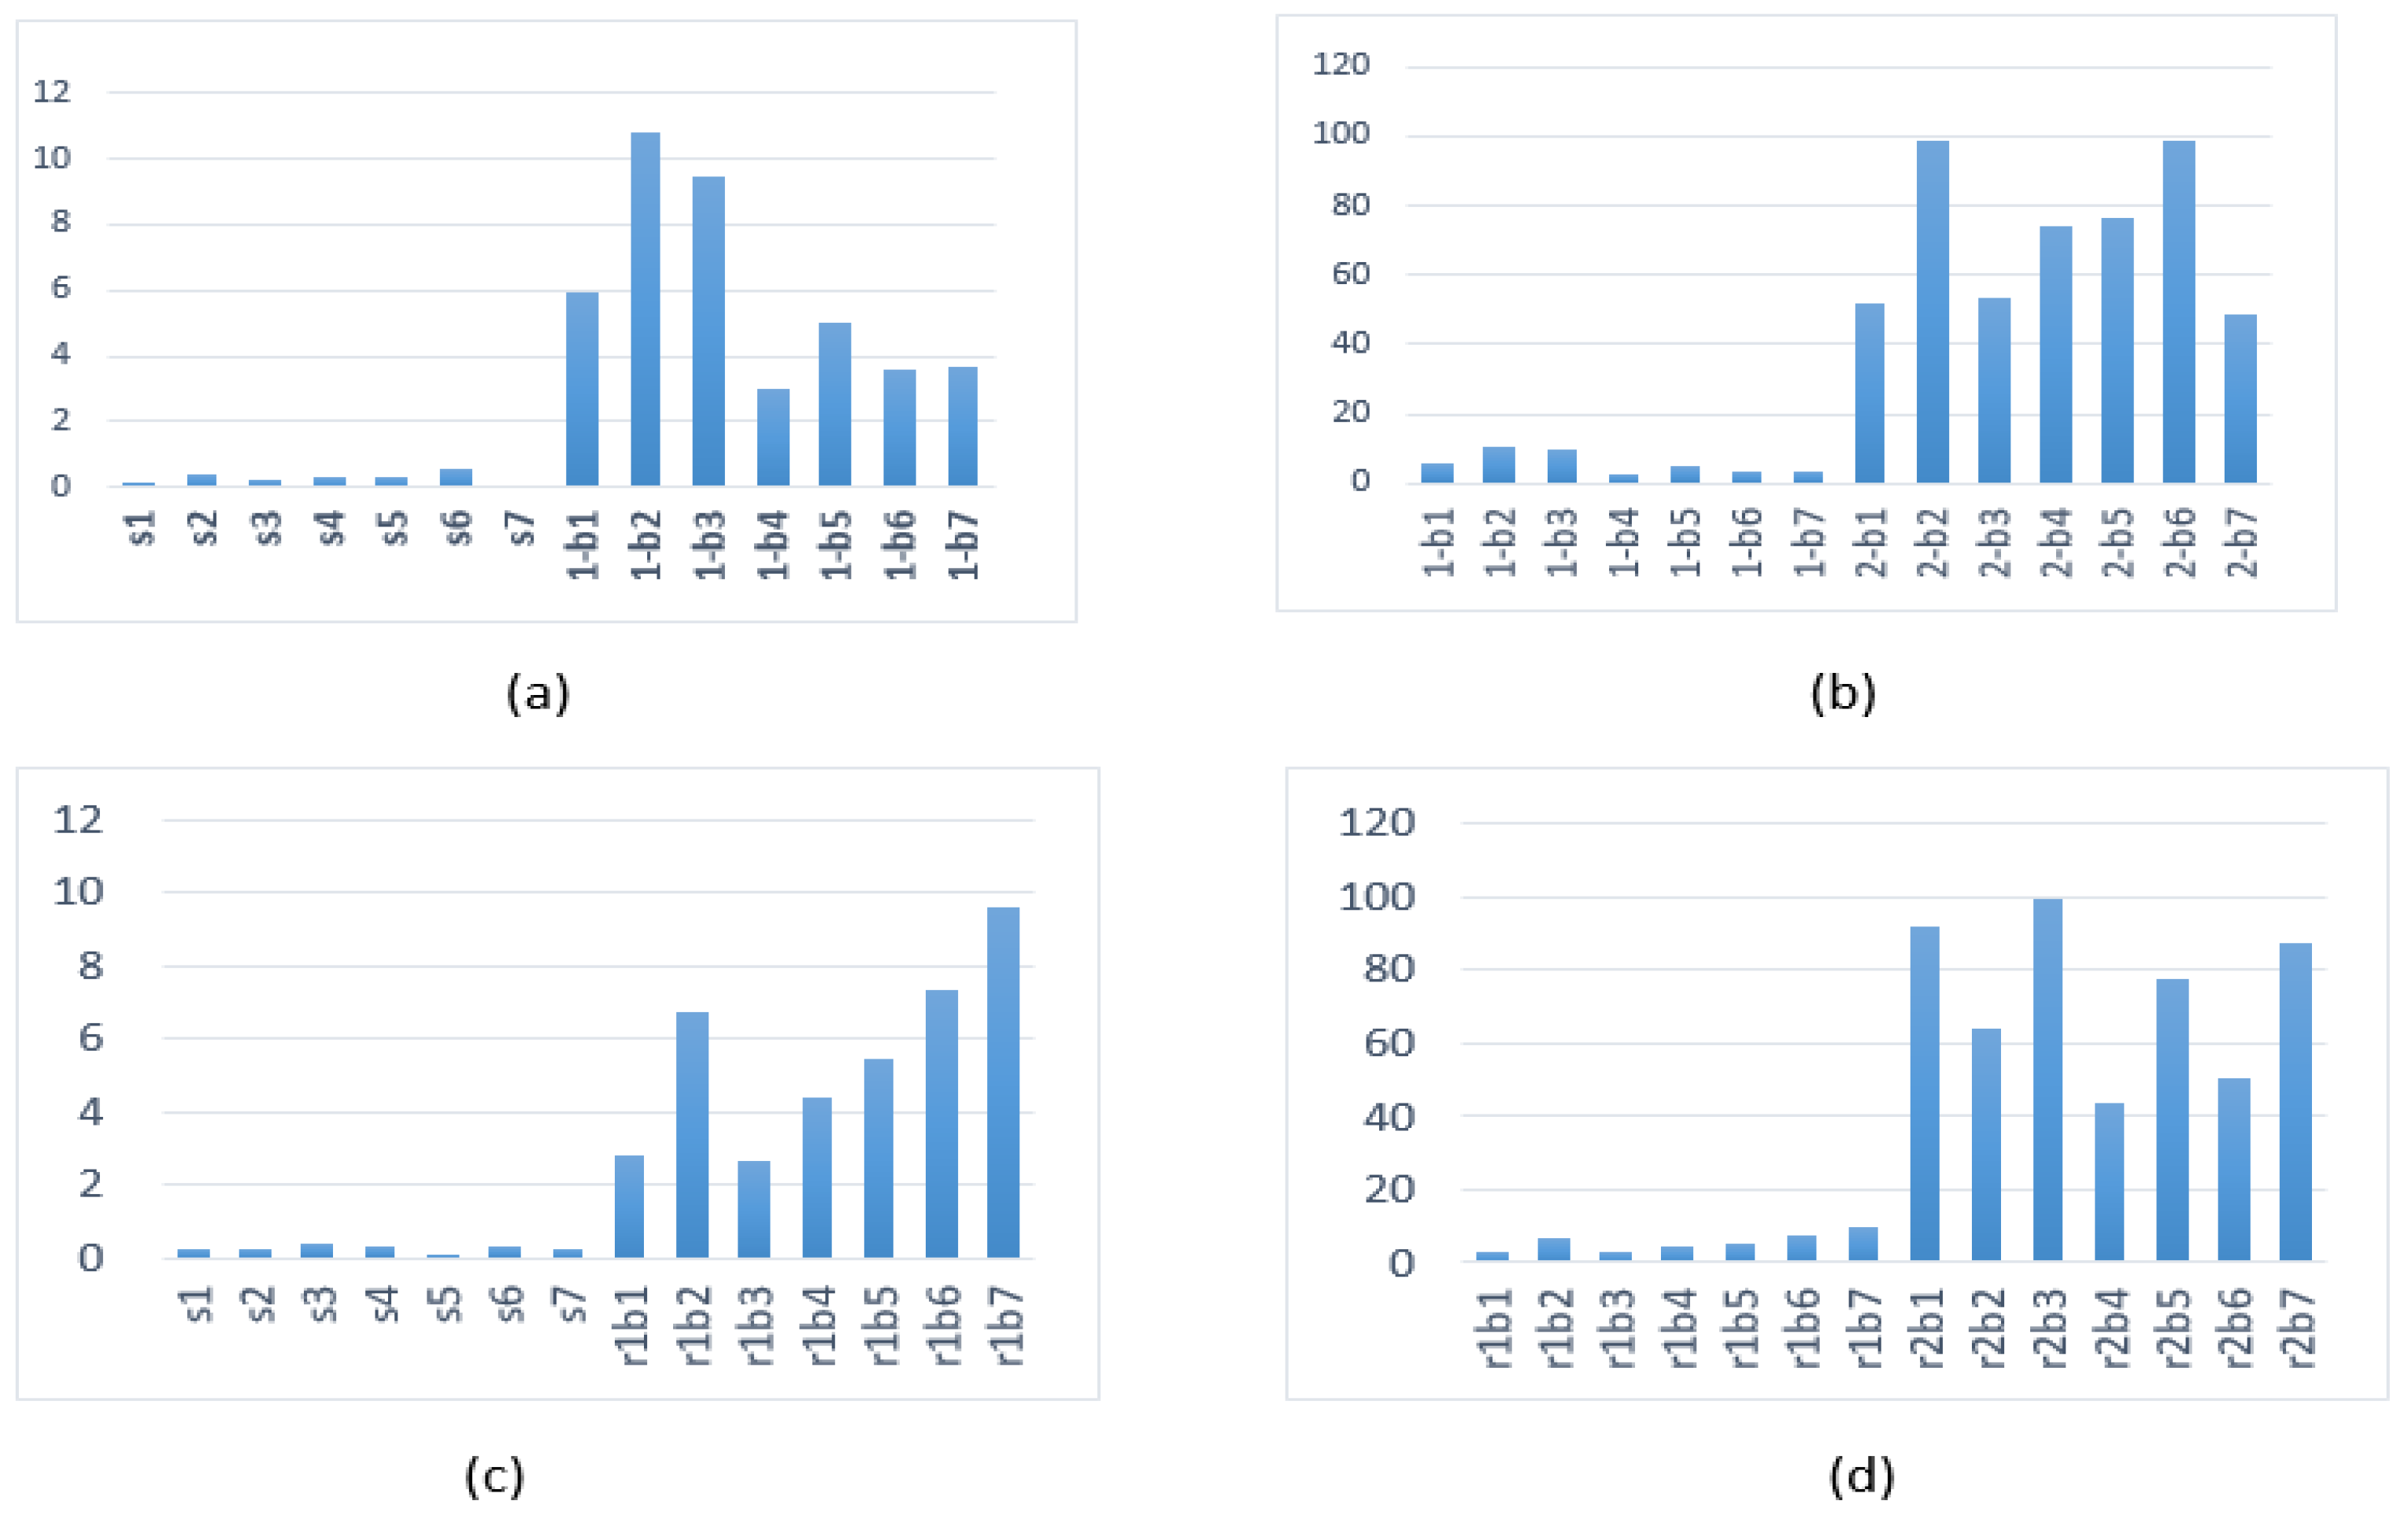
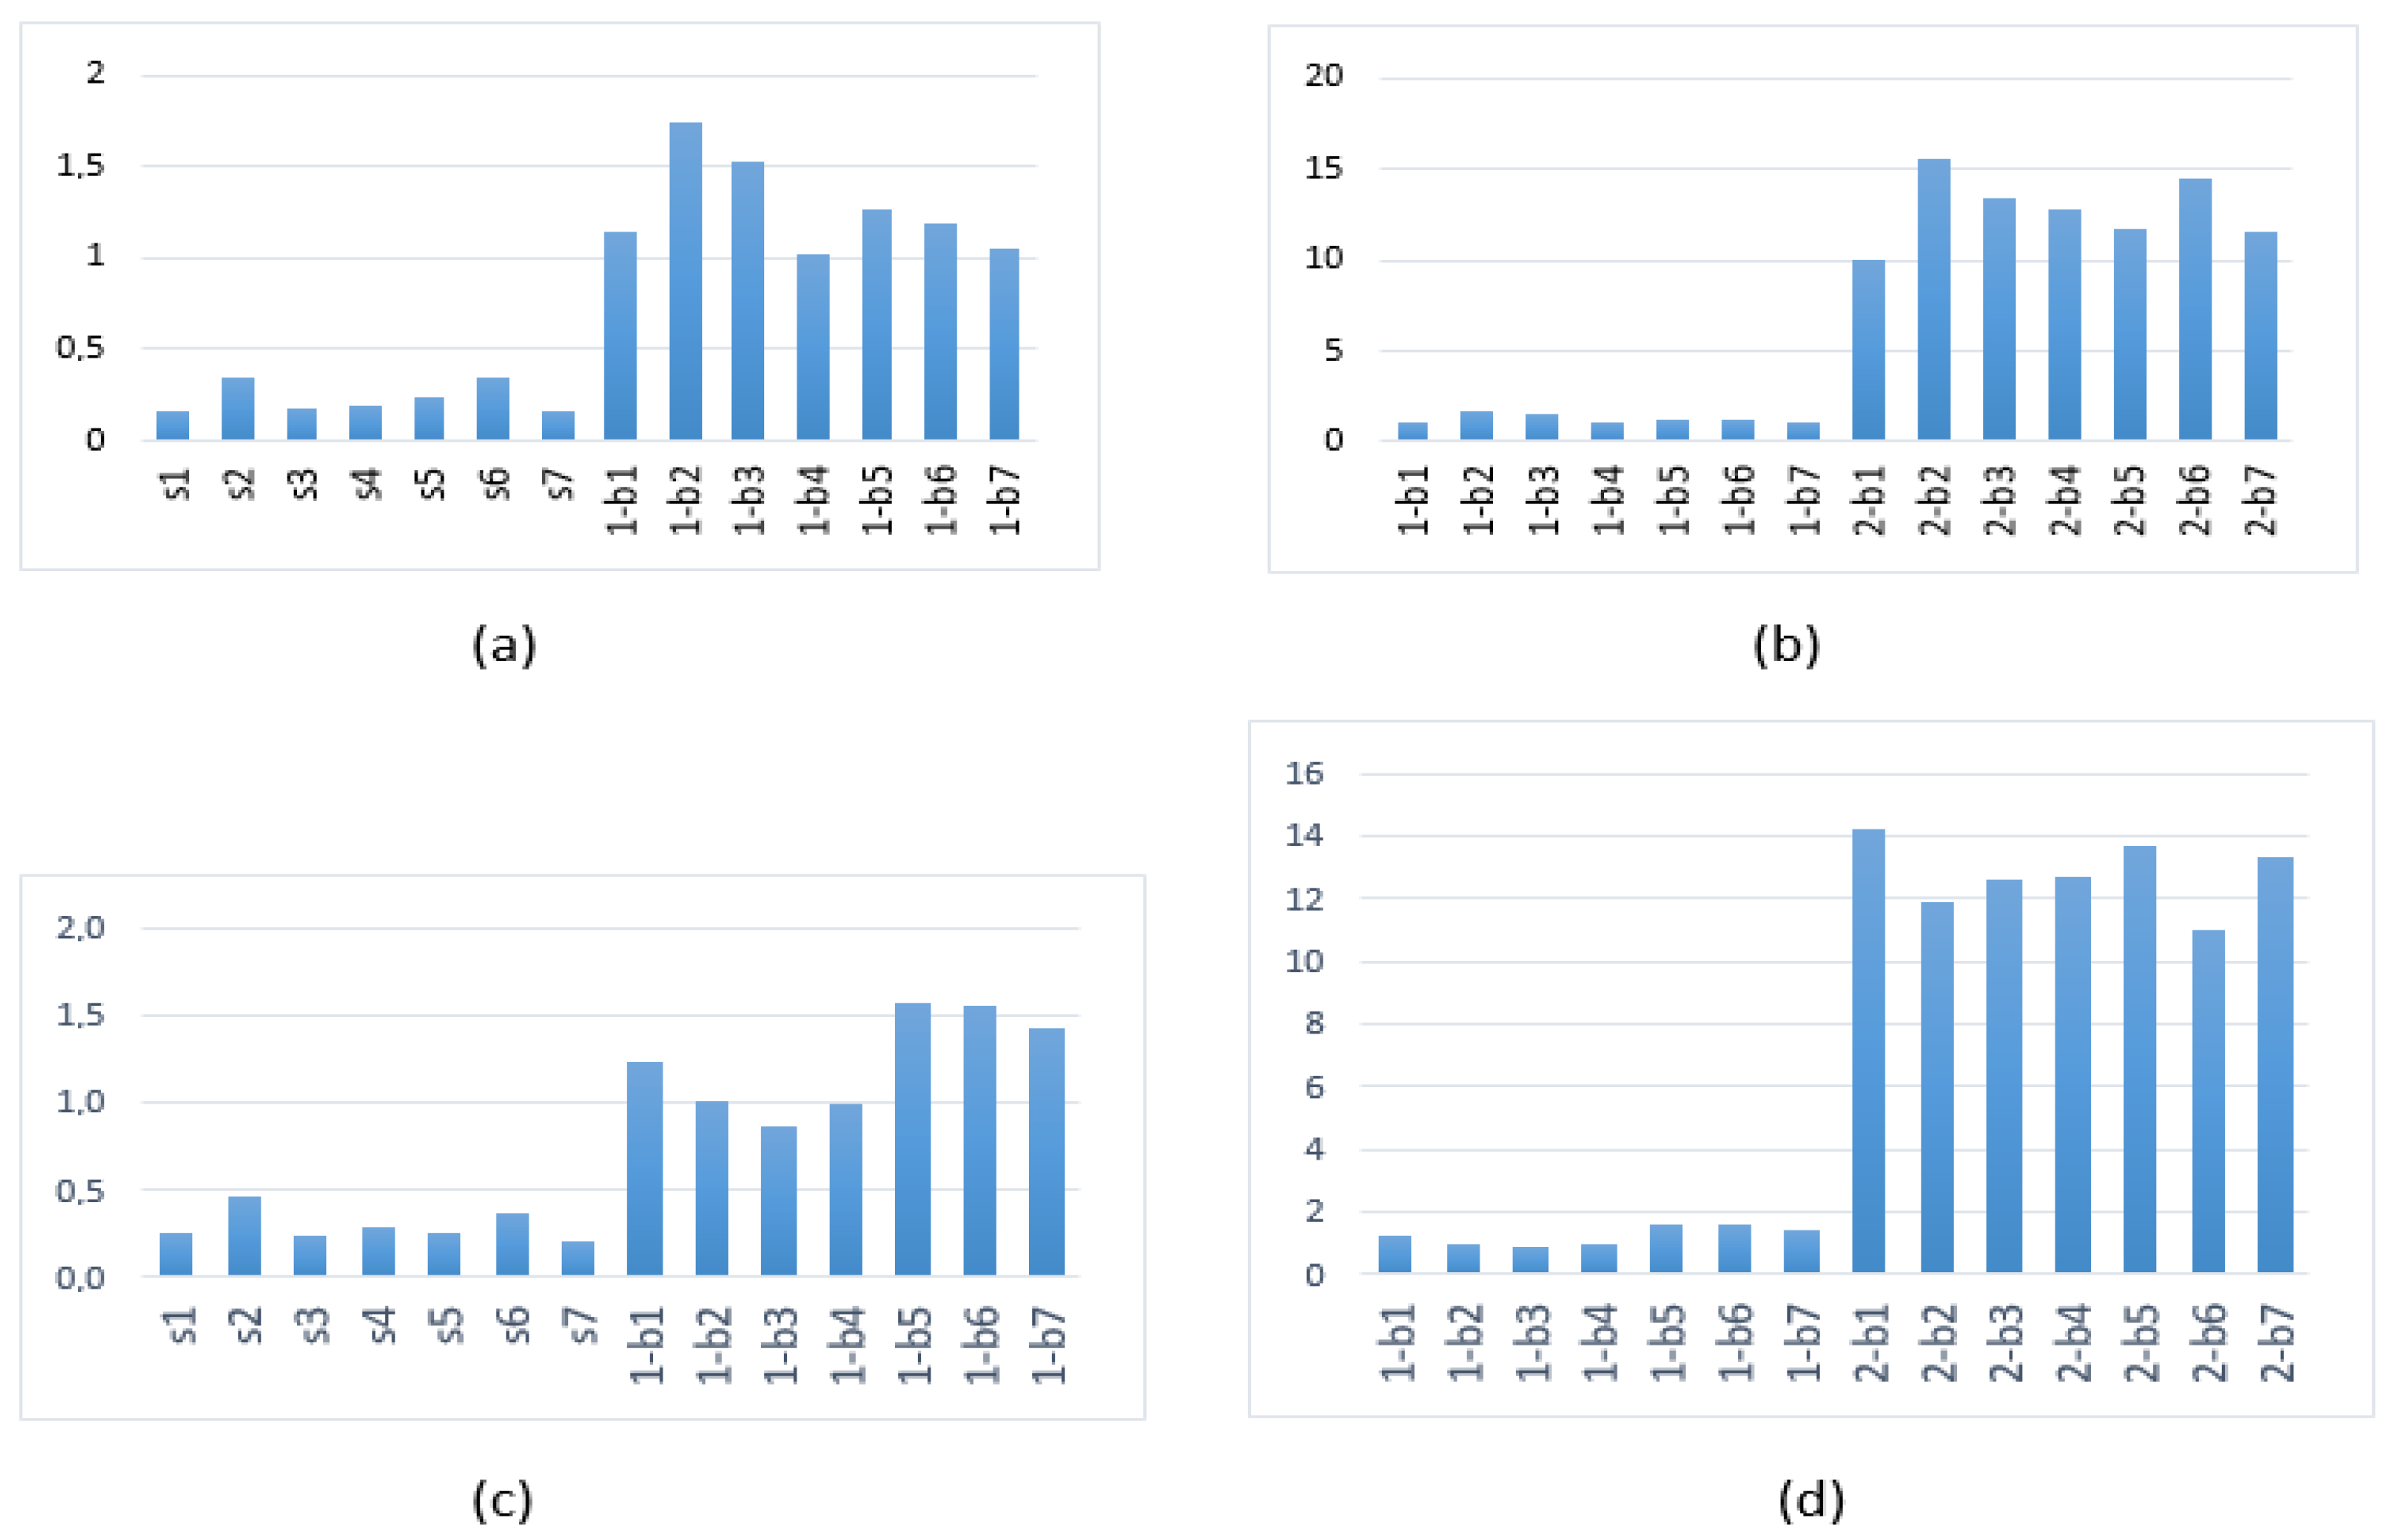
In Table 2, we show the results for the WP9 indicator for the Meyer’s wavelet obtained from the WP algorithm at level 9 described above for our set of signals. We specifically chose nodes 2, 3, and 4 for level 9 to cover the frequency range from 10 to 40 Hz. The global WP9 indicator is calculated using the values obtained from these nodes. A graphic representation of these results and comparison with the results obtained by using Daubechies 40 are shown in Figure 8.
Table 2.
Indicator values per node using the WP-based algorithm at level 9 and the global WP9 indicator by using the Meyer’s wavelet.
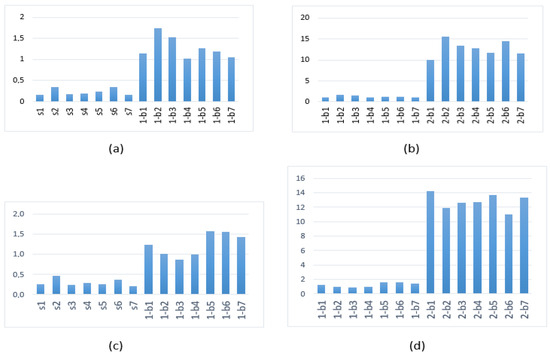
Figure 8.
WP9 indicator (a,b) for the Meyer’s wavelet and (c,d) for Daubechies 40. (a,c) Healthy vs. one broken bar and (b,d) one broken bar vs. two broken bars.
Note that in the DWT decomposition at level 9, the approximation sub-signal and the detail sub-signal are the same as the first two nodes (ordered by increasing frequencies) of the wavelet packet decomposition at level 9. This implies that the DWT9 indicator is equivalent to calculating a simpler WP9 indicator using exclusively node 2. Here, we observe the greater versatility offered by the wavelet wacket decomposition.
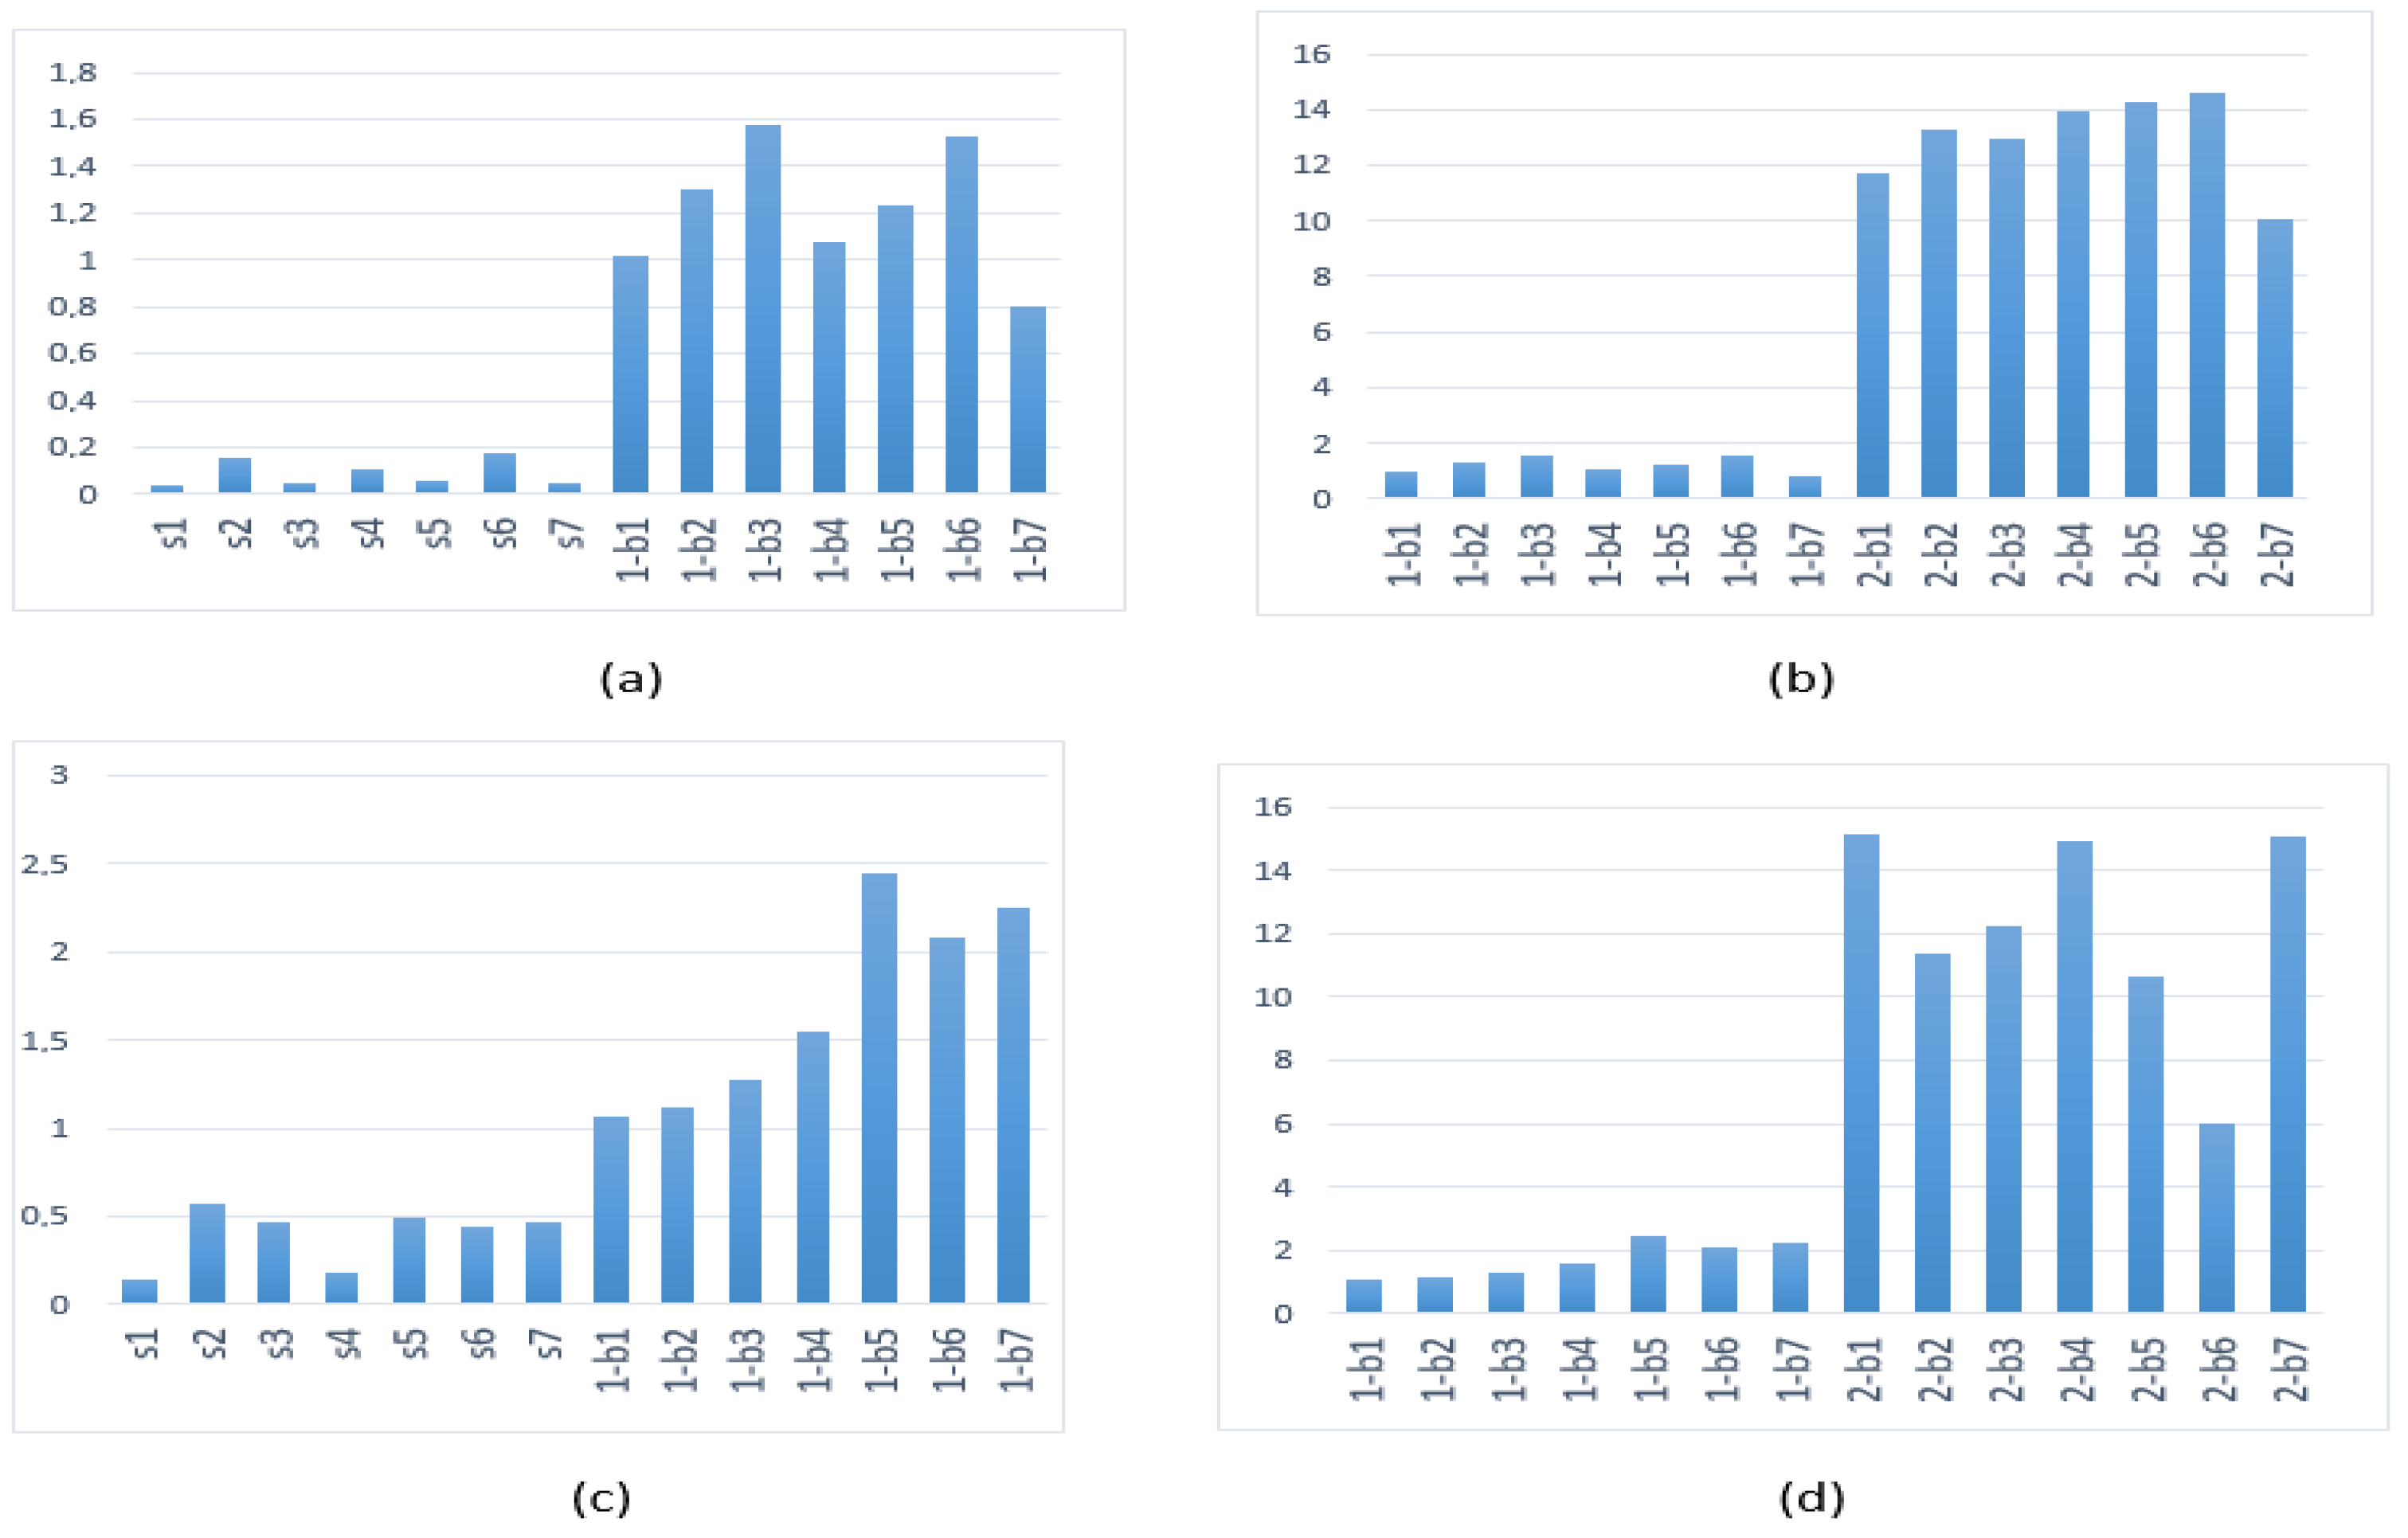
For the WP10 indicator, we consider from node 3 to node 7 to cover frequencies from 10 Hz to 34 Hz. The results are given in Table 3 and Figure 9 show the graphic representation and the comparison with the results with Daubechies 40.
Table 3.
Indicator values per node using the WP-based algorithm at level 10 and the global WP10 indicator by using the Meyer’s wavelet.

Figure 9.
WP10 indicator (a,b) for the Meyer’s wavelet and (c,d) for Daubechies 40. (a,c) Healthy vs. one broken bar and (b,d) one broken bar vs. two broken bars.
In Figure 8 and Figure 9, we compare these results based on the Meyer wavelet with the WP9 indicator and WP10 indicator obtained by using the Daubechies 40.
As a summary of the results, Table 4 shows the statistical data of the mean and standard deviation for each type of signal obtained from Table 1, Table 2 and Table 3. The data allow us to observe a significant jump in the values of any of the three indicators used, allowing an effective differentiation between a healthy signal and one with a single broken bar or two broken bars.
Table 4.
Mean and standard deviation () of the results for the DWT9 indicator, WP9 indicator, and WP10 indicator.
Finally, Table 5 shows the statistics for the indicators obtained by using the Daubechies 40.
Table 5.
Mean and standard deviation () of the results for the Daubechies 40’s DWT9 indicator, WP9 indicator, and WP10 indicator.
5. Conclusions
In this work, we proposed a novel approach for failure detection in induction motors using the wavelet packet transform. By leveraging the fine frequency analysis capabilities of wavelet packet decomposition, we achieved enhanced signal analysis and improved detection of bar breakage, a critical fault in the rotor bars of induction cage machines.
Our results demonstrate the effectiveness of the proposed approach, as evidenced by the good performance of our developed ’fault indicator’ in distinguishing between healthy and faulty signals. The wavelet packet transform, particularly when employing the ‘dmeyer’ wavelet, provided superior performance compared to other wavelet families such as the ‘symlet’ family.
Future research directions may involve evaluating the performance of our approach in the presence of additional operational and environmental factors. Furthermore, investigating the combination of wavelet packet analysis with other advanced signal processing techniques could potentially yield even more accurate and robust failure detection systems for induction motors.
In conclusion, our research highlights the effectiveness of the wavelet packet transform, particularly with the ‘dmeyer’ wavelet, in the failure detection of induction motors. The results obtained surpass those of previous works and showcase the potential for the real-world implementations of our approach for proactive maintenance and improved motor performance.
Author Contributions
Conceptualization, methodology, and investigation, J.A.A.-D., F.M.-G., A.P., N.R. and F.R. All authors have read and agreed to the published version of the manuscript.
Funding
The first author was funded by the Spanish Ministerio de Ciencia e Innovación, AEI and FEDER, in the framework of the Proyectos de Generación de Conocimiento 2021 of the “Programa Estatal para Impulsar la Investigación Científico-Técnica y su Transferencia”, belonging to the “Plan Estatal de Investigación Científica, Técnica y de Innovación 2021–2023” (ref: PID2021-122343OB-I00). For the second to last authors, this publication is part of the projects PID2019-105011GB-I00 and PID2022-139449NB-I00, funded by MCIN/AEI/10.13039/501100011033/FEDER, UE, and they were also supported by Generalitat Valenciana, Project PROMETEU/2021/070.
Data Availability Statement
The data will be made available by the authors on request.
Acknowledgments
We would like to thank the referees whose careful reports produced an improvement of the presentation of the article.
Conflicts of Interest
The authors declare no conflicts of interest.
References
- Haraguchi, N.; Cheng, C.F.C.; Smeets, E. The Importance of Manufacturing in Economic Development: Has This Changed? World Dev. 2017, 93, 293–315. [Google Scholar] [CrossRef]
- Nandi, S.; Toliyat, H. Condition monitoring and fault diagnosis of electrical machines—A review. In Proceedings of the Conference Record of the 1999 IEEE Industry Applications Conference. Thirty-Forth IAS Annual Meeting (Cat. No.99CH36370), Phoenix, AZ, USA, 3–7 October 1999; Volume 1, pp. 197–204. [Google Scholar] [CrossRef]
- Henao, H.; Capolino, G.A.; Fernandez-Cabanas, M.; Filippetti, F.; Bruzzese, C.; Strangas, E.; Pusca, R.; Estima, J.; Riera-Guasp, M.; Hedayati-Kia, S. Trends in Fault Diagnosis for Electrical Machines: A Review of Diagnostic Techniques. IEEE Ind. Electron. Mag. 2014, 8, 31–42. [Google Scholar] [CrossRef]
- Antonino-Daviu, J.; Riera-Guasp, M.; Roger-Folch, J.; Martínez-Giménez, F.; Peris, A. Application and optimization of the discrete wavelet transform for the detection of broken rotor bars in induction machines. Appl. Comput. Harmon. Anal. 2006, 21, 268–279. [Google Scholar] [CrossRef]
- Corral Hernández, J.; Antonino-Daviu, J.; Martínez-Giménez, F.; Peris, A. Comparison of different wavelet families for broken bar detection in induction motors. In Proceedings of the 2015 IEEE International Conference on Industrial Technology (ICIT), Seville, Spain, 17–19 March 2015; pp. 3220–3225. [Google Scholar] [CrossRef]
- Hu, W.; Cheng, Y. A Method for Fault Detection of Micro-Motors Based on Wavelet Packet Energy Spectra. In Proceedings of the 2019 10th International Conference on Information Technology in Medicine and Education (ITME), Qingdao, China, 23–25 August 2019; pp. 579–582. [Google Scholar] [CrossRef]
- Talhaoui, H.; Ameid, T.; Aissa, O.; Kessal, A. Wavelet packet and fuzzy logic theory for automatic fault detection in induction motor. Soft Comput. 2022, 26, 11935–11949. [Google Scholar] [CrossRef] [PubMed]
- Zarei, J.; Poshtan, J. Bearing fault detection using wavelet packet transform of induction motor stator current. Tribol. Int. 2007, 40, 763–769. [Google Scholar] [CrossRef]
- Martinez-Herrera, A.L.; Ferrucho-Alvarez, E.R.; Ledesma-Carrillo, L.M.; Mata-Chavez, R.I.; Lopez-Ramirez, M.; Cabal-Yepez, E. Multiple Fault Detection in Induction Motors through Homogeneity and Kurtosis Computation. Energies 2022, 15, 1541. [Google Scholar] [CrossRef]
- Pasqualotto, D.; Navarro Navarro, A.; Zigliotto, M.; Antonino-Daviu, J.A. Automatic Detection of Rotor Faults in Induction Motors by Convolutional Neural Networks applied to Stray Flux Signals. In Proceedings of the 2021 22nd IEEE International Conference on Industrial Technology (ICIT), Valencia, Spain, 10–12 March 2021; Volume 1, pp. 148–153. [Google Scholar] [CrossRef]
- Rivera-Guillen, J.R.; De Santiago-Perez, J.; Amezquita-Sanchez, J.P.; Valtierra-Rodriguez, M.; Romero-Troncoso, R.J. Enhanced FFT-based method for incipient broken rotor bar detection in induction motors during the startup transient. Measurement 2018, 124, 277–285. [Google Scholar] [CrossRef]
- Daubechies, I. Ten Lectures on Wavelets; CBMS-NSF Regional Conference Series in Applied Mathematics; Society for Industrial and Applied Mathematics (SIAM): Philadelphia, PA, USA, 1992; Volume 61, p. xx+357. [Google Scholar] [CrossRef]
- Flandrin, P. Time-Frequency/Time-Scale Analysis; Wavelet Analysis and Its Applications; With a Preface by Yves Meyer, Translated from the French by Joachim Stöckler; Academic Press, Inc.: San Diego, CA, USA, 1999; Volume 10, p. xii+386. [Google Scholar]
- Mallat, S. A Wavelet Tour of Signal Processing, 3rd ed.; Elsevier/Academic Press: Amsterdam, The Netherlands, 2009; p. xxii+805. [Google Scholar]
- Meyer, Y. Wavelets and Operators; Cambridge Studies in Advanced Mathematics; Translated from the 1990 French Original by D. H. Salinger; Cambridge University Press: Cambridge, UK, 1992; Volume 37, p. xvi+224. [Google Scholar]

Disclaimer/Publisher’s Note: The statements, opinions and data contained in all publications are solely those of the individual author(s) and contributor(s) and not of MDPI and/or the editor(s). MDPI and/or the editor(s) disclaim responsibility for any injury to people or property resulting from any ideas, methods, instructions or products referred to in the content. |
© 2024 by the authors. Licensee MDPI, Basel, Switzerland. This article is an open access article distributed under the terms and conditions of the Creative Commons Attribution (CC BY) license (https://creativecommons.org/licenses/by/4.0/).