
A Bidirectional Arabic Sign Language Framework Using Deep Learning and Fuzzy Matching Score

 ,
,  , and
, and
Abstract
1. Introduction
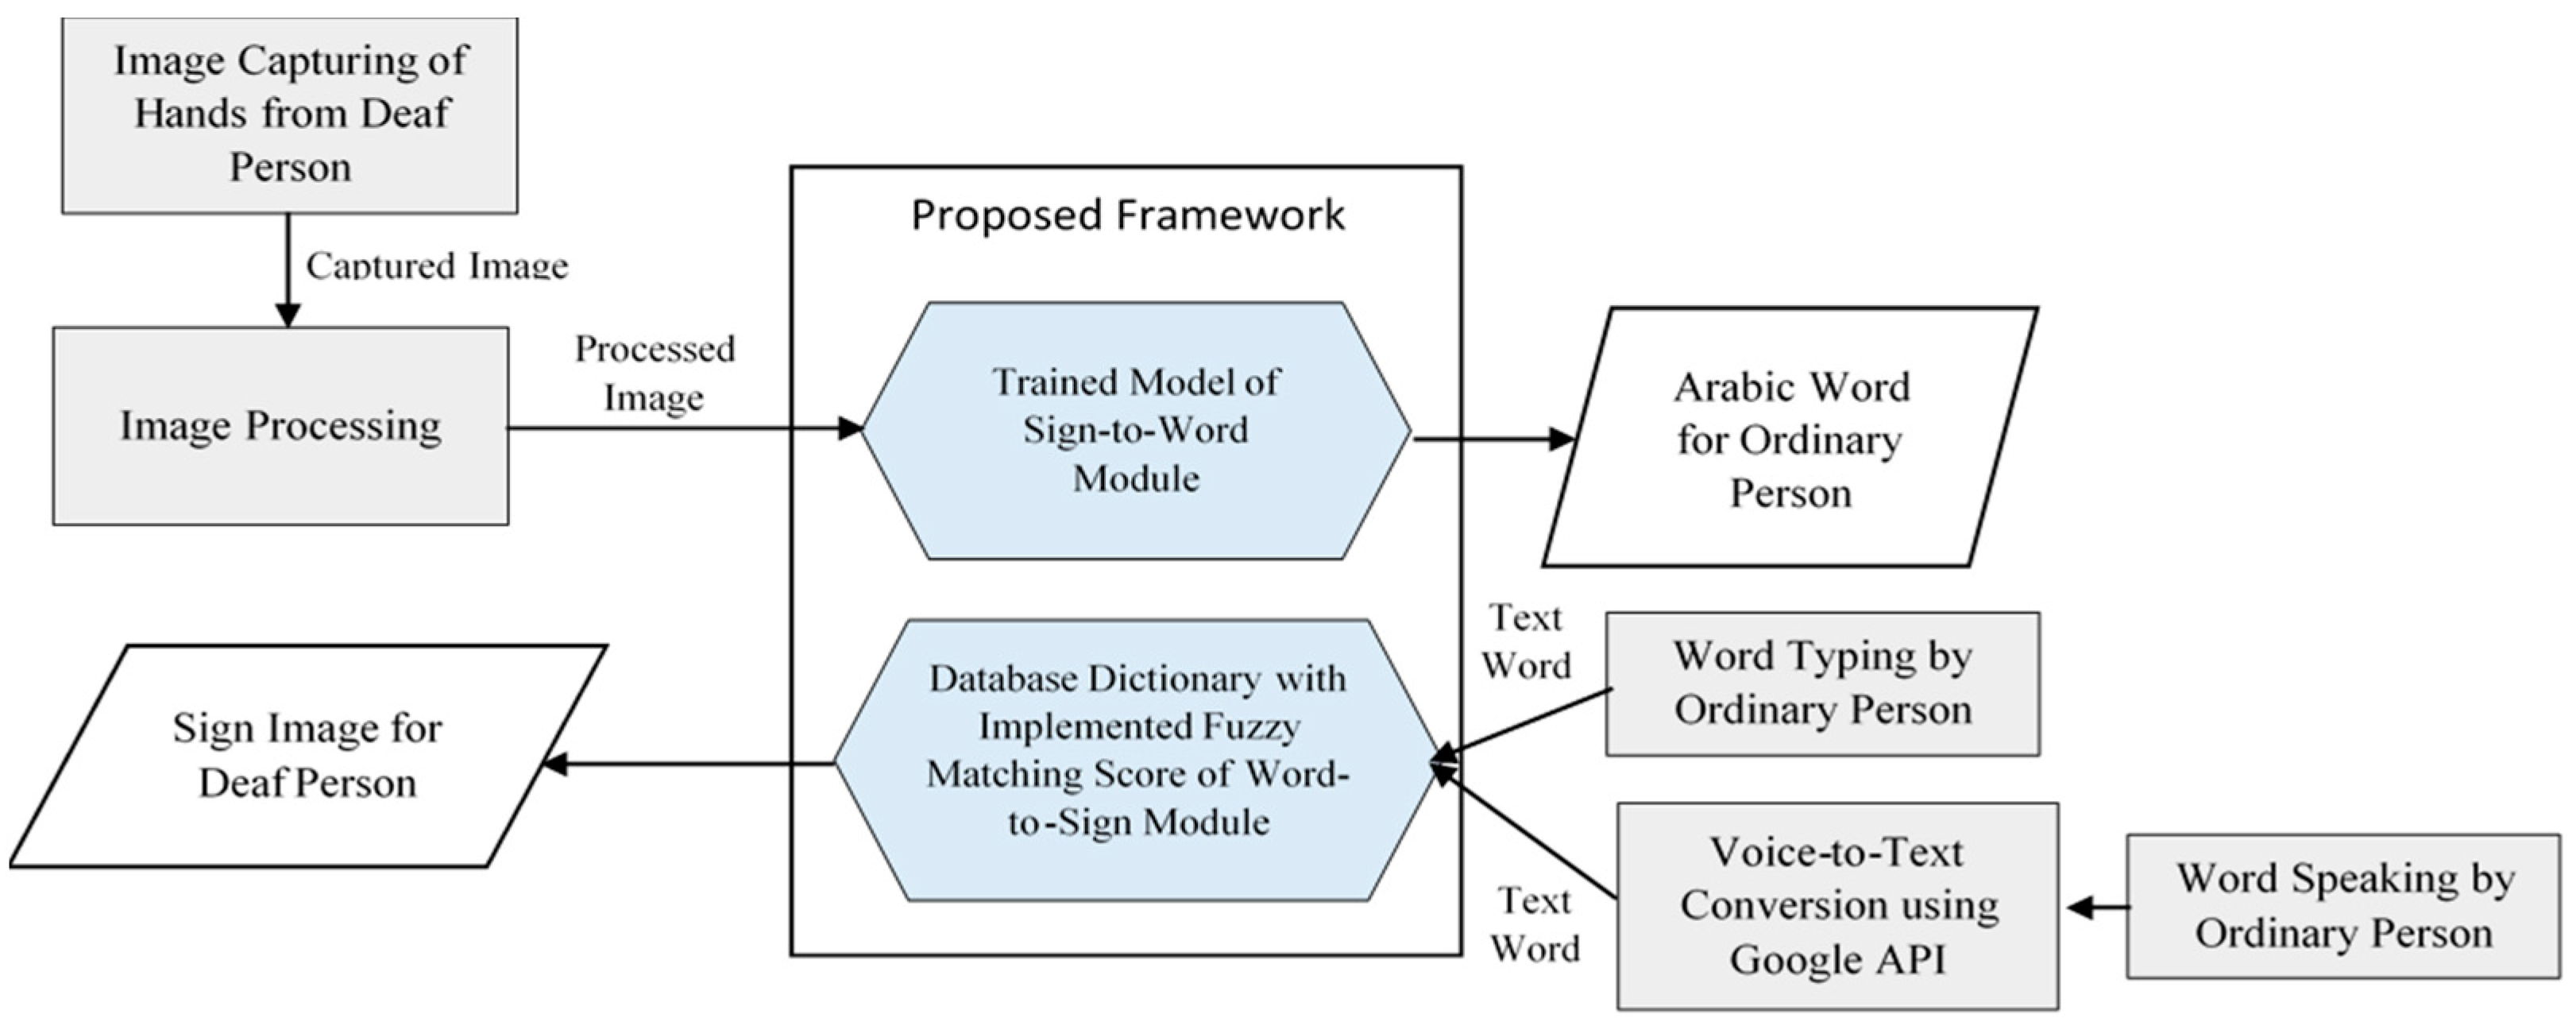
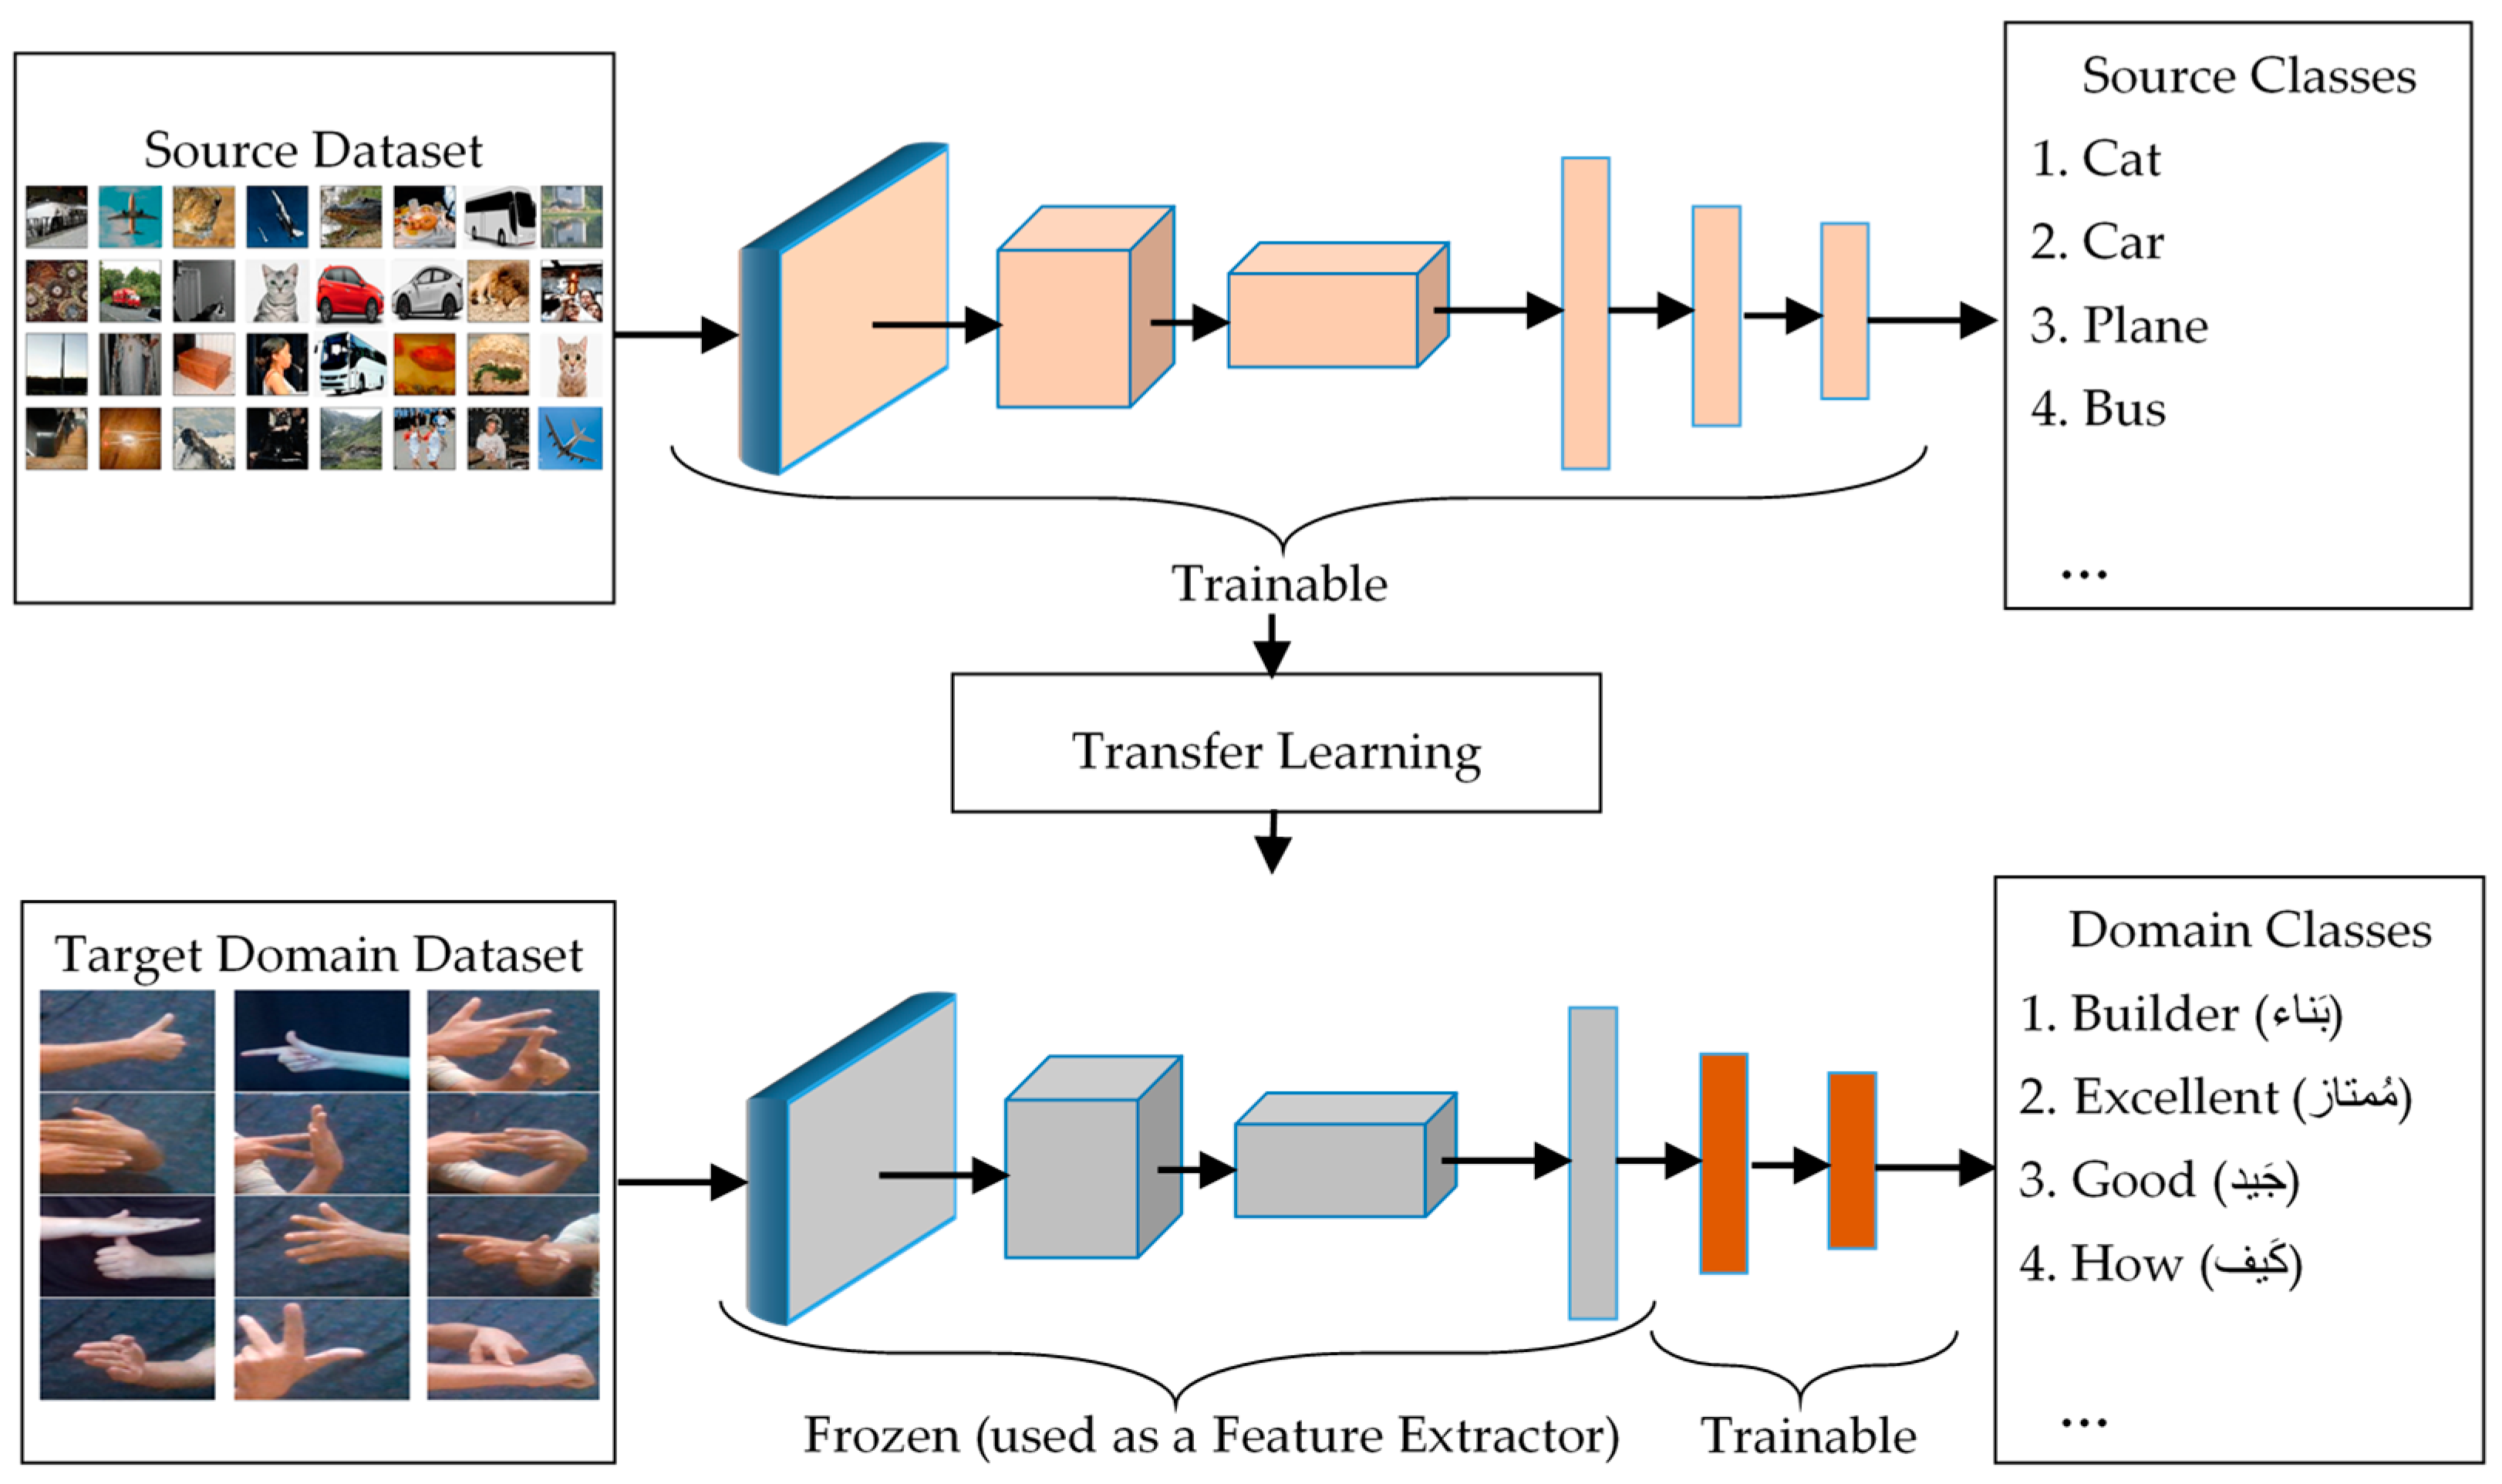
- Proposing a bidirectional Arabic sign translation framework using image processing approaches, CNN transfer learning, and the fuzzy string matching score method.
- Extracting the essential features of Arabic sign images using several effective transfer learning-based pre-trained CNN models.
- Designing a lightweight, efficient, and optimized Custom DNN model to classify Arabic sign language images into corresponding Arabic text words. The Custom DNN model is built with a minimum number of hidden layers and neurons.
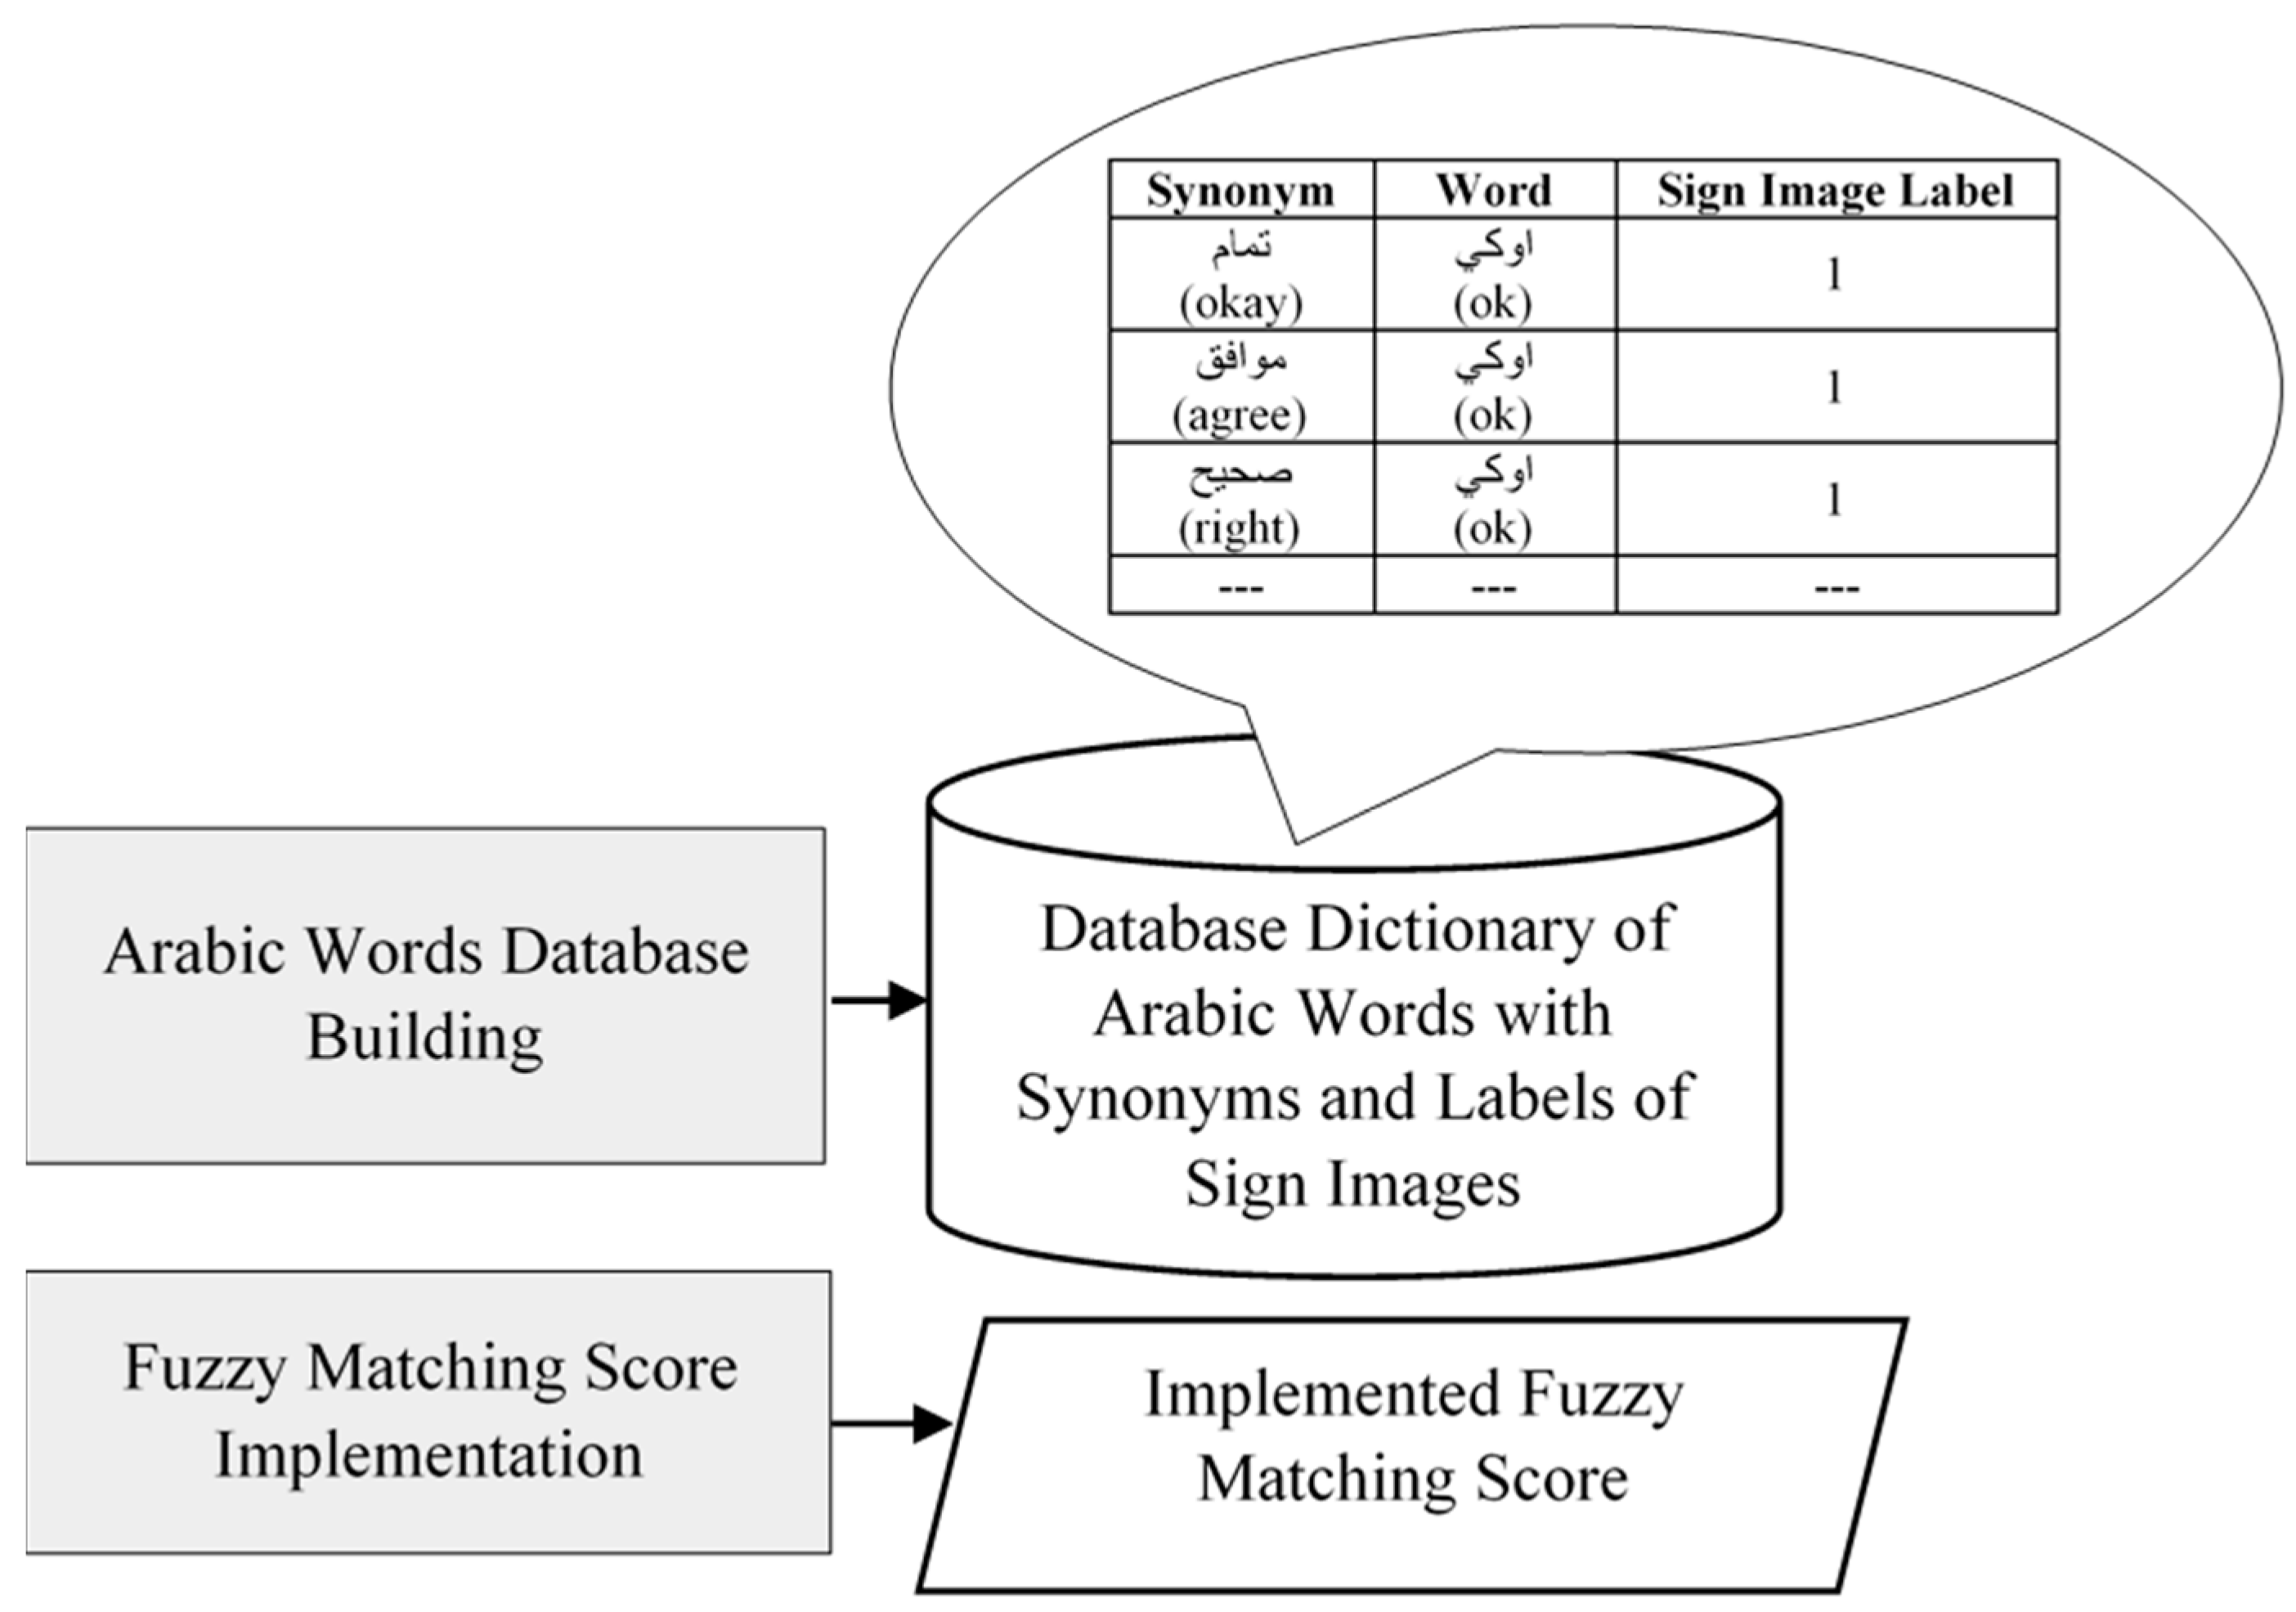
- Developing a fuzzy string matching score-based method to translate Arabic words’ synonyms and spelling errors into appropriate and meaningful Arabic sign language images.
- Constructing an ArSL dataset containing a large number of Arabic sign images of Arabic words that can be used for further research to enhance the ArSL recognition techniques.
- Evaluating the performance and efficiency of the ArSL prototype for each module individually.
2. Literature Review
3. Preliminaries
3.1. Deep Neural Networks (DNNs)
- Rectifiable Linear Unit (ReLU):
- Step function:
- Sigmoid function:
3.2. Fuzzy Set and Fuzzy String Matching Score
4. Proposed Framework
4.1. Sign-to-Word Module
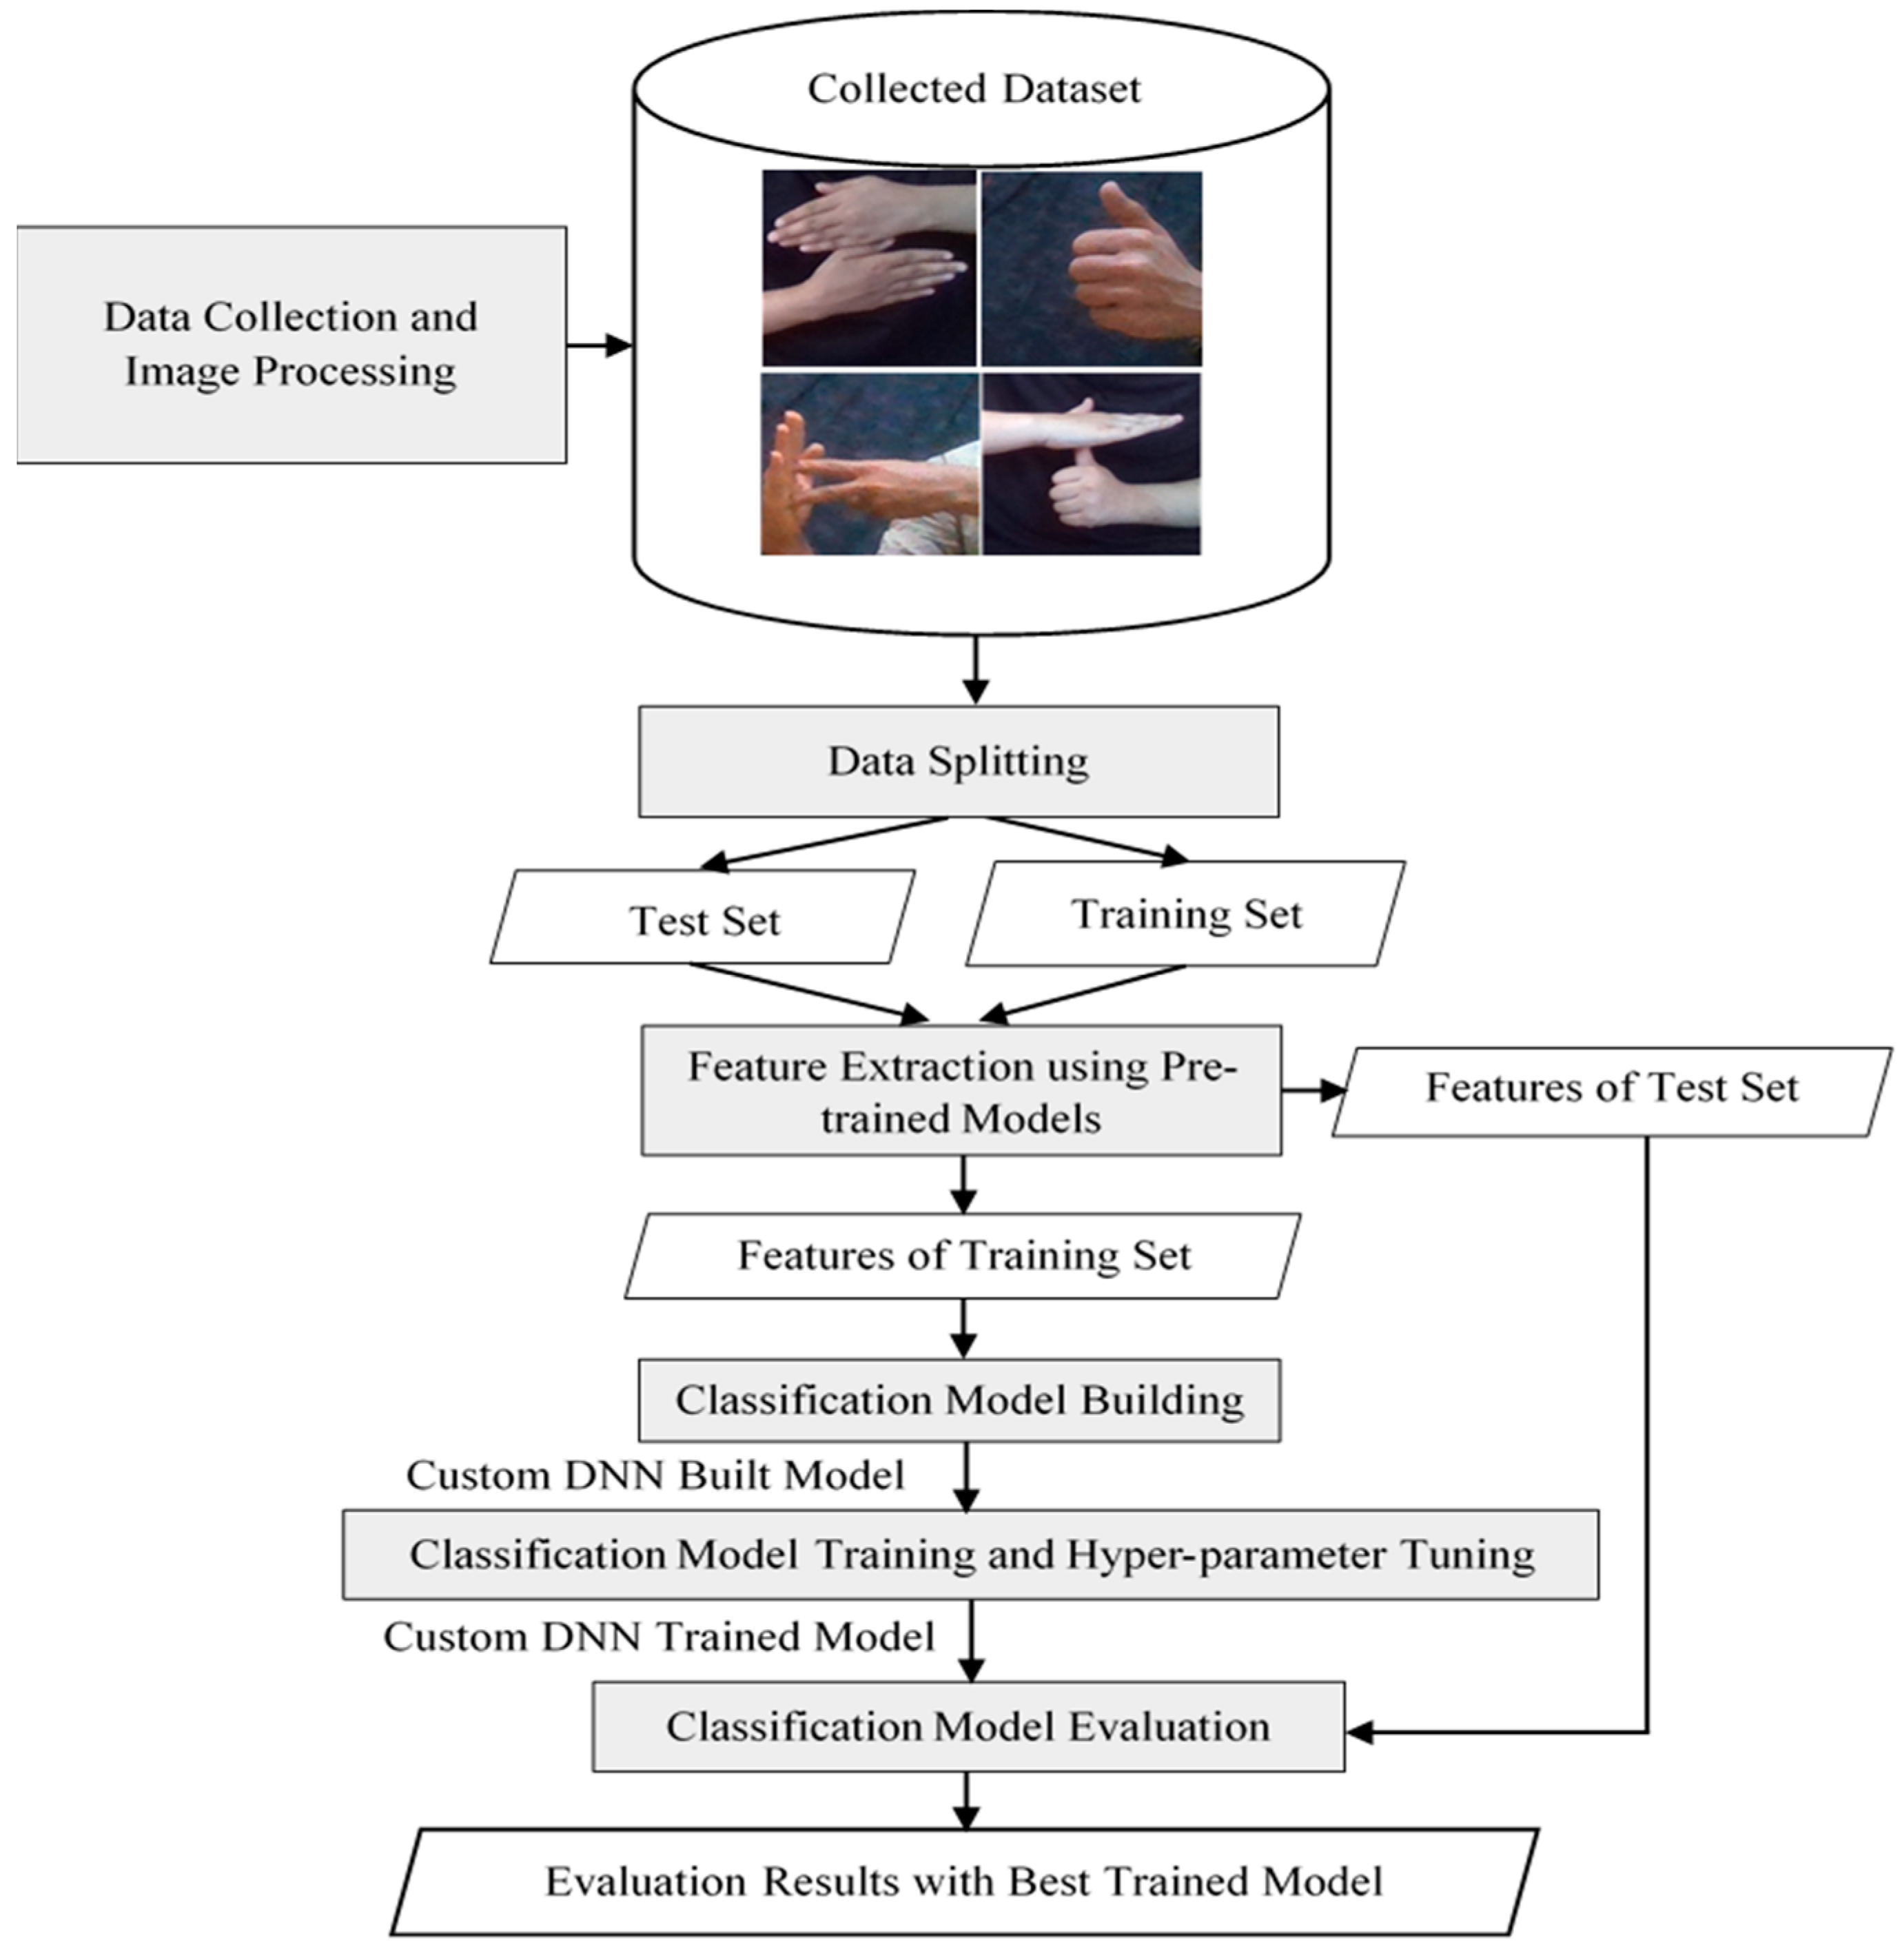
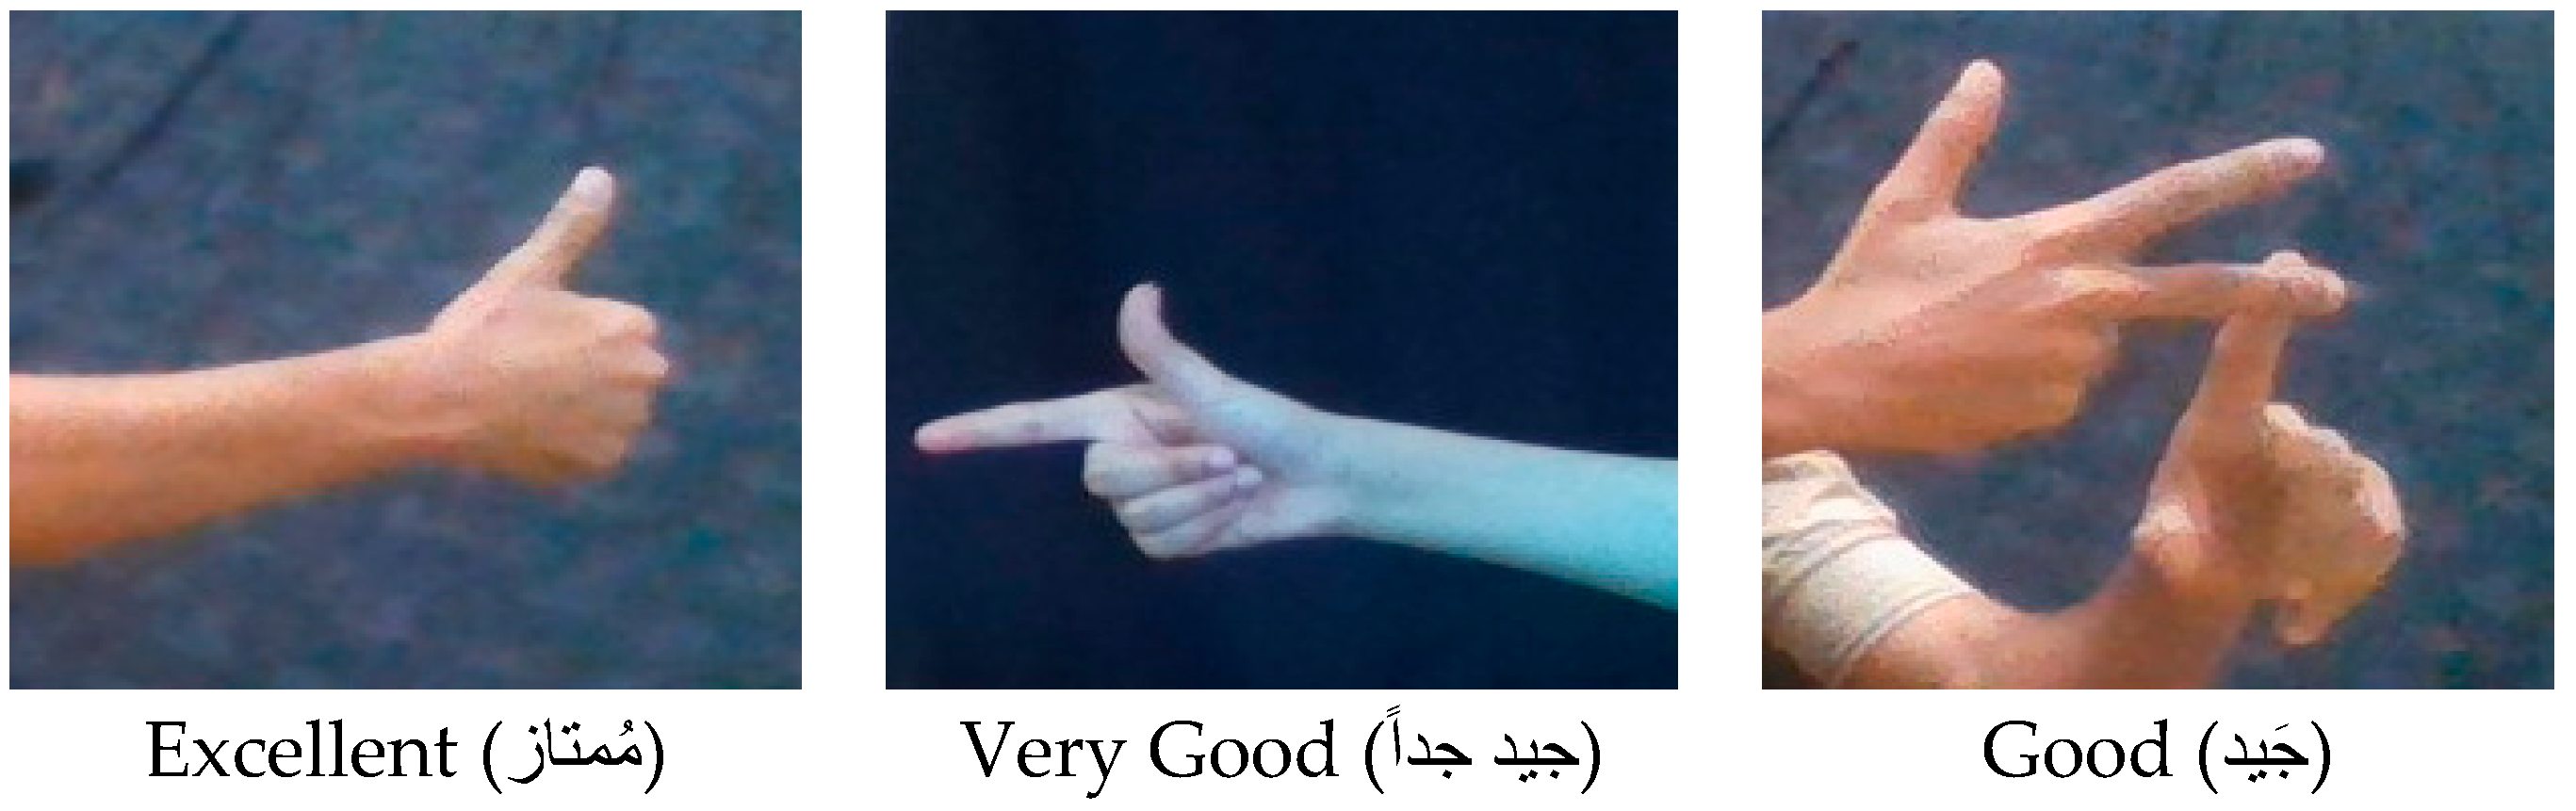
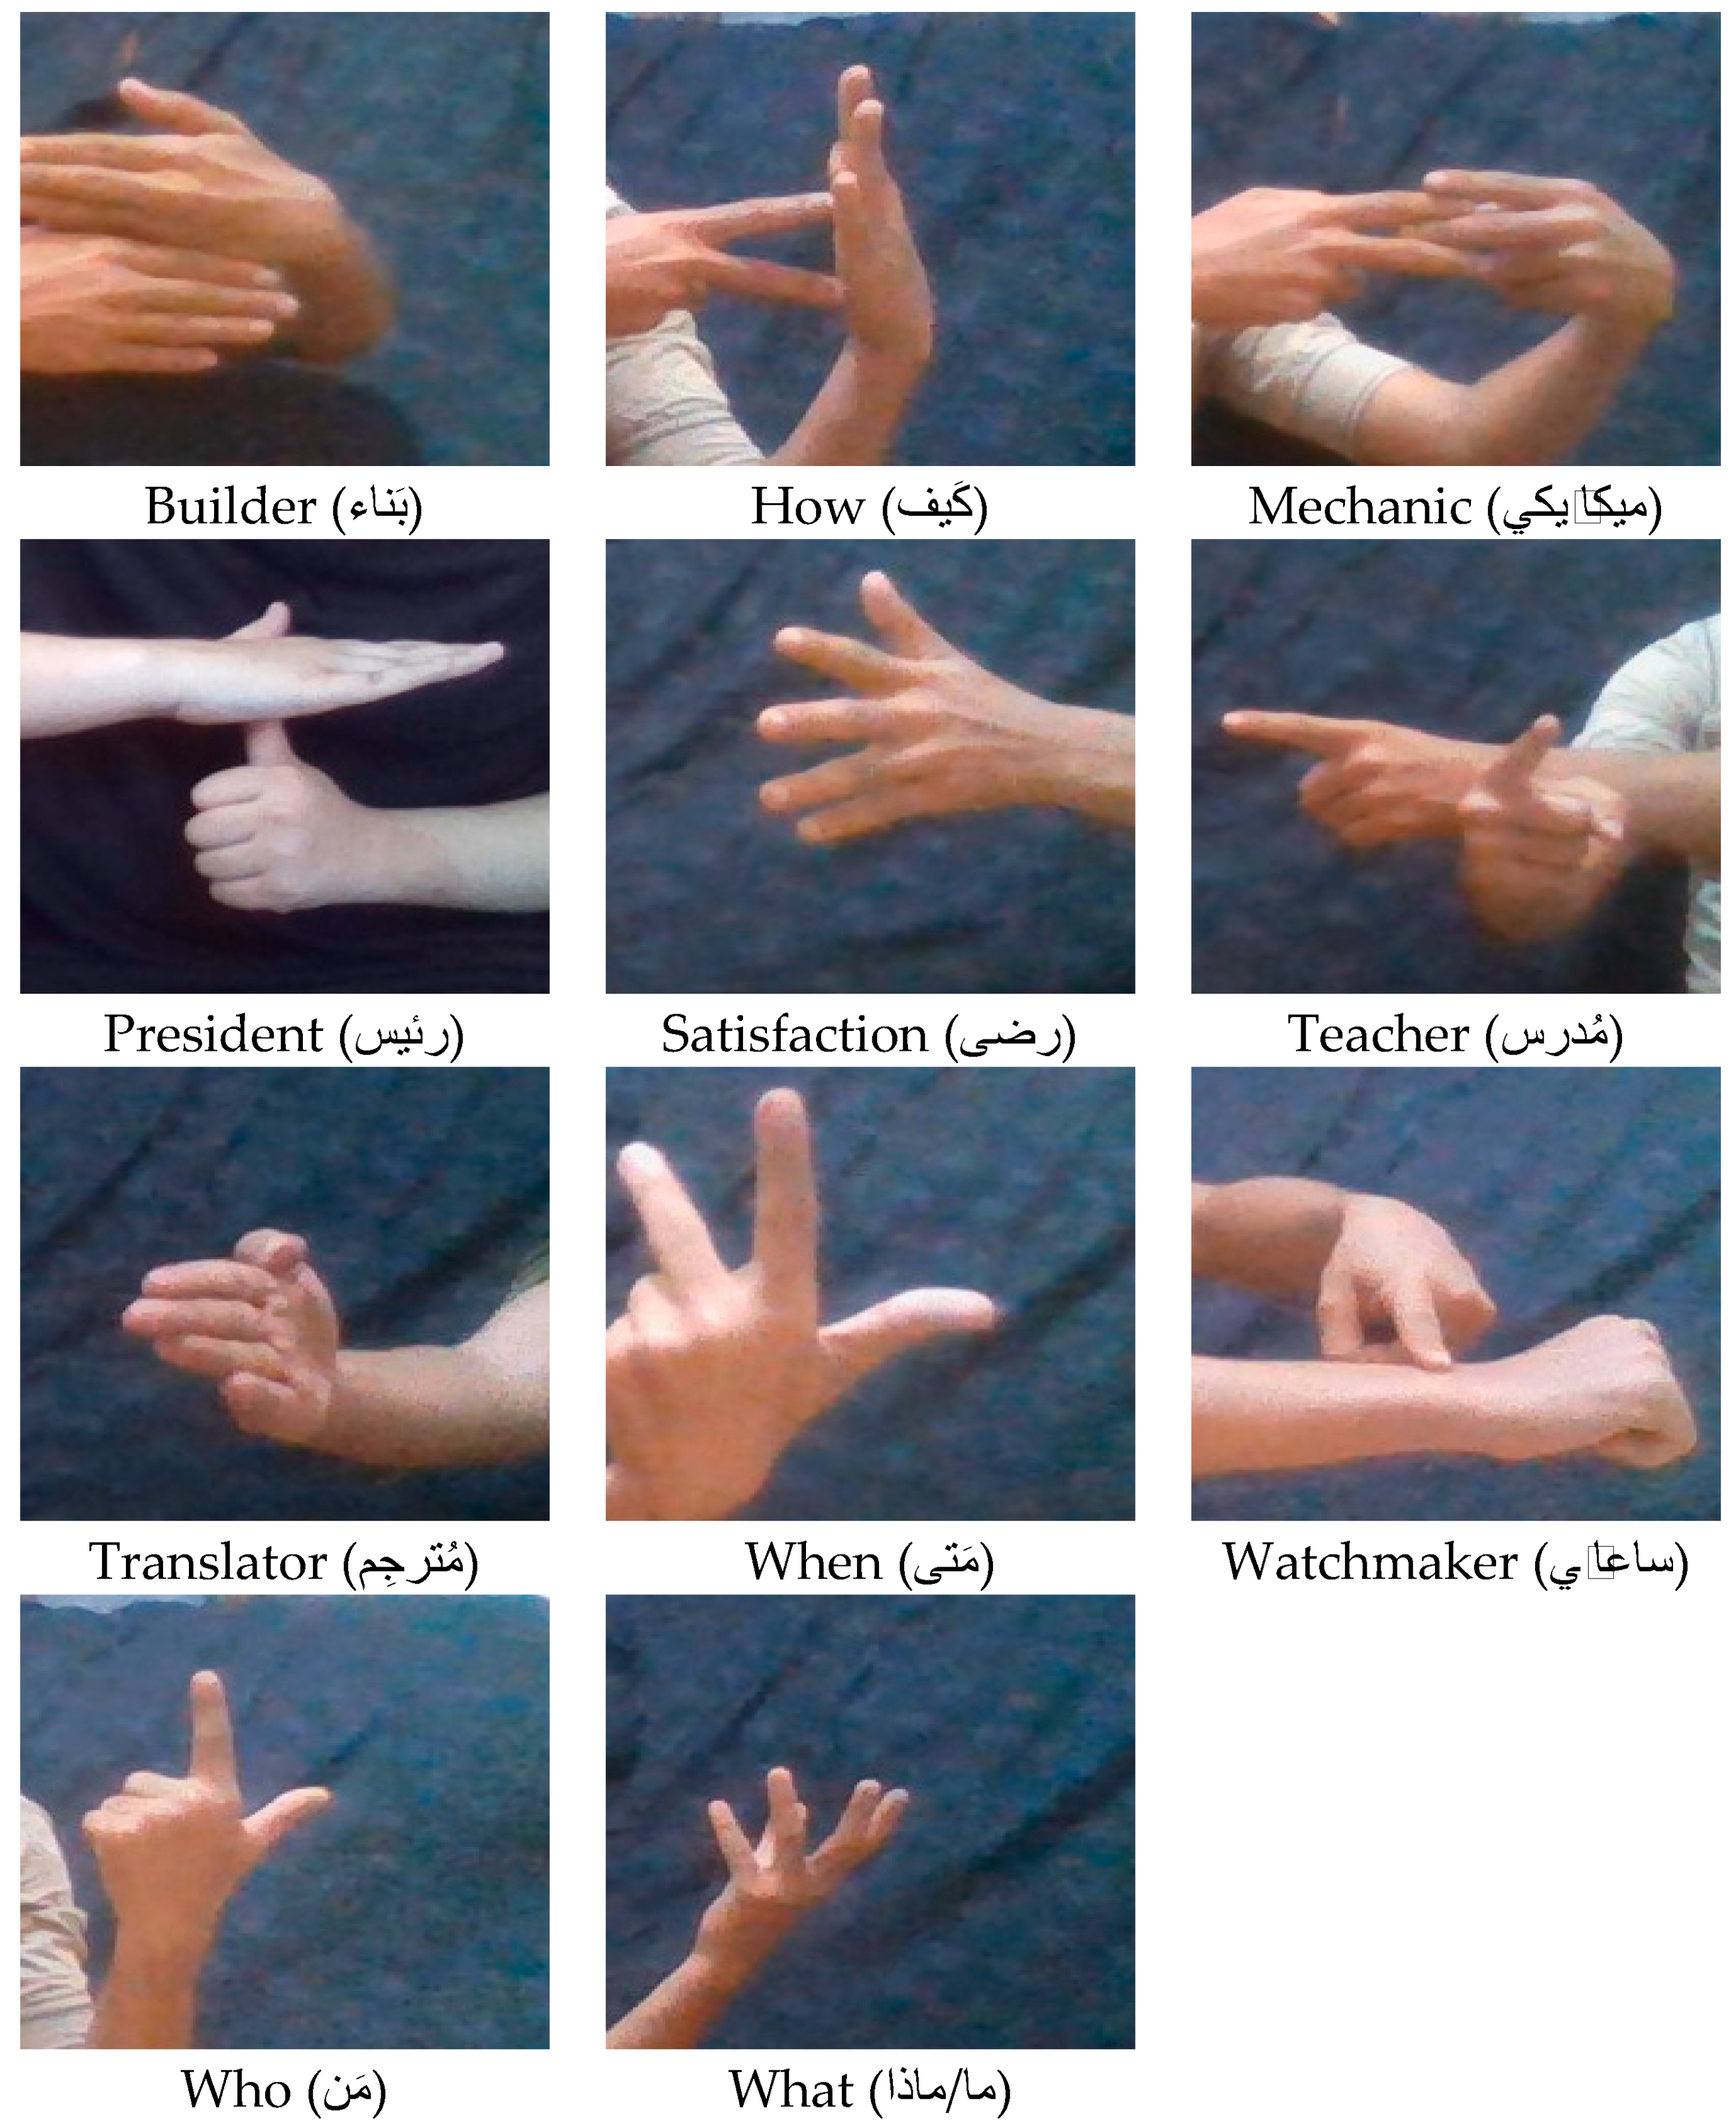
4.1.1. Dataset Collection and Image Processing
- Hand signs taken represented different words only without any facial expression.
- Deaf and ordinary people captured the dataset’s hand-sign images to represent bidirectional ArSL translation.
- The dataset images included different hand gestures, moves, and positions.
- The dataset images were captured by using the front camera of a Samsung Android system to represent real-time translation between deaf and ordinary people.
- The dataset hand images were captured from different distances, angles, backgrounds, and light sources.
- The dataset’s hand images were taken with good image quality and hand-sign focus.
4.1.2. Data Splitting
4.1.3. Feature Extraction Using Pre-Trained Models
- DenseNet121 ModelDenseNet121 is a CNN-based model architecture introduced in 2016 by Huang et al. [56] to achieve high performance in image classification tasks. It provides accessible communication between layers within the condensed block, facilitating extensive reusing between layers by allowing each layer to access feature maps with the previous layer. Research has reported that the DenseNet121 model is suitable because it is less prone to over-fitting and adaptability for a broad type of domain [57]. It has recently been used widely in many transfer learning-based applications. DenseNets models are developed with bottleneck blocks to include fewer parameters than the other traditional models without the need to learn redundant feature maps. The dense block of DenseNets solves some training issues by allowing each layer to access the gradients directly from the loss function, and the input image. It introduces dense connections between layers, where each layer receives the feature maps from all preceding layers. The feature maps are concatenated along the channel dimension. The mathematical expression for the dense block in DenseNet is given as:where denotes the output feature maps of thelayer.
- ResNet152 ModelResNet152 is a CNN-based model introduced in 2015 and designed with 152 hidden layers. This model is efficient for image feature extraction with more robotic accuracy results. The main issue with this model is its size and time limitations; however, it is considered adequate for training deep networks with less complex computation. We trained this model using a set of layers: Sequential, Conv2d, BatchNorm2d, Maxpool2d, and Bottleneck, with Adam optimizer and softmax activation function [58]. ResNet introduces residual connections that allow the model to learn residual mappings, making it easier to optimize deep networks. The residual block in ResNet can be expressed mathematically as:whererepresents the input to the layer, is the output of the lth layer, and denotes the residual mapping.
- MobileNetV2 ModelMobileNetV2 is a computationally efficient CNN, a more robust and efficient convolution neural network, designed to work on mobile devices. MobileNetV2 is upgraded from the MobileNetV1 model with a slight difference in structure, which contributes to its effectiveness by reducing complexity cost and network model size. The structure layer of this model consists of 32 filter layers followed by 19 residual bottleneck layers. The first layer is called the expansion layer, which has a 1 × 1 convolution layer that widens the channels; the second layer is a deep convolution layer and input filtering; and the third layer, called the drop layer, is a 1 × 1 raster convolution [59]. MobileNet is designed for efficiency and low computational cost by employing depth-wise separable convolutions. The mathematical expression for a depth-wise separable convolution in MobileNet is given as:where represents a standard convolution operation on input, and represents depth-wise convolution.
- Xception ModelIt is a deep convolutional neural network developed by Google with a depth-wise separable convolution model and shortcuts between convolution blocks. It’s an interpretation of Inception modules to be used as an intermediate step in regular convolution and the depth-wise separable convolution operation. The depth-wise separable convolution is considered an Inception module with many towers. This algorithm uses depth-wise separable convolutions to replace the Inception model and develop a novel deep convolutional neural network. It is perceived to be much more efficient in computation time [60]. XceptionNet is an extension of the Inception module that replaces the standard convolutional layers with depth-wise separable convolutions. The mathematical expression for a depth-wise separable convolution operation in XceptionNet is given as:whererepresents a standard convolution operation on input and represents depth-wise convolution.
- Inception-v3 ModelIt is a convolutional neural network architecture in the Inception family built with several improvements on existing Inception CNN models. The improvement of the model concerns label smoothing, factorized 7 × 7 convolutions, and an auxiliary classifier to propagate label information. Inception-v3 is a CNN model built for image recognition that achieves greater than 78.1% accuracy on the ImageNet dataset. Multiple researchers have developed it over the last few years. It includes symmetric and asymmetric building blocks with convolutions, max pooling, average pooling, concatenations, dropouts, and fully connected layers. It uses batch normalization for activation inputs, where softmax is used to compute loss [61]. It combines the Inception module with residual connections, leveraging the benefits of both architectures. The mathematical expression for an Inception-residual block is written as:where represents the input to the lth layer, denotes the output of the Inception module, anddenotes the residual mapping.
- NASNetLarge ModelNASNetLarge is a convolutional neural network design that uses the concept of neural architecture search and includes standard and reduction convolution cell blocks. The neural architecture search (NAS) is built to find the optimal CNN architecture automatically using Reinforcement Learning. It is built with the concepts of searching for the best parameter combination for the given search space, output channels, number of layers, and strides. Reinforcement learning is used to find the accuracy of the searched architecture on the given dataset. NASNet emphasizes the automated feature learning process, architecture search, and hyper-parameter optimization. Research has shown that NASNet achieved excellent results on the ImageNet dataset. However, it required high computation power. It is used mainly to search for the best algorithm to achieve the best performance on a specific task [62]. NASNet typically consists of repeated blocks containing convolutional, pooling, batch normalization (BatchNorm), concatenation, and fully connected layers. These blocks are stacked on top of each other to form the overall architecture. The mathematical expression of batch normalization and concatenation layers is given below:Given an input tensor , the output of a batch normalization layeris given by:whereis computed by normalizing the activations across each mini-batch.Givenare the inputs to be concatenated, the output of a concatenation layeris obtained by concatenating the tensors along the channel dimension as:whereis computed by combining the outputs of multiple preceding layers along the channel dimension.
- VGG16 ModelThe Visual Geometry Group (VGG) is known for its simplicity and effectiveness, with a stack of convolutional layers followed by fully connected layers. Mathematical expression for the VGG block can be viewed as:where denotes a convolutional layer with a kernel and 64 output channels, represents max pooling, and represents fully connected layers.Several versions of VGG Nets have been released, such as VGG16 and VGG19. They mostly have differences, with only the total number of layers included in the network architecture. The VGG16 model is one of the CNN-based models reported as the most successful top image recognition technique with optimized performance due to its acceleration architectural design. It is designed mainly to reduce the parameters used in the CONV layers to improve training time. It contains 16 layers, including 3 × 3 filter layers with a stride 1 and the same padding and max pool layers of a 2 × 2 filter with a stride 2 [58].
- VGG19 modelVGG19 is another version of VGG Nets, considered an extension of VGG16. It is built with 19 layers instead of 16 layers used in VGG16. It contains the same architecture as VGG16, with three additional convolutional and max-pooling layers. Research reported that VGG19 had achieved slightly better performance than VGG16 on various image recognition applications; however, it is more computationally expensive due to the more significant number of involved parameters [61].
4.1.4. Classification Model Building
| Algorithm 1 Custom DNN Architecture Building Algorithm |
| Input: input shape; # the number of neurons in the input layer # is the shape of extracted bottleneck features from # pre-trained CNN feature extractors. # It will be like (filter size of height, # filter size of width, number of channels). H; # the number of hidden layers. L; # the number of neurons in the output layer. Output: M; # it is the built custom DNN model. 1. Begin 2. Set model M as sequential 3. M add(GlobalAveragePooling2D(input_shape) 4. for i = 1 to H 5. Set N as a suitable number of neurons 6. M add(Dense(N, activation = ‘relu’) 7. end for 8. M add(Dropout(0.5)) 9. M add(Dense(L, activation = ‘softmax’) 10. return M; 11. End |
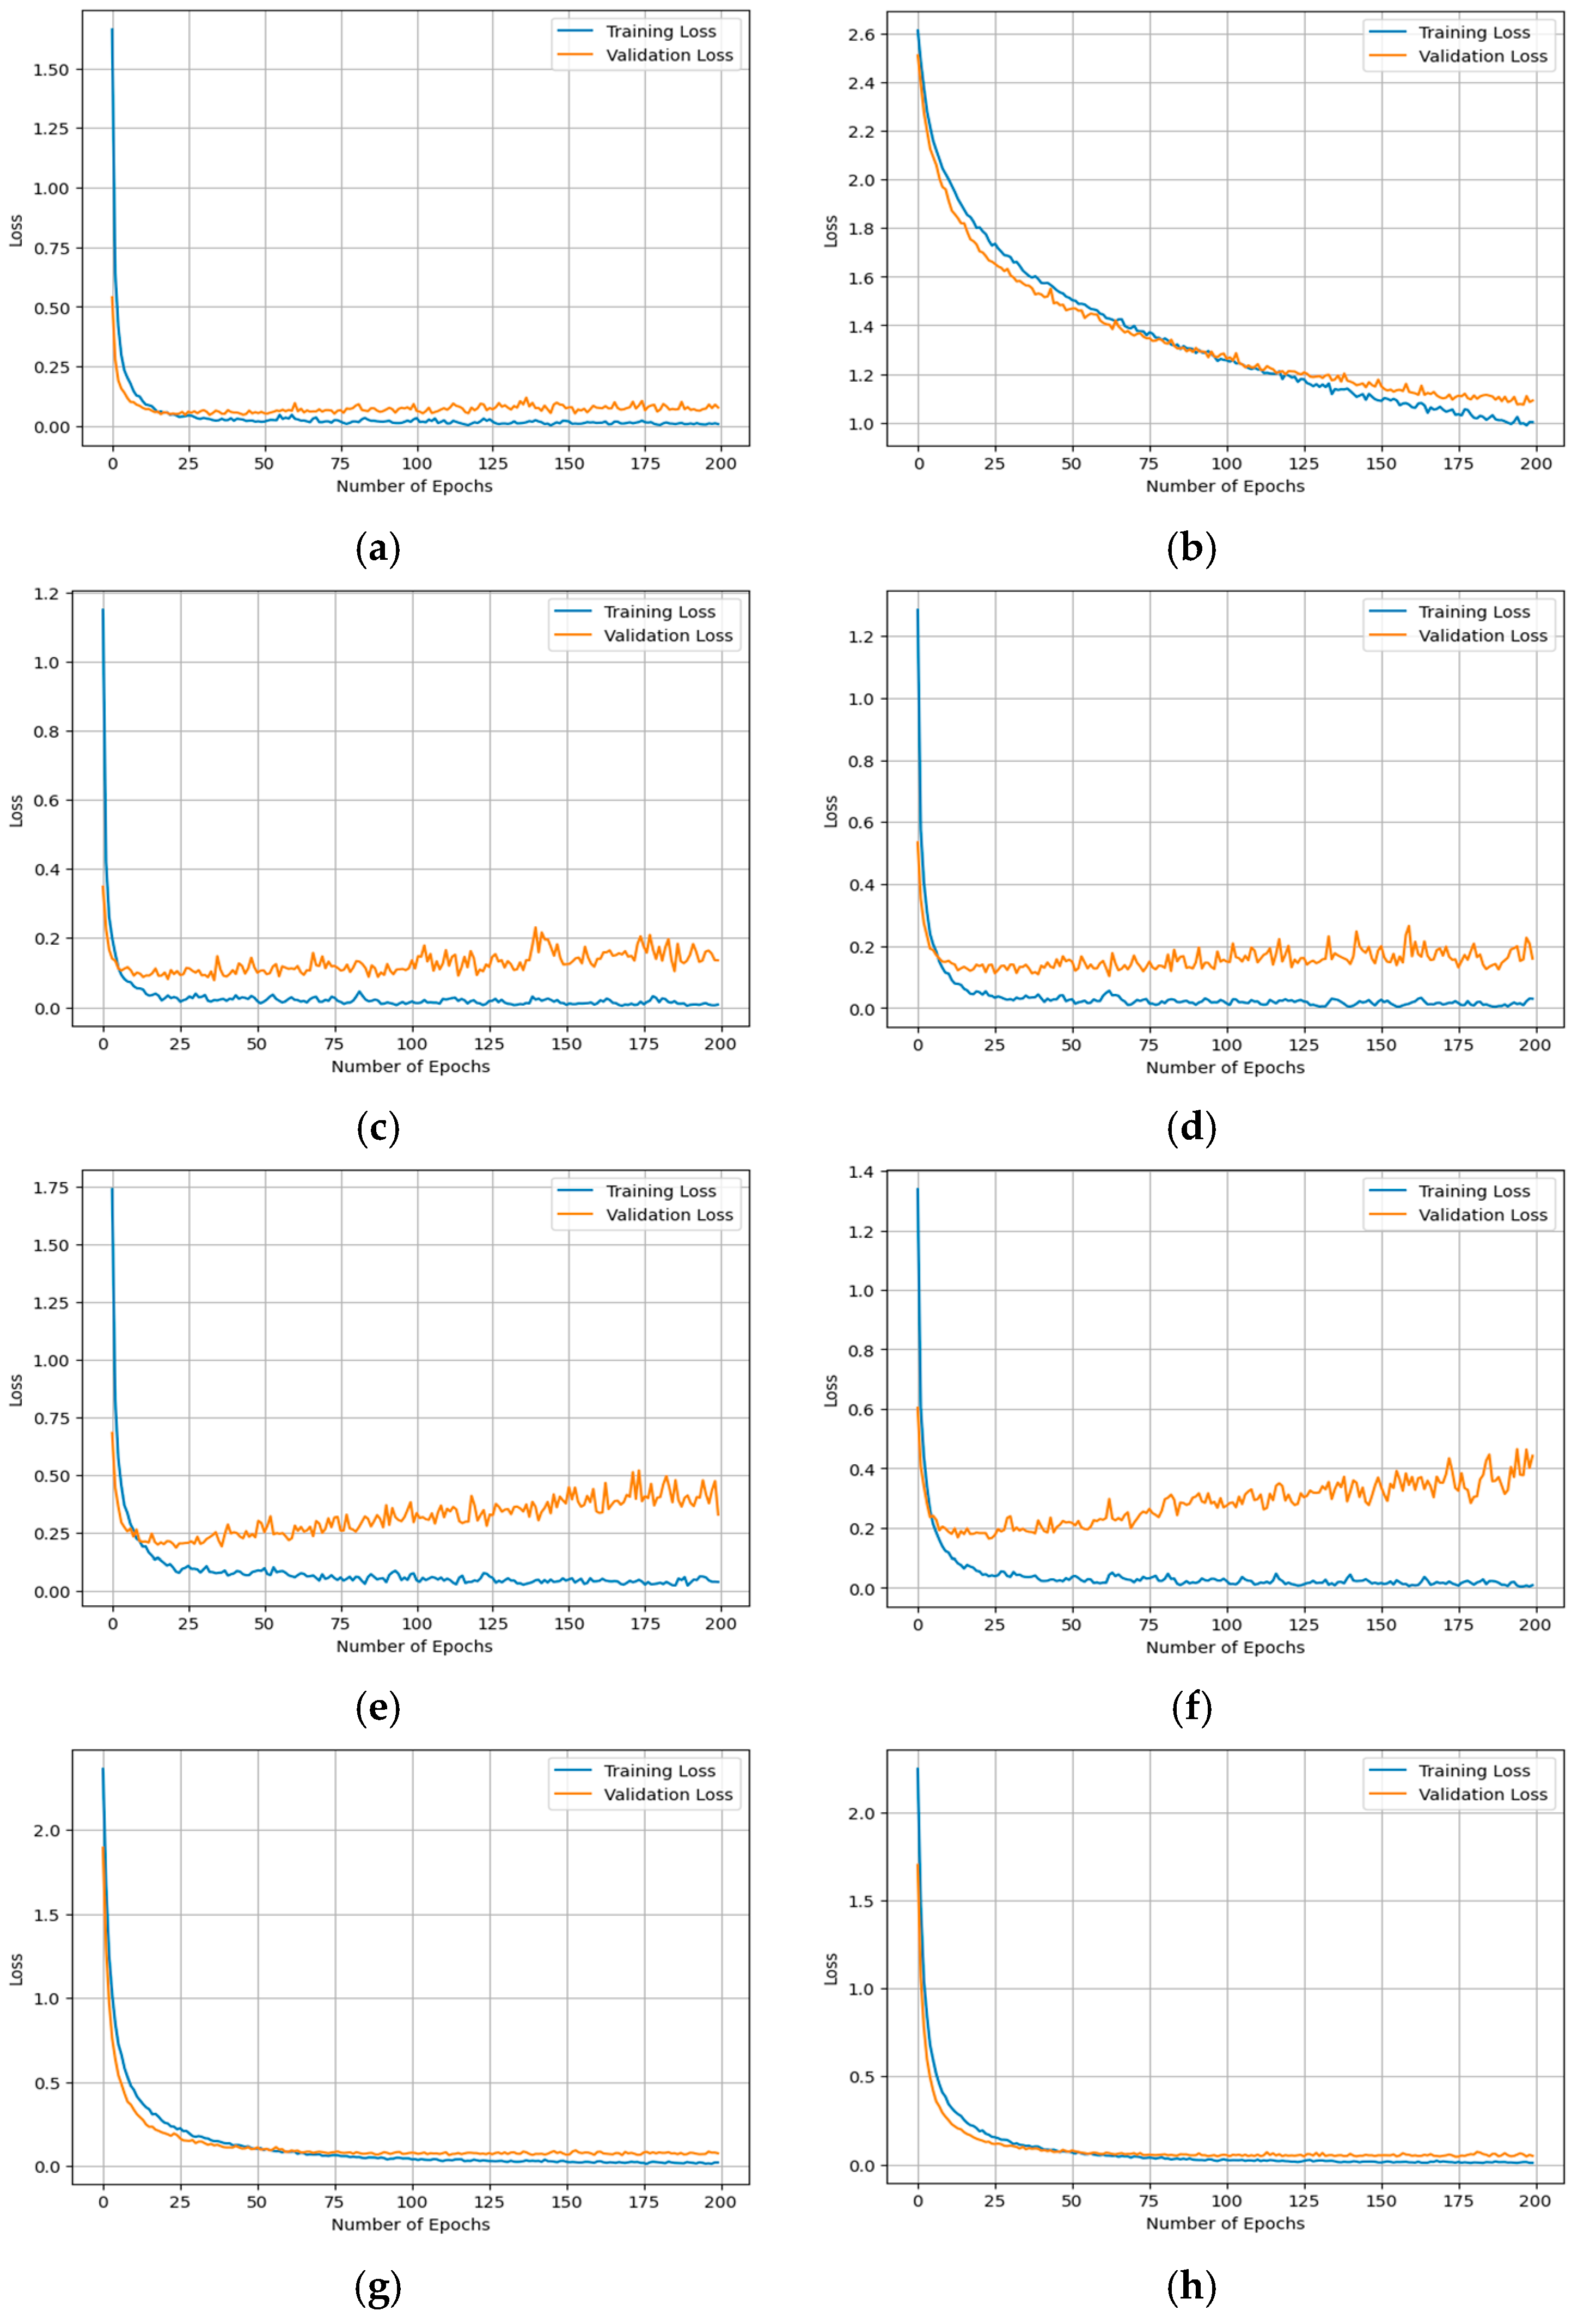
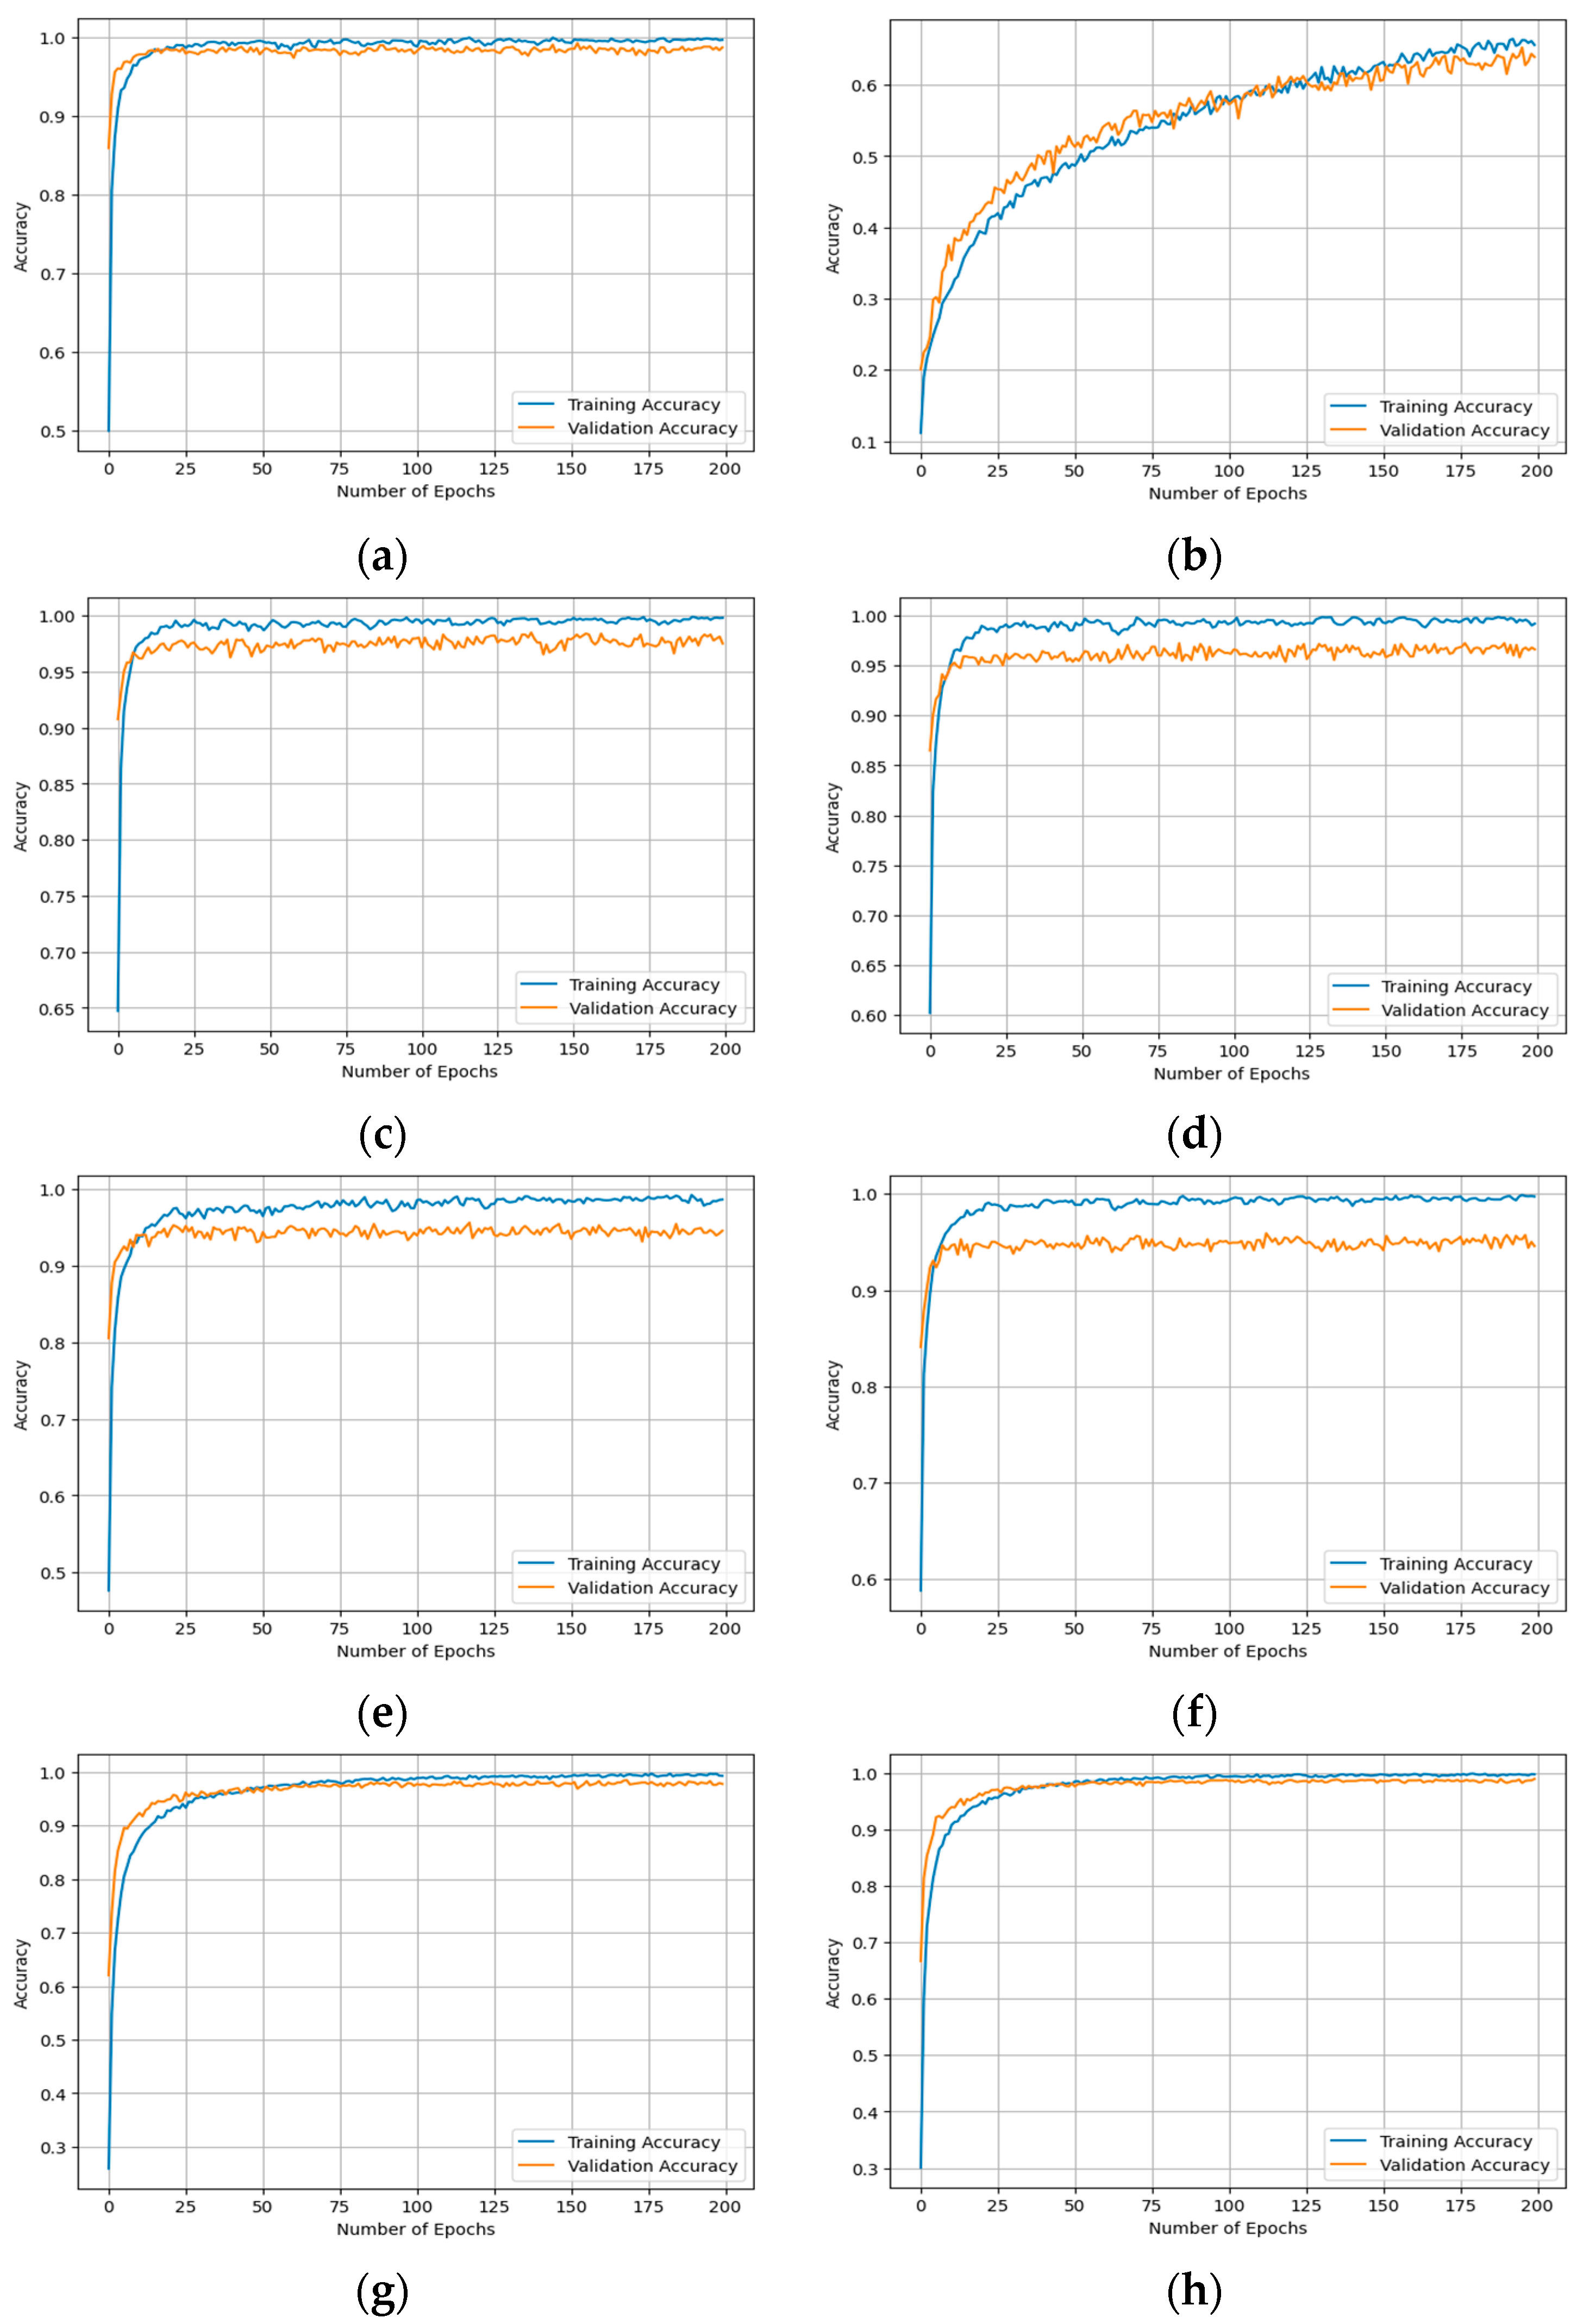
4.1.5. Classification Model Training and Hyper-Parameter Tuning
| Algorithm 2 Custom DNN Training Algorithm |
| Input: ; # the extracted bottleneck features of the training set. ; # the class labels of the training set. ; # the extracted bottleneck features of the validation set. ; # the class labels of the validation set. ; # the custom-built DNN model. ; # the file path that stores the weights of the best-trained model. ; # the number of epochs. ; # the batch of size of training progress. Output: ; # the trained custom DNN model. TA, VA; # the training accuracy and validation accuracy. TL, VL; # the training loss and validation loss. 1. Begin 2. loss‘categorical_crossentropy’ 3. optimizer‘Adam’ 4. metrics[‘accuracy’] 5. Mcompile(loss, optimizer, metrics) 6. Check-Pointer = ModelCheckpoint() 7. Mfit(, , validation_data = (,), epochs =, batch_size =, callbacks = [Check-Pointer], verbose = 1) 8. TA, VA get-accuracy(M) 9. TL, VL get-loss(M) 10. plot(TA, VA) 11. plot(TL, VL) 12. return M, TA, VA, TL, VL; 13. End |
4.1.6. Classification Model Evaluation
- Classification Accuracy: It is used to measure the instances of correctly classified predictions. It is the ratio of the number of correctly classified predictions to the total number of predictions. It is calculated by using the equation below:where FP, FN, TP, and TN are the false positive, false negative, true positive, and true negative of instances. It is utilized here because the target classes of the dataset are well-balanced.
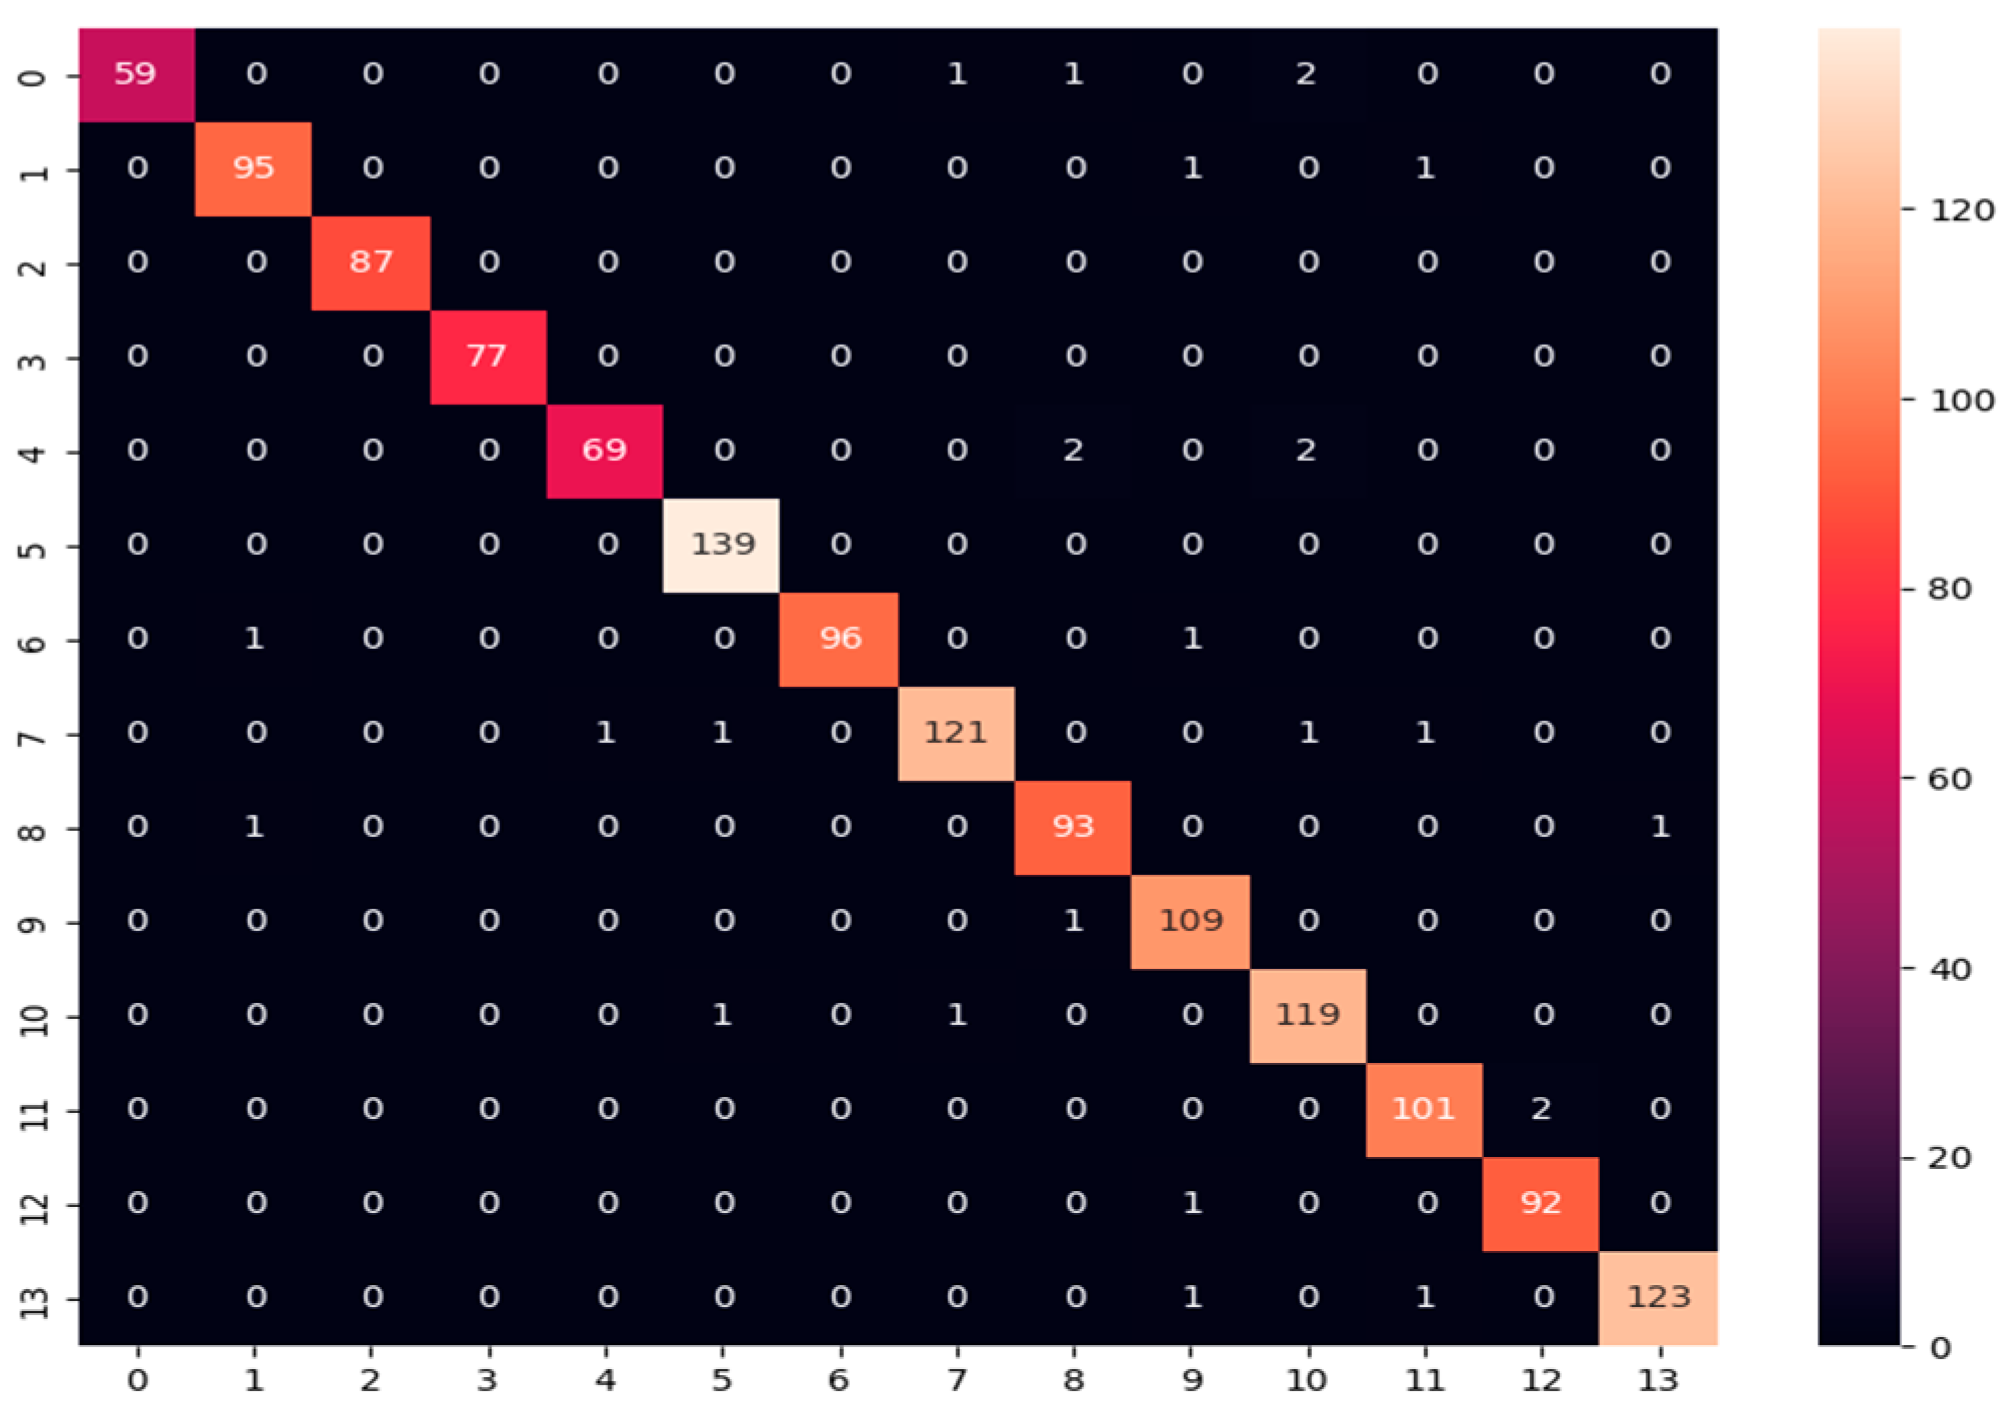
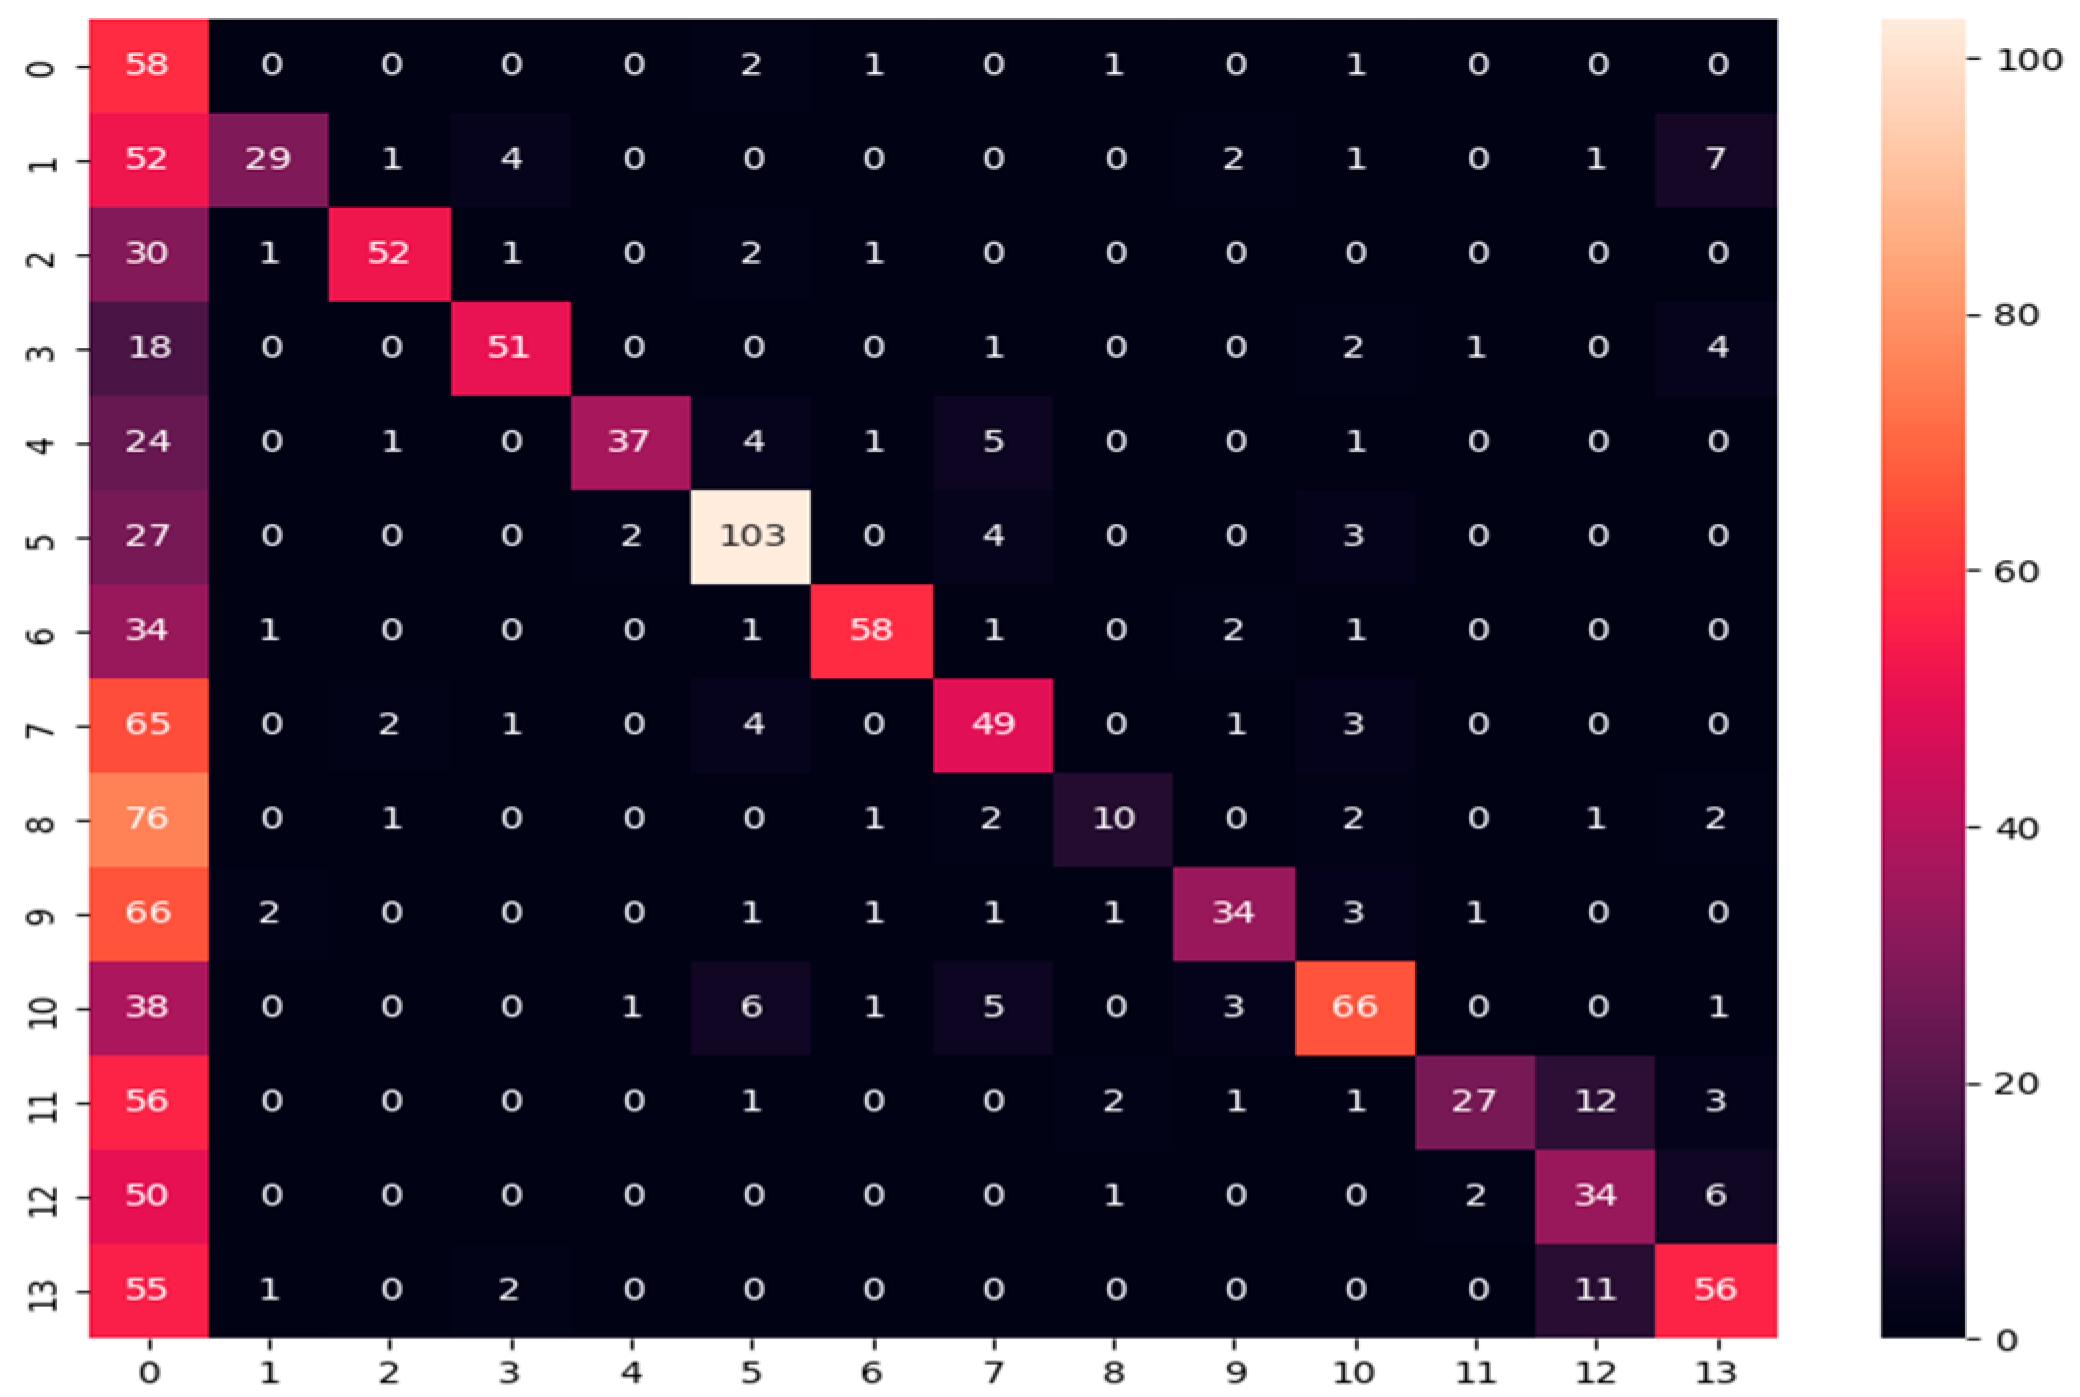
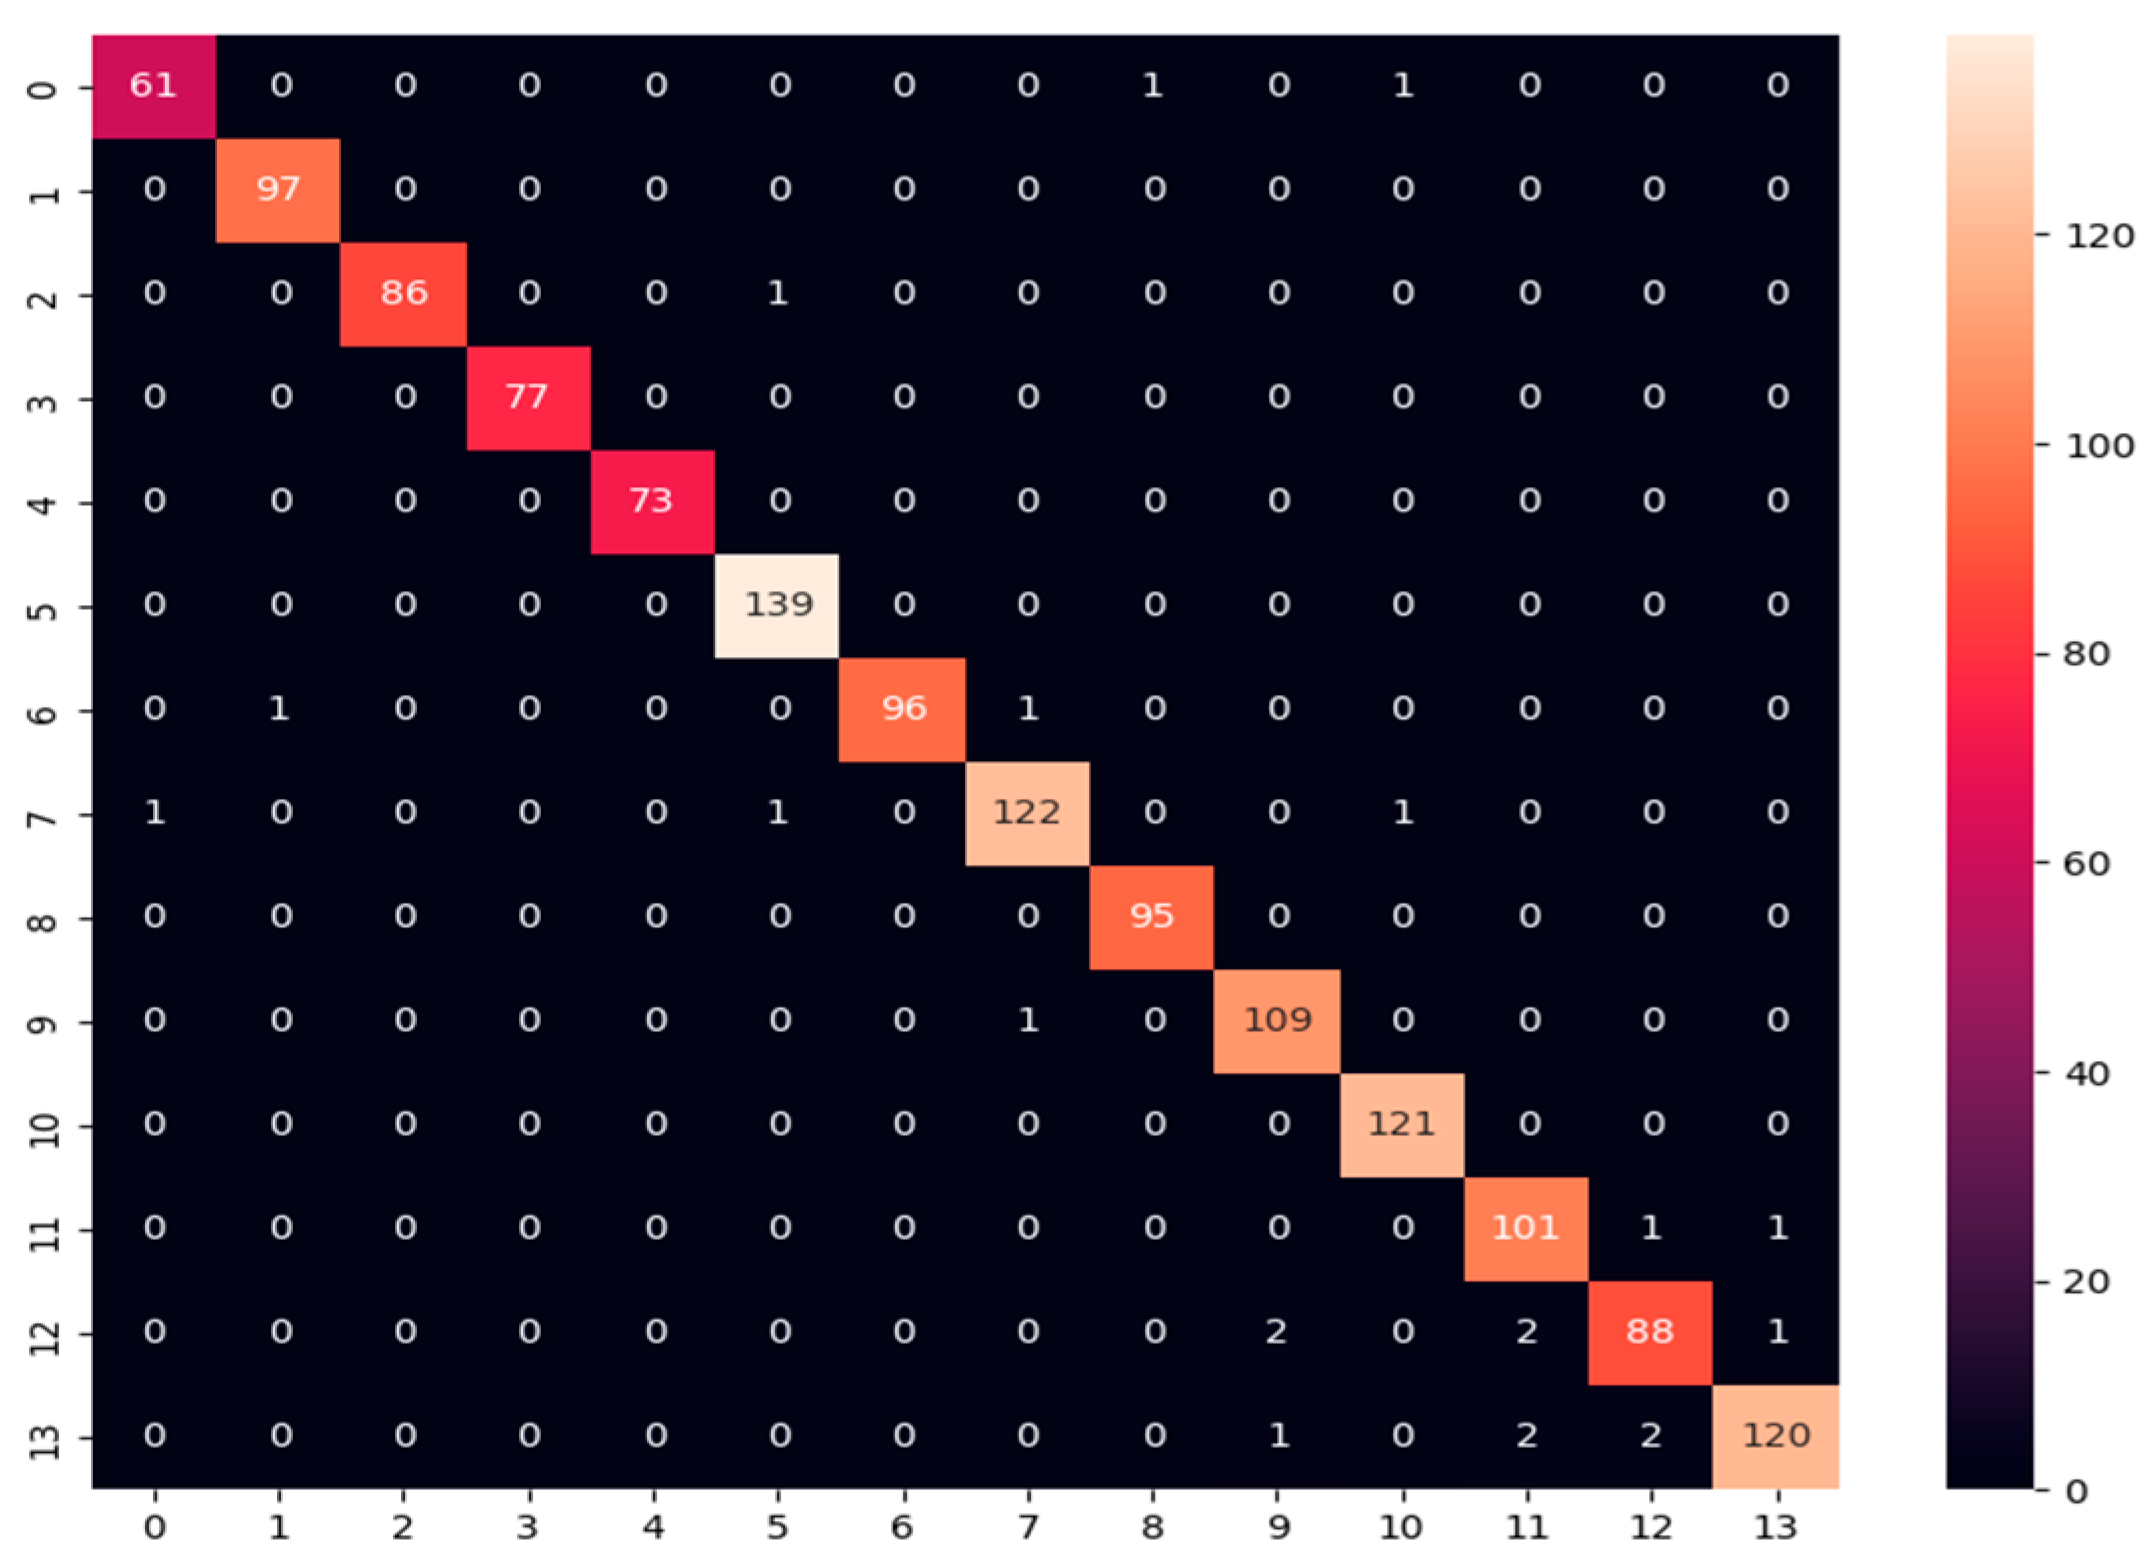
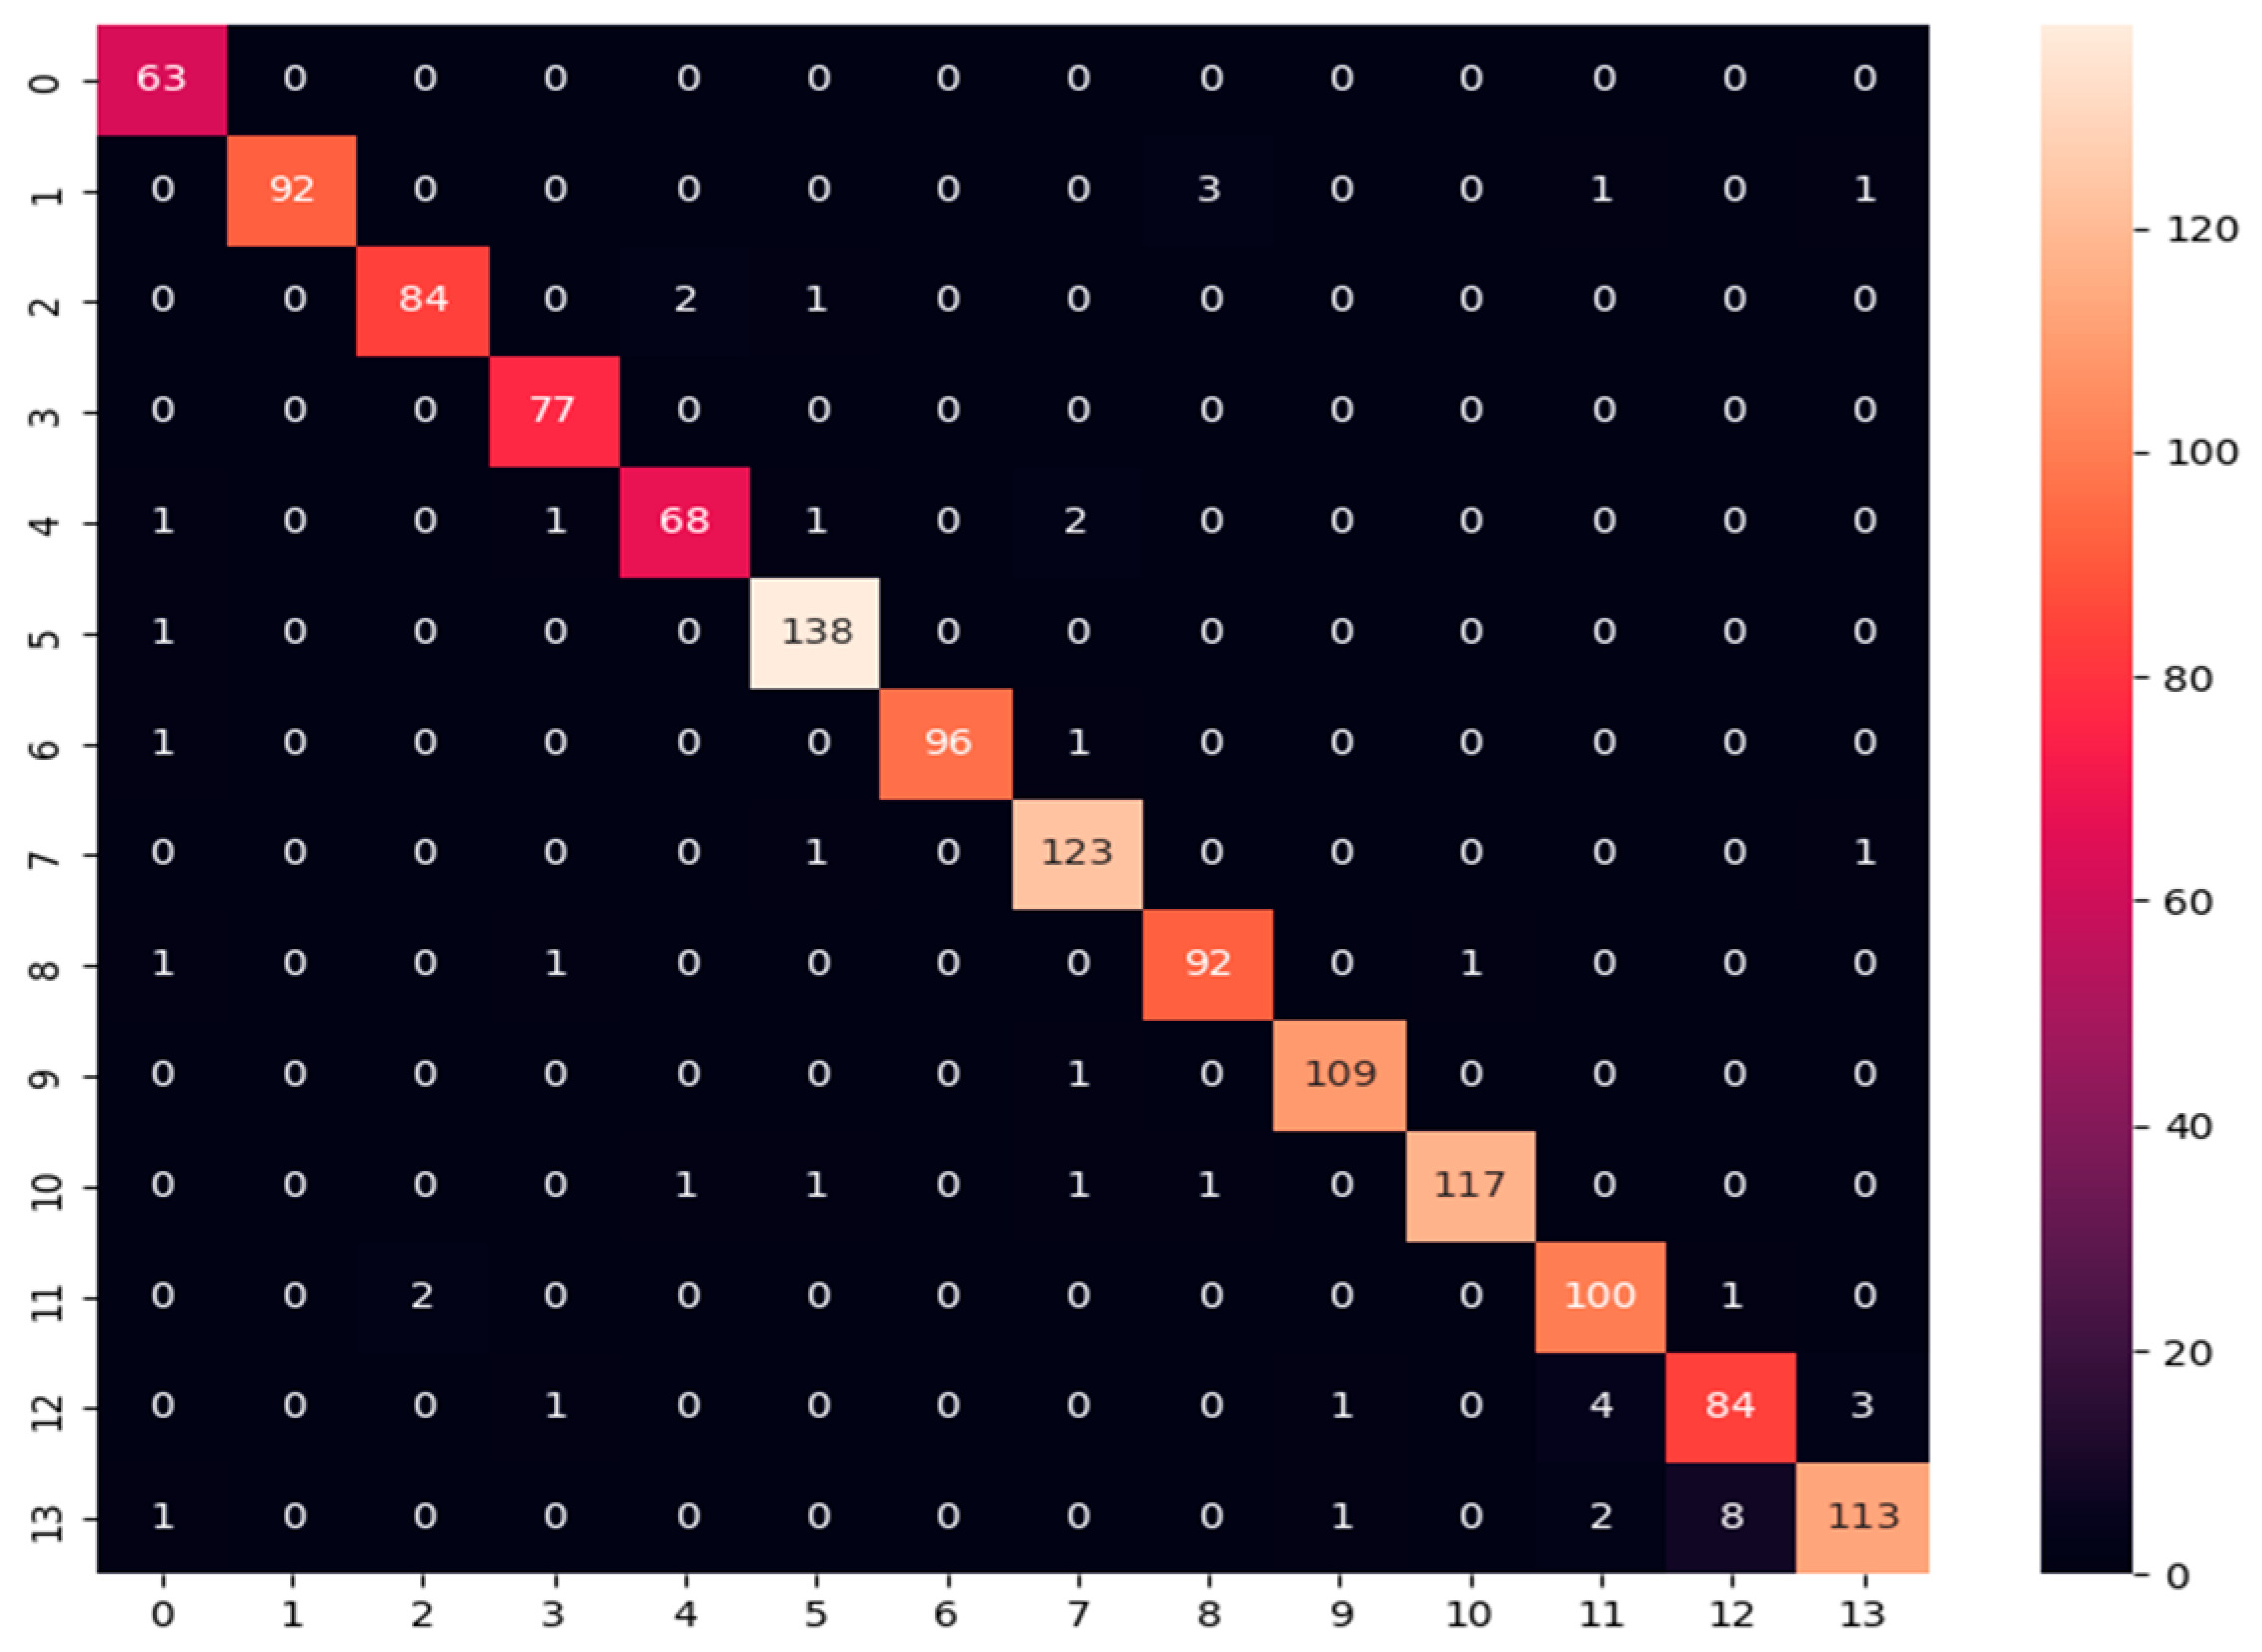
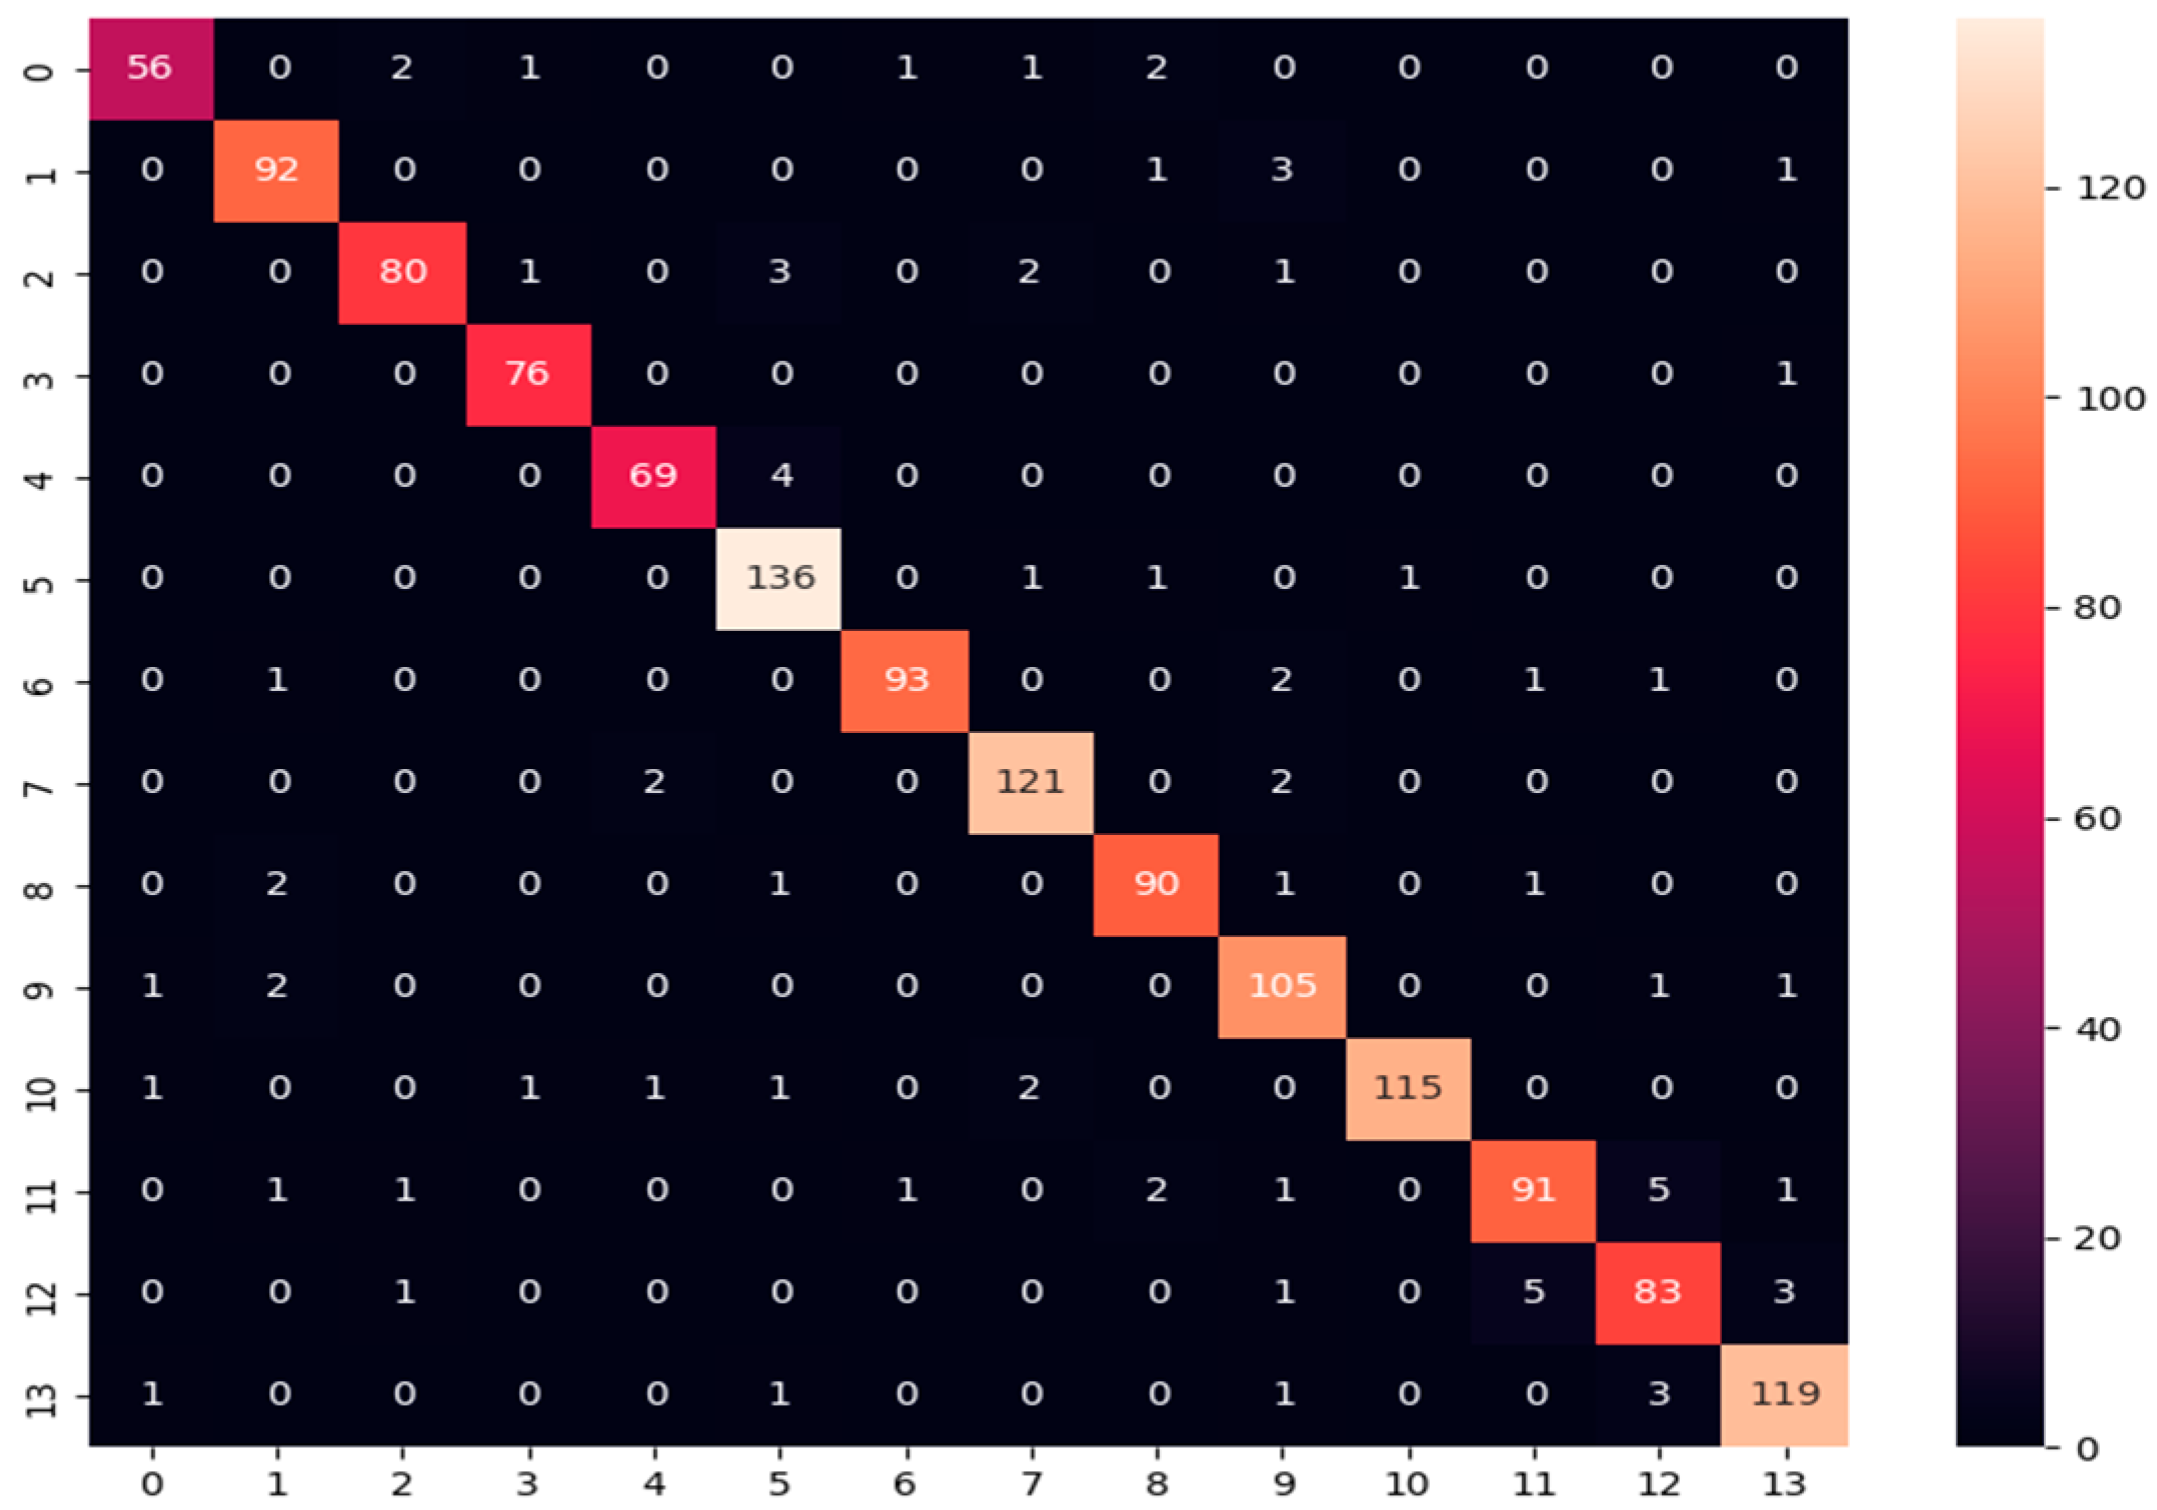
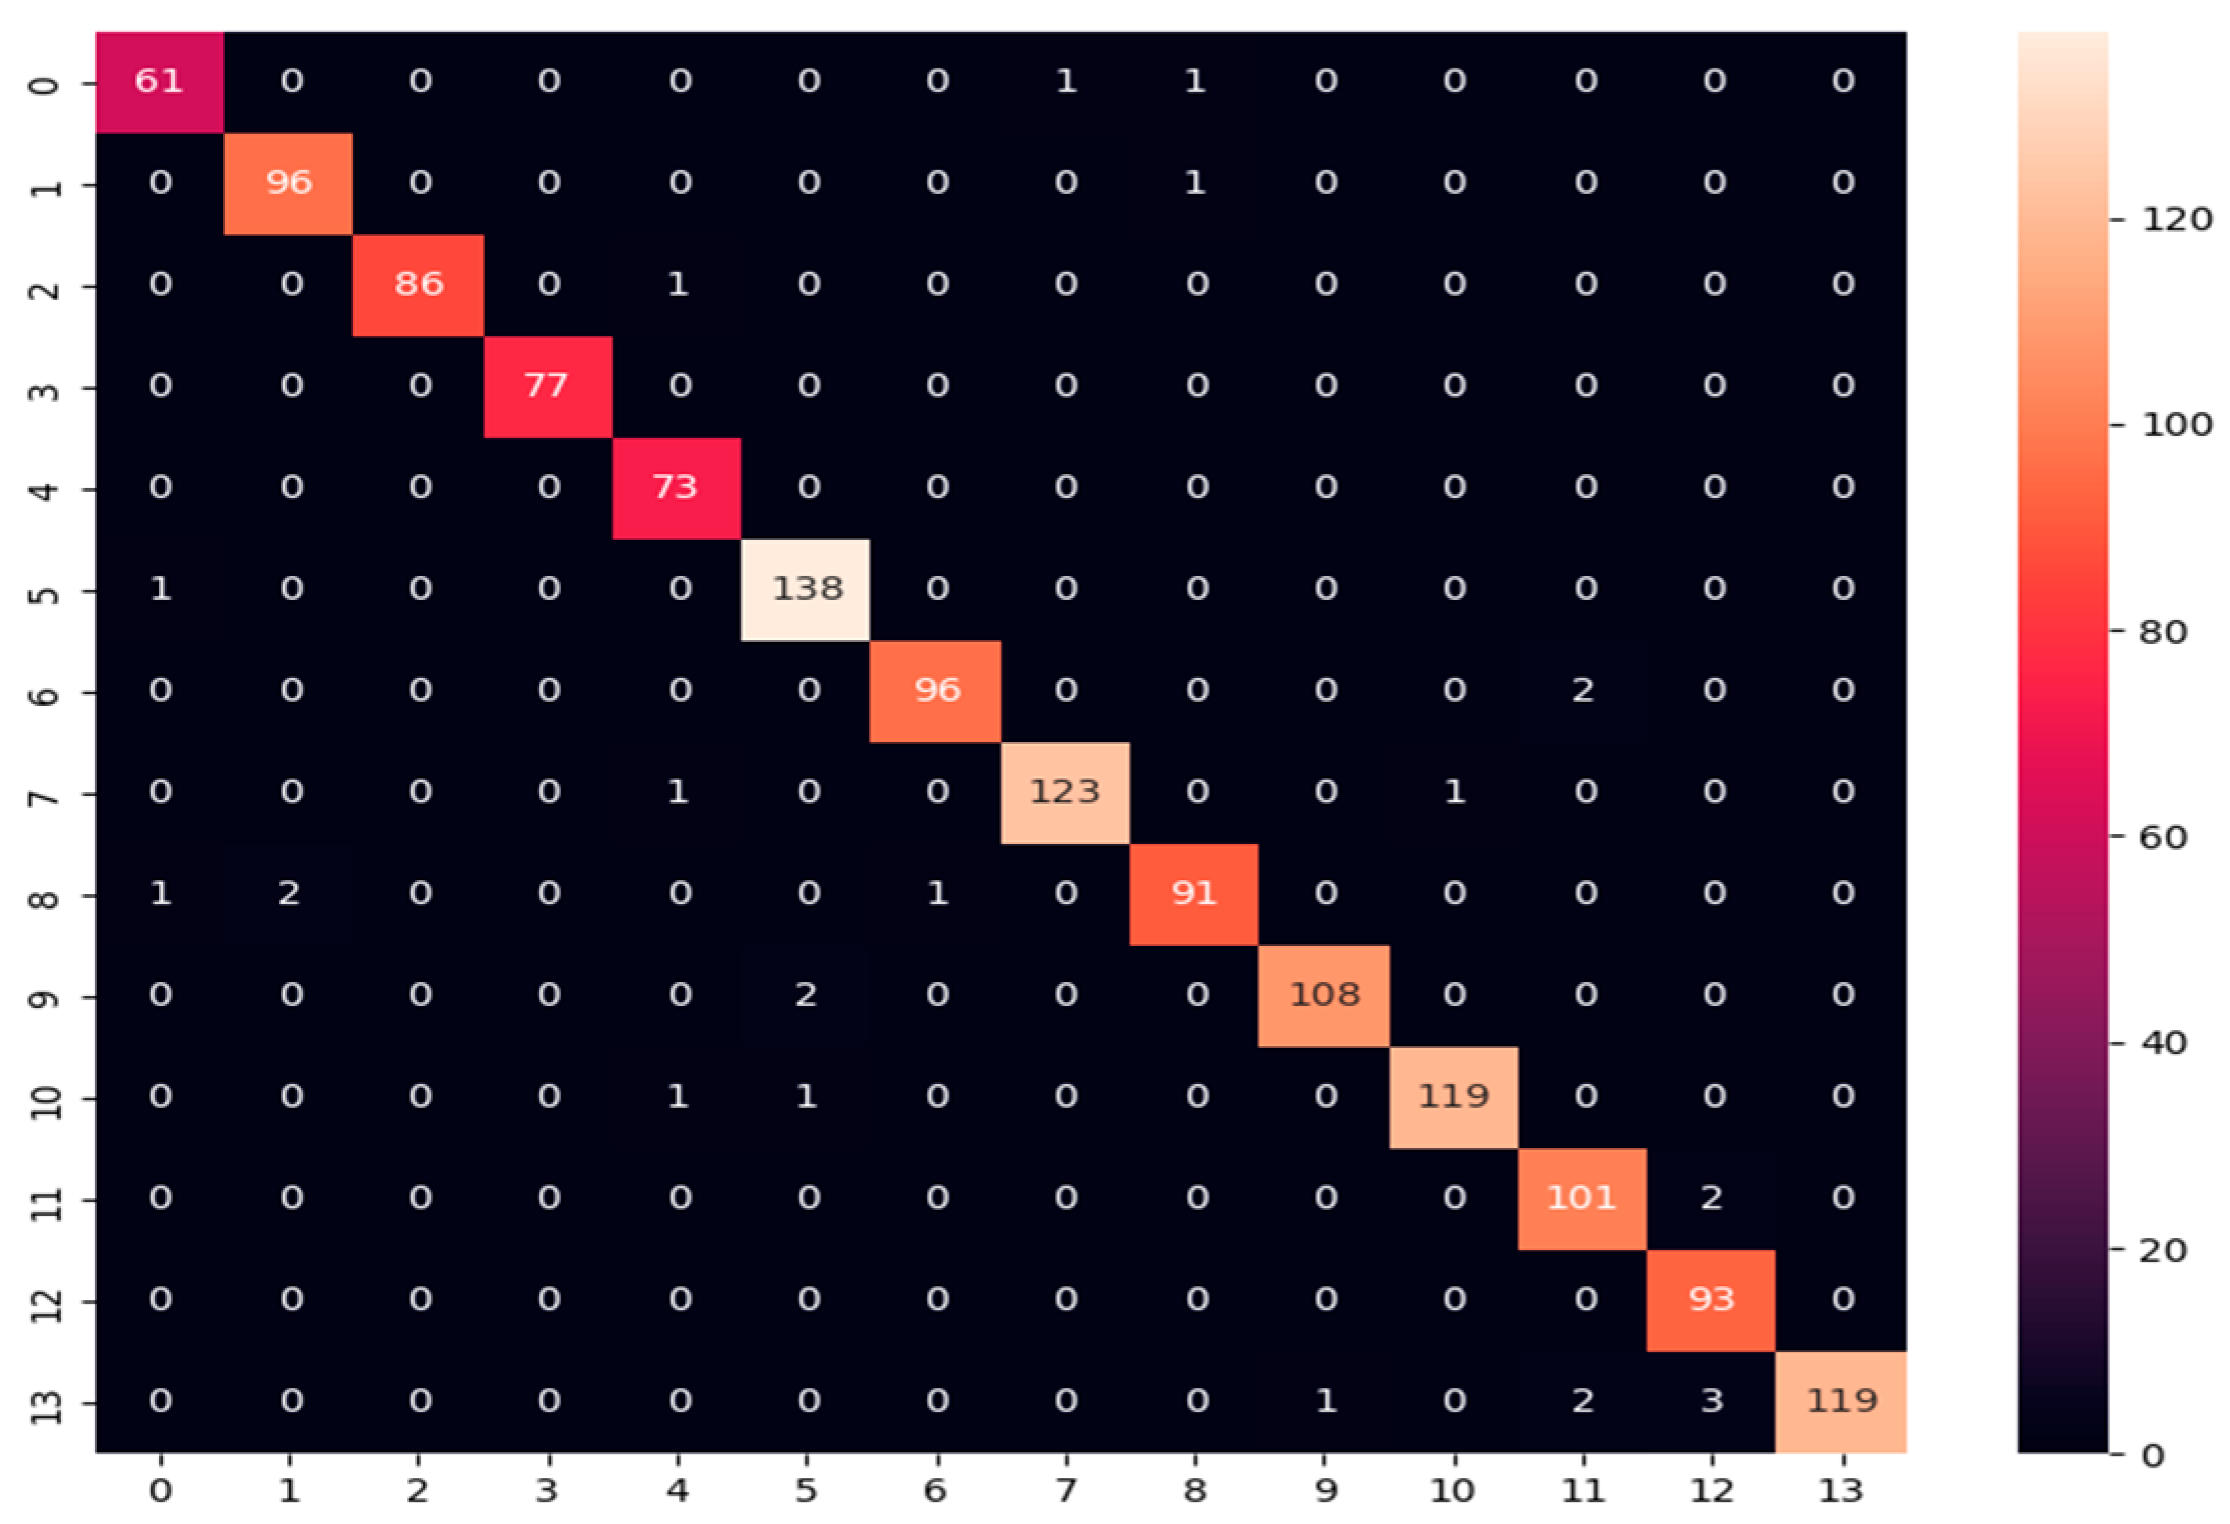
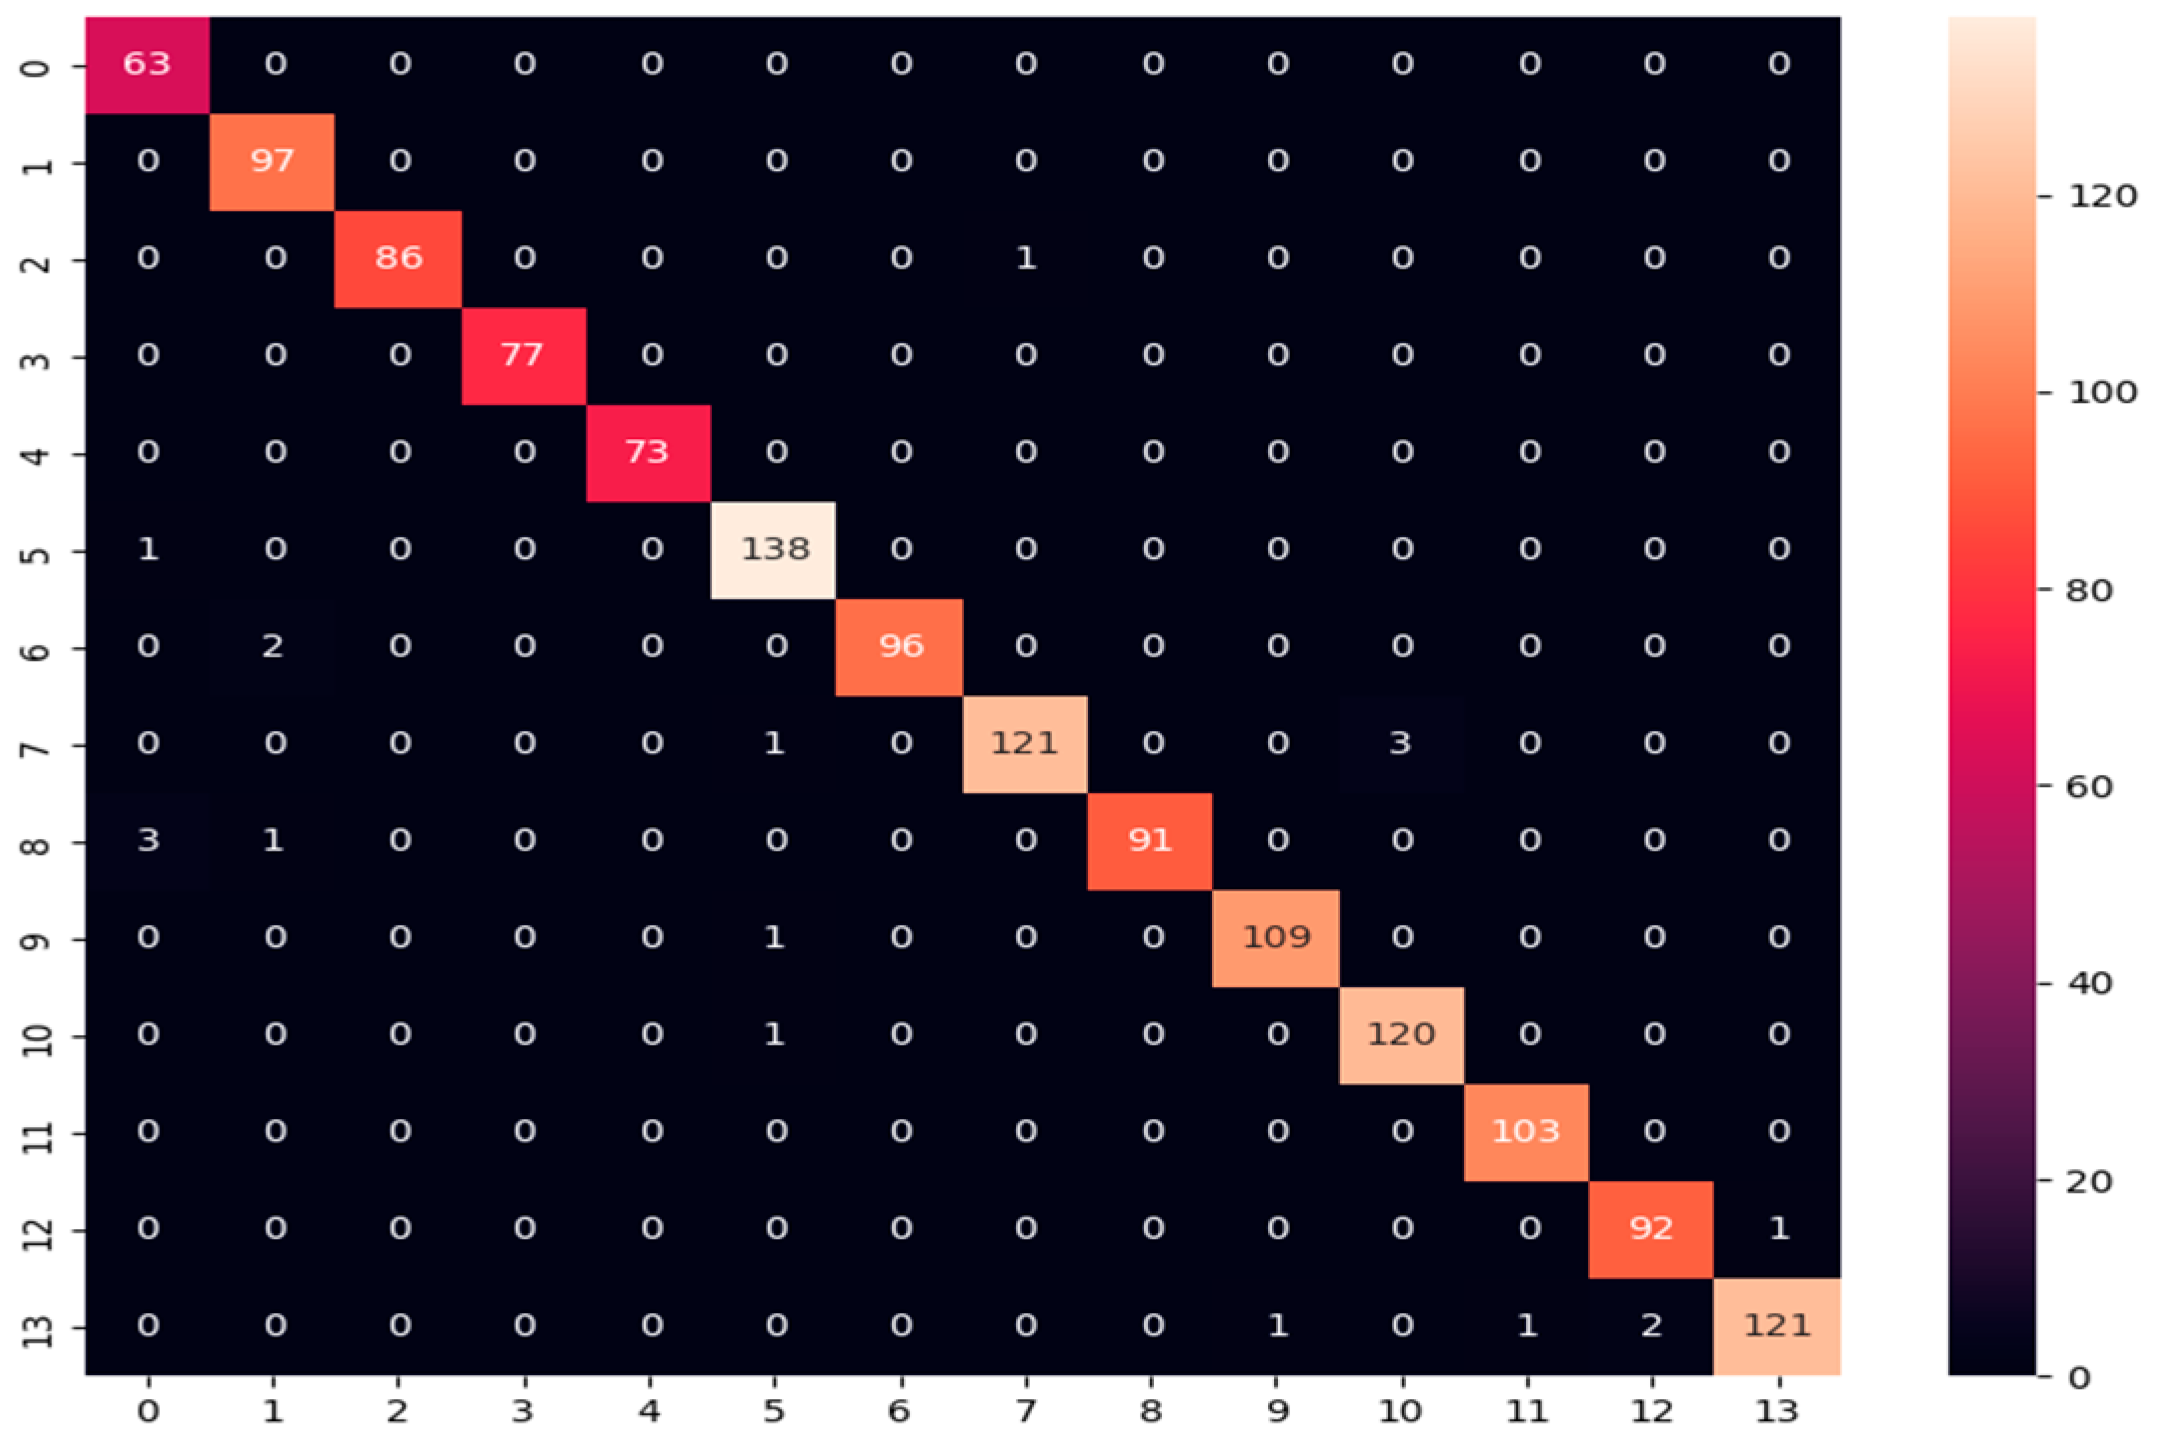
- Confusion matrix: Its performance measurement for the machine learning classifiers is used when the output is more than two classes. It is an N × N matrix where N represents the number of classes in the dataset. It is applied to measure the classifier model’s performance on the testing dataset. It can compute the number of correct and incorrect predictions made by the model compared with the actual classifications in the test dataset. It is used for measuring precision, recall, and F1-score metrics.
- Precision: The ratio of true positives to all the positives predicted by the model. The following equation is used to calculate the precision metric:
- Recall: It is the ratio of true positives to all the positives in the dataset. The following equation is used to calculate the recall metrics:
- F1-score: It is a harmonic mean of precision and recall metrics, where it is considered the weighted average of precision and recall with a range of [0, 1]. The following equation is used to calculate the F1-score metric.
4.2. Word-to-Sign Module
4.2.1. Arabic Words Database Dictionary Building
4.2.2. Fuzzy String Matching Score Implementation
| Algorithm 3 Levenshtein Distance Represented by the Recurrence Relation |
| 1. Begin 2. for each 3. for each 4. 5. 6. 7. 8. 9. 10. End |
5. Experimental Results and Discussion
6. Conclusions and Future Work
Author Contributions
Funding
Data Availability Statement
Acknowledgments
Conflicts of Interest
References
- Hsu, P.-H. Readability of hearing related internet information in traditional Chinese. Speech Lang. Hear. 2017, 23, 158–166. [Google Scholar] [CrossRef]
- Al-Khalifa, H.S. Introducing Arabic sign language for mobile phones. In Proceedings of the International Conference on Computers for Handicapped Persons, Milan, Italy, 11–15 July 2020; pp. 213–220. [Google Scholar]
- Zahra, A.; Hassan, S.-U.-N.; Hassan, M.S.; Parveen, N.; Park, J.-H.; Iqbal, N.; Khatoon, F.; Atteya, M.R. Effect of physical activity and sedentary sitting time on psychological quality of life of people with and without disabilities: A survey from Saudi Arabia. Front. Public Health 2022, 10, 998890. [Google Scholar] [CrossRef] [PubMed]
- El-Sadany, T.A.; Hashish, M.A. An Arabic morphological system. IBM Syst. J. 1989, 28, 600–612. [Google Scholar] [CrossRef]
- El-Gayyar, M.; Ibrahim, A.; Sallam, A. The ArSL keyboard for android. In Proceedings of the 2015 IEEE Seventh International Conference on Intelligent Computing and Information Systems (ICICIS), Cairo, Egypt, 12–14 December 2015; pp. 481–486. [Google Scholar]
- Abdel-Fattah, M.A. Arabic sign language: A perspective. J. Deaf Stud. Deaf Educ. 2005, 10, 212–221. [Google Scholar] [CrossRef] [PubMed]
- Khan, R.U.; Khattak, H.; Wong, W.S.; AlSalman, H.; Mosleh, M.A.; Rahman, M.; Md, S. Intelligent Malaysian Sign Language Translation System Using Convolutional-Based Attention Module with Residual Network. Comput. Intell. Neurosci. 2021, 2021, 9023010. [Google Scholar] [CrossRef] [PubMed]
- Mohameed, R.A.; Naji, R.M.; Ahmeed, A.M.; Saeed, D.A.; Mosleh, M.A. Automated translation for Yemeni’s Sign Language to Text UsingTransfer Learning-based Convolutional Neural Networks. In Proceedings of the 2021 1st International Conference on Emerging Smart Technologies and Applications (eSmarTA), Sana’a, Yemen, 10–12 August 2021; pp. 1–5. [Google Scholar]
- Damian, S. Spoken vs. Sign Languages—What’s the Difference? Cogn. Brain Behav. 2011, 15, 251. [Google Scholar]
- Aronoff, M.; Meir, I.; Sandler, W. The paradox of sign language morphology. Language 2005, 81, 301. [Google Scholar] [CrossRef] [PubMed]
- Arivazhagan, N.; Bapna, A.; Firat, O.; Lepikhin, D.; Johnson, M.; Krikun, M.; Chen, M.X.; Cao, Y.; Foster, G.; Cherry, C. Massively multilingual neural machine translation in the wild: Findings and challenges. arXiv 2019, arXiv:1907.05019. [Google Scholar]
- Wu, Y.; Schuster, M.; Chen, Z.; Le, Q.V.; Norouzi, M.; Macherey, W.; Krikun, M.; Cao, Y.; Gao, Q.; Macherey, K. Google’s neural machine translation system: Bridging the gap between human and machine translation. arXiv 2016, arXiv:1609.08144. [Google Scholar]
- Bao, C.; Ji, H.; Quan, Y.; Shen, Z. Dictionary learning for sparse coding: Algorithms and convergence analysis. IEEE Trans. Pattern Anal. Mach. Intell. 2015, 38, 1356–1369. [Google Scholar] [CrossRef]
- Tomasi, C. Histograms of oriented gradients. Comput. Vis. Sampl. 2012, 1–6. Available online: https://courses.cs.duke.edu//compsci527/spring19/notes/hog.pdf (accessed on 15 January 2024).
- Liu, W.; Anguelov, D.; Erhan, D.; Szegedy, C.; Reed, S.; Fu, C.-Y.; Berg, A.C. Ssd: Single shot multibox detector. In Proceedings of the Computer Vision–ECCV 2016: 14th European Conference, Amsterdam, The Netherlands, 11–14 October 2016; pp. 21–37. [Google Scholar]
- Nguyen, T.D.; Ranganath, S. Facial expressions in American sign language: Tracking and recognition. Pattern Recognit. 2012, 45, 1877–1891. [Google Scholar] [CrossRef]
- Amrutha, C.; Davis, N.; Samrutha, K.; Shilpa, N.; Chunkath, J. Improving language acquisition in sensory deficit individuals with mobile application. Procedia Technol. 2016, 24, 1068–1073. [Google Scholar] [CrossRef]
- Rajam, P.S.; Balakrishnan, G. Real time Indian sign language recognition system to aid deaf-dumb people. In Proceedings of the 2011 IEEE 13th International Conference on Communication Technology (ICCT), Jinan, China, 25–28 September 2011; pp. 737–742. [Google Scholar]
- Bhuyan, M.K.; Ramaraju, V.V.; Iwahori, Y. Hand gesture recognition and animation for local hand motions. Int. J. Mach. Learn. Cybern. 2014, 5, 607–623. [Google Scholar] [CrossRef]
- Gandhi, P.; Dalvi, D.; Gaikwad, P.; Khode, S. Image based sign language recognition on android. Int. J. Eng. Tech. 2015, 1, 55–60. [Google Scholar]
- Lahoti, S.; Kayal, S.; Kumbhare, S.; Suradkar, I.; Pawar, V. Android based american sign language recognition system with skin segmentation and SVM. In Proceedings of the 2018 9th International Conference on Computing, Communication and Networking Technologies (ICCCNT), Bengaluru, India, 10–12 July 2018; pp. 1–6. [Google Scholar]
- Ozcan, T.; Basturk, A. Transfer learning-based convolutional neural networks with heuristic optimization for hand gesture recognition. Neural Comput. Appl. 2019, 31, 8955–8970. [Google Scholar] [CrossRef]
- Aloysius, N.; Geetha, M. Understanding vision-based continuous sign language recognition. Multimed. Tools Appl. 2020, 79, 22177–22209. [Google Scholar] [CrossRef]
- Imran, J.; Raman, B. Deep motion templates and extreme learning machine for sign language recognition. Vis. Comput. 2020, 36, 1233–1246. [Google Scholar] [CrossRef]
- Assaleh, K.; Al-Rousan, M. Recognition of Arabic sign language alphabet using polynomial classifiers. EURASIP J. Adv. Signal Process. 2005, 2005, 507614. [Google Scholar] [CrossRef]
- El-Bendary, N.; Zawbaa, H.M.; Daoud, M.S.; Hassanien, A.E.; Nakamatsu, K. Arslat: Arabic sign language alphabets translator. In Proceedings of the 2010 International Conference on Computer Information Systems and Industrial Management Applications (CISIM), Krakow, Poland, 8–10 October 2010; pp. 590–595. [Google Scholar]
- Samir, A.; Tolba, M.F. A Proposed Standardization for Arabic Sign Language Benchmark Database. Egypt. J. Lang. Eng. 2015, 2, 1–9. [Google Scholar] [CrossRef]
- Ahmed, A.M.; Alez, R.A.; Taha, M.; Tharwat, G. Automatic translation of Arabic sign to Arabic text (ATASAT) system. J. Comput. Sci. Inf. Technol. 2016, 6, 109–122. [Google Scholar]
- Ahmed, A.M.; Alez, R.A.; Tharwat, G.; Taha, M.; Ghribi, W.; Badawy, A.S.; Changalasetty, S.B.; Bose, J.S.C. Towards the design of automatic translation system from Arabic Sign Language to Arabic text. In Proceedings of the 2017 International Conference on Inventive Computing and Informatics (ICICI), Coimbatore, India, 23–24 November 2017; pp. 325–330. [Google Scholar]
- Luqman, H.; Mahmoud, S.A. Automatic translation of Arabic text-to-Arabic sign language. Univers. Access Inf. Soc. 2019, 18, 939–951. [Google Scholar] [CrossRef]
- Aly, S.; Aly, W. DeepArSLR: A novel signer-independent deep learning framework for isolated arabic sign language gestures recognition. IEEE Access 2020, 8, 83199–83212. [Google Scholar] [CrossRef]
- Kamruzzaman, M. Arabic sign language recognition and generating Arabic speech using convolutional neural network. Wirel. Commun. Mob. Comput. 2020, 2020, 3685614. [Google Scholar] [CrossRef]
- Balaha, M.M.; El-Kady, S.; Balaha, H.M.; Salama, M.; Emad, E.; Hassan, M.; Saafan, M.M. A vision-based deep learning approach for independent-users Arabic sign language interpretation. Multimed. Tools Appl. 2023, 82, 6807–6826. [Google Scholar] [CrossRef]
- Nahar, K.M.; Almomani, A.; Shatnawi, N.; Alauthman, M. A robust model for translating arabic sign language into spoken arabic using deep learning. Intell Autom Soft Comput 2023, 37, 2037–2057. [Google Scholar] [CrossRef]
- AbdElghfar, H.A.; Ahmed, A.M.; Alani, A.A.; AbdElaal, H.M.; Bouallegue, B.; Khattab, M.M.; Tharwat, G.; Youness, H.A. A model for qur’anic sign language recognition based on deep learning algorithms. J. Sens. 2023, 2023, 9926245. [Google Scholar] [CrossRef]
- Amor, A.B.H.; El Ghoul, O.; Jemni, M. An EMG dataset for Arabic sign language alphabet letters and numbers. Data Brief 2023, 51, 109770. [Google Scholar] [CrossRef]
- Alsulaiman, M.; Faisal, M.; Mekhtiche, M.; Bencherif, M.; Alrayes, T.; Muhammad, G.; Mathkour, H.; Abdul, W.; Alohali, Y.; Alqahtani, M. Facilitating the communication with deaf people: Building a largest Saudi sign language dataset. J. King Saud Univ. Comput. Inf. Sci. 2023, 35, 101642. [Google Scholar] [CrossRef]
- El Kharoua, R.; Jiang, X. Deep Learning Recognition for Arabic Alphabet Sign Language RGB Dataset. J. Comput. Commun. 2024, 12, 32–51. [Google Scholar] [CrossRef]
- Lozano-Diez, A.; Zazo, R.; Toledano, D.T.; Gonzalez-Rodriguez, J. An analysis of the influence of deep neural network (DNN) topology in bottleneck feature based language recognition. PLoS ONE 2017, 12, e0182580. [Google Scholar] [CrossRef] [PubMed]
- McCulloch, W.S.; Pitts, W. A logical calculus of the ideas immanent in nervous activity. Bull. Math. Biophys. 1943, 5, 115–133. [Google Scholar] [CrossRef]
- Goel, A.; Goel, A.K.; Kumar, A. The role of artificial neural network and machine learning in utilizing spatial information. Spat. Inf. Res. 2023, 31, 275–285. [Google Scholar] [CrossRef]
- Kutyniok, G. An Introduction to the Mathematics of Deep Learning; EMS Press: Helsinki, Finland, 2023. [Google Scholar]
- Wu, J. Introduction to Convolutional Neural Networks; National Key Lab for Novel Software Technology, Nanjing University: Nanjing, China, 2017; Volume 5, p. 495. [Google Scholar]
- Mallat, S.; Sciences, E. Understanding deep convolutional networks. Philos. Trans. R. Soc. A Math. Phys. 2016, 374, 20150203. [Google Scholar] [CrossRef]
- Hussain, M.; Bird, J.J.; Faria, D.R. A study on cnn transfer learning for image classification. In Proceedings of the UK Workshop on Computational Intelligence, Nottingham, UK, 5–7 September 2018; pp. 191–202. [Google Scholar]
- Szegedy, C.; Zaremba, W.; Sutskever, I.; Bruna, J.; Erhan, D.; Goodfellow, I.; Fergus, R. Intriguing properties of neural networks. arXiv 2013, arXiv:arXiv:13330. [Google Scholar]
- LeCun, Y.; Bengio, Y.; Hinton, G. Deep learning. Nature 2015, 521, 436–444. [Google Scholar] [CrossRef] [PubMed]
- Zadeh, L.A. Fuzzy Logic, Granular, Fuzzy, and Soft Computing; Springer: Berlin/Heidelberg, Germany, 2023; pp. 19–49. [Google Scholar]
- Rudwan, M.S.M.; Fonou-Dombeu, J.V. Hybridizing Fuzzy String Matching and Machine Learning for Improved Ontology Alignment. Future Internet 2023, 15, 229. [Google Scholar] [CrossRef]
- Zhang, S.; Hu, Y.; Bian, G. Research on string similarity algorithm based on Levenshtein Distance. In Proceedings of the 2017 IEEE 2nd Advanced Information Technology, Electronic and Automation Control Conference (IAEAC), Chongqing China, 25–26 March 2017; pp. 2247–2251. [Google Scholar]
- Navarro, G. A guided tour to approximate string matching. ACM Comput. Surv. 2001, 33, 31–88. [Google Scholar] [CrossRef]
- Wang, Z. Automatic and robust hand gesture recognition by SDD features based model matching. Appl. Intell. 2022, 52, 11288–11299. [Google Scholar] [CrossRef]
- Mosleh, M.A.; Manssor, H.; Malek, S.; Milow, P.; Salleh, A. A preliminary study on automated freshwater algae recognition and classification system. BMC Bioinform. 2012, 13, S25. [Google Scholar] [CrossRef]
- Pan, S.J.; Yang, Q. A survey on transfer learning. IEEE Trans. Knowl. Data Eng. 2009, 22, 1345–1359. [Google Scholar] [CrossRef]
- Zhuang, F.; Qi, Z.; Duan, K.; Xi, D.; Zhu, Y.; Zhu, H.; Xiong, H.; He, Q. A comprehensive survey on transfer learning. Proc. IEEE 2020, 109, 43–76. [Google Scholar] [CrossRef]
- Huang, G.; Liu, Z.; Van Der Maaten, L.; Weinberger, K.Q. Densely connected convolutional networks. In Proceedings of the IEEE Conference on Computer Vision and Pattern Recognition, Honolulu, HI, USA, 26 July 2017; pp. 4700–4708. [Google Scholar]
- Arslan, B.; Memis, S.; Battinisonmez, E.; Batur, O.Z. Fine-Grained Food Classification Methods on the UEC Food-100 Database. IEEE Trans. Artif. Intell. 2021, 3, 238–243. [Google Scholar] [CrossRef]
- Serte, S.; Serener, A.; Al-Turjman, F. Deep learning in medical imaging: A brief review. Trans. Emerg. Telecommun. Technol. 2020, 10, e4080. [Google Scholar] [CrossRef]
- Alsharif, M.; Alsharif, Y.; Yahya, K.; Alomari, O.; Albreem, M.; Jahid, A. Deep learning applications to combat the dissemination of COVID-19 disease: A review. Eur. Rev. Med. Pharmacol. Sci 2020, 24, 11455–11460. [Google Scholar] [PubMed]
- Chollet, F. Xception: Deep learning with depthwise separable convolutions. In Proceedings of the 2017 IEEE Conference on Computer Vision and Pattern Recognition (CVPR), Honolulu, HI, USA, 21–26 July 2017; pp. 1251–1258. [Google Scholar]
- Szegedy, C.; Vanhoucke, V.; Ioffe, S.; Shlens, J.; Wojna, Z. Rethinking the inception architecture for computer vision. In Proceedings of the IEEE Conference on Computer Vision and Pattern Recognition (CVPR), Las Vegas, NV, USA, 27–30 June 2016; pp. 2818–2826. [Google Scholar]
- Zoph, B.; Vasudevan, V.; Shlens, J.; Le, Q.V. Learning transferable architectures for scalable image recognition. In Proceedings of the 2018 IEEE/CVF Conference on Computer Vision and Pattern Recognition, Salt Lake City, UT, USA, 23 June 2018; pp. 8697–8710. [Google Scholar]
- Alani, A.A.; Cosma, G. ArSL-CNN: A convolutional neural network for Arabic sign language gesture recognition. Indones. J. Electr. Eng. Comput. Sci. 2021, 22, 1096–1107. [Google Scholar] [CrossRef]
- Zakariah, M.; Alotaibi, Y.A.; Koundal, D.; Guo, Y.; Elahi, M.M. Sign language recognition for Arabic alphabets using transfer learning technique. Comput. Intell. Neurosci. 2022, 2022, 4567989. [Google Scholar] [CrossRef] [PubMed]
- Mahmoud, E.; Wassif, K.; Bayomi, H. Transfer learning and recurrent neural networks for automatic arabic sign language recognition. In Proceedings of the International Conference on Advanced Machine Learning Technologies and Applications, Cairo, Egypt, 5–7 May 2022; pp. 47–59. [Google Scholar]
- Duwairi, R.M.; Halloush, Z.A. Automatic recognition of Arabic alphabets sign language using deep learning. Int. J. Electr. Comput. Eng. 2022, 12, 2996–3004. [Google Scholar] [CrossRef]
- Dabwan, B.A.; Jadhav, M.E.; Ali, Y.A.; Olayah, F.A. Arabic Sign Language Recognition Using EfficientnetB1 and Transfer Learning Technique. In Proceedings of the 2023 International Conference on IT Innovation and Knowledge Discovery (ITIKD), Manama, Bahrain, 8–9 March 2023; pp. 1–5. [Google Scholar]
- Hdioud, B.; Tirari, M.E.H. A Deep Learning based Approach for Recognition of Arabic Sign Language Letters. Int. J. Adv. Comput. Sci. Appl. 2023, 14. [Google Scholar] [CrossRef]


| Class Name | Class Label | Number of Instances |
|---|---|---|
| builder | 0 | 341 |
| excellent | 1 | 442 |
| good | 2 | 419 |
| how | 3 | 427 |
| mechanic | 4 | 337 |
| president | 5 | 640 |
| satisfaction | 6 | 444 |
| teacher | 7 | 662 |
| translator | 8 | 469 |
| very good | 9 | 594 |
| watch maker | 10 | 634 |
| what | 11 | 509 |
| when | 12 | 534 |
| who | 13 | 578 |
| Total | 7030 |
| Arabic Class Name | English Class Name | Class Label | Training Set | Validation Set | Test Set |
|---|---|---|---|---|---|
| بَناء | builder | 0 | 224 | 54 | 63 |
| مُمتاز | excellent | 1 | 269 | 76 | 97 |
| جيد | good | 2 | 264 | 68 | 87 |
| كَيف | how | 3 | 278 | 72 | 77 |
| ميكانيكي | mechanic | 4 | 209 | 55 | 73 |
| رئيس | president | 5 | 401 | 100 | 139 |
| رضى | satisfaction | 6 | 280 | 66 | 98 |
| مُدرس | teacher | 7 | 420 | 117 | 125 |
| مُترجِم | translator | 8 | 315 | 59 | 95 |
| جيد جداً | very good | 9 | 392 | 92 | 110 |
| ساعاتي | watchmaker | 10 | 404 | 109 | 121 |
| ما/ماذا | what | 11 | 338 | 68 | 103 |
| مَتى | when | 12 | 349 | 92 | 93 |
| مَن | who | 13 | 356 | 97 | 125 |
| Total | 4499 | 1125 | 1406 | ||
| Arabic Class Name | English Class Name | Class Label | Training Set | Validation Set | Test Set |
|---|---|---|---|---|---|
| بَناء | builder | 0 | 214 | 22 | 105 |
| مُمتاز | excellent | 1 | 284 | 26 | 132 |
| جيد | good | 2 | 252 | 41 | 126 |
| كَيف | how | 3 | 278 | 33 | 116 |
| ميكانيكي | mechanic | 4 | 214 | 19 | 104 |
| رئيس | president | 5 | 394 | 49 | 197 |
| رضى | satisfaction | 6 | 275 | 28 | 141 |
| مُدرس | teacher | 7 | 422 | 44 | 196 |
| مُترجِم | translator | 8 | 299 | 27 | 143 |
| جيد جداً | very good | 9 | 383 | 45 | 166 |
| ساعاتي | watchmaker | 10 | 397 | 38 | 199 |
| ما/ماذا | what | 11 | 319 | 39 | 151 |
| مَتى | when | 12 | 338 | 46 | 150 |
| مَن | who | 13 | 359 | 36 | 183 |
| Total | 4428 | 493 | 2109 | ||
| Model | Dimension of Bottleneck Features |
|---|---|
| (Filter Size of Height, Filter Size of Width, Number of Channels) | |
| DenseNet121-based Feature Extractor | (4, 4, 1024) |
| ResNet152-based Feature Extractor | (4, 4, 2048) |
| MobileNetV2-based Feature Extractor | (4, 4, 1280) |
| Xception-based Feature Extractor | (4, 4, 2048) |
| InceptionV3-based Feature Extractor | (4, 4, 2048) |
| NASNetLarge-based Feature Extractor | (4, 4, 4032) |
| VGG19-based Feature Extractor | (4, 4, 512) |
| VGG16-based Feature Extractor | (4, 4, 512) |
| Model | Batch Size | |||
|---|---|---|---|---|
| 16 | 32 | 64 | 128 | |
| DenseNet121-based Custom DNN | 99.022% | 99.022% | 99.200% | 99.111% |
| ResNet152-based Custom DNN | 63.733% | 65.867% | 65.244% | 62.489% |
| MobileNetV2-based Custom DNN | 98.222% | 98.133% | 98.489% | 98.311% |
| Xception-based Custom DNN | 97.511% | 97.422% | 97.244% | 97.511% |
| InceptionV3-based Custom DNN | 95.378% | 95.733% | 95.644% | 96.000% |
| NASNetLarge-based Custom DNN | 95.733% | 95.822% | 95.911% | 95.822% |
| VGG19-based Custom DNN | 98.311% | 98.489% | 98.489% | 98.222% |
| VGG16-based Custom DNN | 99.022% | 98.844% | 98.933% | 98.844% |
| Model | Number of Hidden Layers and Neurons | ||
|---|---|---|---|
| (256) | (256, 128) | (256, 128, 64) | |
| DenseNet121-based Custom DNN | 98.15% | 98.36% | 98.15% |
| ResNet152-based Custom DNN | 47.23% | 63.44% | 66.50% |
| MobileNetV2-based Custom DNN | 98.51% | 98.08% | 97.58% |
| Xception-based Custom DNN | 96.44% | 97.16% | 97.16% |
| InceptionV3-based Custom DNN | 94.31% | 94.24% | 93.46% |
| NASNetLarge-based Custom DNN | 96.23% | 95.66% | 96.09% |
| VGG19-based Custom DNN | 98.22% | 97.80% | 98.01% |
| VGG16-based Custom DNN | 98.65% | 98.65% | 98.44% |
| Class No. | Precision | Recall | F1-Score |
|---|---|---|---|
| 0 | 1.0000 | 0.9365 | 0.9672 |
| 1 | 0.9794 | 0.9794 | 0.9794 |
| 2 | 1.0000 | 1.0000 | 1.0000 |
| 3 | 1.0000 | 1.0000 | 1.0000 |
| 4 | 0.9857 | 0.9452 | 0.9650 |
| 5 | 0.9858 | 1.0000 | 0.9929 |
| 6 | 1.0000 | 0.9796 | 0.9897 |
| 7 | 0.9837 | 0.9680 | 0.9758 |
| 8 | 0.9588 | 0.9789 | 0.9688 |
| 9 | 0.9646 | 0.9909 | 0.9776 |
| 10 | 0.9597 | 0.9835 | 0.9714 |
| 11 | 0.9712 | 0.9806 | 0.9758 |
| 12 | 0.9787 | 0.9892 | 0.9840 |
| 13 | 0.9919 | 0.9840 | 0.9880 |
| Accuracy | 98.15% | ||
| Macro avg. | 0.9828 | 0.9797 | 0.9811 |
| Weighted avg. | 0.9817 | 0.9815 | 0.9815 |
| Class Number | Precision | Recall | F1-Score |
|---|---|---|---|
| 0 | 0.0894 | 0.9206 | 0.1629 |
| 1 | 0.8529 | 0.2990 | 0.4427 |
| 2 | 0.9123 | 0.5977 | 0.7222 |
| 3 | 0.8644 | 0.6623 | 0.7500 |
| 4 | 0.9250 | 0.5068 | 0.6549 |
| 5 | 0.8306 | 0.7410 | 0.7833 |
| 6 | 0.9062 | 0.5918 | 0.7160 |
| 7 | 0.7206 | 0.3920 | 0.5078 |
| 8 | 0.6667 | 0.1053 | 0.1818 |
| 9 | 0.7907 | 0.3091 | 0.4444 |
| 10 | 0.7857 | 0.5455 | 0.6439 |
| 11 | 0.8710 | 0.2621 | 0.4030 |
| 12 | 0.5763 | 0.3656 | 0.4474 |
| 13 | 0.7089 | 0.4480 | 0.5490 |
| Accuracy | 47.23% | ||
| Macro avg. | 0.7500 | 0.4819 | 0.5292 |
| Weighted avg. | 0.7635 | 0.4723 | 0.5405 |
| Class Number | Precision | Recall | F1-Score |
|---|---|---|---|
| 0 | 0.9839 | 0.9683 | 0.9760 |
| 1 | 0.9898 | 1.0000 | 0.9949 |
| 2 | 1.0000 | 0.9885 | 0.9942 |
| 3 | 1.0000 | 1.0000 | 1.0000 |
| 4 | 1.0000 | 1.0000 | 1.0000 |
| 5 | 0.9858 | 1.0000 | 0.9929 |
| 6 | 1.0000 | 0.9796 | 0.9897 |
| 7 | 0.9839 | 0.9760 | 0.9799 |
| 8 | 0.9896 | 1.0000 | 0.9948 |
| 9 | 0.9732 | 0.9909 | 0.9820 |
| 10 | 0.9837 | 1.0000 | 0.9918 |
| 11 | 0.9619 | 0.9806 | 0.9712 |
| 12 | 0.9670 | 0.9462 | 0.9565 |
| 13 | 0.9836 | 0.9600 | 0.9717 |
| Accuracy | 98.51% | ||
| Macro avg. | 0.9859 | 0.9850 | 0.9854 |
| Weighted avg. | 0.9851 | 0.9851 | 0.9850 |
| Class Number | Precision | Recall | F1-Score |
|---|---|---|---|
| 0 | 0.9265 | 1.0000 | 0.9618 |
| 1 | 1.0000 | 0.9485 | 0.9735 |
| 2 | 0.9767 | 0.9655 | 0.9711 |
| 3 | 0.9625 | 1.0000 | 0.9809 |
| 4 | 0.9577 | 0.9315 | 0.9444 |
| 5 | 0.9718 | 0.9928 | 0.9822 |
| 6 | 1.0000 | 0.9796 | 0.9897 |
| 7 | 0.9609 | 0.9840 | 0.9723 |
| 8 | 0.9583 | 0.9684 | 0.9634 |
| 9 | 0.9820 | 0.9909 | 0.9864 |
| 10 | 0.9915 | 0.9669 | 0.9791 |
| 11 | 0.9346 | 0.9709 | 0.9524 |
| 12 | 0.9032 | 0.9032 | 0.9032 |
| 13 | 0.9576 | 0.9040 | 0.9300 |
| Accuracy | 96.44% | ||
| Macro avg. | 0.9631 | 0.9647 | 0.9636 |
| Weighted avg. | 0.9648 | 0.9644 | 0.9644 |
| Class Number | Precision | Recall | F1-Score |
|---|---|---|---|
| 0 | 0.9492 | 0.8889 | 0.9180 |
| 1 | 0.9388 | 0.9485 | 0.9436 |
| 2 | 0.9524 | 0.9195 | 0.9357 |
| 3 | 0.9620 | 0.9870 | 0.9744 |
| 4 | 0.9583 | 0.9452 | 0.9517 |
| 5 | 0.9315 | 0.9784 | 0.9544 |
| 6 | 0.9789 | 0.9490 | 0.9637 |
| 7 | 0.9528 | 0.9680 | 0.9603 |
| 8 | 0.9375 | 0.9474 | 0.9424 |
| 9 | 0.8974 | 0.9545 | 0.9251 |
| 10 | 0.9914 | 0.9504 | 0.9705 |
| 11 | 0.9286 | 0.8835 | 0.9055 |
| 12 | 0.8925 | 0.8925 | 0.8925 |
| 13 | 0.9444 | 0.9520 | 0.9482 |
| Accuracy | 94.31% | ||
| Macro avg. | 0.9440 | 0.9403 | 0.9419 |
| Weighted avg. | 0.9436 | 0.9431 | 0.9430 |
| Class Number | Precision | Recall | F1-Score |
|---|---|---|---|
| 0 | 0.9118 | 0.9841 | 0.9466 |
| 1 | 0.9320 | 0.9897 | 0.9600 |
| 2 | 0.9885 | 0.9885 | 0.9885 |
| 3 | 0.9868 | 0.9740 | 0.9804 |
| 4 | 1.0000 | 0.9726 | 0.9861 |
| 5 | 0.9583 | 0.9928 | 0.9753 |
| 6 | 0.9897 | 0.9796 | 0.9846 |
| 7 | 0.9603 | 0.9680 | 0.9641 |
| 8 | 0.9785 | 0.9579 | 0.9681 |
| 9 | 0.9533 | 0.9273 | 0.9401 |
| 10 | 0.9831 | 0.9587 | 0.9707 |
| 11 | 0.9412 | 0.9320 | 0.9366 |
| 12 | 0.9082 | 0.9570 | 0.9319 |
| 13 | 0.9828 | 0.9120 | 0.9461 |
| Accuracy | 96.23% | ||
| Macro avg. | 0.9625 | 0.9639 | 0.9628 |
| Weighted avg. | 0.9631 | 0.9623 | 0.9623 |
| Class Number | Precision | Recall | F1-Score |
|---|---|---|---|
| 0 | 0.9683 | 0.9683 | 0.9683 |
| 1 | 0.9796 | 0.9897 | 0.9846 |
| 2 | 1.0000 | 0.9885 | 0.9942 |
| 3 | 1.0000 | 1.0000 | 1.0000 |
| 4 | 0.9605 | 1.0000 | 0.9799 |
| 5 | 0.9787 | 0.9928 | 0.9857 |
| 6 | 0.9897 | 0.9796 | 0.9846 |
| 7 | 0.9919 | 0.9840 | 0.9880 |
| 8 | 0.9785 | 0.9579 | 0.9681 |
| 9 | 0.9908 | 0.9818 | 0.9863 |
| 10 | 0.9917 | 0.9835 | 0.9876 |
| 11 | 0.9619 | 0.9806 | 0.9712 |
| 12 | 0.9490 | 1.0000 | 0.9738 |
| 13 | 1.0000 | 0.9520 | 0.9754 |
| Accuracy | 98.22% | ||
| Macro avg. | 0.9815 | 0.9828 | 0.9820 |
| Weighted avg. | 0.9825 | 0.9822 | 0.9822 |
| Class Number | Precision | Recall | F1-Score |
|---|---|---|---|
| 0 | 0.9403 | 1.0000 | 0.9692 |
| 1 | 0.9700 | 1.0000 | 0.9848 |
| 2 | 1.0000 | 0.9885 | 0.9942 |
| 3 | 1.0000 | 1.0000 | 1.0000 |
| 4 | 1.0000 | 1.0000 | 1.0000 |
| 5 | 0.9787 | 0.9928 | 0.9857 |
| 6 | 1.0000 | 0.9796 | 0.9897 |
| 7 | 0.9918 | 0.9680 | 0.9798 |
| 8 | 1.0000 | 0.9579 | 0.9785 |
| 9 | 0.9909 | 0.9909 | 0.9909 |
| 10 | 0.9756 | 0.9917 | 0.9836 |
| 11 | 0.9904 | 1.0000 | 0.9952 |
| 12 | 0.9787 | 0.9892 | 0.9840 |
| 13 | 0.9918 | 0.9680 | 0.9798 |
| Accuracy | 98.65% | ||
| Macro avg. | 0.9863 | 0.9876 | 0.9868 |
| Weighted avg. | 0.9868 | 0.9865 | 0.9865 |
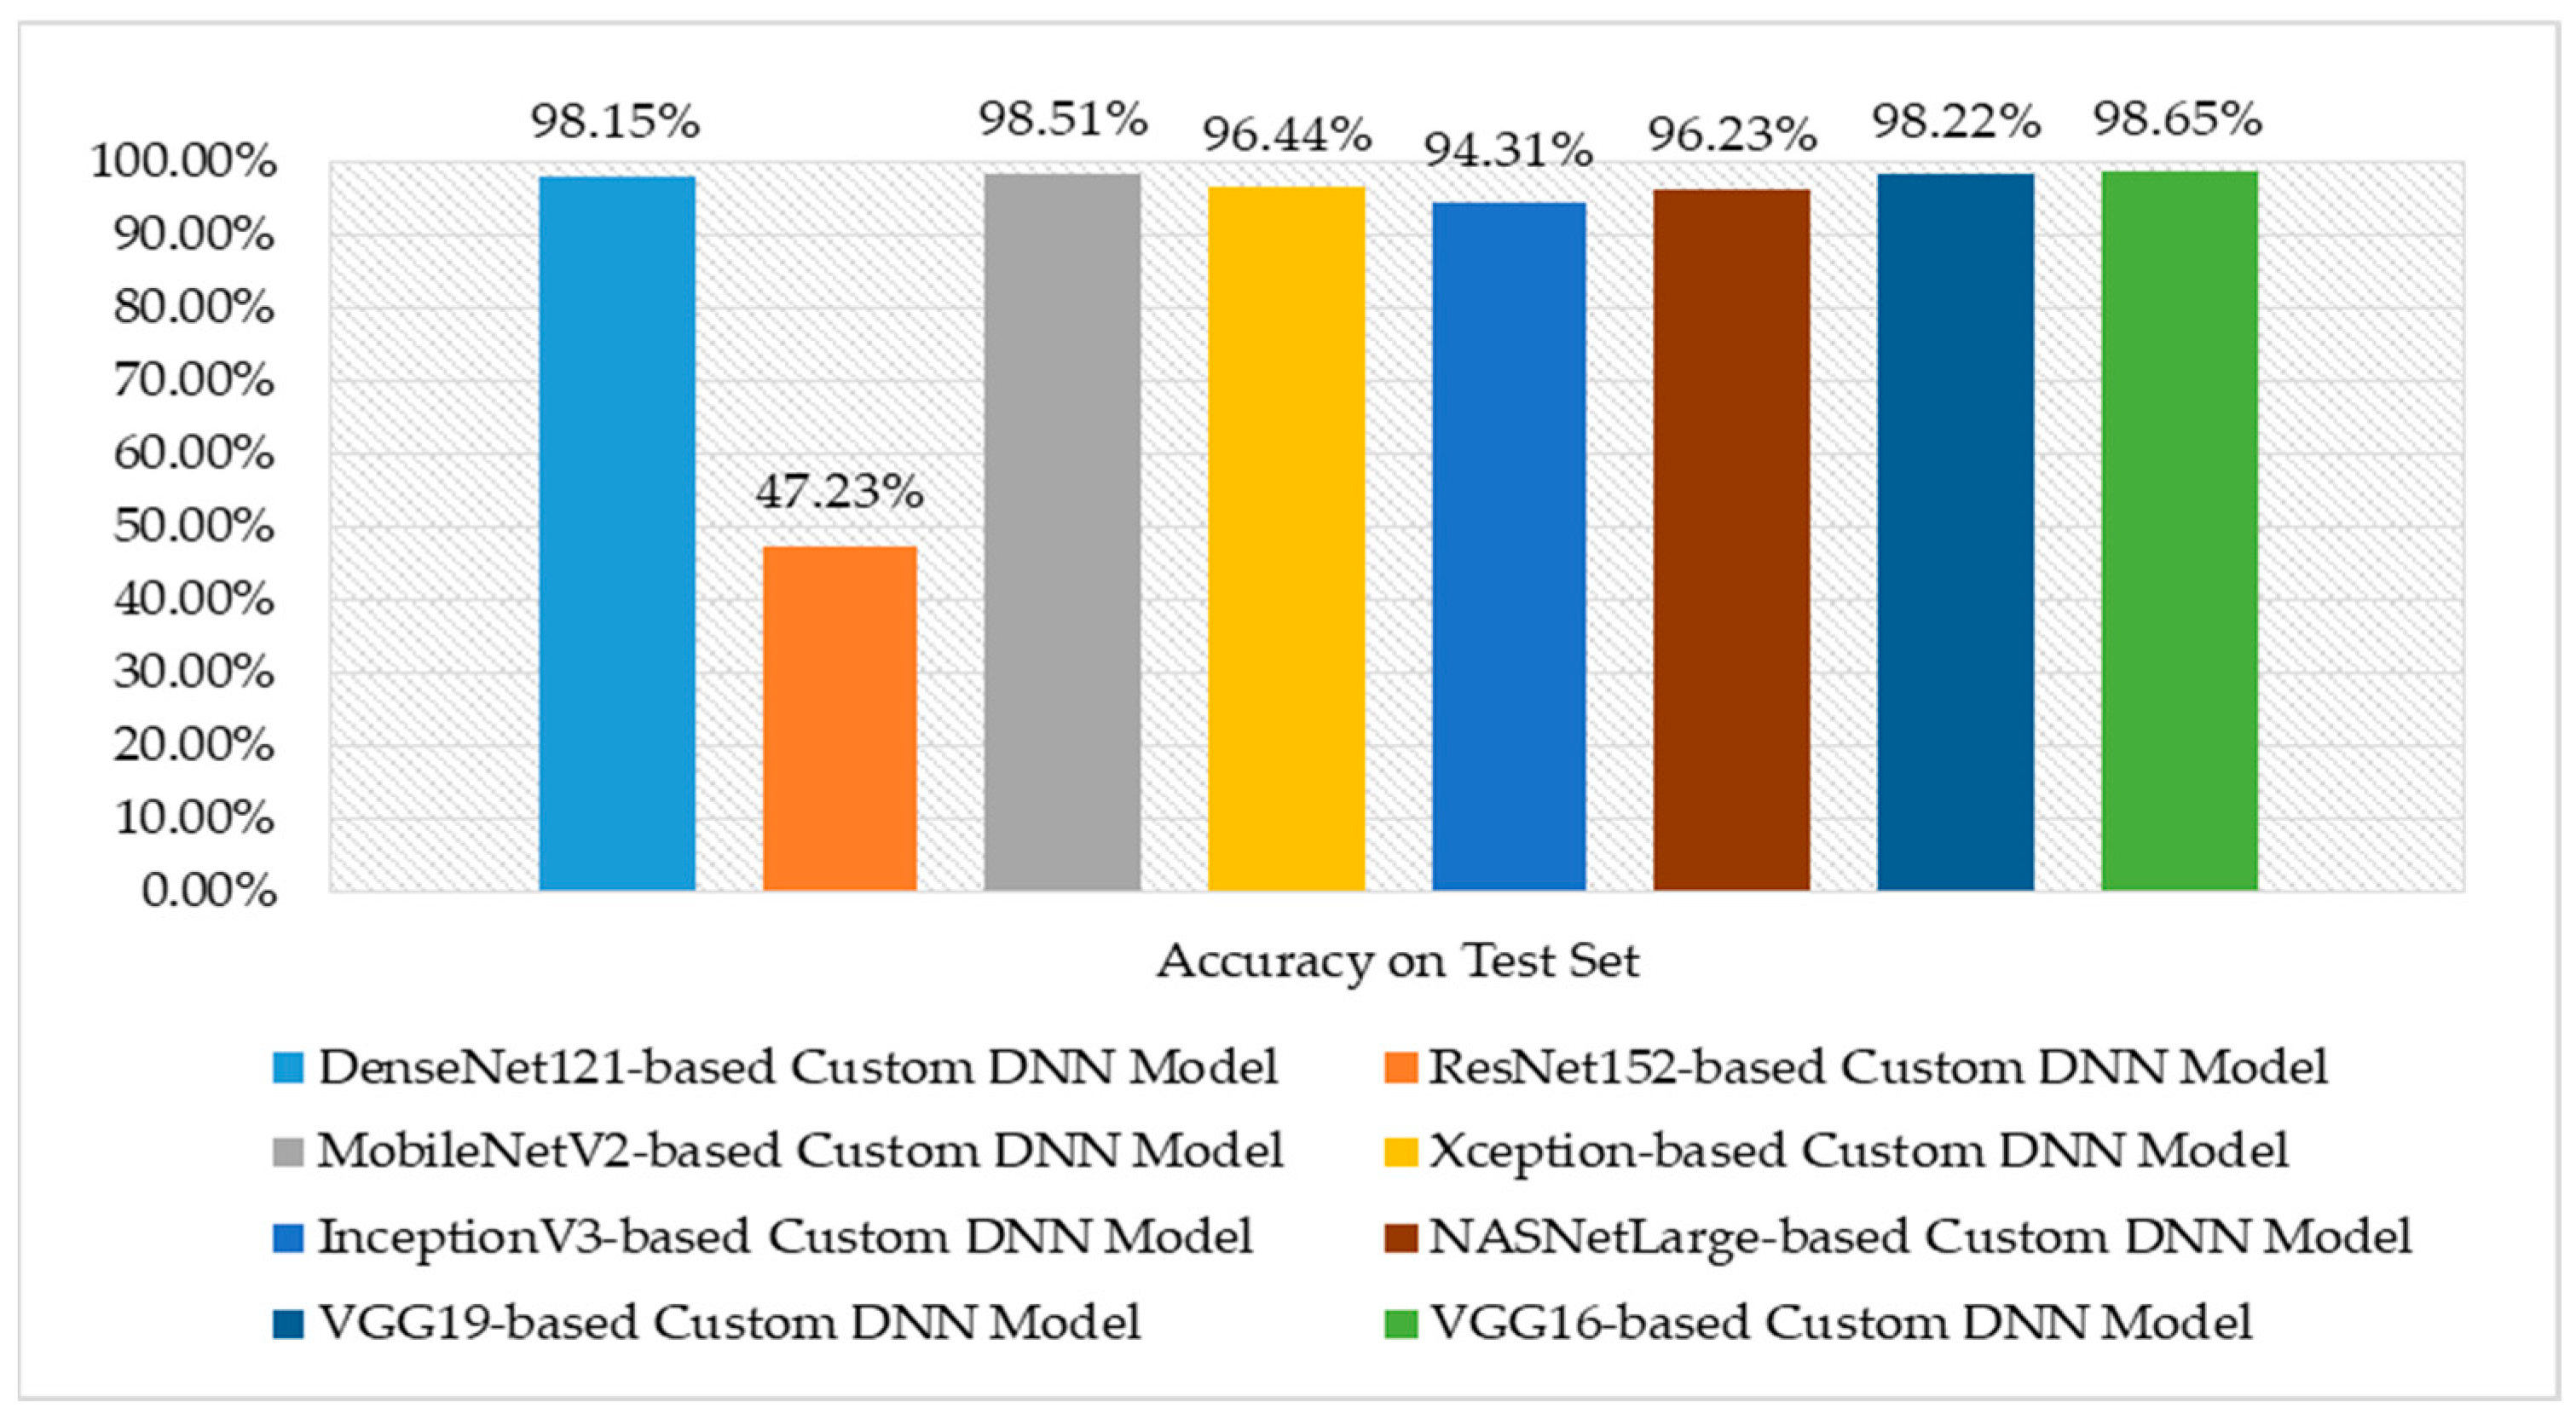
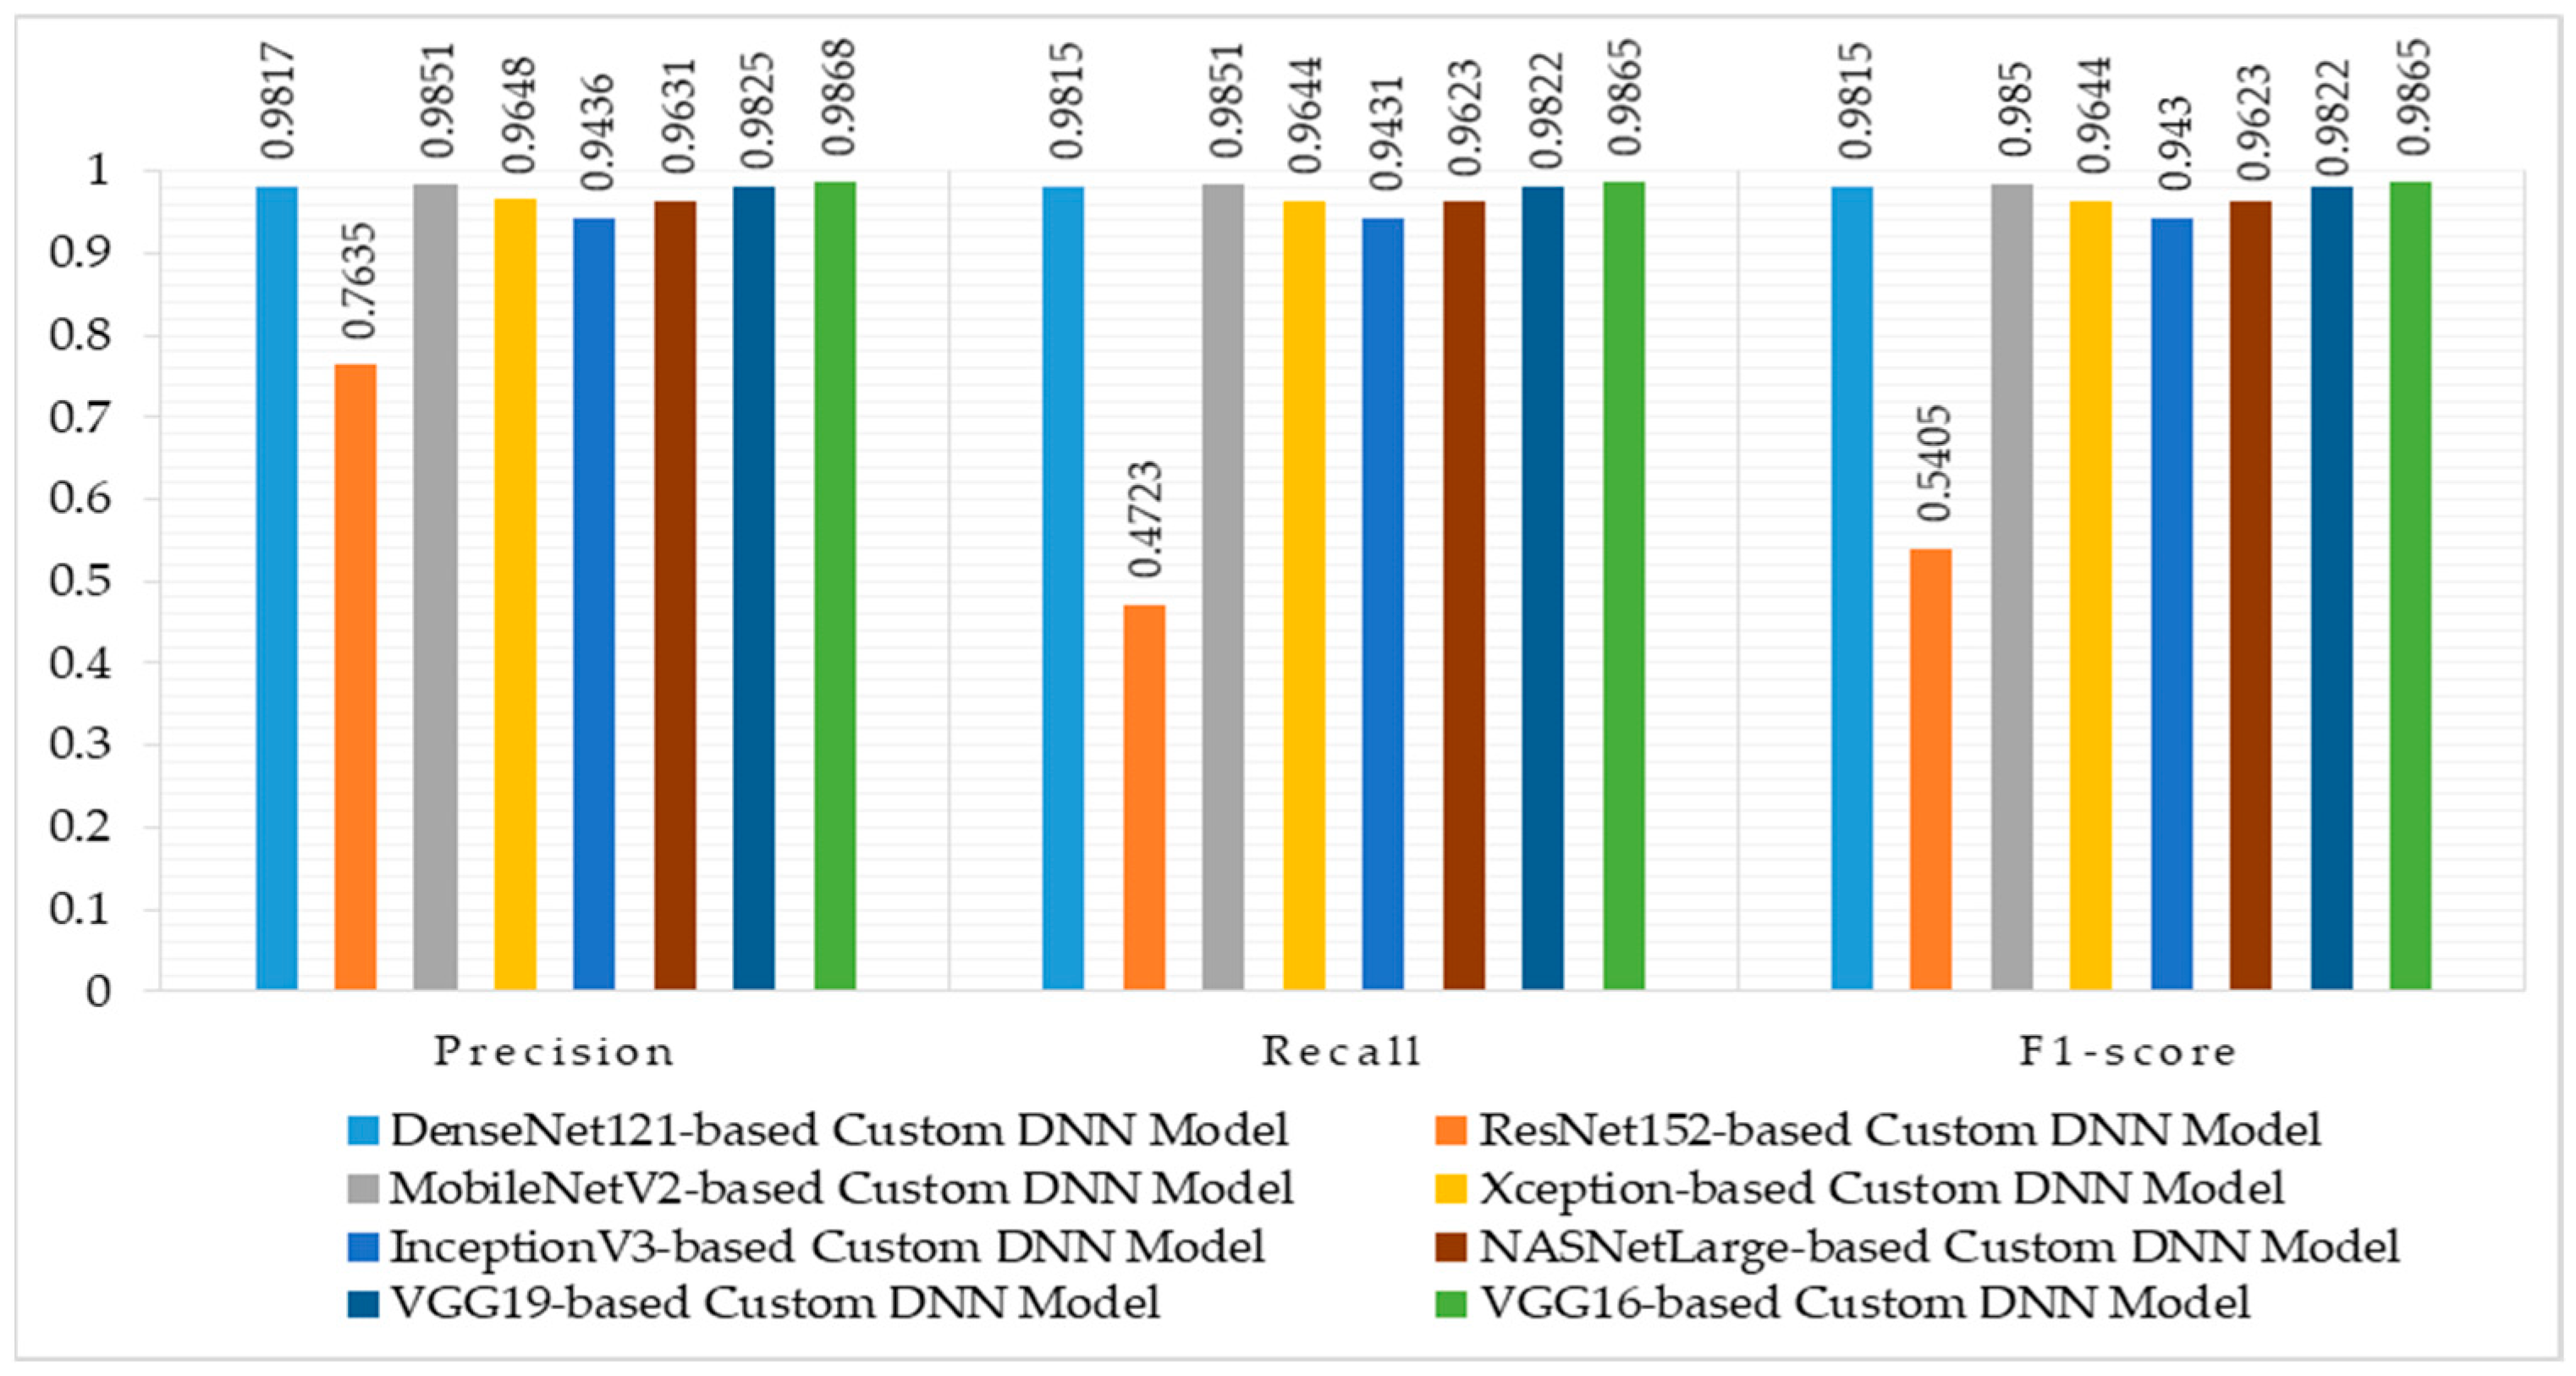
| Model | Accuracy | Precision | Recall | F1-Score |
|---|---|---|---|---|
| DenseNet121 | 98.15% | 0.9828 | 0.9797 | 0.9811 |
| ResNet152 | 47.23% | 0.7500 | 0.4819 | 0.5292 |
| MobileNetV2 | 98.51% | 0.9859 | 0.9850 | 0.9854 |
| Xception | 96.44% | 0.9631 | 0.9647 | 0.9636 |
| InceptionV3 | 94.31% | 0.9440 | 0.9403 | 0.9419 |
| NASNetLarge | 96.23% | 0.9625 | 0.9639 | 0.9628 |
| VGG19 | 98.22% | 0.9815 | 0.9828 | 0.9820 |
| VGG16 | 98.65% | 0.9863 | 0.9876 | 0.9868 |
| Model | Accuracy | Precision | Recall | F1-Score |
|---|---|---|---|---|
| DenseNet121 | 97.68% | 0.9771 | 0.9768 | 0.9768 |
| ResNet152 | 48.36% | 0.7612 | 0.4836 | 0.5486 |
| MobileNetV2 | 97.63% | 0.9773 | 0.9763 | 0.9763 |
| Xception | 96.44% | 0.9650 | 0.9644 | 0.9645 |
| InceptionV3 | 94.12% | 0.9417 | 0.9412 | 0.9411 |
| NASNetLarge | 95.78% | 0.9586 | 0.9578 | 0.9578 |
| VGG19 | 97.53% | 0.9756 | 0.9753 | 0.9754 |
| VGG16 | 98.44% | 0.9848 | 0.9844 | 0.9844 |
| [Ref.] (Year) | Model Advantages and Disadvantages | Sign Letters or Words | Accuracy | Is Efficiency Measured? | Is it Bidirectional? |
|---|---|---|---|---|---|
| [32] (2020) | Pros:
| Letters | 90% | Not Measured | No |
| [63] (2021) | Pros:
| Letters | 96.59% (without SMOTE), and 97.29% (with SMOTE) | Not Measured | No |
| [64] (2022) | Pros:
| Letters | 95% | Not Measured | No |
| [65] (2022) | Pros:
| Words | 93.4% | Not Measured | No |
| [66] (2022) | Pros:
| Letters | 97% | Not Measured | No |
| [33] (2022) | Pros:
| Letters and Words | 98% | Not measured | No |
| [67] (2023) | Pros:
| Letters | 97.9% validation accuracy | Not Measured | No |
| [68] (2023) | Pros:
| Letters | 97.07% | Not Measured | No |
| [34] (2023) | Pros:
| Letters | 93.7% | Not measured | No |
| [35] (2023) | Pros:
| Letters | 97% | measured | No |
| [36] (2023) | Pros:
| Letters and Numbers | Not measured | Not measured | No |
| [37] (2024) | Pros:
| Words | 97% | Not measured | No |
| [38] (2024) | Pros:
| Letters | 97% | Not measured | No |
| [This Work] (2024) | Pros:
| Words | 98.65% | Measured | Yes |
Disclaimer/Publisher’s Note: The statements, opinions and data contained in all publications are solely those of the individual author(s) and contributor(s) and not of MDPI and/or the editor(s). MDPI and/or the editor(s) disclaim responsibility for any injury to people or property resulting from any ideas, methods, instructions or products referred to in the content. |
© 2024 by the authors. Licensee MDPI, Basel, Switzerland. This article is an open access article distributed under the terms and conditions of the Creative Commons Attribution (CC BY) license (https://creativecommons.org/licenses/by/4.0/).
Share and Cite
Mosleh, M.A.A.; Assiri, A.; Gumaei, A.H.; Alkhamees, B.F.; Al-Qahtani, M. A Bidirectional Arabic Sign Language Framework Using Deep Learning and Fuzzy Matching Score. Mathematics 2024, 12, 1155. https://doi.org/10.3390/math12081155
Mosleh MAA, Assiri A, Gumaei AH, Alkhamees BF, Al-Qahtani M. A Bidirectional Arabic Sign Language Framework Using Deep Learning and Fuzzy Matching Score. Mathematics. 2024; 12(8):1155. https://doi.org/10.3390/math12081155
Chicago/Turabian StyleMosleh, Mogeeb A. A., Adel Assiri, Abdu H. Gumaei, Bader Fahad Alkhamees, and Manal Al-Qahtani. 2024. "A Bidirectional Arabic Sign Language Framework Using Deep Learning and Fuzzy Matching Score" Mathematics 12, no. 8: 1155. https://doi.org/10.3390/math12081155
APA StyleMosleh, M. A. A., Assiri, A., Gumaei, A. H., Alkhamees, B. F., & Al-Qahtani, M. (2024). A Bidirectional Arabic Sign Language Framework Using Deep Learning and Fuzzy Matching Score. Mathematics, 12(8), 1155. https://doi.org/10.3390/math12081155