Article

Improving Support Vector Regression for Predicting Mechanical Properties in Low-Alloy Steel and Comparative Analysis

1
School of Mechanical Engineering & Automation, Beihang University, Beijing 100191, China
2
Jiangxi Research Institute, Beihang University, Nanchang 330096, China
*
Author to whom correspondence should be addressed.
Mathematics 2024, 12(8), 1153; https://doi.org/10.3390/math12081153
Submission received: 13 March 2024 / Revised: 6 April 2024 / Accepted: 10 April 2024 / Published: 11 April 2024
(This article belongs to the Special Issue Nonlinear and Evolutionary Optimization in Materials and Engineering)

Abstract

:
Low-alloy steel is widely employed in the aviation industry for its exceptional mechanical properties. These materials are frequently used in critical structural components such as aircraft landing gear and engine mounts, where a high strength-to-weight ratio is crucial for optimal performance. However, the mechanical properties of low-alloy steel are influenced by various components and their compositions, making identification and prediction challenging. Accurately predicting these mechanical properties can significantly reduce the development time of new alloy steel, lower production costs, and offer valuable insights for design analysis. support vector regression (SVR) is known for its superior learning and generalization capabilities. However, optimizing SVR performance can be challenging due to the significant impact of the penalty factor and kernel parameters. To address this issue, a hybrid method called SMA-SVR is proposed, which combines the Slime Mould Algorithm (SMA) with SVR. This hybrid approach aims to efficiently and accurately predict two crucial mechanical parameters of low-alloy steel: tensile strength and 0.2% proof stress. Detailed descriptions of the modeling processes and principles that are involved in the hybrid method are provided. Furthermore, three other popular hybrid models for comparison are introduced. To evaluate the performance of these models, four statistical measures are utilized: Mean Absolute Error, Root Mean Square Error, R-Squared, and computational time. Using data from the NIMS database and from material tests conducted on a universal testing machine, experiments were carried out to compare the performance of these models. The results indicate that SMA-SVR outperforms the other methods in terms of accuracy and computational efficiency.

1. Introduction

Material mechanical properties play a fundamental role in various areas, such as design specifications, manufacturing processes, operational methods, and failure analysis. Conventional experiments are frequently employed to ascertain the mechanical properties of materials. Extensive testing can be resource-intensive and non-directional, which is frequently unavoidable in the search for innovative materials with improved performance. Moreover, traditional methods struggle to keep pace with the modern industrial need for high quality, rapid production cycles, and cost efficiency. Therefore, there is a growing necessity to swiftly and accurately predict the mechanical properties of materials.
Predicting material performance presents challenges. Factors like chemical composition, element content, manufacturing processes, and operating temperatures intricately influence material behavior, creating a complex nonlinear system that is challenging to decipher. Although data form the backbone of material performance prediction, the time-consuming nature of material testing sometimes results in small datasets. Effectively identifying the nonlinear system under limited sample conditions becomes crucial for ensuring the reliability of material attribute predictions.
In response to these issues, scientists have proposed various predictive methods, including empirical formulations [1,2], linear regression analysis [3,4], finite element analysis (FEA) [5], and Monte Carlo methods [6,7,8,9]. These methods are predominantly empirical and statistical in nature. However, the practical implementation of these methods is often hindered by the inherent difficulties in capturing nonlinear correlations within the data, leading to reduced prediction accuracy and limited generalizability. Mechanism modeling has emerged as an alternative approach for predicting the mechanical properties of materials. Nonetheless, the complexity of these mechanisms, which are contingent upon production and manufacturing processes, restrict their applicability. For instance, traditional metallurgical mechanism models, while effective in representing most processing procedures, are structurally complex, computationally intensive, and require a deep understanding of specific metallurgical processes as a prerequisite [10].
Researchers have increasingly focused on utilizing machine learning methods to predict material performance, leveraging their capacity to extract high-dimensional features from raw data [11,12,13,14,15]. By effectively capturing the nonlinear relationships between material parameters and mechanical properties, machine learning models offer valuable insights into the complex interplay, thus guiding experimental efforts [16]. Ke Duan et al. [17] developed a model that integrates molecular dynamics simulations, particle swarm optimization (PSO), and artificial neural networks to determine the coarse granulation of cross-linked epoxy resins. Similarly, Georgios Konstantopoulos et al. [18] introduced a machine learning model to elucidate the structure–property relationship in carbon fiber-reinforced polymer composites (CFRPs), comparing the classification performance of neural networks, decision trees, and support vector machines. In another study, Yupeng Diao [19] devised a predictive model for steel corrosion by translating chemical composition into physical characteristics. Meanwhile, Changsheng Wang [20] employed a machine learning system for the design of alloy material compositions, thereby expediting the material development process. M.Z. Naser [21] put forth an analytical model based on symbolic regression and genetic algorithms (GAs) to forecast the behavior of concrete structures under high-temperature conditions. Additional research endeavors encompassed the prediction of solute behaviors in ductile magnesium alloys [22], residual stress estimation in aluminum plates using the K-Nearest Neighbors (KNN) algorithm [23], and the evaluation of glass fiber orientation through a convolutional neural network and inertial tensor analysis [24].
From the above research, it can be observed that current machine learning used for material performance prediction can mainly be divided into artificial neural networks, backpropagation networks, tree models and their variations, and deep neural networks. The accuracy of regression models based on artificial neural networks highly depends on the quality and quantity of the input data. If the dataset is insufficient or contains noise, the predictive ability of the model is likely to be affected. Although training neural network models with backpropagation can help the model converge quickly, its performance is still influenced by multiple hyperparameters, such as the learning rate, hidden layer, and number of neurons, which are often set empirically.
Subsequently, prediction methods based on tree models, such as random forests, have shown good performance, but they also require a large amount of parameter tuning and computational resources, especially as the dataset size increases, as the model can become time-consuming. Moreover, if the model overfits the training data, it may perform poorly on the test data.
Some deep learning models may perform well in predicting the performance of specific types of metals, but for different types of alloys, they may require readjustments to provide satisfactory predictive performance. For example, deep neural networks usually require a substantial number of computational resources and time for training, which may limit their feasibility in practical applications. Lastly, in many cases, the datasets for metals are small, which requires the developed predictive models to quickly learn the nonlinear relationship between metal elements and mechanical performance.
Consequently, the development of efficient machine learning models capable of predicting the mechanical properties of materials holds paramount importance while also furnishing valuable insights for the advancement of new materials. For instance, comprehending the intricate interrelationships among process parameters, structural configurations, and mechanical properties of alloys is indispensable for conducting retrospective analyses and identifying the optimal process parameters [25]. Low-alloy steel holds significant value in various industries due to its consistent quality, excellent corrosion resistance, remarkable technological properties, and high recovery rate. These types of steel find applications in engineering plants, aircraft bodies, automobiles, ships, buildings, and bridges. The mechanical characteristics of alloy steel are predominantly governed by their chemical composition and manufacturing process [26,27]. However, the rolling process of alloy steel presents a complex and nonlinear system, posing significant challenges in mathematically expressing these relationships [28]. Studies have indicated that the microstructure of alloys, influenced by their chemical composition, manufacturing method, and operating temperature, plays a crucial role in determining their properties [29,30]. Consequently, a machine learning-based model leveraging elemental composition and microstructure can be developed to forecast the mechanical properties of low-alloy steel.
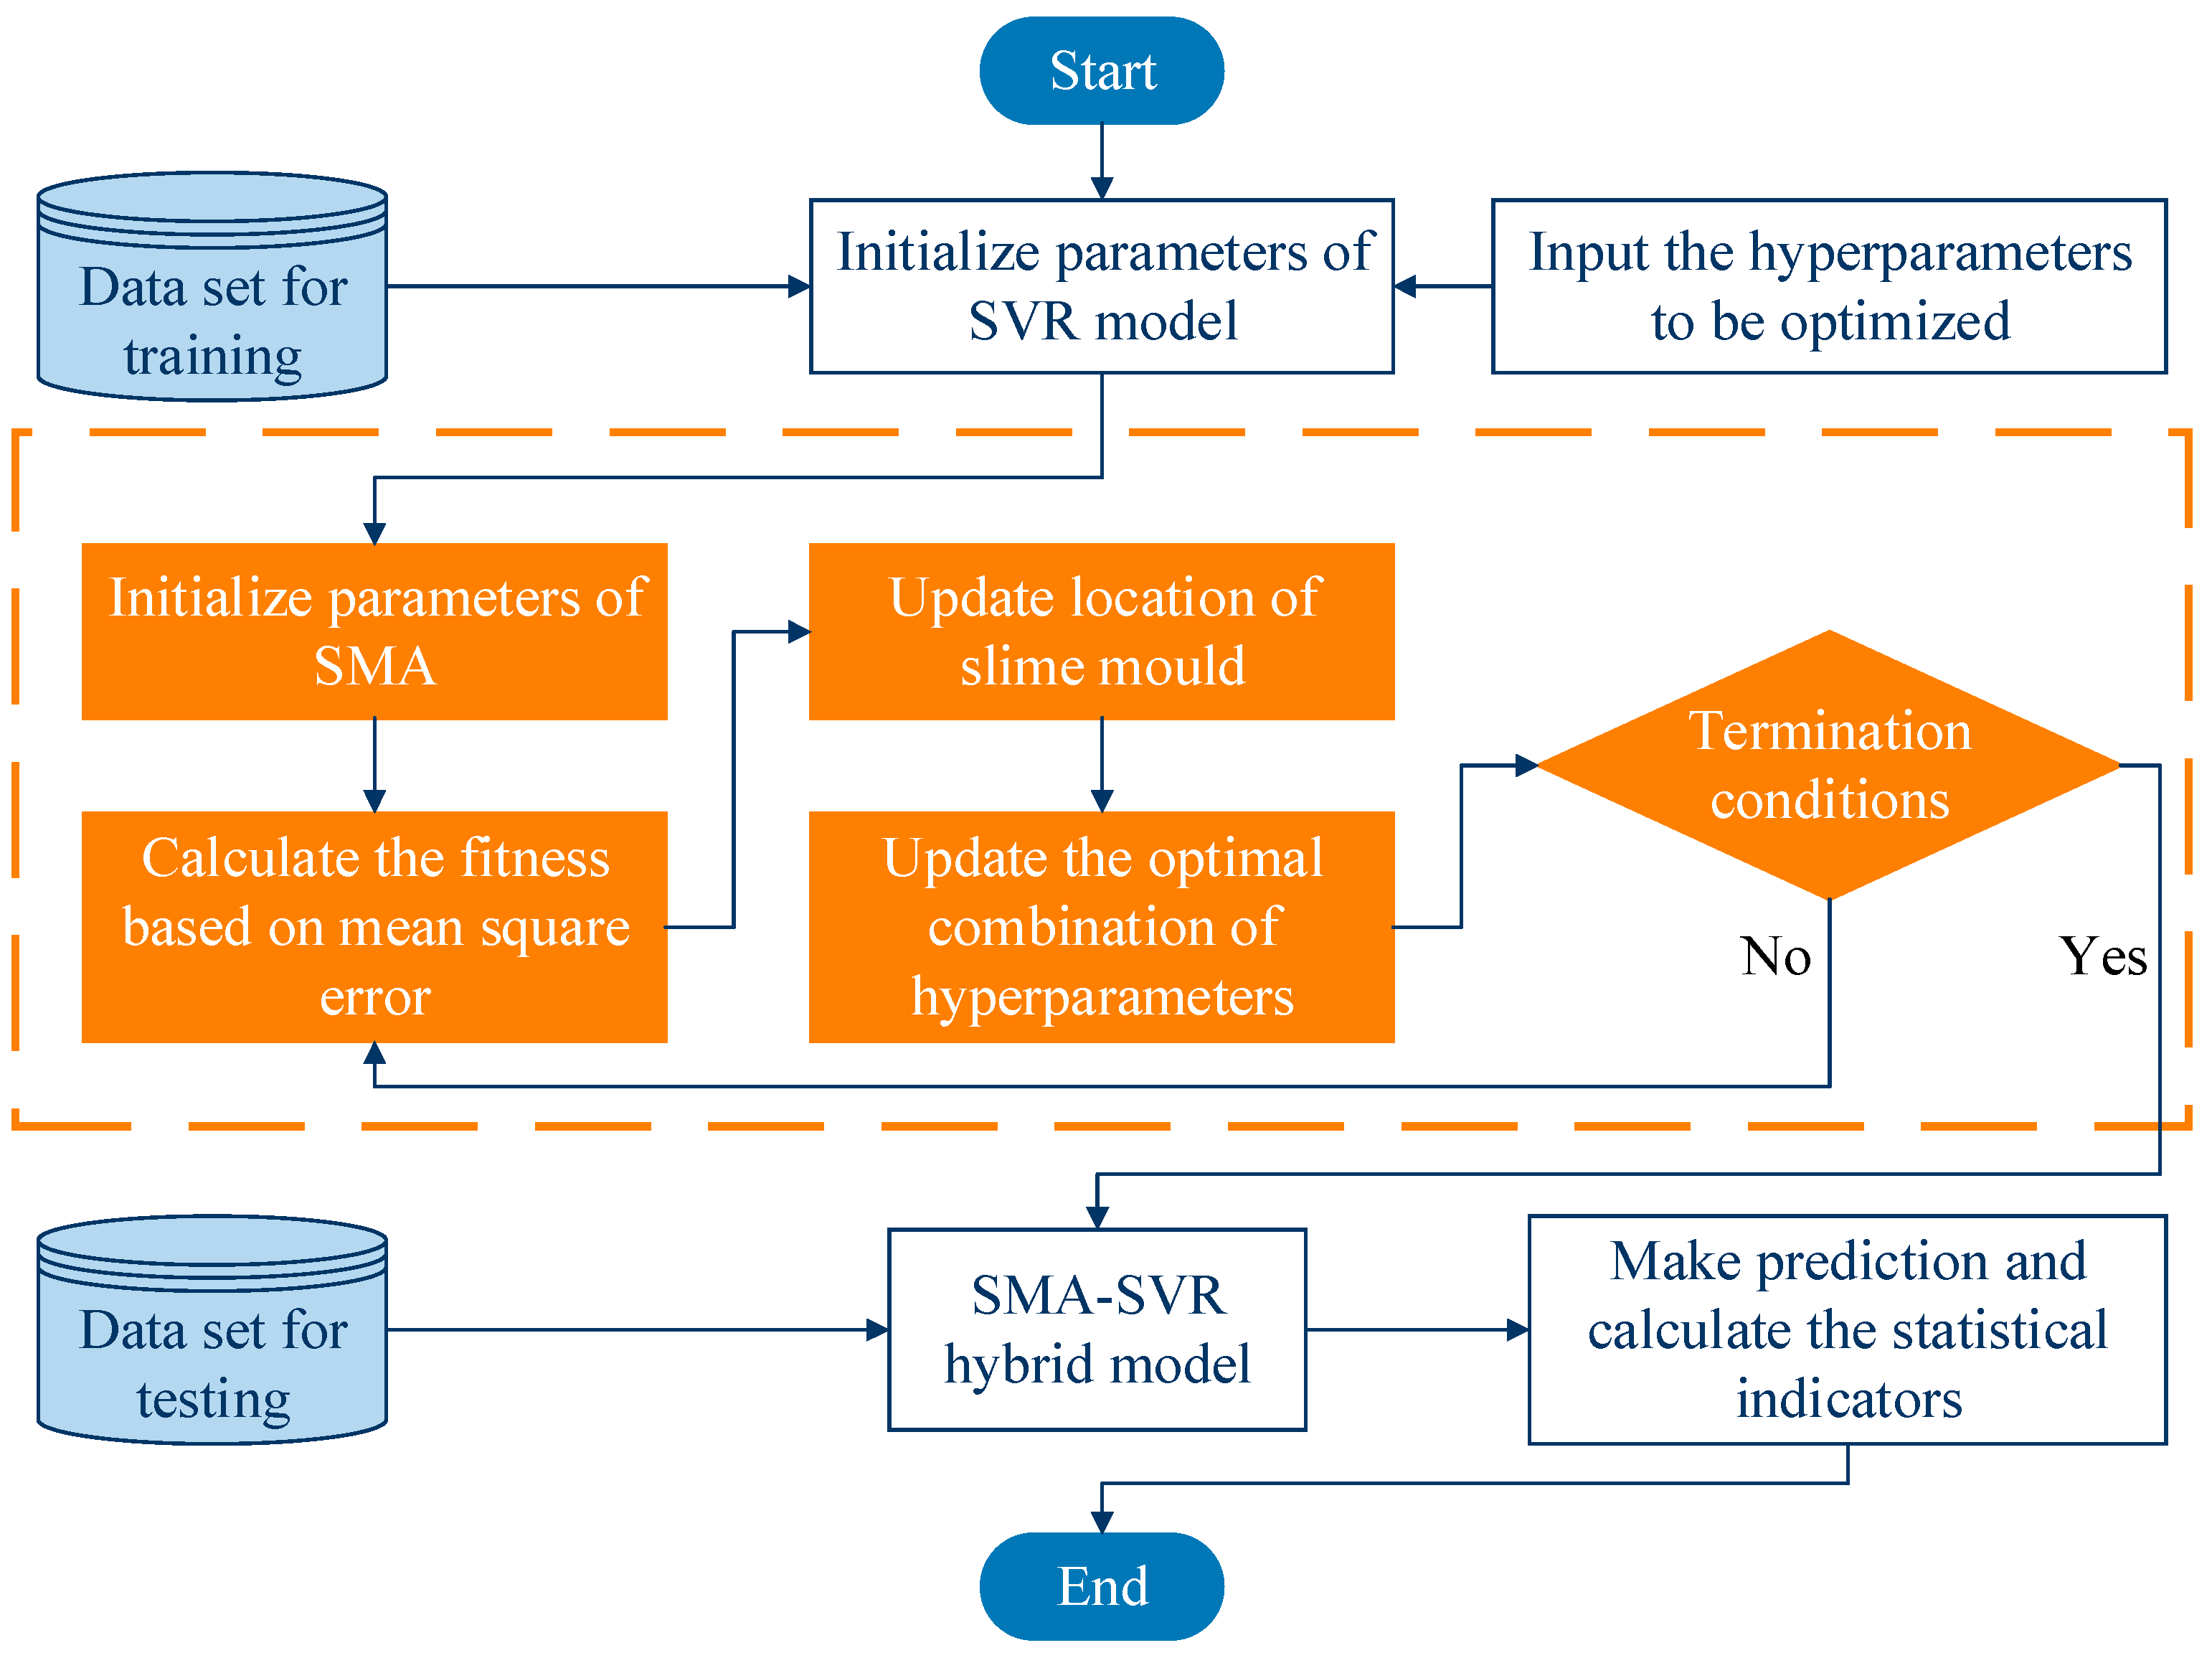
In this paper, a hybrid framework utilizing support vector regression (SVR) optimized by the Slime Mould Algorithm (SMA) is proposed to predict the mechanical properties of low-alloy steel. SVR is well-suited to address challenges associated with high dimensionality, small sample size, and nonlinearity, while SMA is adept at searching for and optimizing the penalty factor and kernel parameter of SVR to boost prediction accuracy and robustness. The study employs data on low-alloy steel from the NIMS Materials Database and data from material tests conducted on a universal testing machine (UTM). The target is to predict two key mechanical parameters: tensile strength and 0.2% proof stress. The model’s predictive prowess was assessed using four statistical criteria—Mean Absolute Error (MAE), R2 (R-Squared), computational time, and Root Mean Square Error (RMSE). Furthermore, three popular hybrid models optimized through metaheuristics were selected and compared with SMA-SVR. These models included SVR optimized by Grey Wolf Optimizer (GWO-SVR), Back Propagation optimized by particle swarm optimization (PSO-BP), and the Elman recurrent neural network optimized by the Sparrow Search Algorithm (SSA-Elman), all of which have exhibited promising performance in engineering and materials science studies [31,32,33,34,35,36,37]. The parameters of the respective models were fine-tuned using metaheuristic algorithms. The discussion delves into the experimental findings of SMA-SVR, along with its comparative analysis with GWO-SVR, PSO-BP, and SSA-Elman.
The novelty of this study can be mainly summarized in the following points:
  • Firstly, this work combines SMA with SVR to optimize the key hyperparameters, which is not commonly seen in previous studies on predicting the mechanical properties of materials in materials science. The proposed model is specifically applied and discussed in the domain of predicting the mechanical properties of low-alloy steel, which is a practical contribution to the interdisciplinary field of materials science and artificial intelligence.
  • Secondly, the established hybrid model provides comprehensive experimental validation by comparing it with different popular models, thereby analyzing the effectiveness and unique features of the proposed method.
  • Lastly, the model training and validation are conducted using the data from both the NIMS database and UTM testing. By incorporating publicly available data for testing the model performance and utilizing small-sample datasets for validation, the practicality and credibility of the research are enhanced.
The subsequent sections of this paper include the following: a detailed exploration of the modeling process and evaluation metrics in Section 2, an investigation and discourse on the prediction accuracy and efficacy of hybrid models utilizing the NIMS database in Section 3, prediction experiments employing material test data from the UTM in Section 4, and a conclusive summary accompanied by insights into future research avenues in Section 5.

2. Modeling Process of Hybrid Models Incorporating Multiple Statistical Indicators

2.1. Support Vector Regression Optimized by Slime Mould Algorithm

SVR was proposed by Vapnik et al. in 1996 [38]. It is commonly used to solve high-dimensional modeling, small samples, and nonlinear problems. The main theory of SVR is as follows. For a given dataset, D = { x i , y i } i = 1 n , where xi is the i-th input eigenvector, yi is the corresponding output vector and n is the number of all samples. Nonlinear mapping is used to map the sample set from low-dimensional space to high-dimensional space. This kind of nonlinear mapping can be defined as shown below [39]:
f x = ω ϕ x + b
where x represents input data, ω is weight, and b is the intercept. { ξ i } i = 1 n and { ξ i * } i = 1 n are introduced as relaxation variables. Then, the equation can be changed as follows [40]:
min H ω , b , ξ = 1 2 ω 2 + C i = 1 n ξ i + ξ i *
s . t . y i ω ϕ x b ε + ξ i ω ϕ x + b y i ε + ξ i * ξ i , ξ i * 0 ,   i = 1 , 2 , , n
where C is the penalty factor, and ε is the maximum allowable error of the regression. Equation (2) can be transformed into the following Equation (4) by introducing the Lagrange multiplier and kernel function [38]:
max H α i * , α i = 1 2 i = 1 n j = 1 n α i * α i α j * α j ϕ x i ϕ x j i = 1 n α i y i + ε + i = 1 n α i * y i ε
s . t . i n α i * α i = 0 0 α i , α i * C
where α i * , α i are Lagrange multipliers. After minimizing the Lagrange function, the formula of the nonlinear mapping is obtained. Its expression can be described as follows [38]:
f x = i = 1 n α i α i * K x i , x + b
where K ( x i , x ) is the kernel function. And radial basis function (RBF) is a type of kernel function that is used commonly in SVR. σ represents the kernel parameter of RBF. Then, its expression can be defined as below [41]:
K R B F x i , x = exp x i x 2 2 σ 2
SMA was proposed in 2020 by Li et al. [42]. SMA is inspired by the spreading and foraging behaviors of Physarum polycephalum. Slime mould mainly relies on propagating waves generated by biological oscillators to change the flow of cytoplasm in the veins, which encourages them to move toward locations with better food concentrations. The behavior of slime mould searching for food is modeled as a mathematical equation with the following position-updated equation [42]:
X t + 1 = X b t + v b W X A t X B t ,   r < p v c X t ,   r p
p = tanh S i F D
where Xb is the highest concentration of food odor found at present. X is the current position of slime mould. XA and XB are the fitness values of two randomly selected individuals. t is the current iteration. vb is a coefficient that randomly oscillates between [−a, a] and tends toward zero with increasing iterations. vc is a coefficient whose value is between [ 0 , 1 ] and finally tends to 0. W is the adaptive weight of slime mould. r is a random value in the interval [ 0 , 1 ] . S(i) represents the fitness of X. FD is the best fitness in all iterations. tmax represents the maximum iteration. The expressions of a and W are defined below [42]:
a = arctanh 1 t t max
W S sort i = 1 + r log F b S i F b F w + 1 ,   condition 1 r log F b S i F b F w + 1 ,   others
where r simulates the uncertainty of the slime mould venous contraction. The condition represents the top half of the population in S(i). In fact, it mimics the way that slime mould searches for food. Fb is the best fitness obtained in the current iteration, and Fw represents the worst fitness. S sort ( i ) represents the fitness sequence (select the increasing sequence when solving the minimization problem).
When forecasting based on the SVR model, both the error of prediction value and the computational time of the model are significantly affected by the penalty factor C and the kernel parameter σ . However, there is a lack of methods to guide the selection of the hyperparameters of SVR. When the dataset and optimization goal change, the optimal combination of parameters changes a lot. Therefore, it is difficult to select a suitable combination based on experience. SMA, as a biological metaheuristic algorithm, has fast global search and effective convergence ability. When different optimization problems need to be solved, SMA can select a set of appropriate hyperparameter combinations for SVR to achieve the goal of reducing its computational time and improving prediction accuracy.
The modeling steps of SMA-SVR are as follows:
(1)
Divide the material dataset into the training set and test set. Then, normalize the data. The content of the elements and temperature of low-alloy steel are used as input features, and a certain mechanical property is used as the output variable to be predicted.
(2)
Set the bounds of the two hyperparameters of SVR. Provide the initial parameters of SMA, including the dimensionality of the variables, the number of slime populations, and maximum iterations.
(3)
Use the hyperparameters of SVR as the optimization variables of SMA and then calculate the optimal individuals of the population using the fitness function.
(4)
With iterations, SMA gradually steers the population toward minimizing the deviation of the predicted value from the true value.
(5)
The optimal combination of hyperparameters, searched by SMA, is output to the SVR. The data and the optimized hyperparameters are used to perform the training of the SVR model.
(6)
Calculate the accuracy of the predicted values and the computational time of the model based on multiple statistical indicators.
(7)
Output the experimental results, while the associated images are automatically drawn based on the program.
The modeling process of SMA-SVR is shown in Figure 1.
The Mean Square Error (MSE) is the expected value of the square of the difference between the estimated value and the true value. It is suitable for evaluating the degree of variation in data. A smaller MSE means more accurate predicted data. Thus, MSE is chosen as the fitness function in this paper and defined as follows:
MSE = 1 n i = 1 n y i y i ^ 2
where n represents the number of samples. y i ^ is the predicted value and y i is the real value of the dataset.
Moreover, in order to evaluate the ability of prediction and robustness more fairly, three other error measurements were selected as the basis for analyzing the performance of the model. Their descriptions are as follows. MAE is the average of the absolute errors between the predicted and observed values. RMSE is the square root of MSE. A regression model’s R2 statistic estimates the percentage of the dependent variable’s variation that the independent variable can account for. R2 demonstrates how well the data fit the regression model. Computational time (CT) is the sum of the time spent on training and testing the model each time, which is automatically recorded by the timer of the program.
MAE = 1 n i = 1 n y i y i ^
RMSE = 1 n i = 1 n y i y i ^ 2
R 2 = 1 i = 1 n y i y i ^ 2 i = 1 n y i y ¯ 2

2.2. Further Explanation of the Optimization Parameters

In this paper, a hybrid model was proposed combining SMA optimization with SVR by optimizing the penalty factor and kernel parameter. In addition, other recognized hybrid models were selected to compare their prediction performance. Specifically, Grey Wolf Optimization (GWO) was utilized to optimize the SVR parameters, leading to the creation of GWO-SVR. Moreover, particle swarm optimization (PSO) was applied to optimize the weight and threshold of Back Propagation (BP), resulting in the development of PSO-BP. Lastly, the Sparrow Search Algorithm (SSA) was employed to optimize the initialization parameters (weight and threshold) of Elman, giving rise to SSA-Elman. Each metaheuristic algorithm iteration was conducted over 100 cycles with a population size of 20. For a comprehensive understanding of the optimization parameters, please refer to Table 1 for additional details.

3. Test Cases and Discussion Based on NIMS Database Data

3.1. The Source and Introduction of the Data from NIMS Database

In Section 3.1, Section 3.2 and Section 3.3, a dataset of low-alloy steel was utilized. It was sourced from the Materials Database of the National Institute for Materials Science [43] (https://cds.nims.go.jp/). However, the data available in the NIMS Materials Database were solely provided in PDF format. Thus, an open-source OCR tool (PaddleOCR) was employed to structure the data on low-alloy steel into a tabular format. While the use of an OCR tool proves to be a convenient method for converting PDF data into tabular form, it may introduce certain limitations and biases. Following the identification and merging process checks to ensure the consistency between the original and identified data were also conducted. Subsequently, a dataset consisting of 914 samples, each encompassing 16 features, was compiled. These features included 11 elements of the content of low-alloy steel, 1 facet of temperature information, and 4 attributes concerning the mechanical properties of materials. For a detailed overview of the features, please refer to Table 2.

3.2. Tests and Discussion of Tensile Strength Prediction

Tensile strength stands out as a pivotal variable extensively utilized in design, structural analysis, manufacturing quality management, failure analysis, and other relevant fields. Hence, tensile strength was chosen as the target variable for prediction in this section. The content of elements and temperature of materials, as outlined in Table 2, were selected as the input features for model training. The data were partitioned into training and test sets at a ratio of 7:3. Specifically, 640 rows of data were randomly assigned as the training data input for each modeling iteration, while the remaining 274 rows were earmarked for the test set.
The performance of these hybrid models (SMA-SVR, GWO-SVR, PSO-BP, and SSA-Elman) was assessed. All experiments were carried out on a single computer equipped with an Intel Core i7-11800H processor, Samsung DDR4 3200 MHz 16 GB memory, and NVIDIA GeForce RTX 3060 6 GB graphics card. To gauge the robustness of each hybrid model, the testing process was conducted ten times and documented the average values (MEAN) and standard deviations (STDs) of the results, which are detailed in 
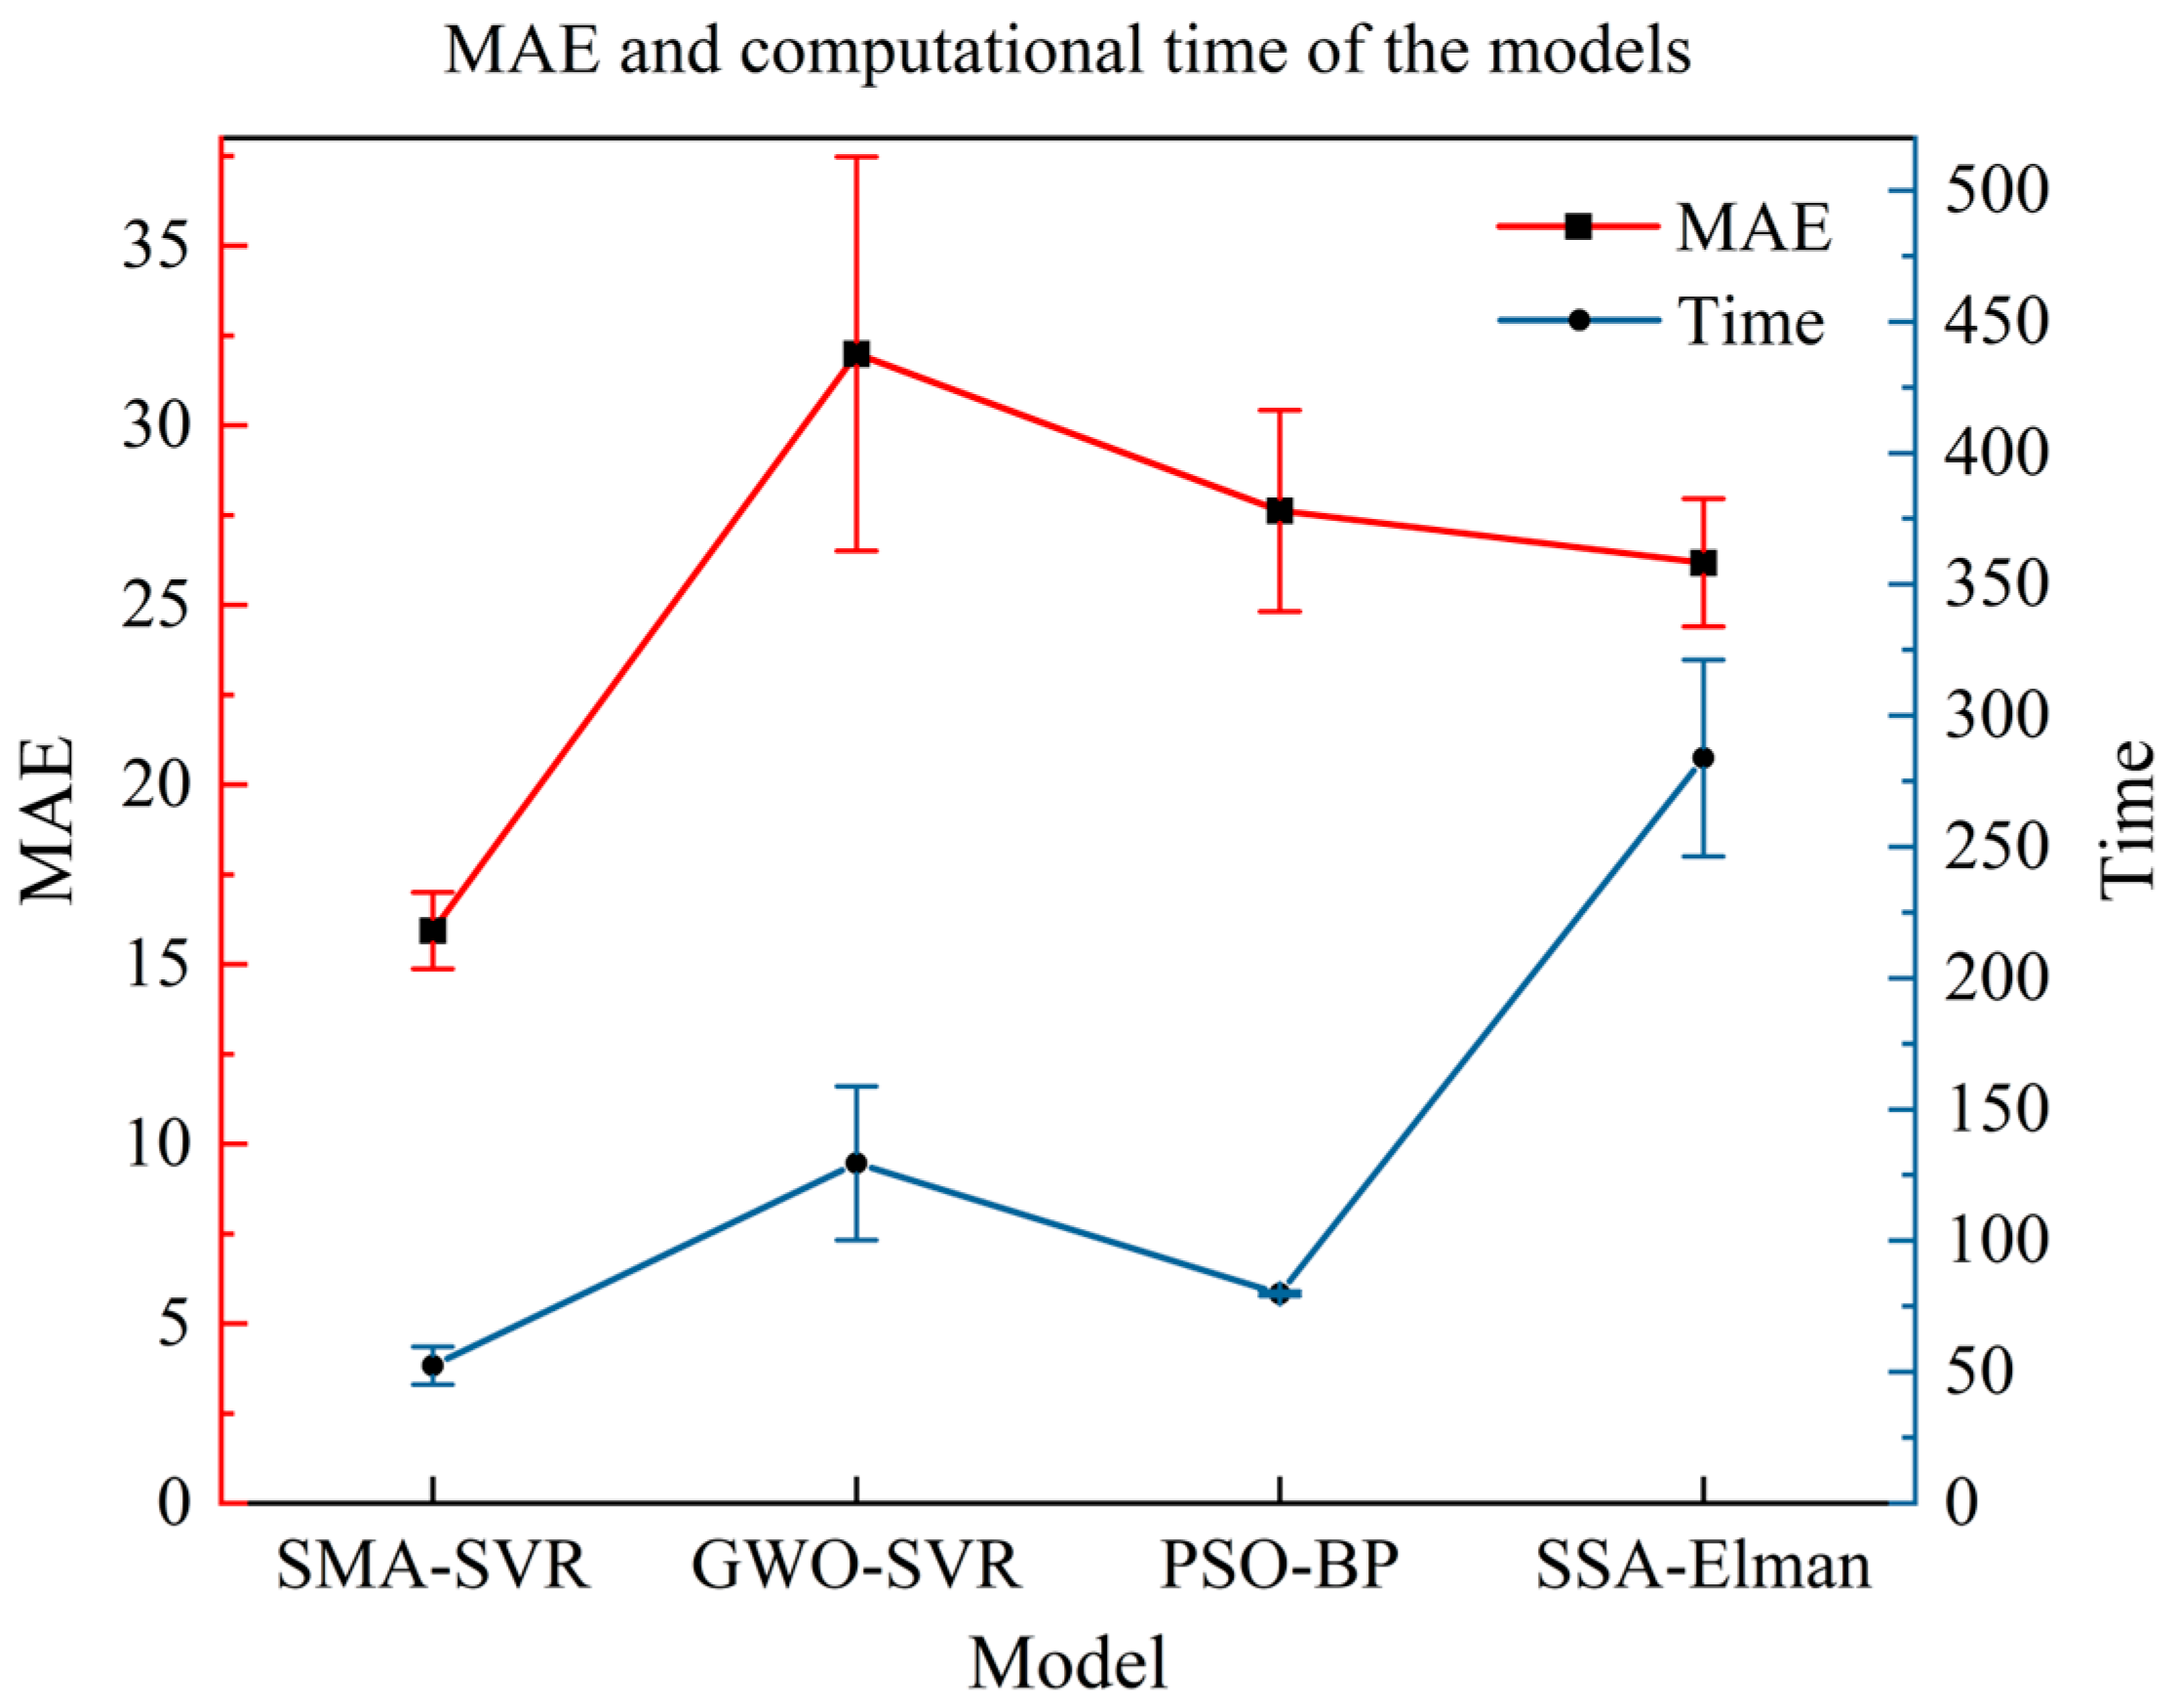
Table 3. To present the test results more intuitively, a dual Y-axis line chart with error intervals was created, as shown in Figure 2. The horizontal axis represents different hybrid models; the left vertical axis corresponds to the MAE of the test results, and the right vertical axis represents the computational time of these models. The legend indicates MAE and time (marked in red and blue, respectively), corresponding to the left and right vertical axes.
The performance of the four hybrid models is compared using different evaluation metrics. The results indicate that the MAE of SMA-SVR is significantly smaller than that of the other three models, with SSA-Elman achieving the lowest MAE of 26.1757. Notably, the MAE of SMA-SVR is 39.12% smaller than that of SSA-Elman. When analyzing RMSE, SMA-SVR demonstrates superior performance compared to PSO-BP, SSA-Elman, and GWO-SVR, in that order. Specifically, the discrepancy between the predicted and actual values is the smallest for SMA-SVR, while GWO-SVR exhibits the largest RMSE among them.
In the evaluation of the R2, which indicates the goodness of fit of the regression model, SMA-SVR stands out with an R2 value of 0.9602. The low standard deviation of R2 at 0.0108 suggests that the predictions made by SMA-SVR are highly stable, with minimal data dispersion. It is noteworthy that a significantly shorter average computational time was required by SMA-SVR compared to GWO-SVR, PSO-BP, and SSA-Elman. In particular, the computational time of SMA-SVR is 81.53%, which is less than that of SSA-Elman.
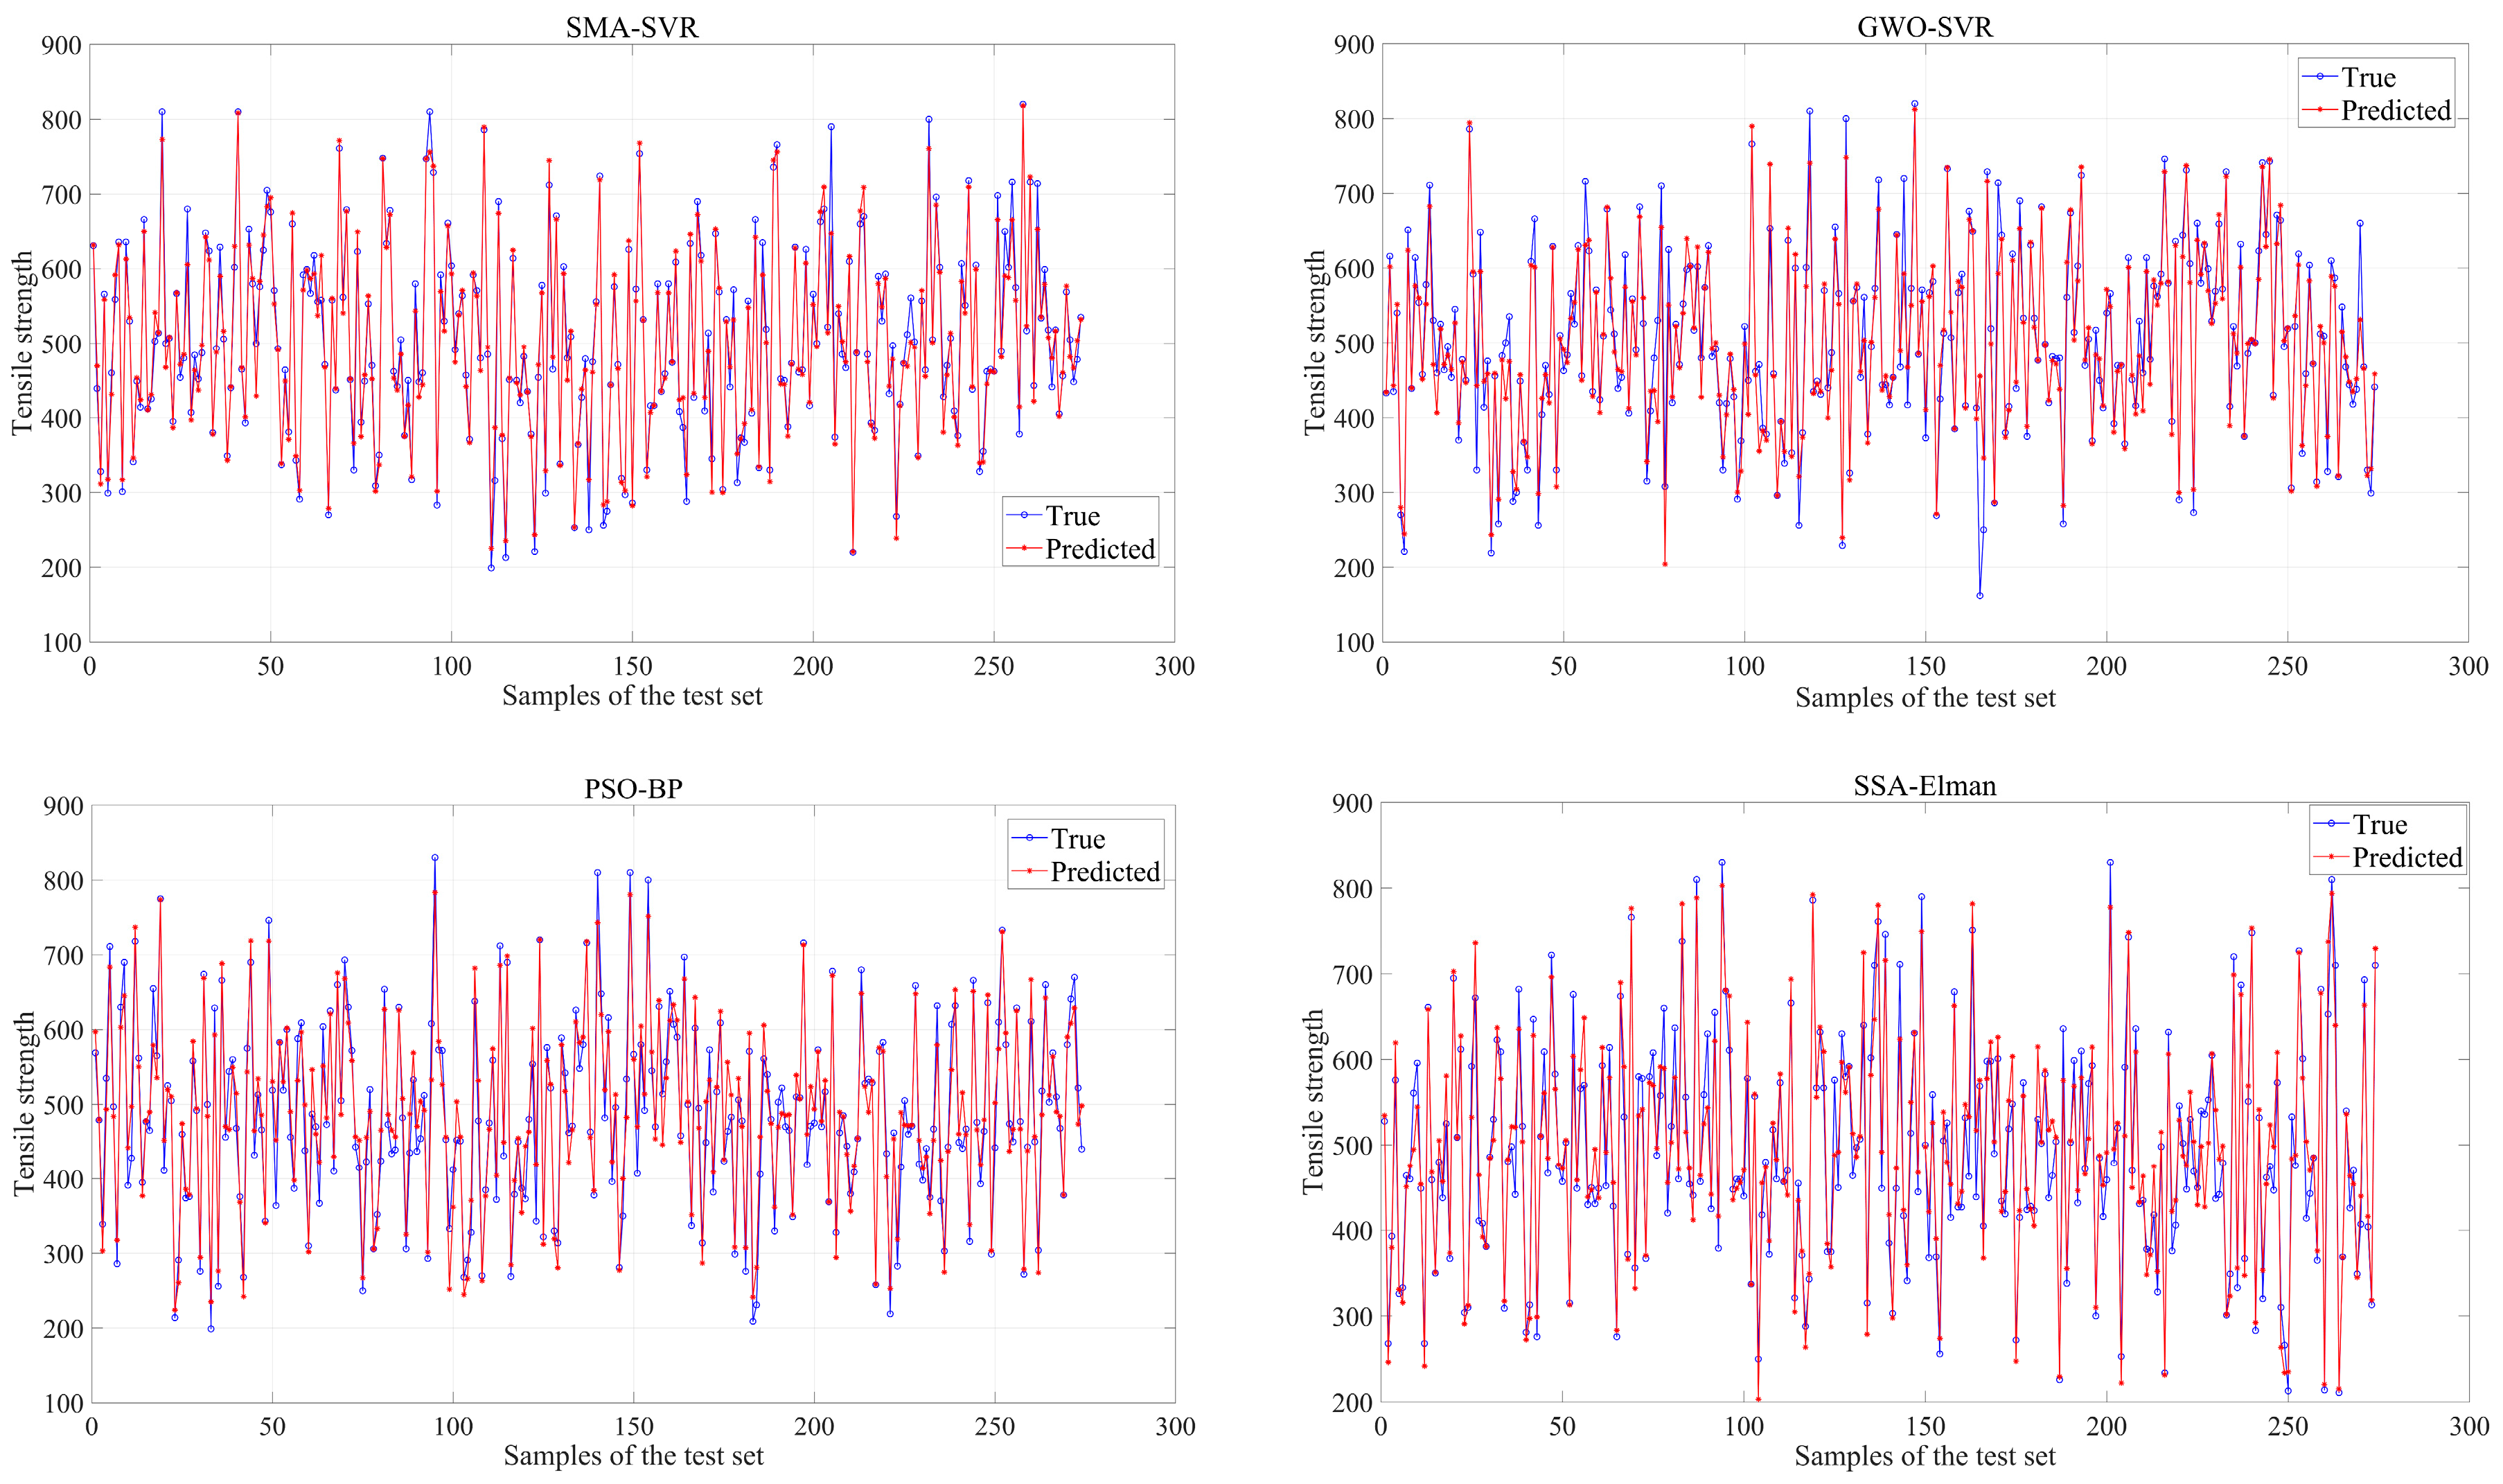
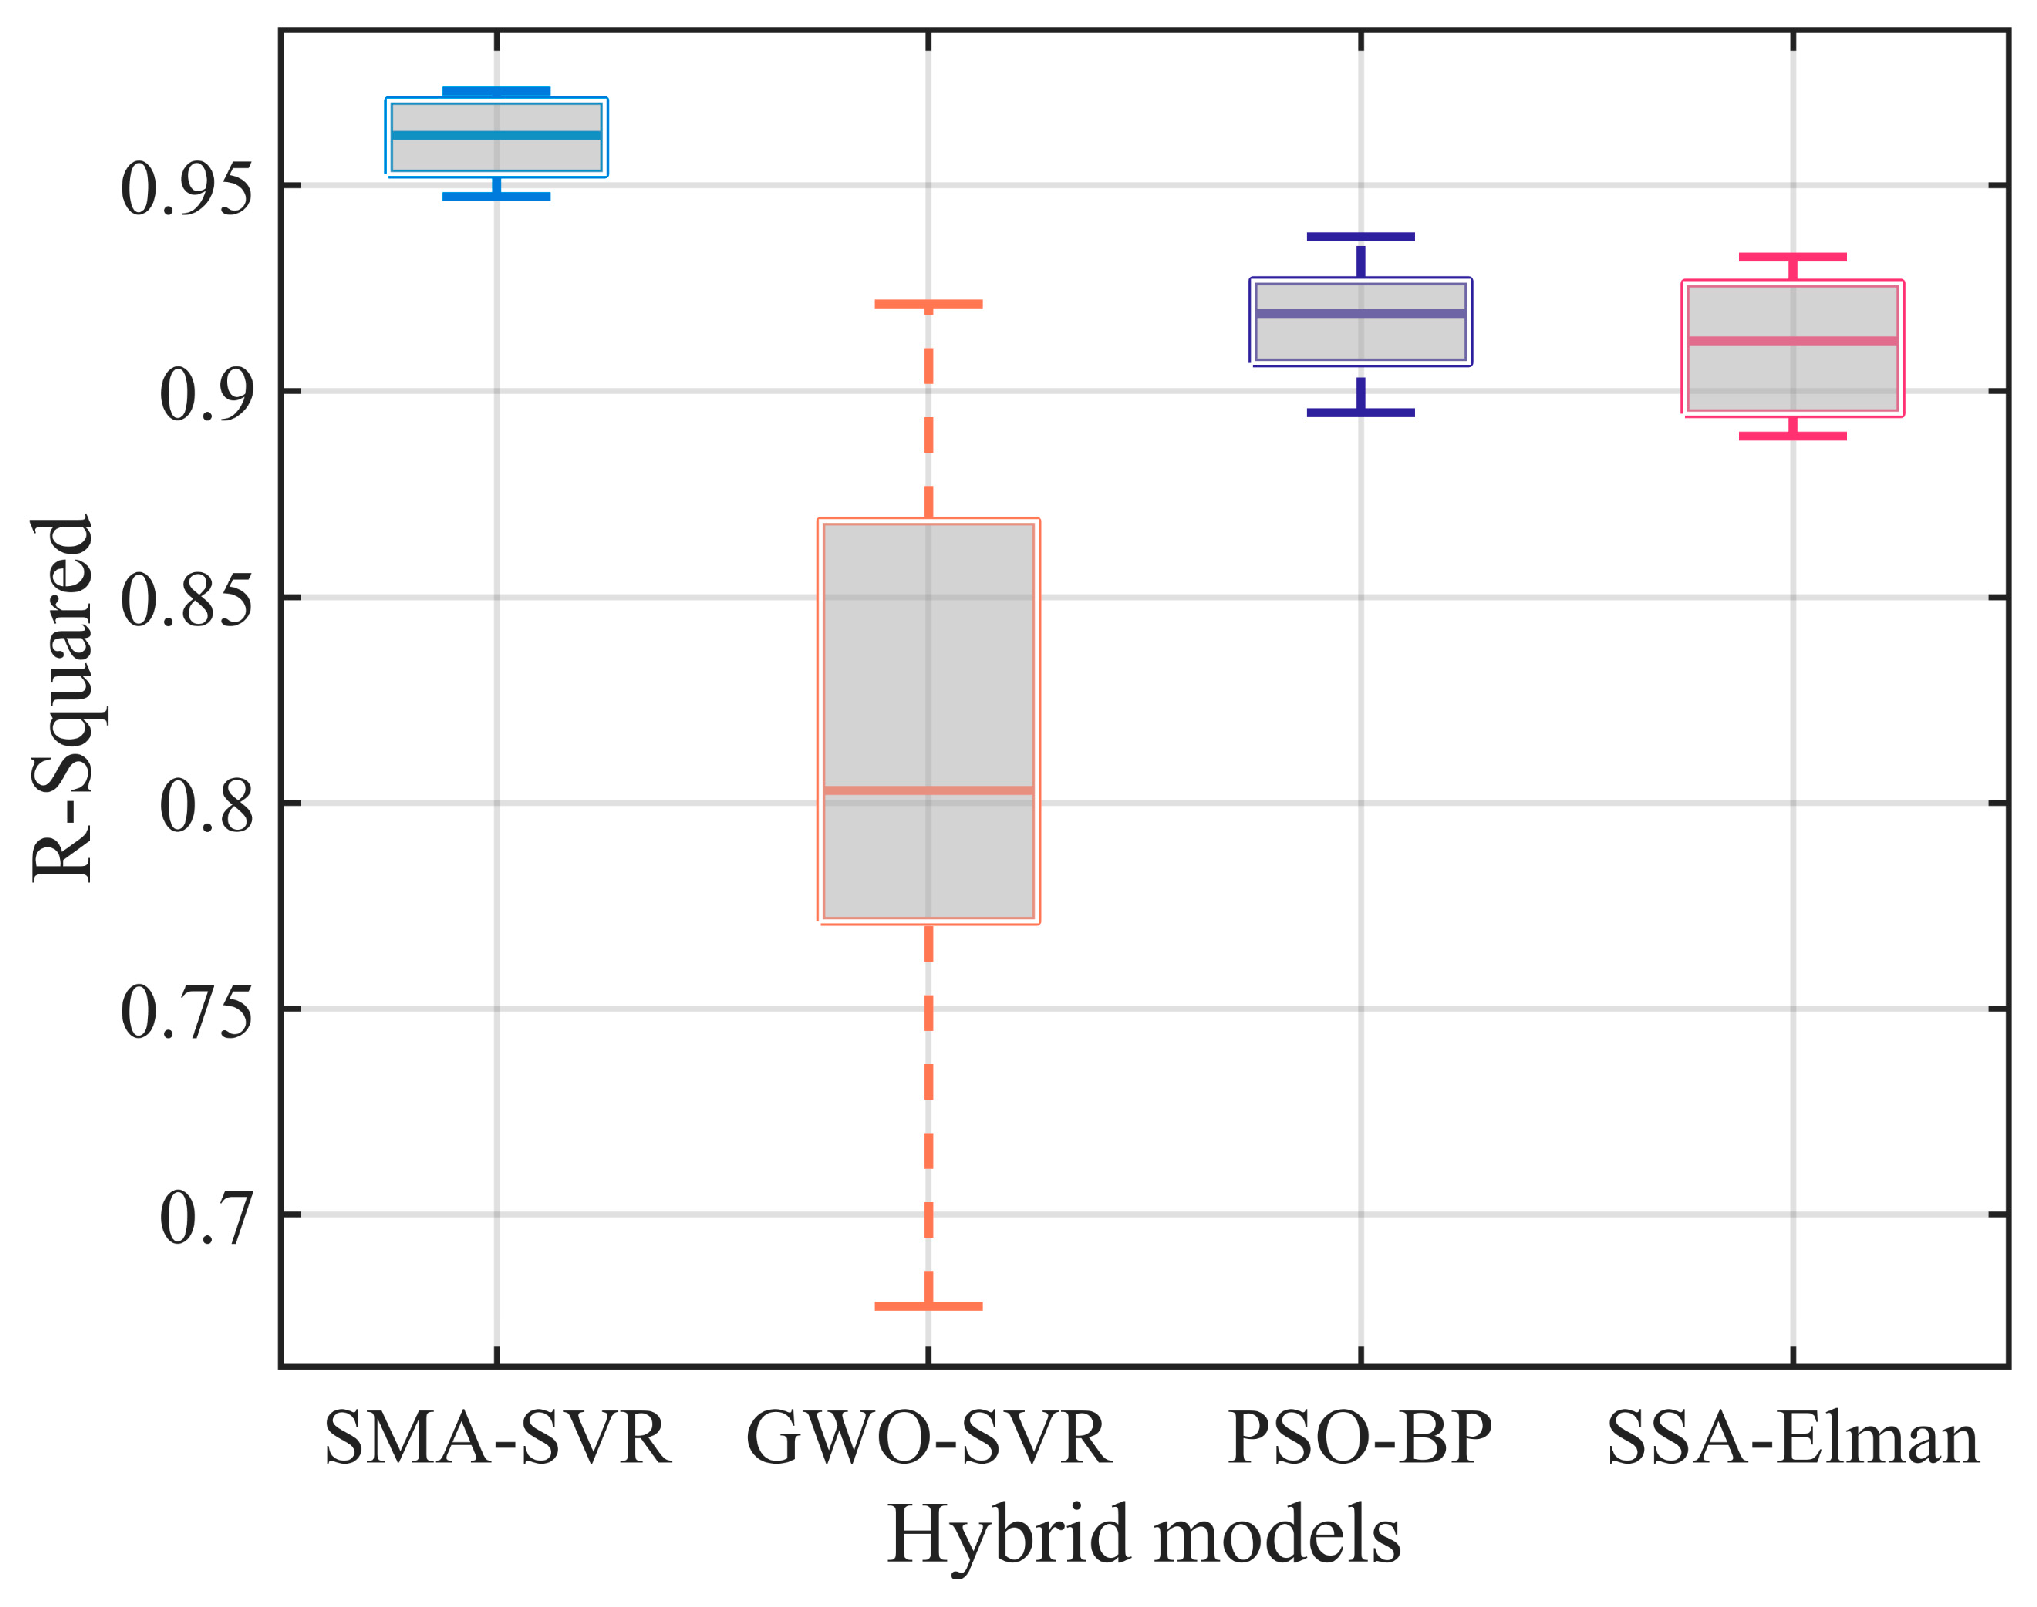
The analyses demonstrate that the predictive performance of SMA-SVR outperforms the other three hybrid models significantly. To further evaluate the models, the best prediction results from these tests are recorded. A comparison chart is designed to display the actual and predicted values of the test set for each model, as depicted in Figure 3. Moreover, a box plot of R2 values is constructed to facilitate visual comparison of their prediction accuracy, as illustrated in Figure 4.
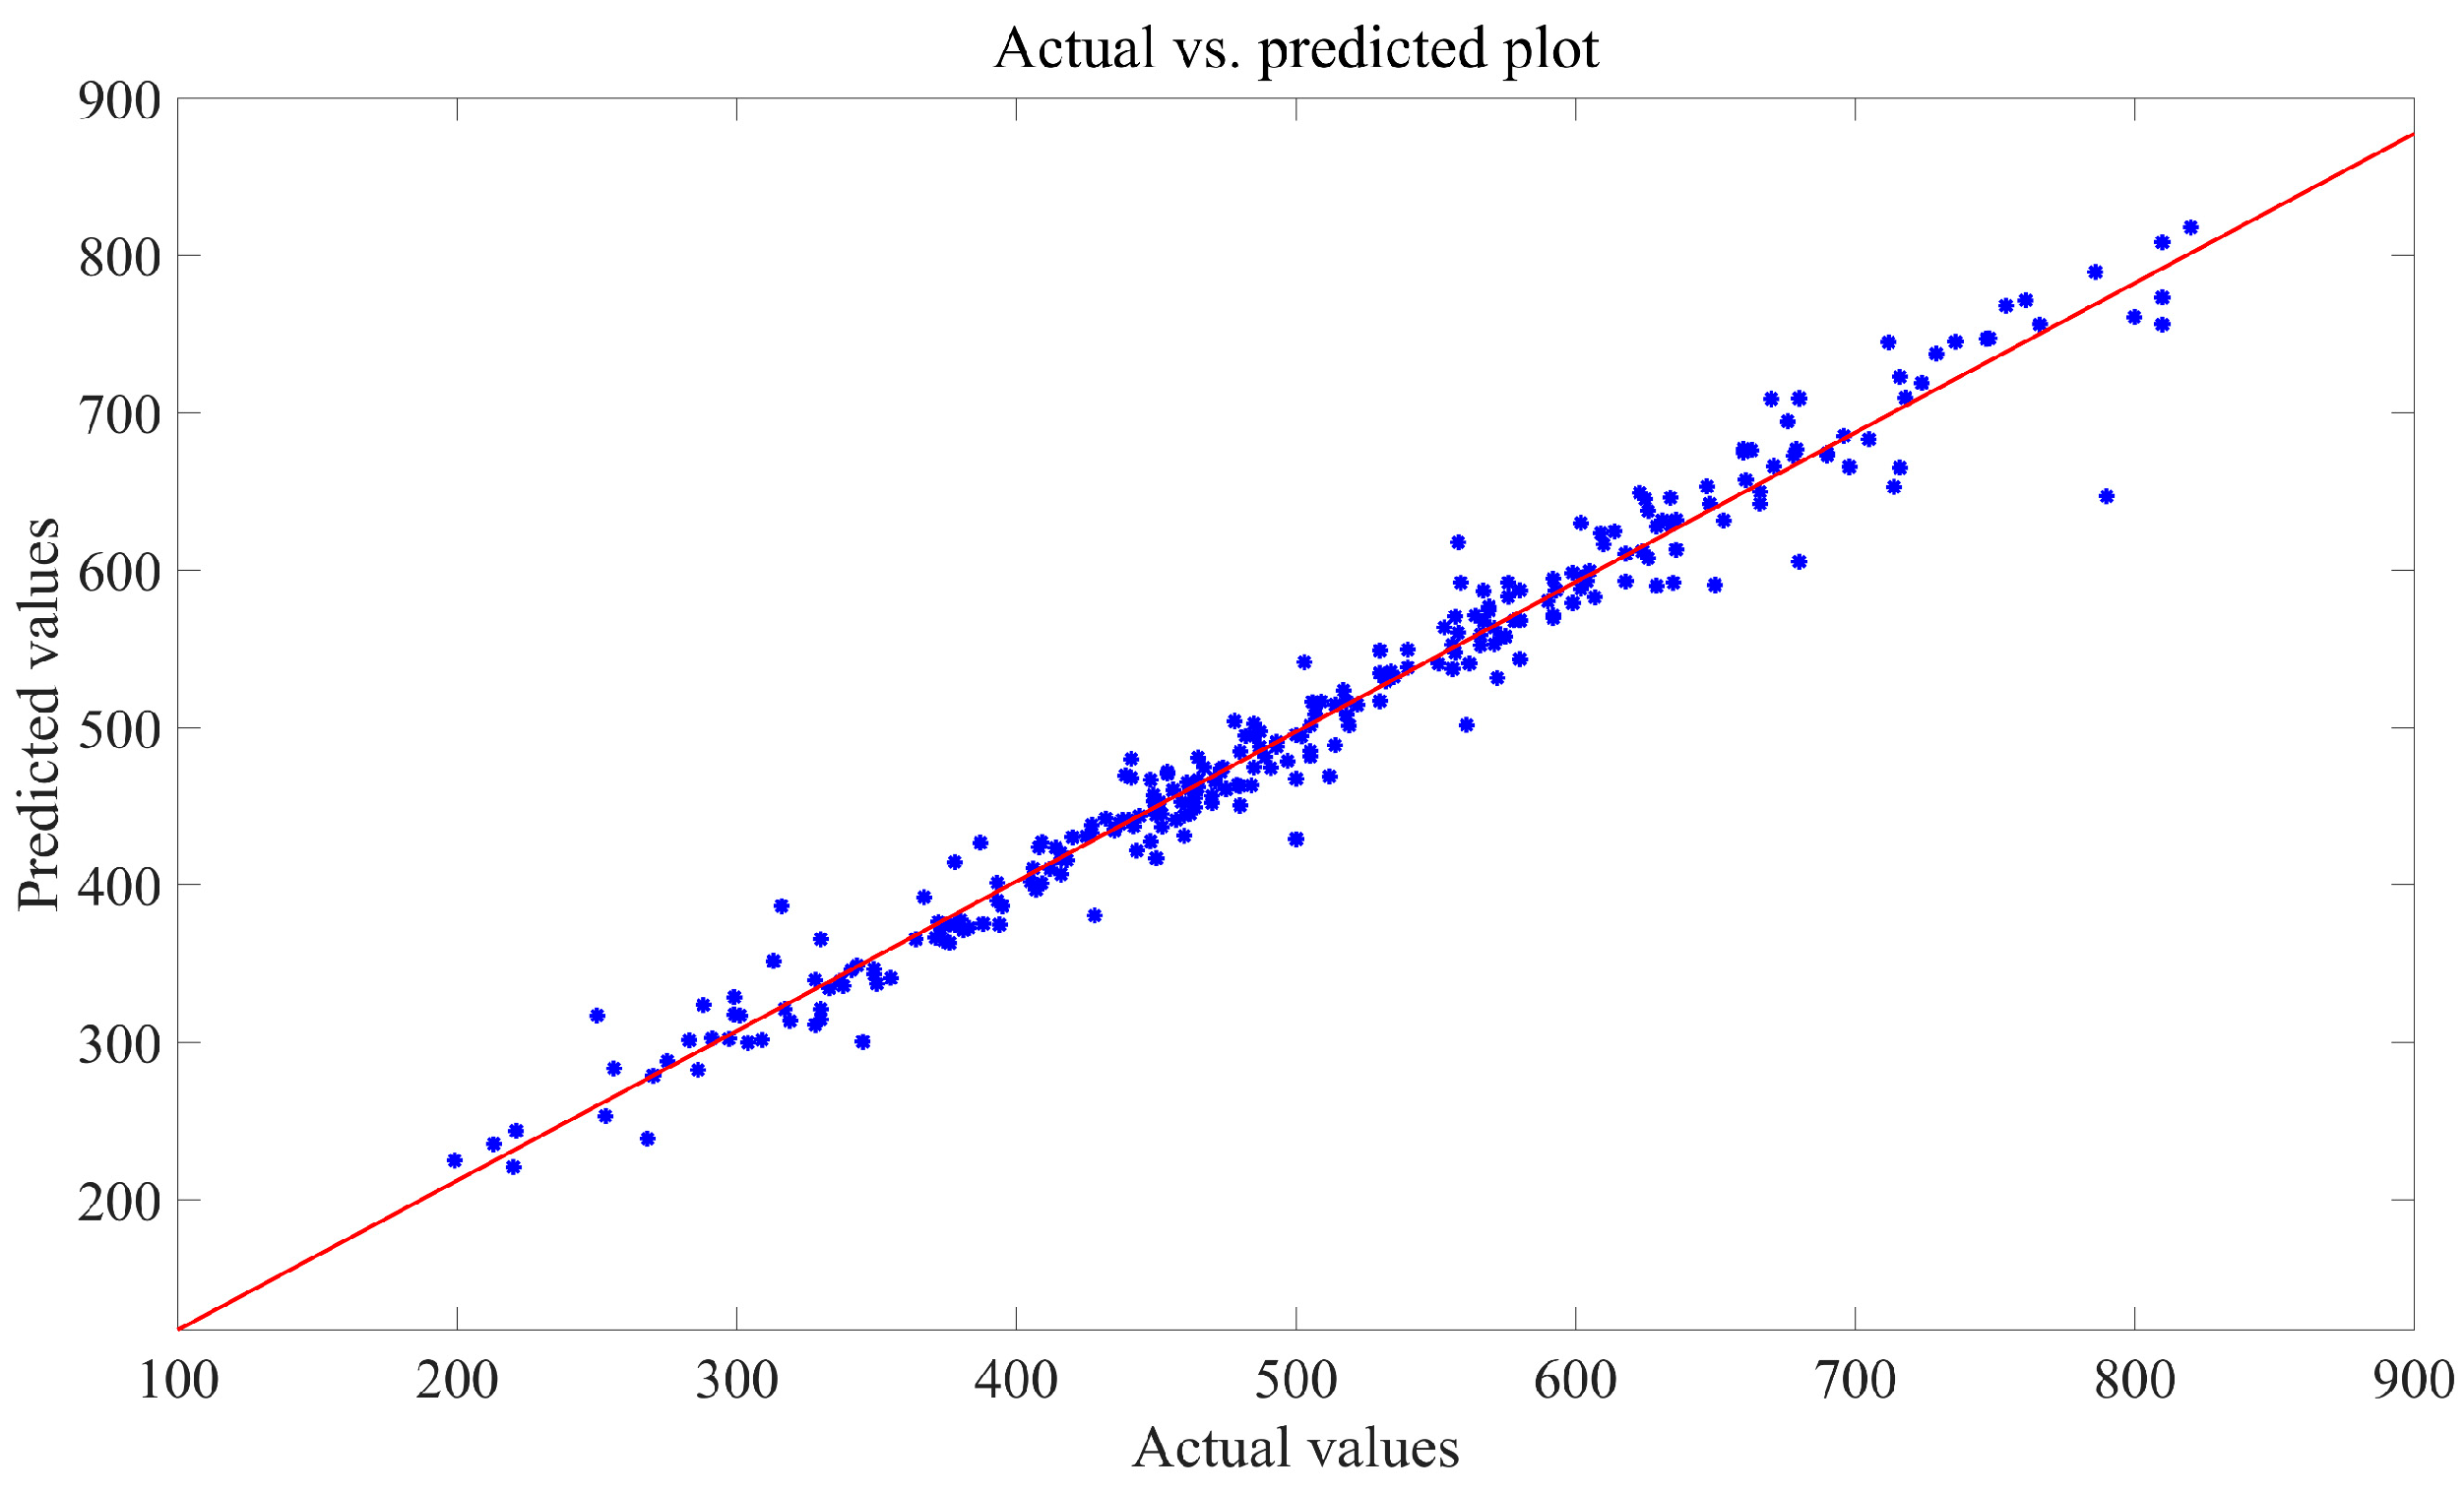
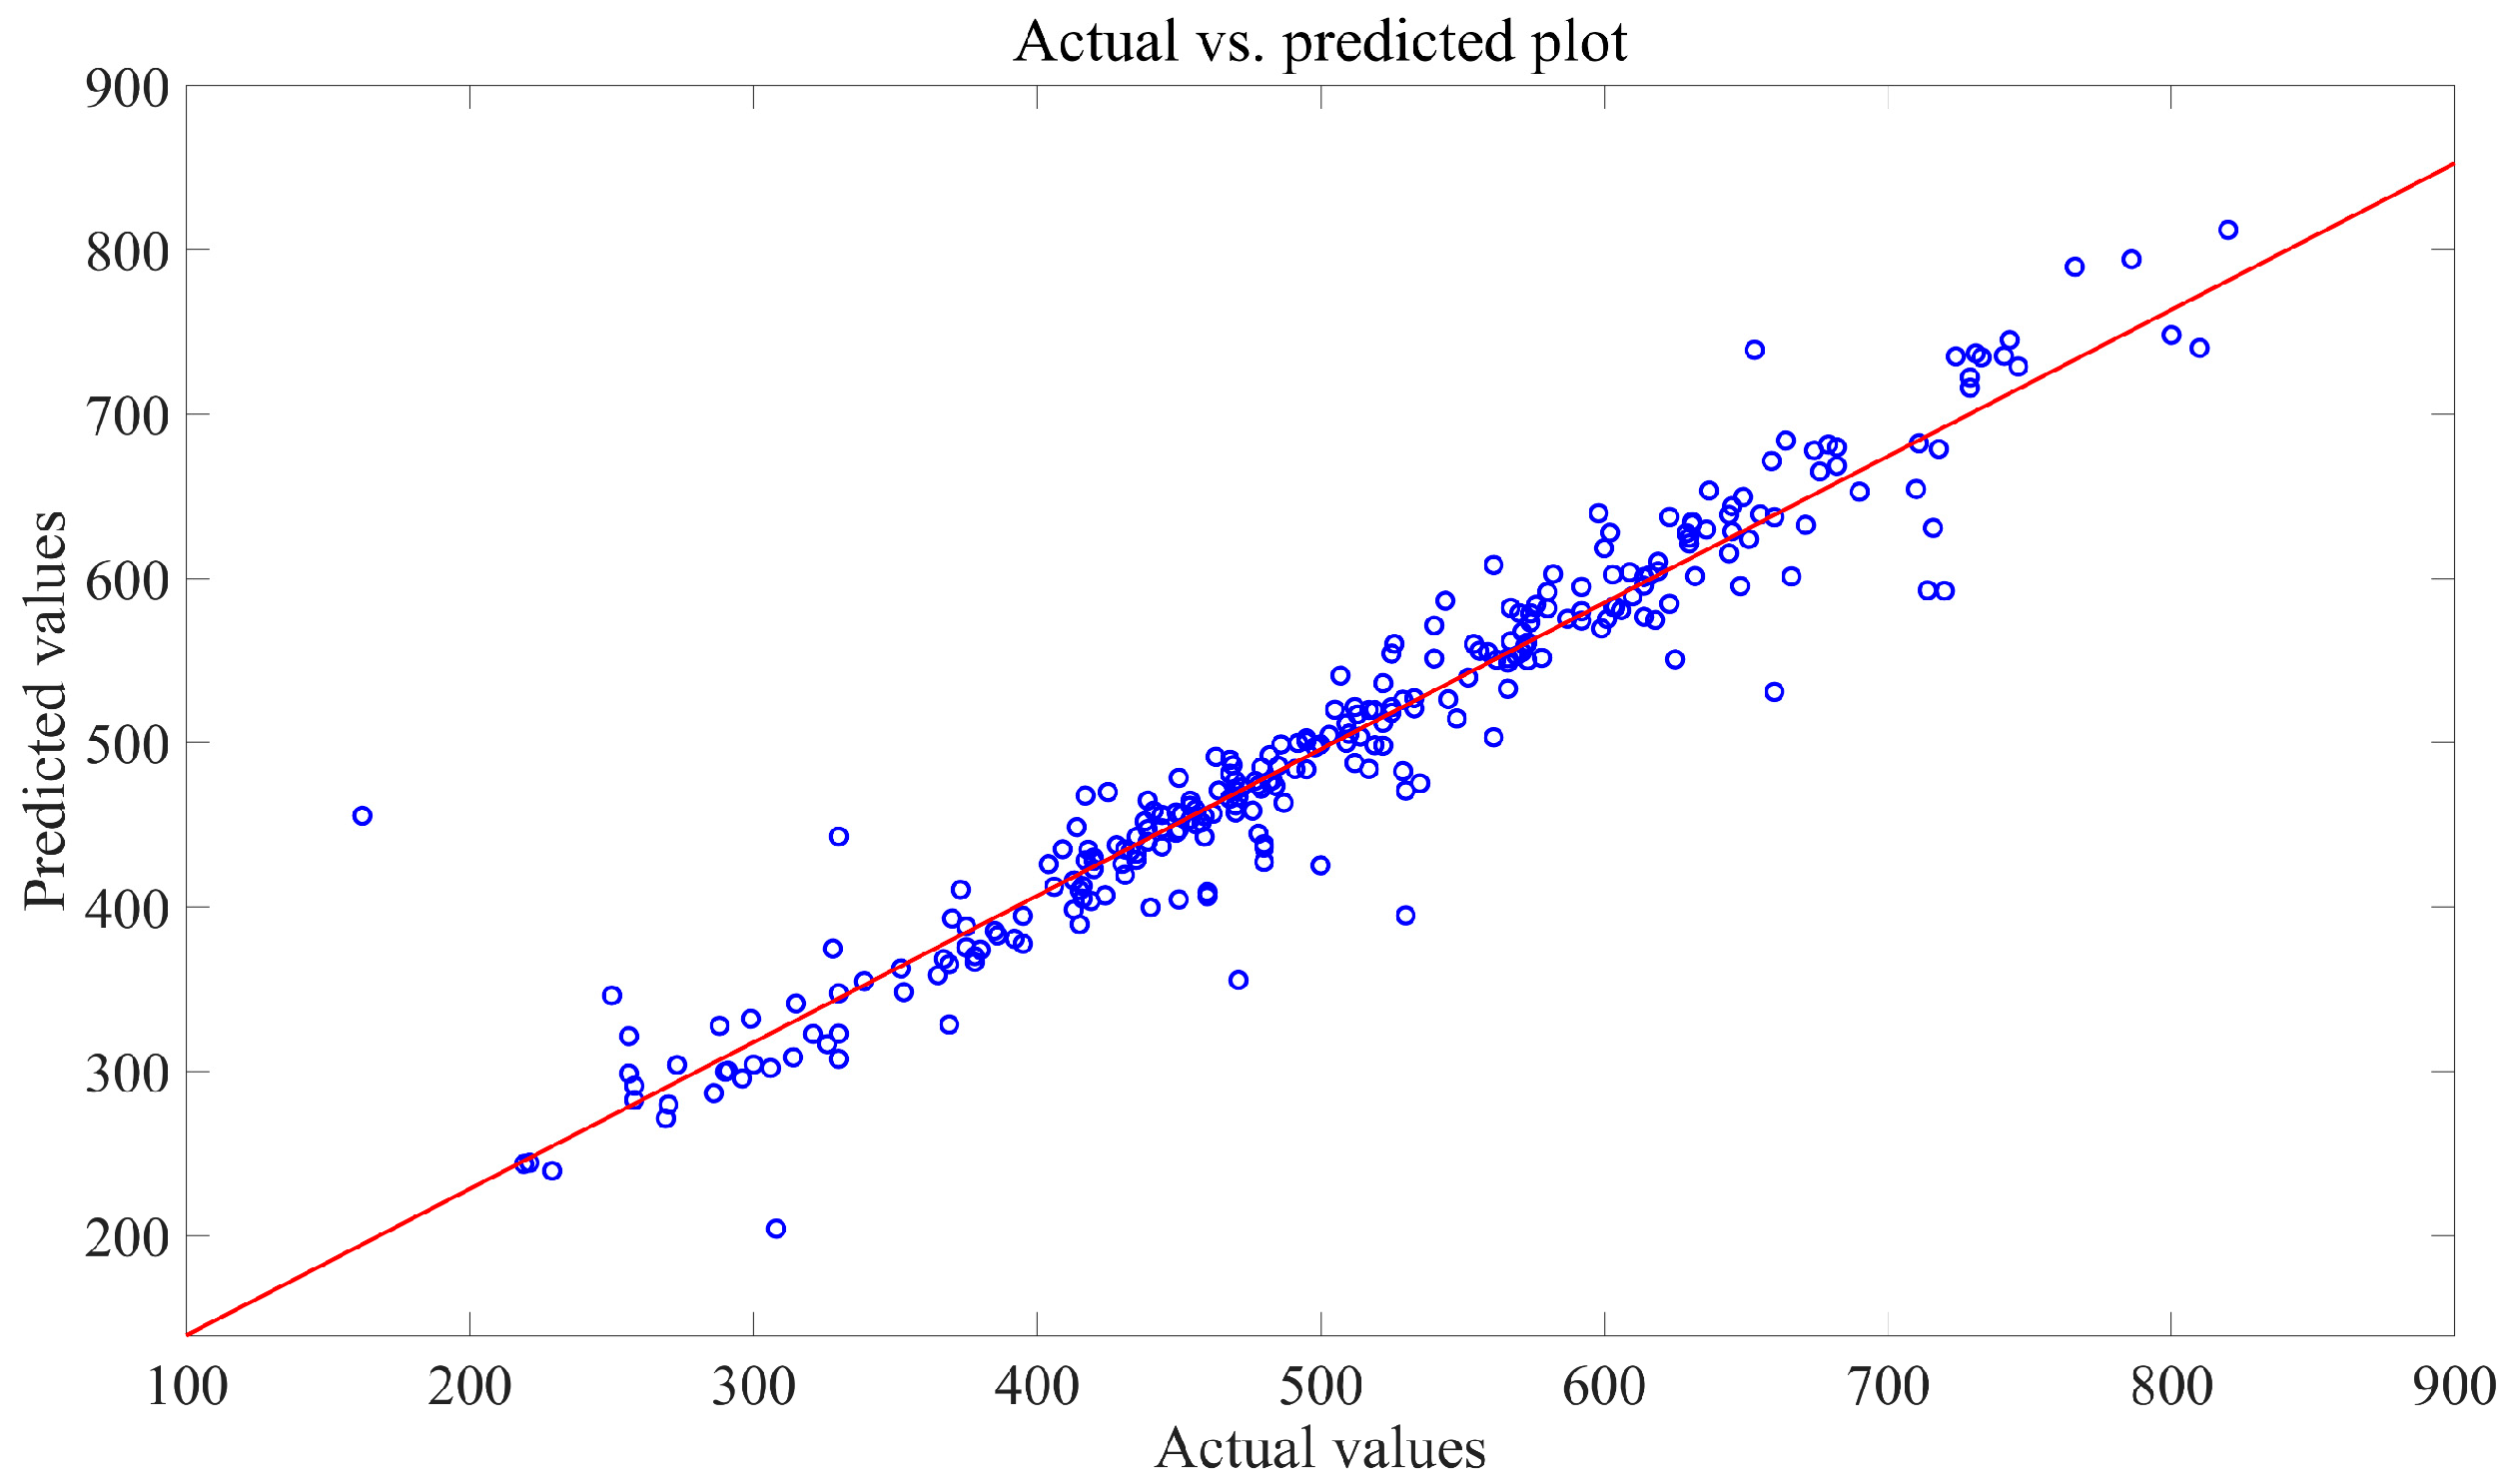
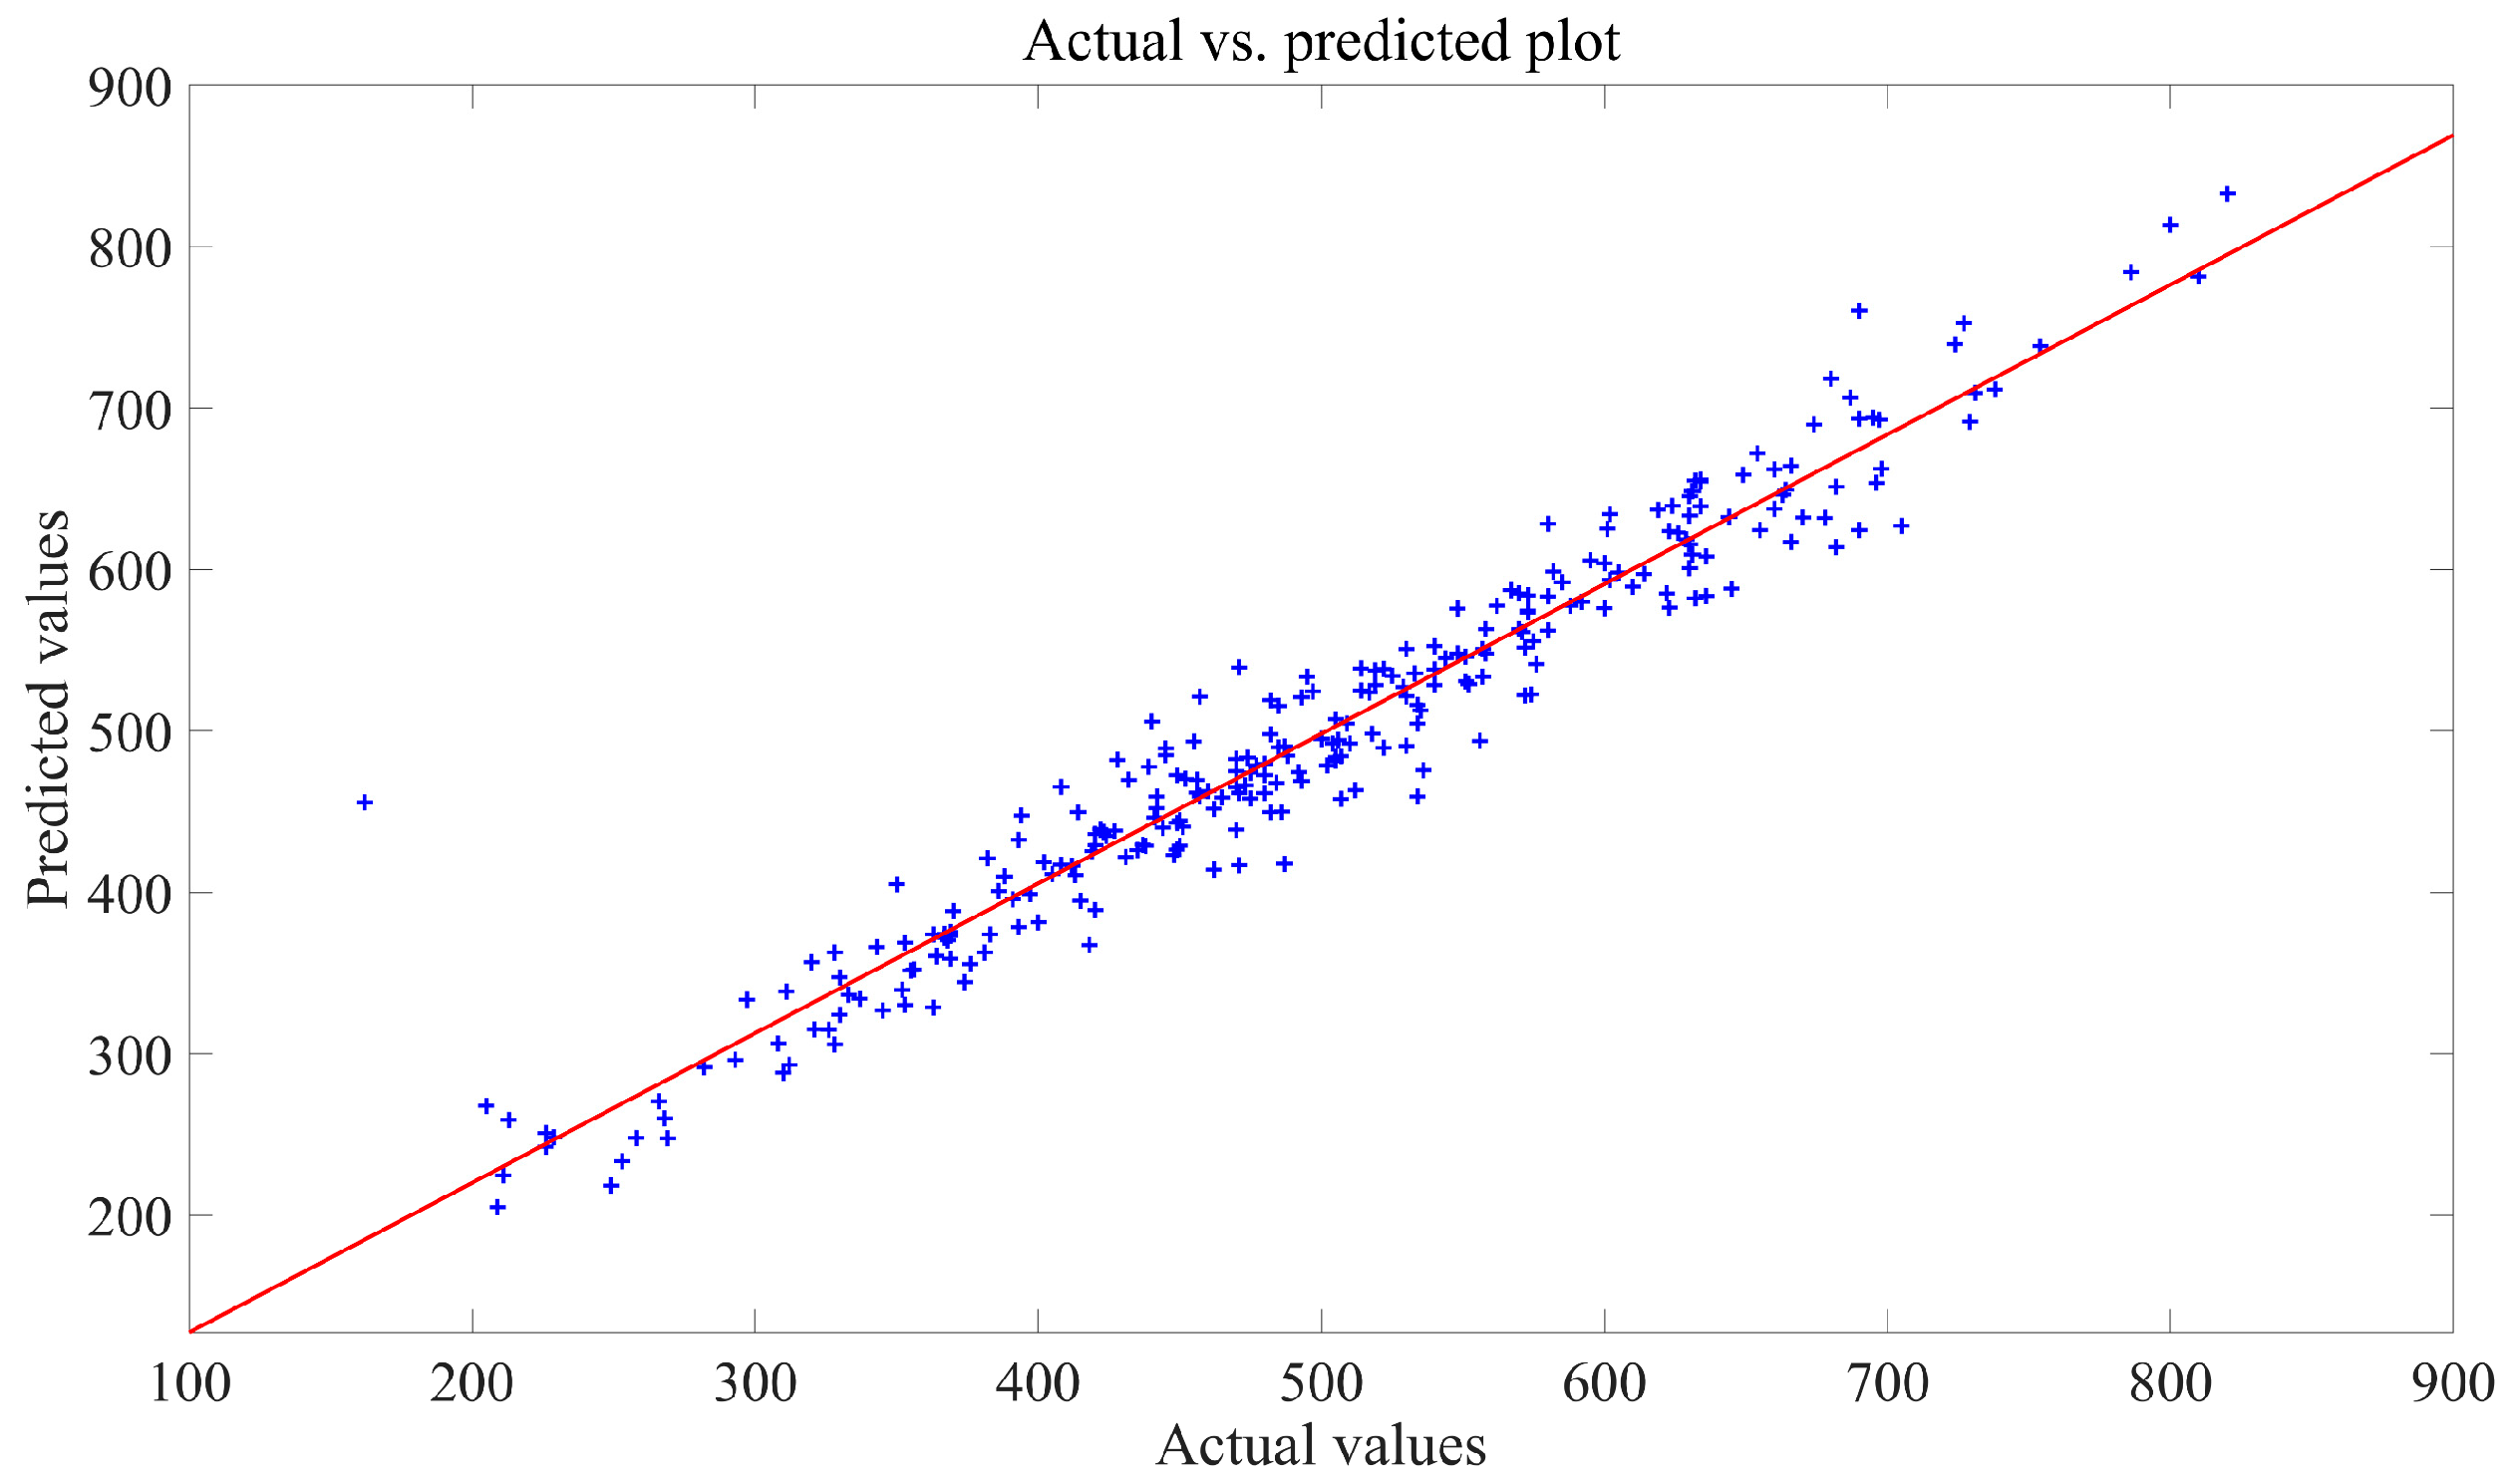
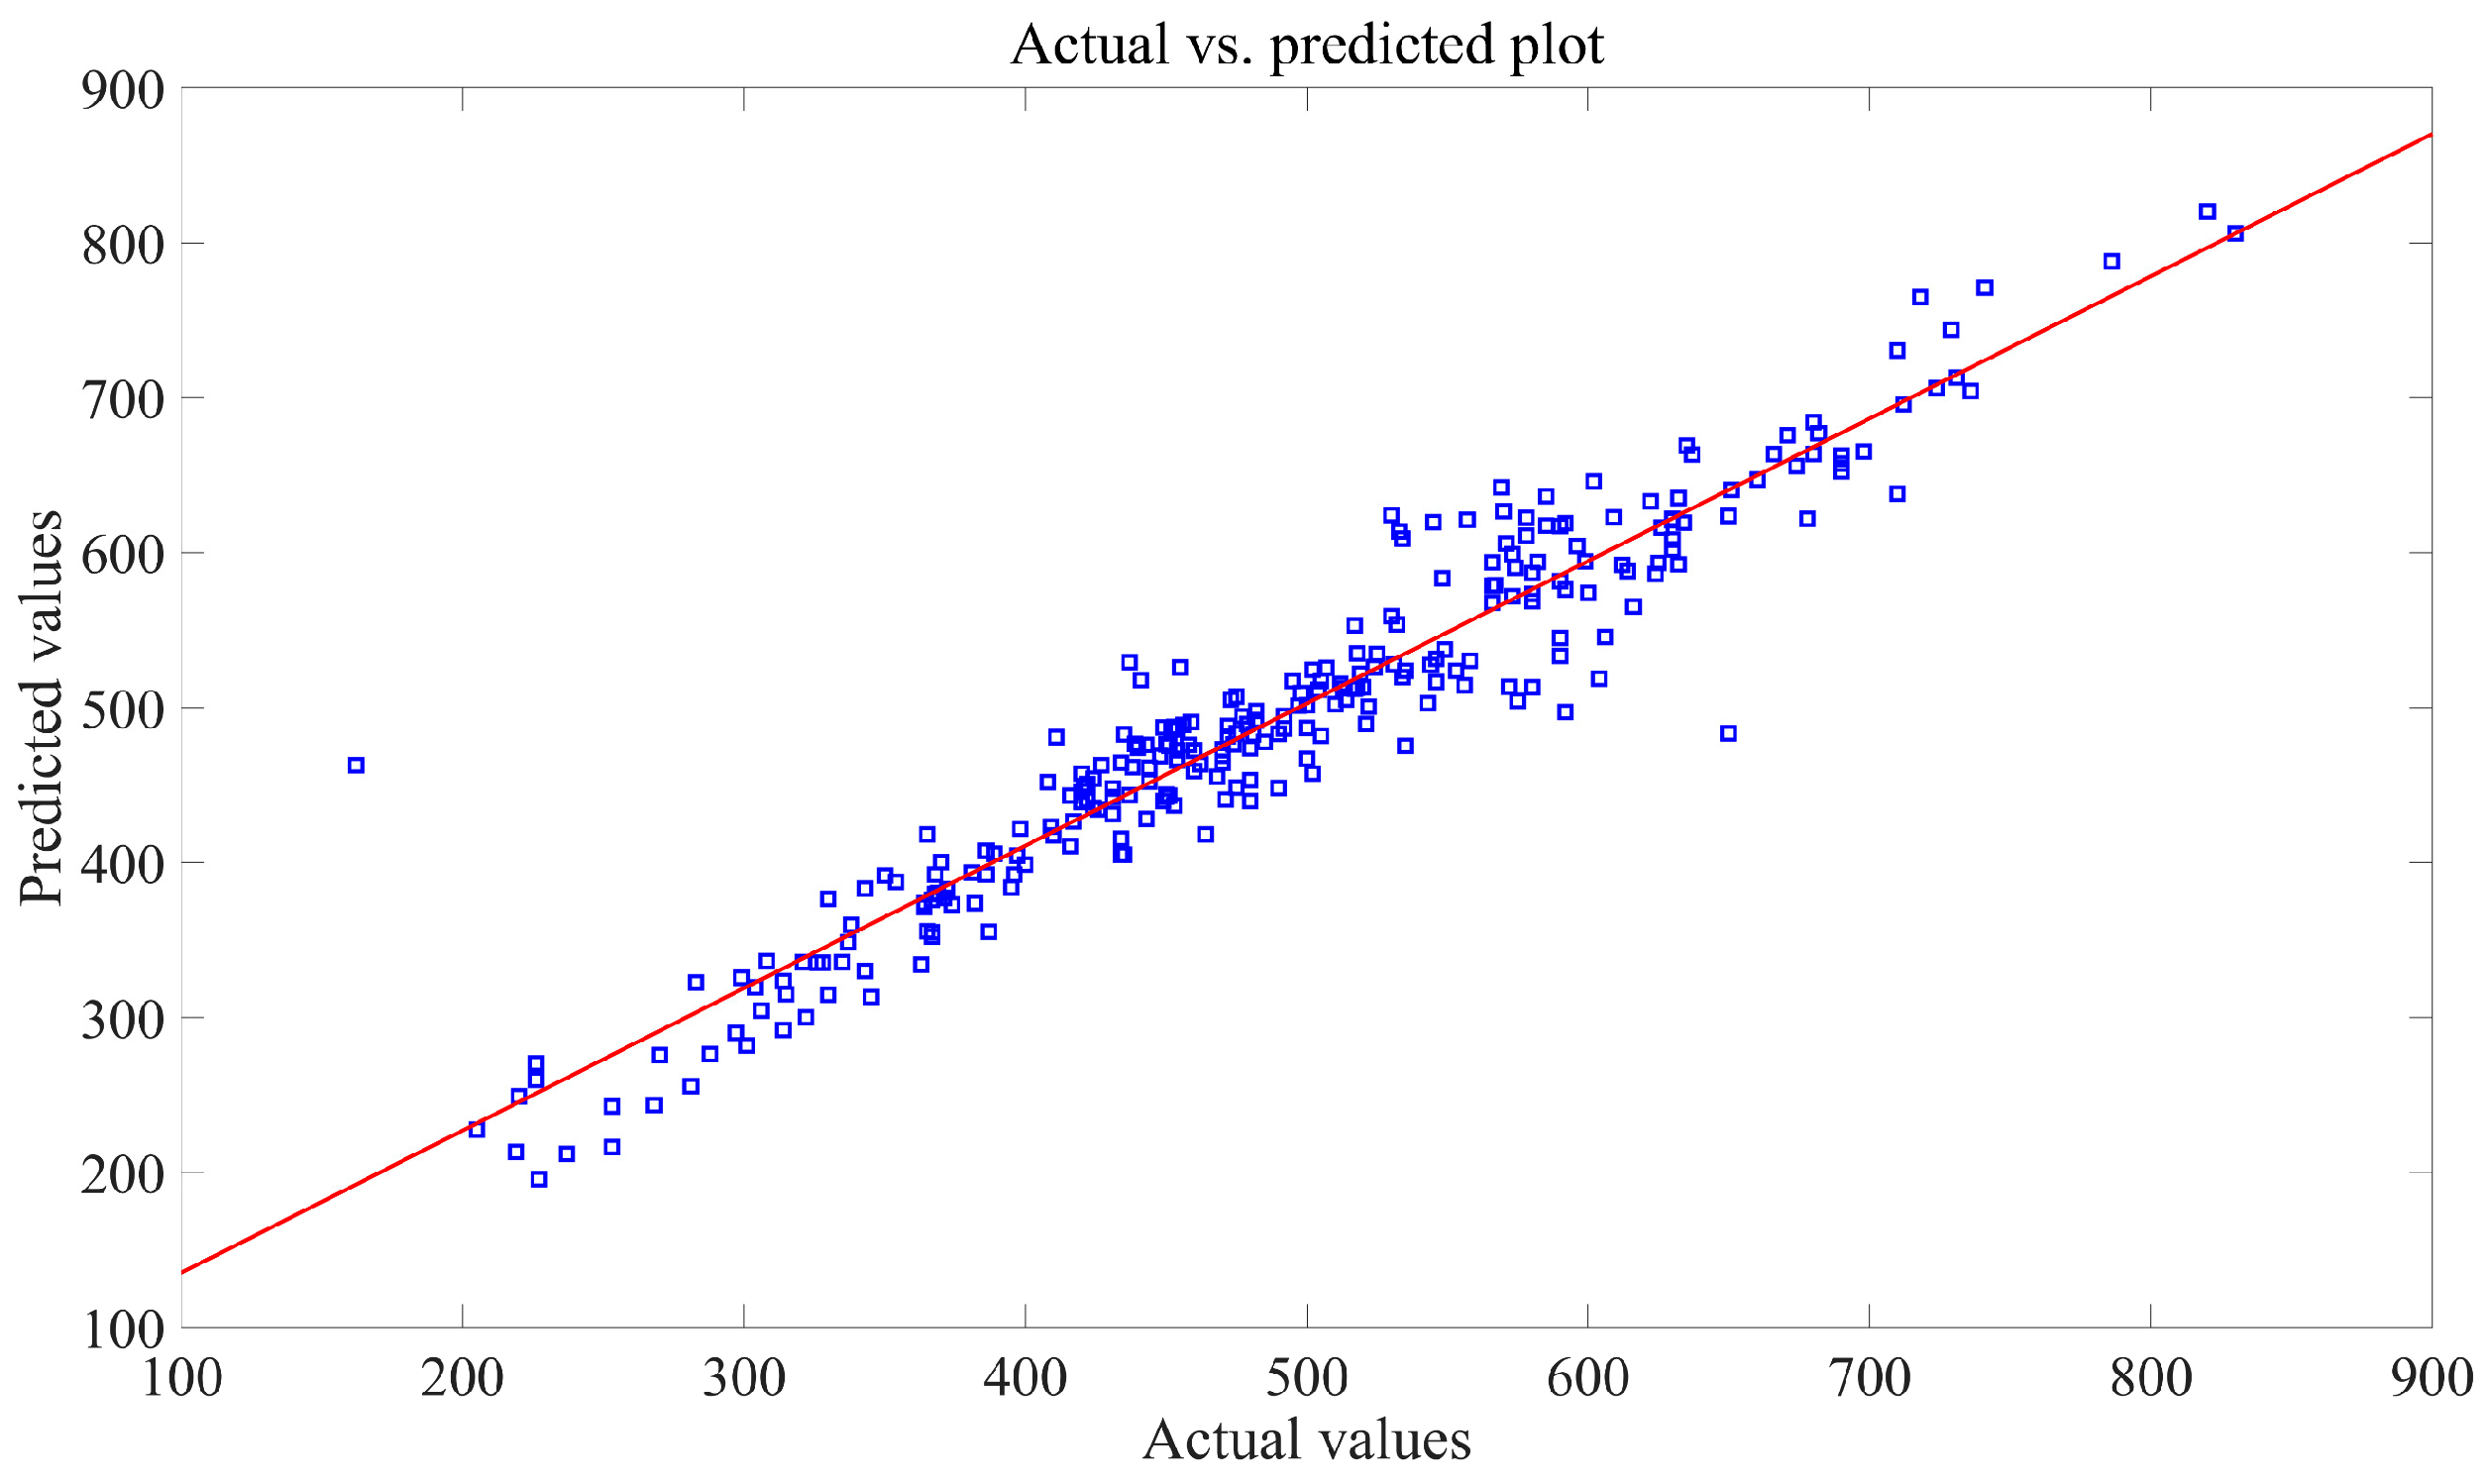
To assess the effectiveness of prediction models, regression plots were used. In these plots (refer to Figure 5, Figure 6, Figure 7 and Figure 8), the horizontal axis represents the true data values, while the vertical axis displays the predicted values. Each sample point on the plot is positioned based on both the actual and predicted values. When the predicted values match the actual values, all sample points align perfectly along a straight line that follows the diagonal of the plot. The Ordinary Least Squares Regression (OLS) method is applied to determine the least-square line for these sample points. The closer this line aligns with the diagonal, the higher the accuracy of the forecast.
The figures indicate that the majority of sample points in the regression plot for the SMA-SVR model are clustered closely around the least-square line, suggesting a high level of prediction accuracy and robustness across various test sets. On the contrary, sample points from the other three models exhibit notable deviations from their respective least-square lines, suggesting a higher likelihood of significant prediction errors in multiple predictions made using GWO-SVR, PSO-BP, and SSA-Elman.
The results of the multiple comparison tests are tabulated in Table 4, with the best hybrid model labeled as “1”, followed by the second-best as “2”, and so forth. It is noteworthy that, among all the models under comparison, SMA-SVR emerges as the top performer in predictive capabilities.

3.3. Tests and Discussion of 0.2% Proof Stress Prediction

In materials exhibiting non-linear behavior or inelasticity, such as low-alloy steel, determining the yield point often necessitates the use of the 0.2% offset method. Within the realm of engineering, the 0.2% proof stress serves as a crucial indicator for the yield stress of steel. Like other elastic materials, steel elongates and deforms when subjected to stress. Upon stress release, the material is expected to revert to its original dimensions. However, if the stress surpasses a critical value, the material endures permanent deformation, marking the onset of a plastic zone or the attainment of the yield point. Accordingly, the proof stress signifies the elastic limit of the material, which is a pivotal parameter in engineering design. Typically, this value is derived by drawing a line parallel to the stress–strain curve at the 0.2% strain value.
To assess the efficacy of hybrid models in predicting the 0.2% proof stress of low-alloy steel, this section focused on the elemental composition and operating temperatures as input variables. The target prediction variable remained at 0.2% proof stress. A random selection of 640 sample entries from the dataset constituted the training set, while the remaining 274 samples were allocated to the test set, maintaining a consistent training-to-test ratio of 7:3. The procedural aspects of training and testing for the four hybrid models mirrored those of the prior evaluation, with hardware specifications, population size, and iteration counts remaining consistent. The outcomes of the 0.2% proof stress prediction tests are detailed in 
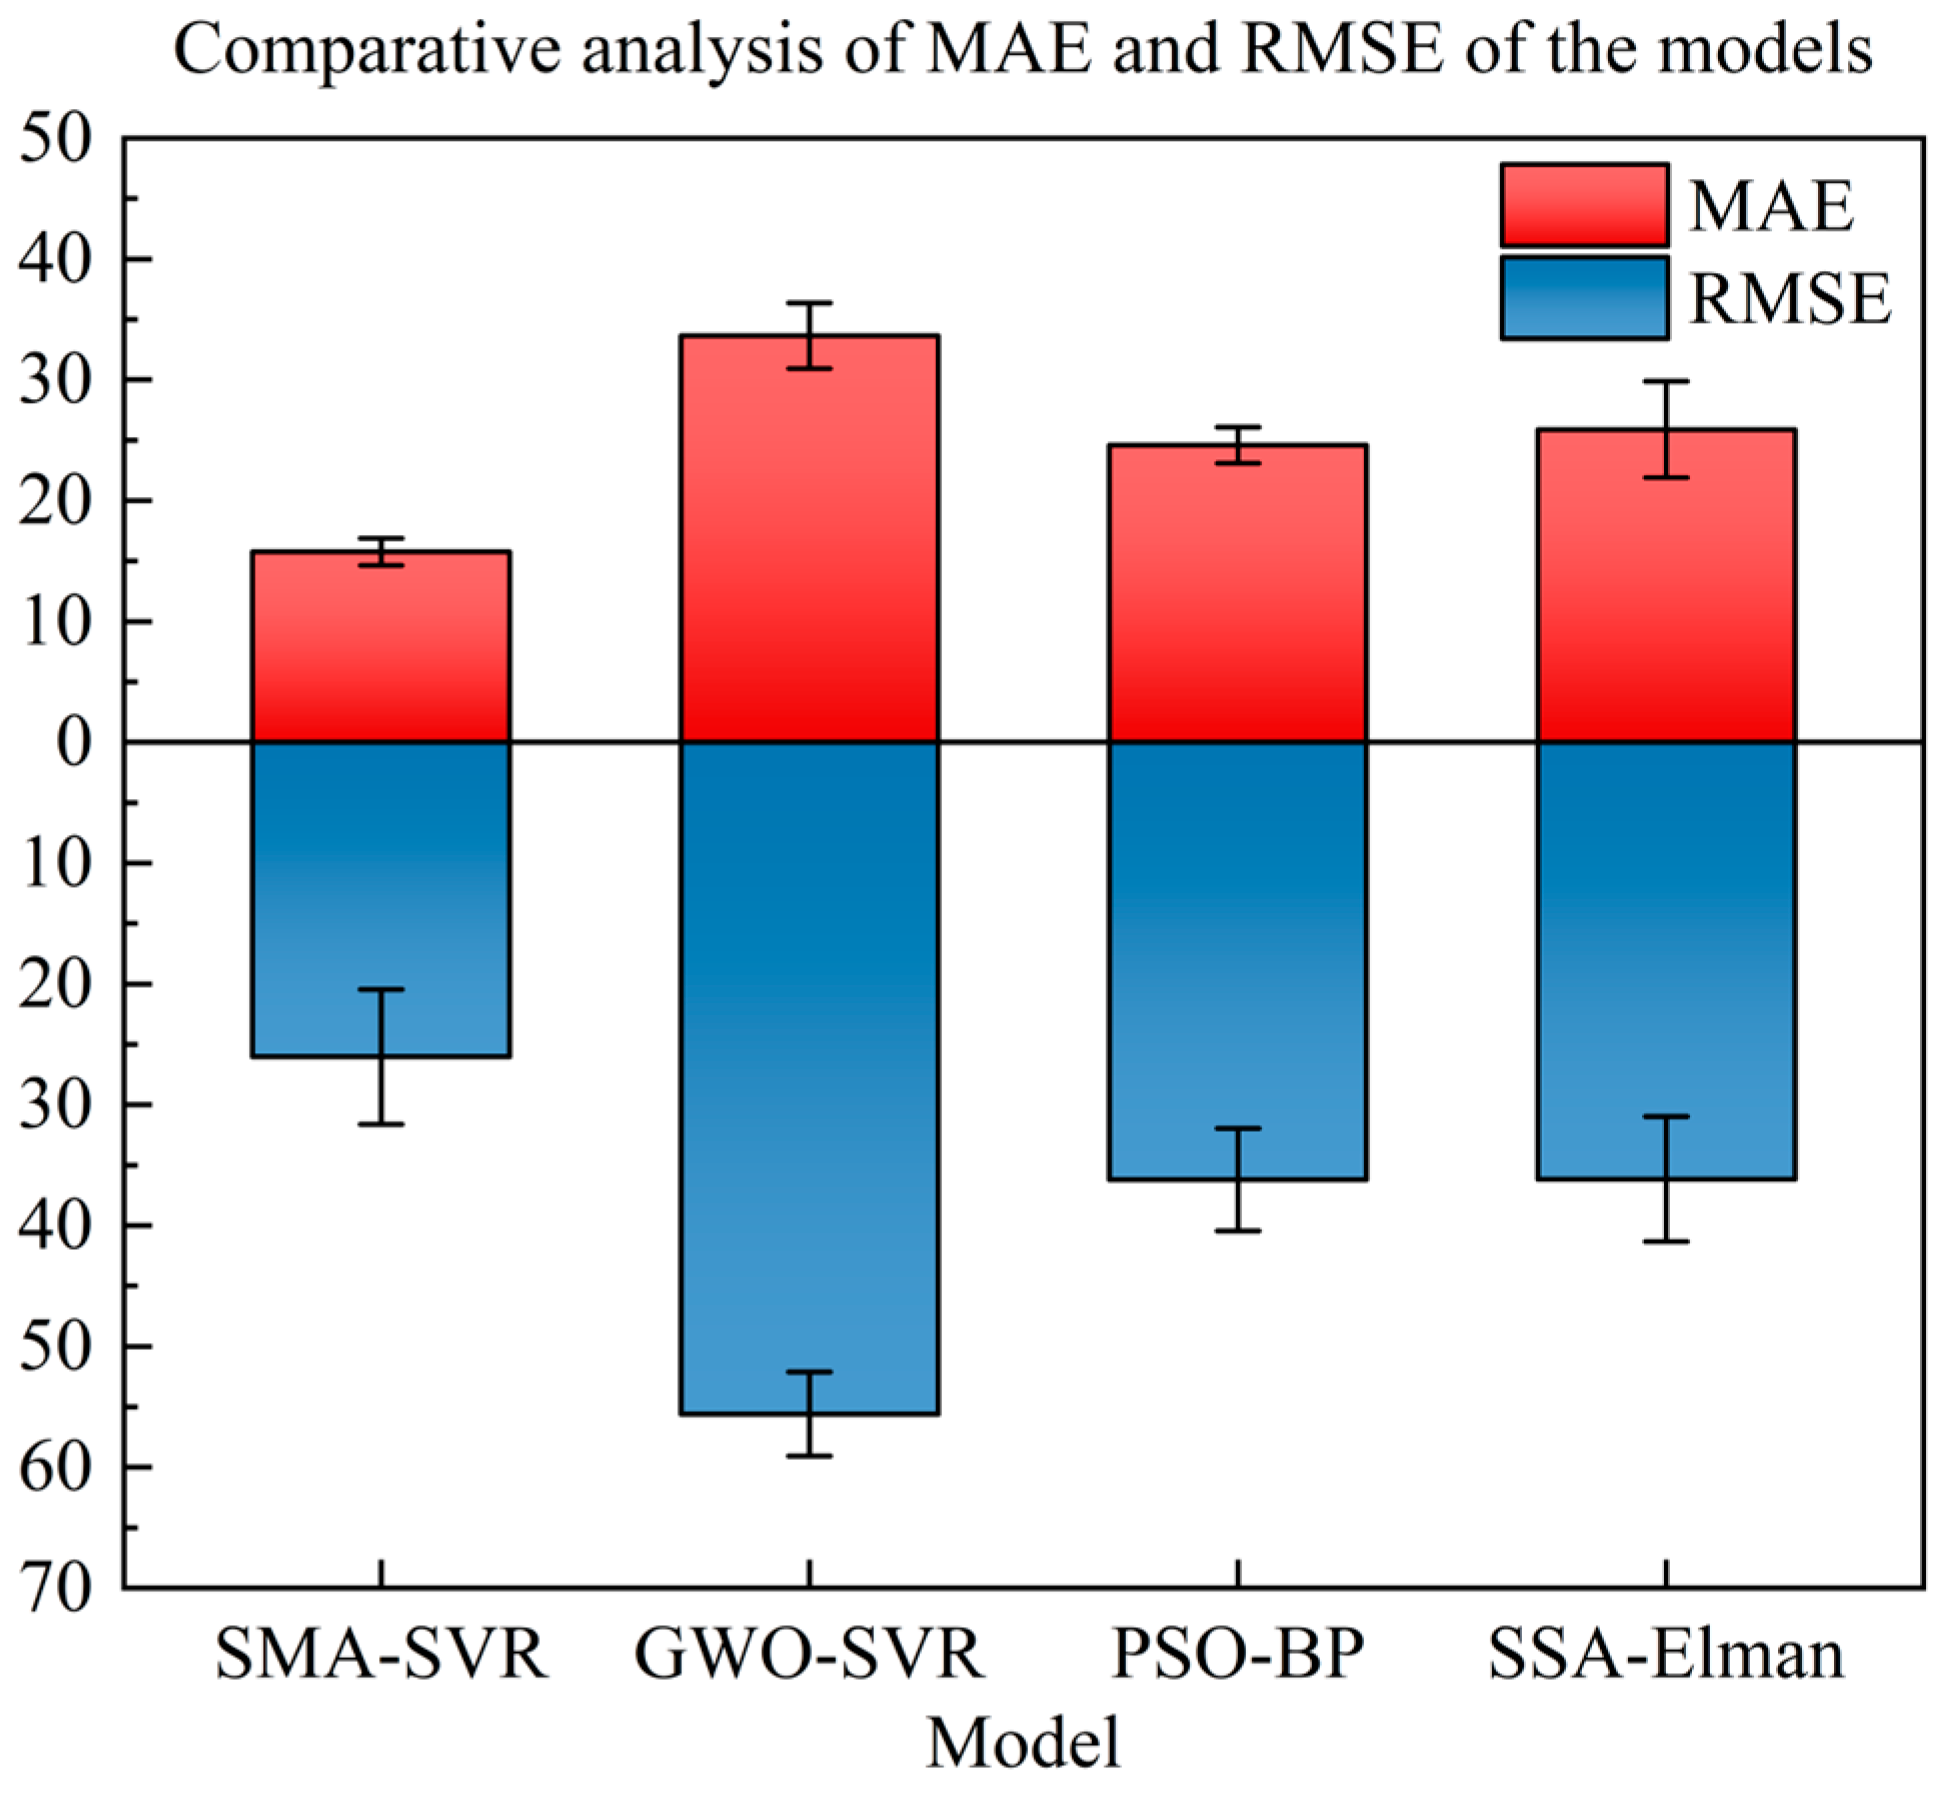
Table 5 for reference. A bar chart with the MAE and RMSE data of the experimental results is further plotted for a visual comparison of the prediction performance of these models, as shown in Figure 9.
The analysis of predicting 0.2% proof stress by the models indicates that SMA-SVR achieves the highest prediction accuracy among them, with an R2 ranking of SMA-SVR > PSO-BP > SSA-Elman > GWO-SVR. Furthermore, SMA-SVR demonstrates the lowest values for MAE and RMSE. In addition, SMA-SVR has the shortest computational time for both training and testing, representing only 32.50% of GWO-SVR and 18.99% of SSA-Elman.
An analysis of the prediction errors of each model was also conducted separately. Initially, a normality test was performed using the Shapiro–Wilk test method, considering the small sample sizes in each group. The results of the normality test can be found in Table 6.
The normality test conducted on the prediction errors indicates that the models do not follow a normal distribution at a significance level of 1% (all 
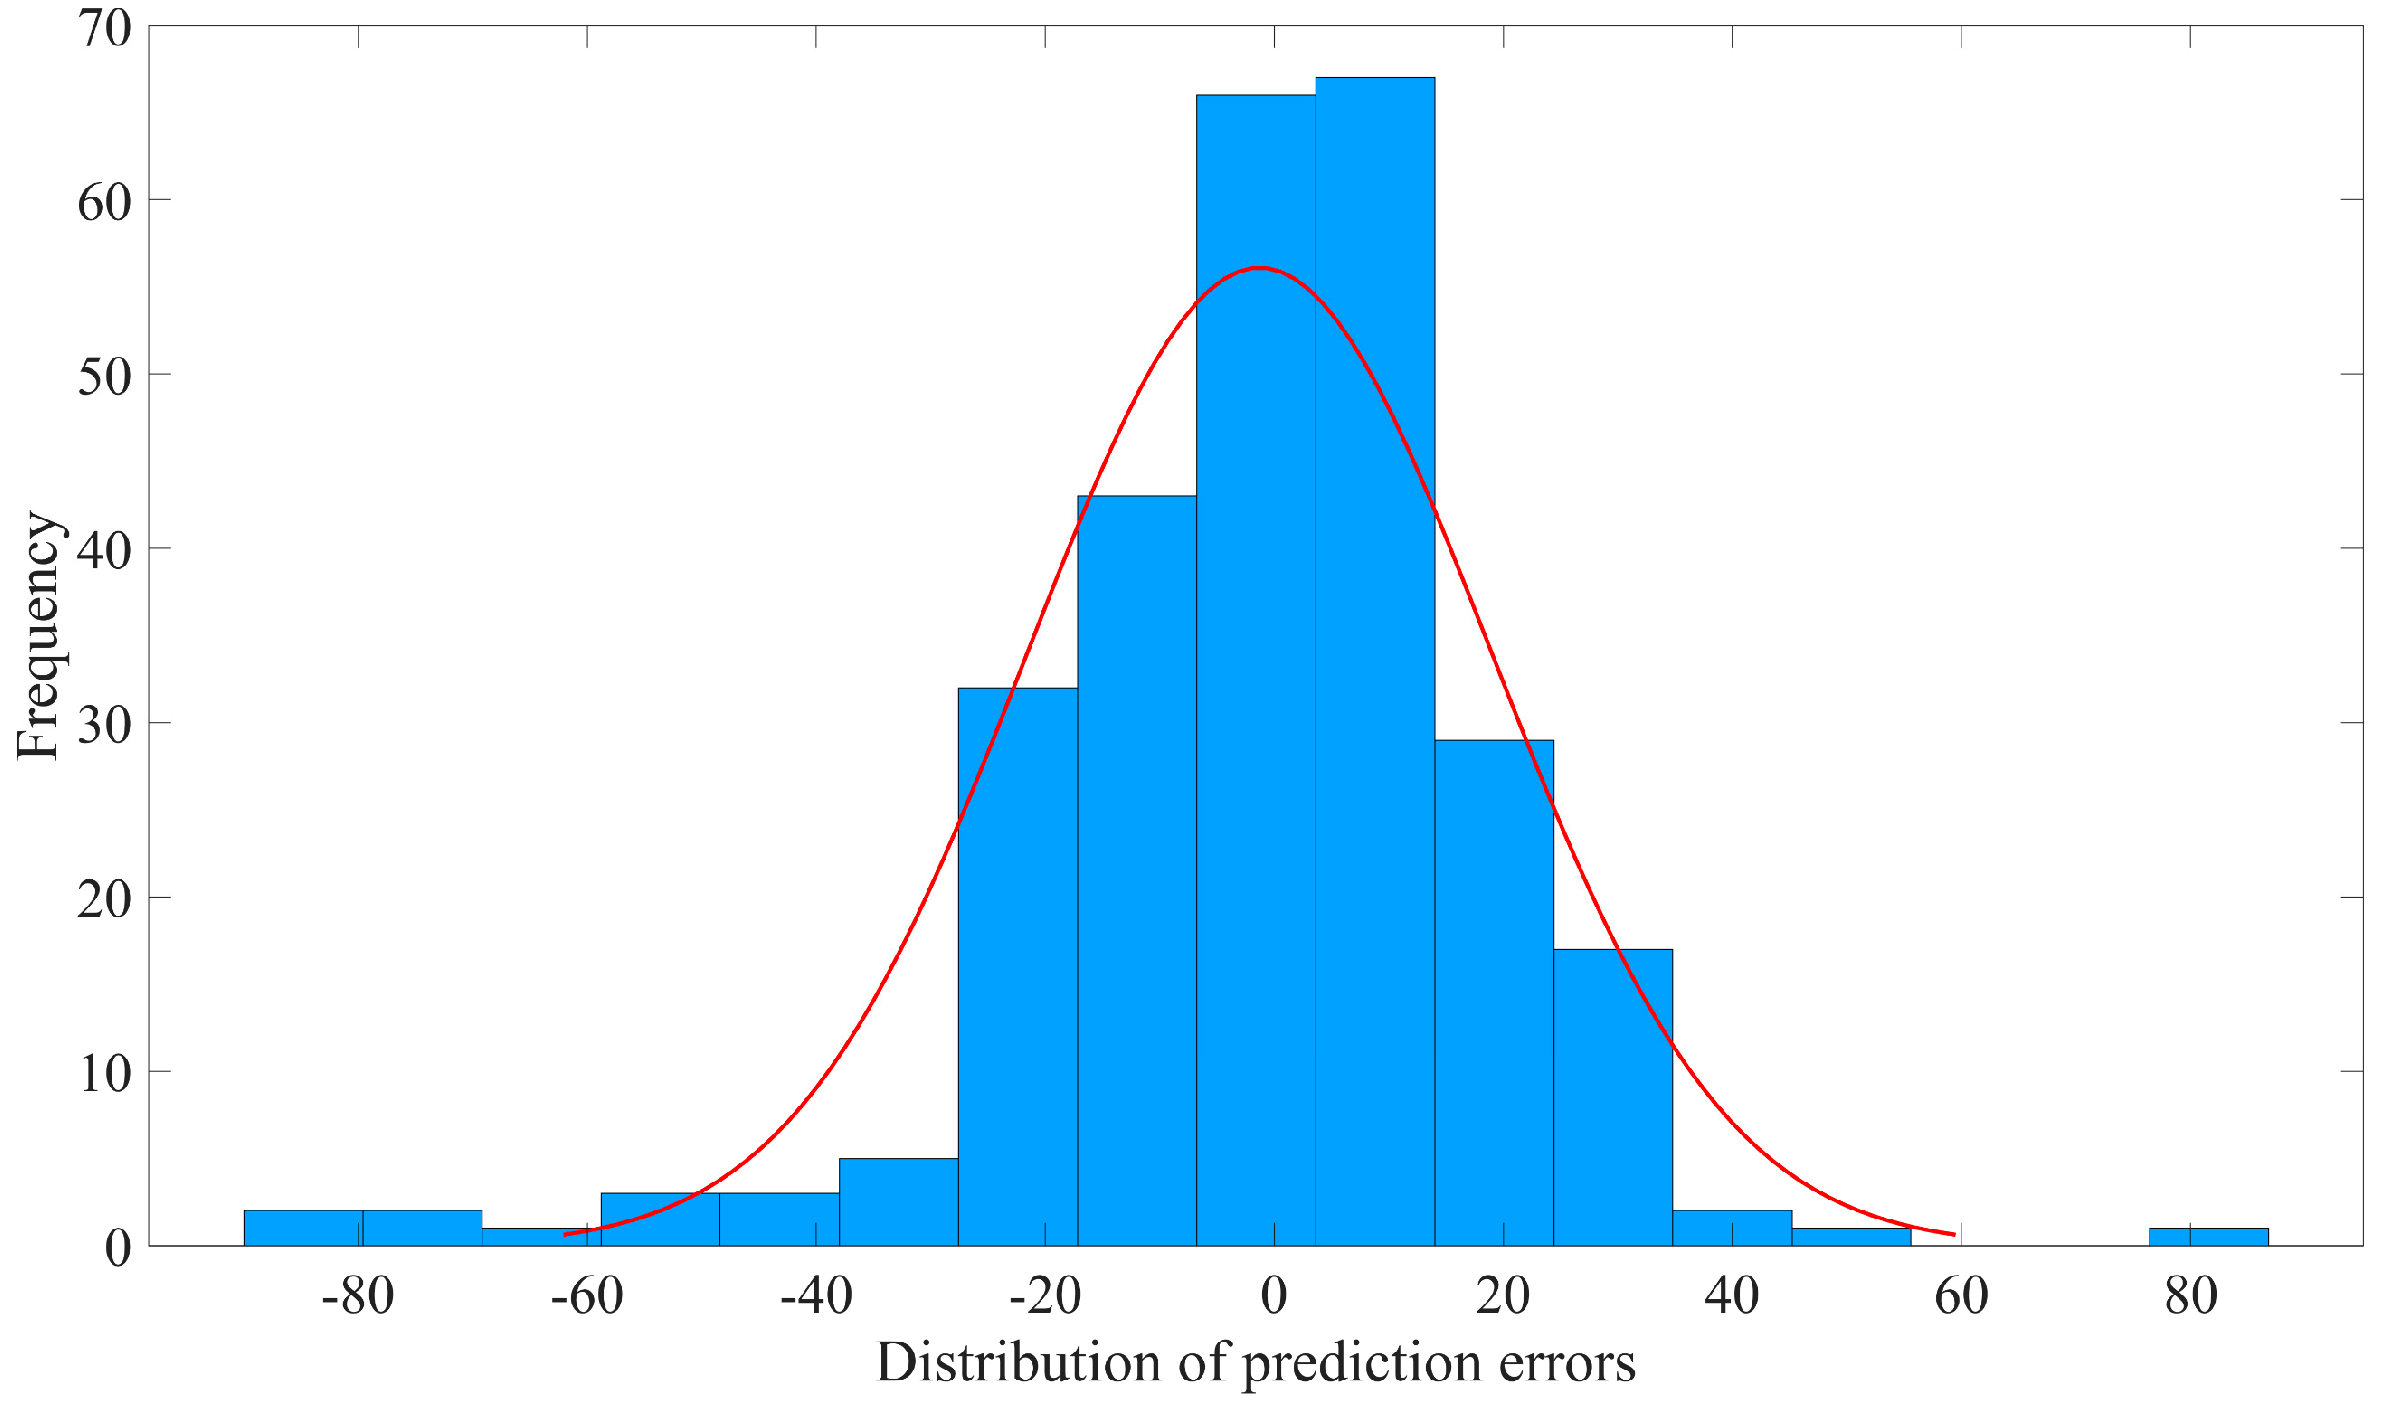
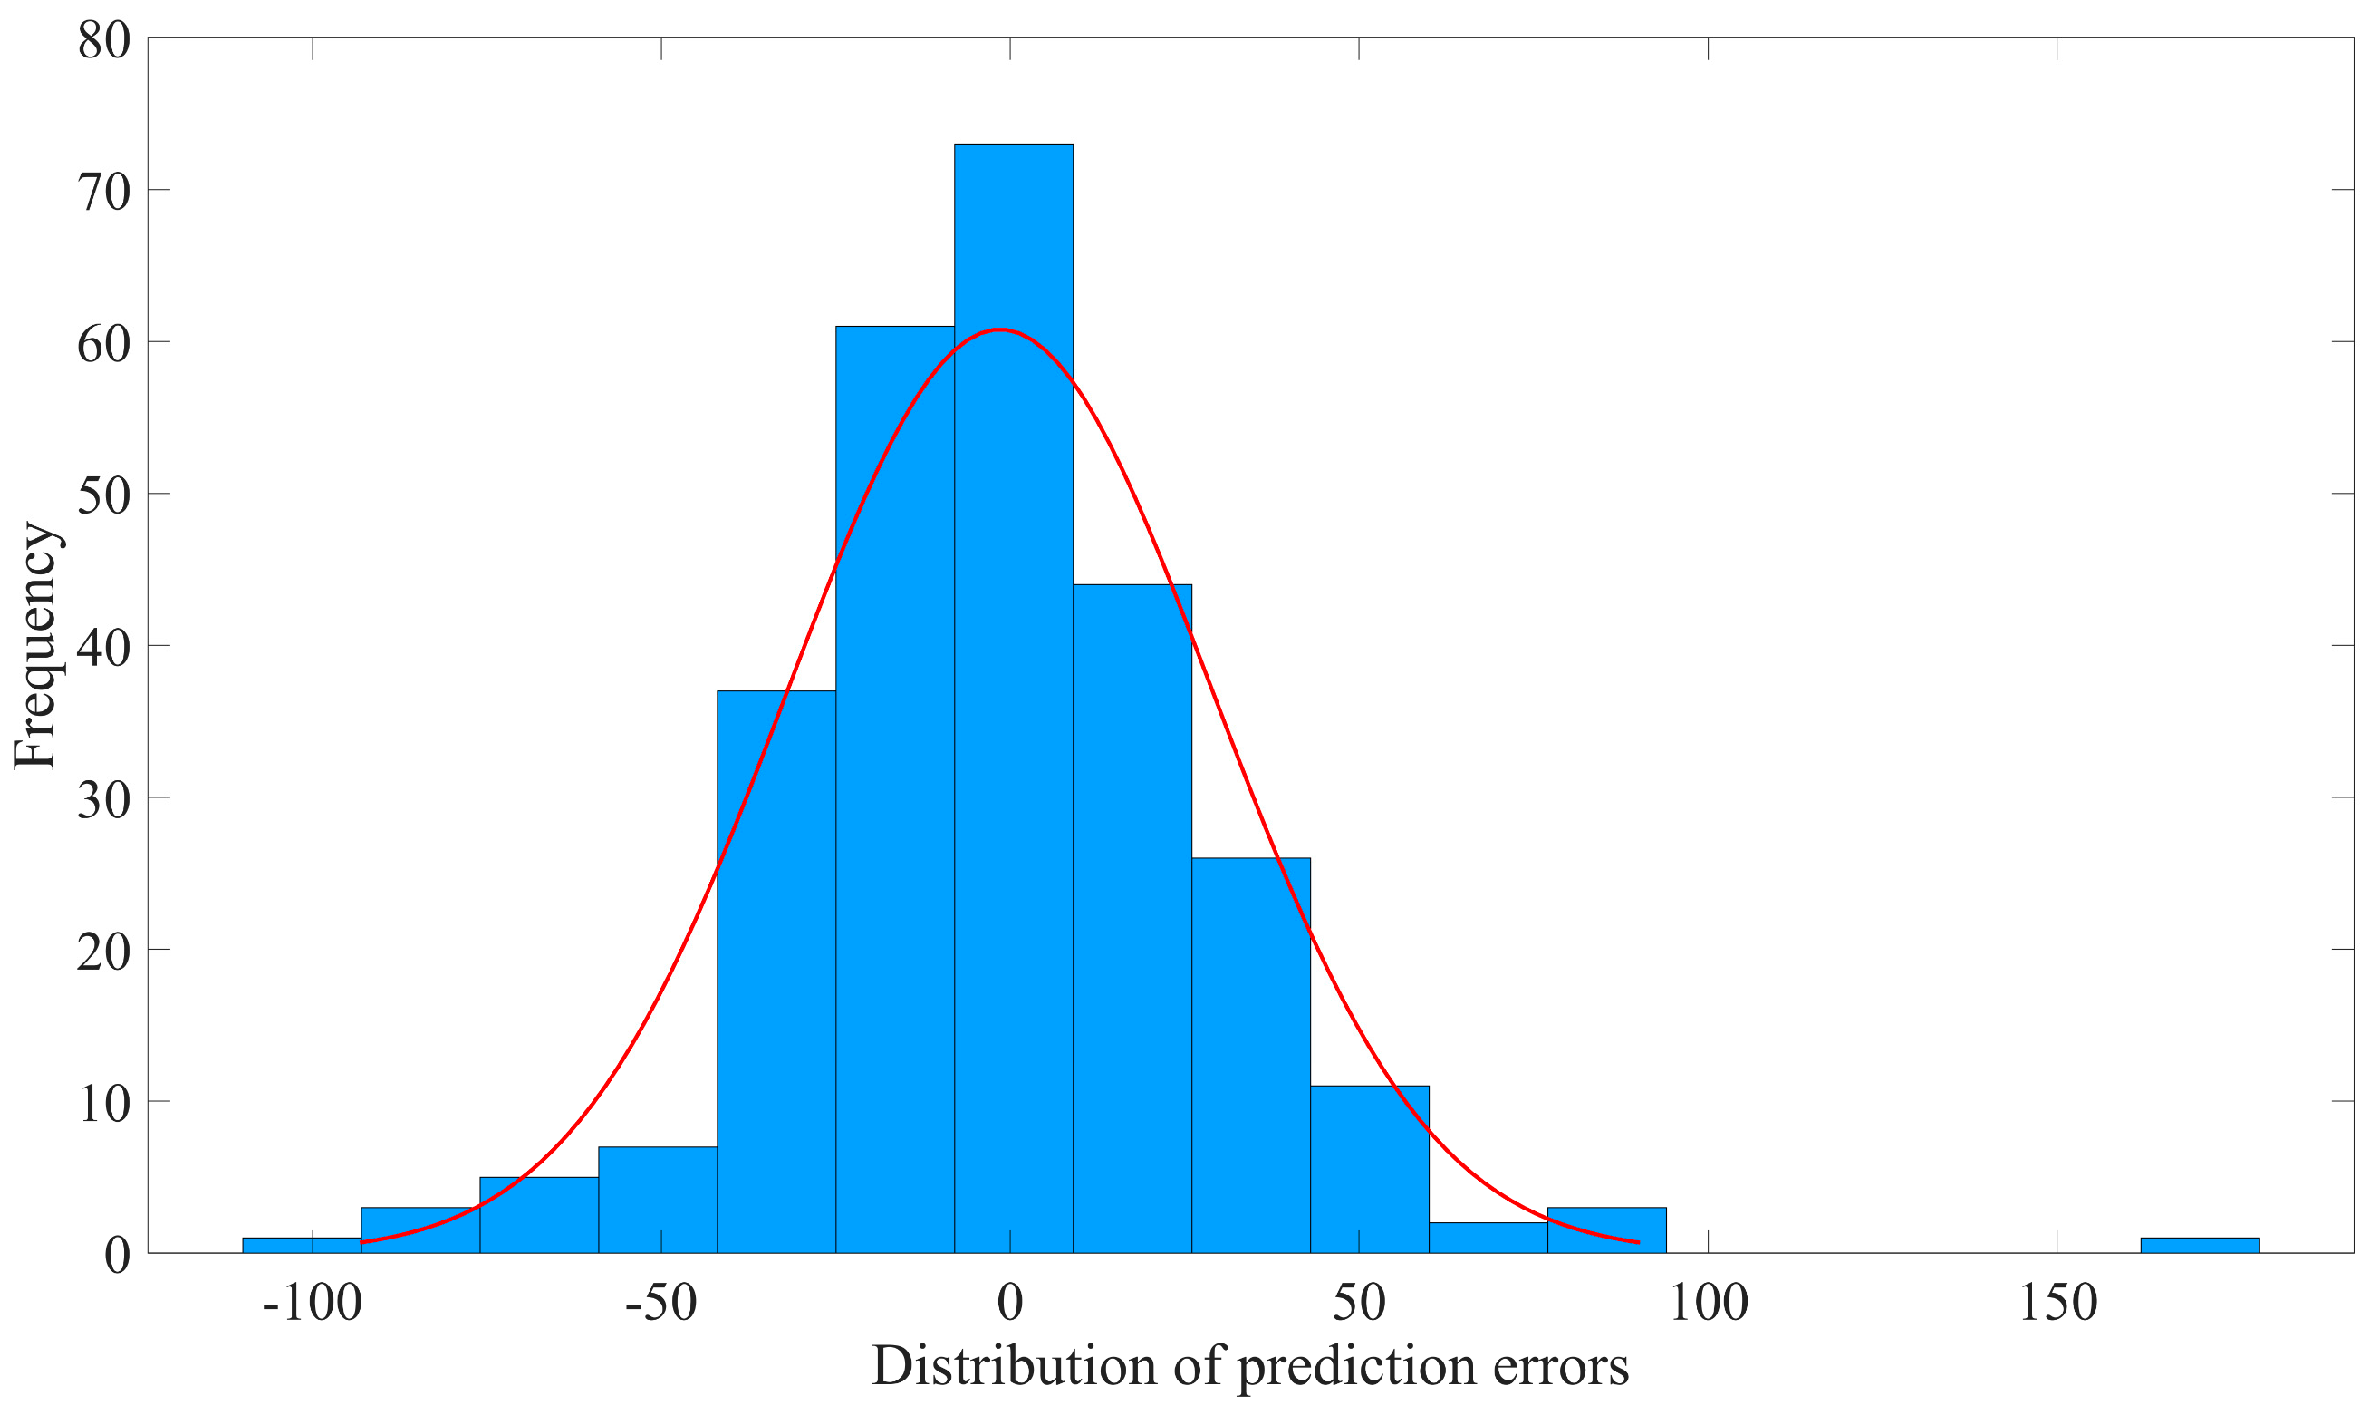
p-values are below 0.05). Consequently, a detailed analysis of the error distributions was conducted, and error histograms for each model were created, as illustrated in Figure 10, Figure 11, Figure 12 and Figure 13.
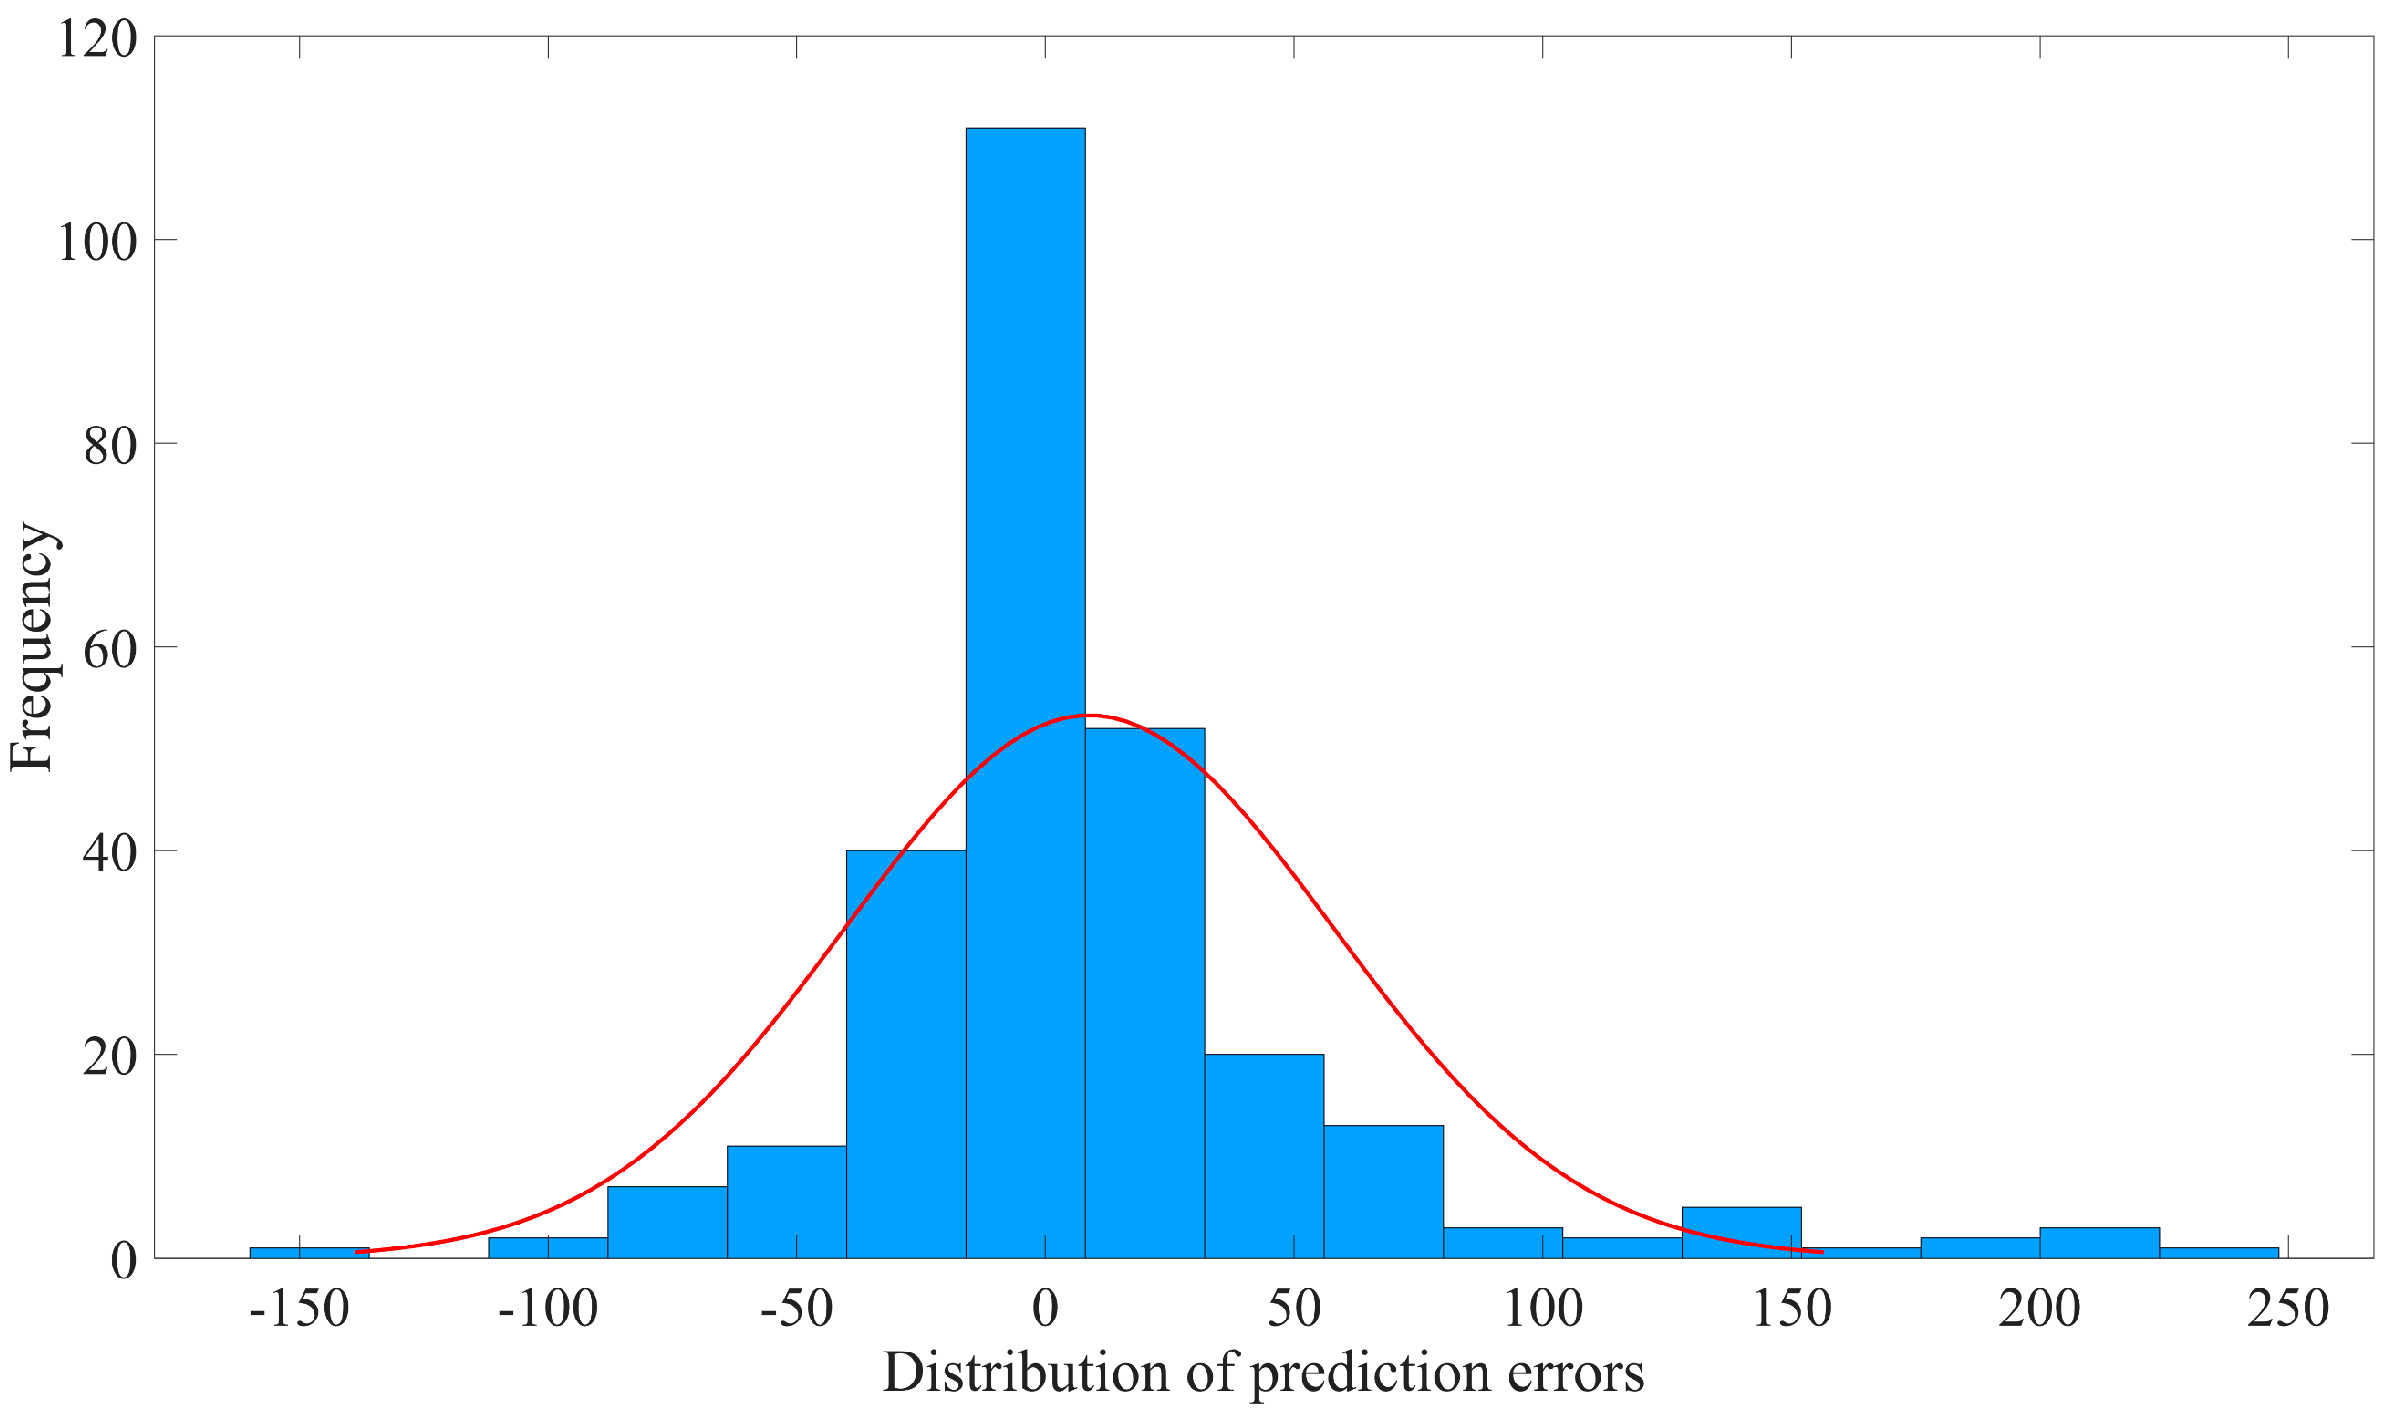
The prediction errors of SMA-SVR are primarily clustered in the range of [−25, 25], with absolute error values generally below 90. In contrast, the prediction errors of GWO-SVR are predominantly found within the range of [−30, 30], but a considerable number of samples exhibit an absolute error exceeding 90, with four samples exhibiting values exceeding 200. While the errors tend to be centered around 0, the deviations from the actual values significantly diminish the reliability of GWO-SVR predictions.
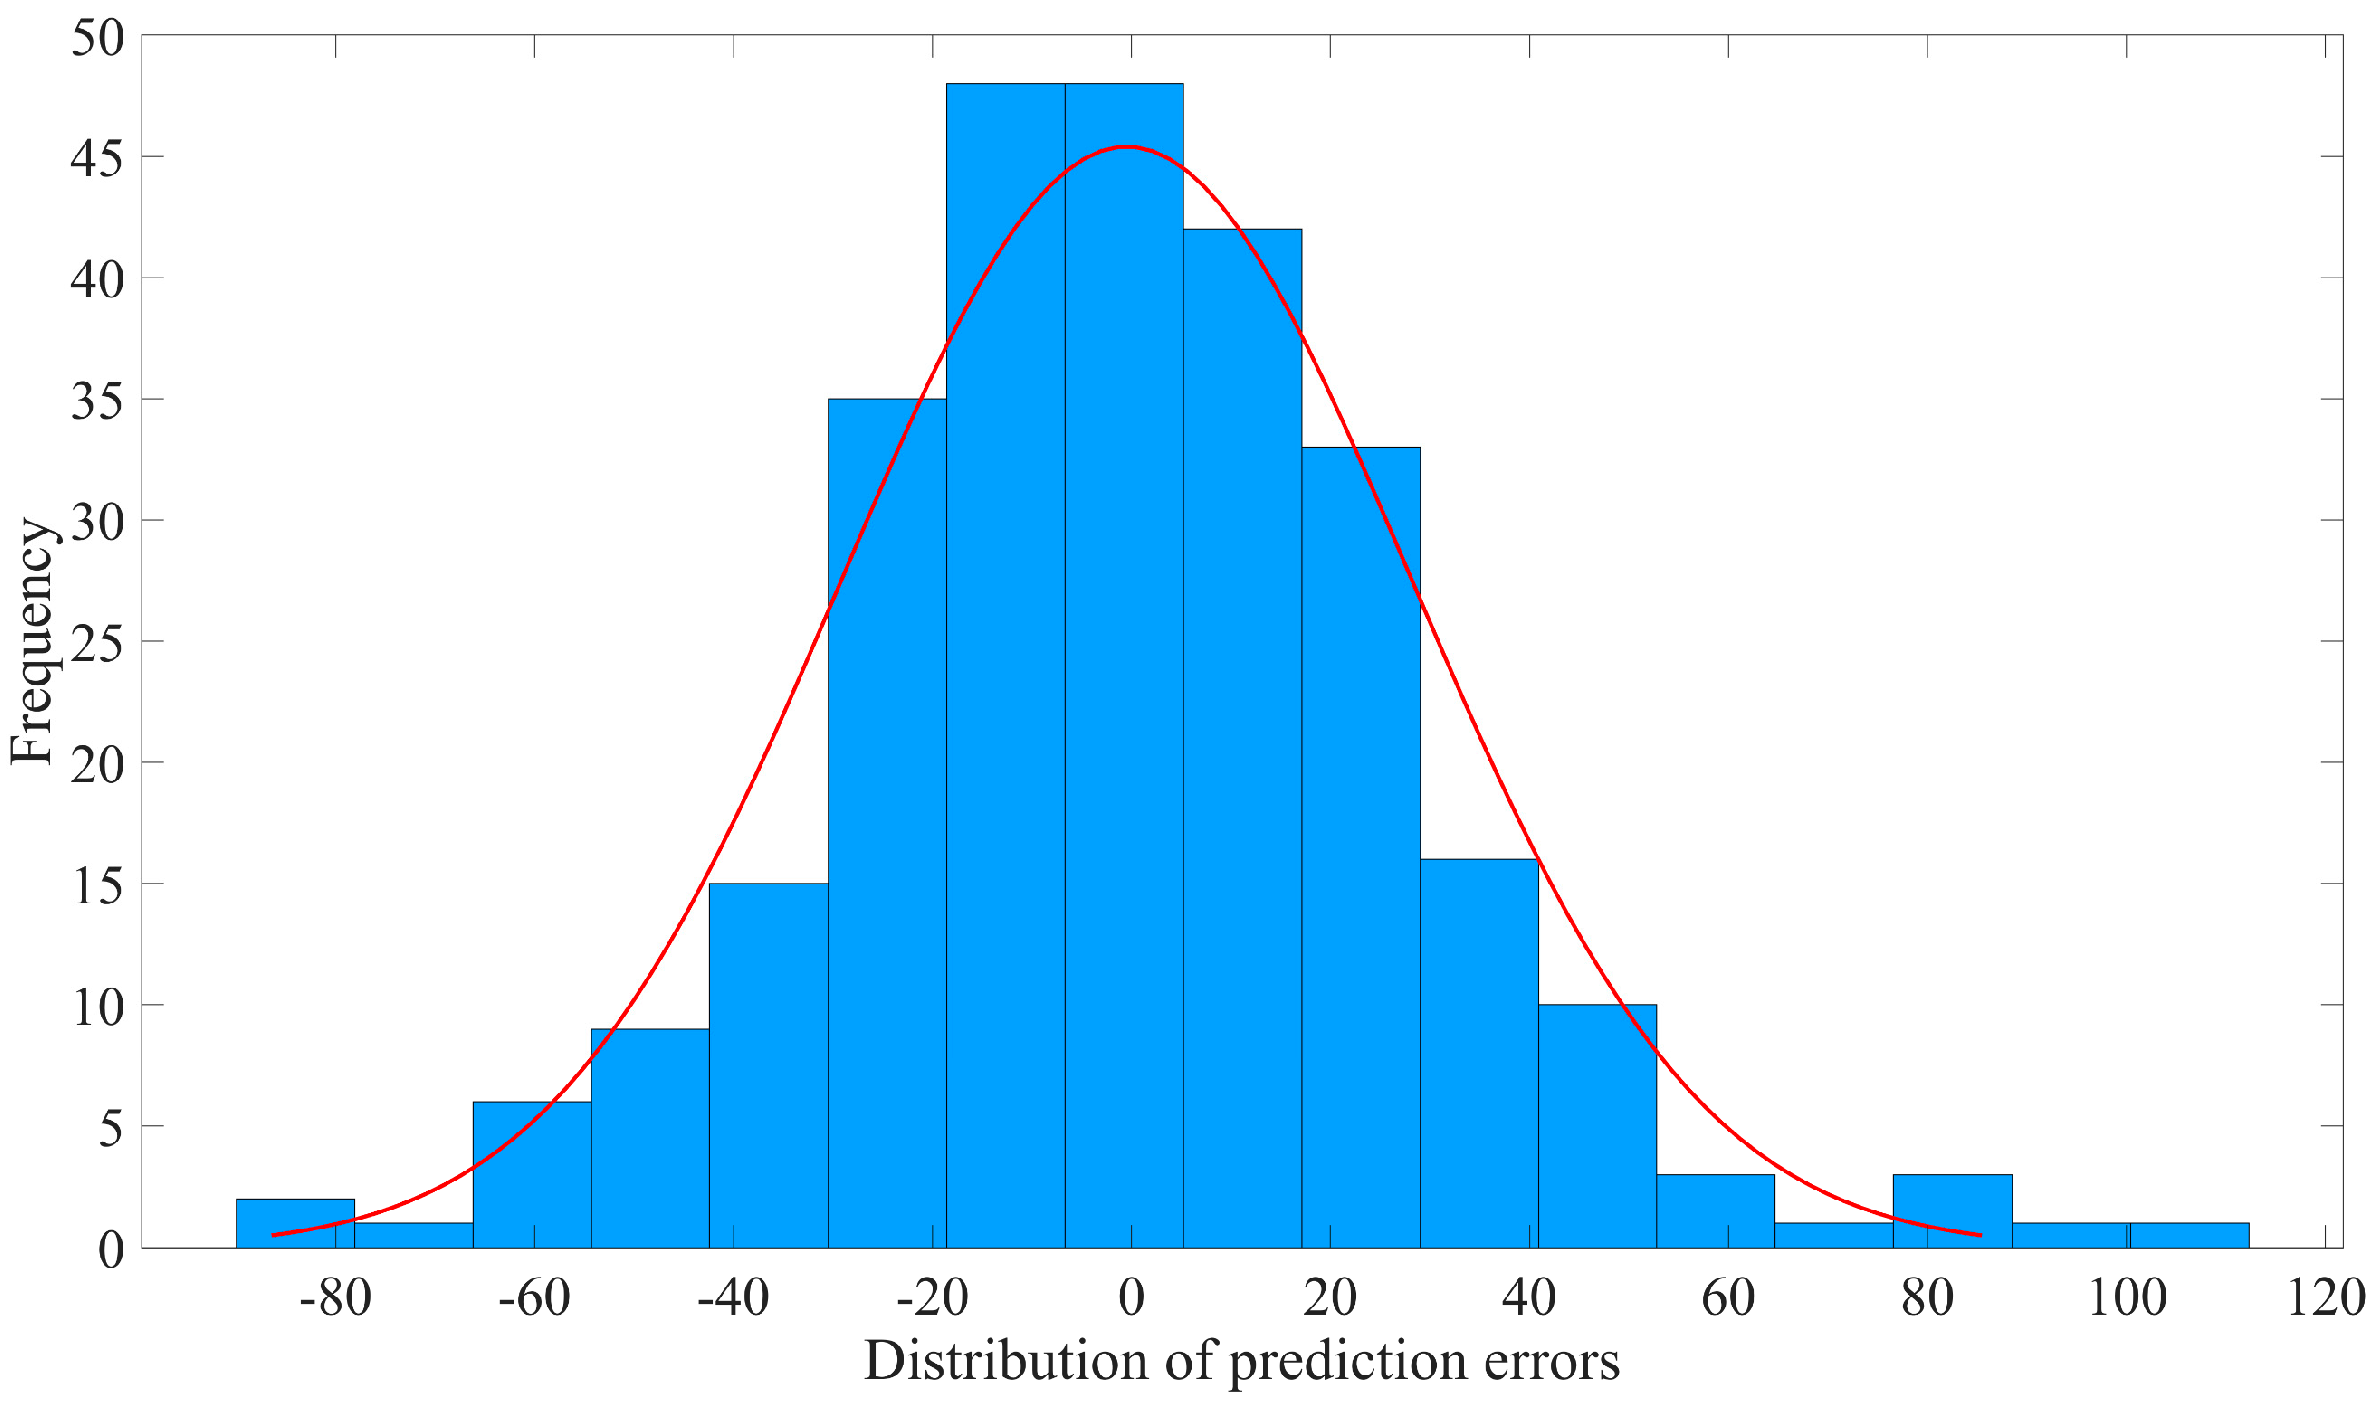
The prediction errors of PSO-BP are mainly distributed within the interval of [−40, 40], with some samples falling in the ranges of [−70, −40] and [40, 70] and two samples showing absolute errors exceeding 90. Similarly, the prediction errors of SSA-Elman are concentrated in the range of [−45, 45], with only two samples exhibiting an absolute error exceeding 90 and one sample showing a prediction error of more than 160 for the absolute value.
Overall, the prediction performance of SMA-SVR surpasses all the other models, with error values predominantly centered around 0 and absolute errors mostly below 90. As a result, SMA-SVR stands out as the most reliable model among the models considered.

4. Prediction Tests with Data from the Universal Testing Machine

Tensile tests were carried out on 30 varieties of low-alloy steel, utilizing a universal testing machine (UTM). The resulting data on tensile strength and 0.2% proof stress were collected. Subsequently, a comparative analysis and discussion were conducted to further evaluate the predictive capabilities of the hybrid models.

4.1. Material Preparation and Experiment Design

In total, 30 types of low-alloy steel were selected based on their mechanical properties and intended usage scenarios. Detailed information about these steel types can be found in Table 7, where they are categorized into nine distinct groups, including corrosion-resistant steel, high-strength steel, structural steel, and welded weathering steel. Table 8 records the elemental compositions of these low-alloy steel types.
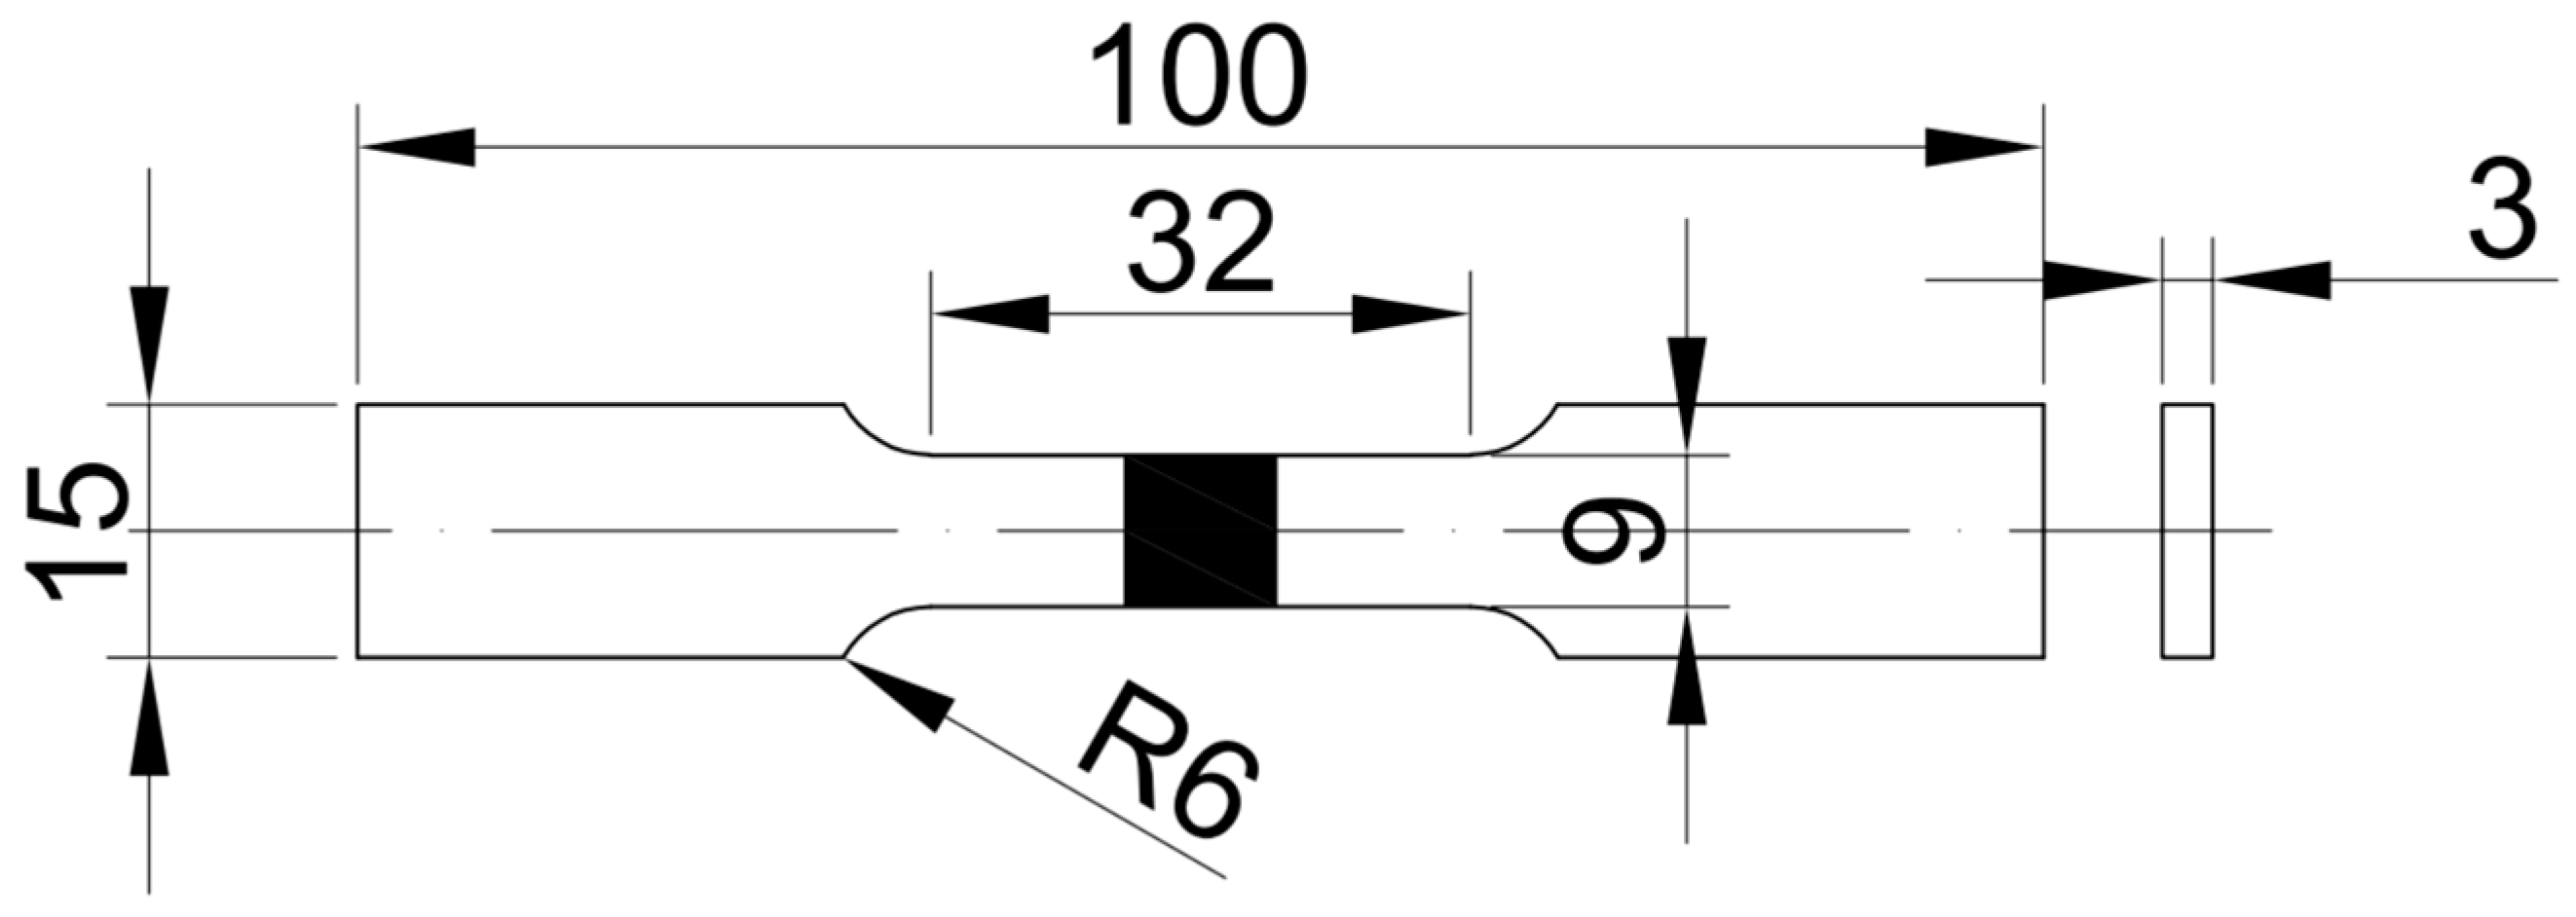
To create the test samples, 1500 mm × 1000 mm × 5 mm steel plates were utilized for each steel type. These plates underwent wire cutting and grinding processes following the design drawing of the test piece (refer to Figure 14). For every grade of steel, three test pieces were meticulously prepared, and each test piece underwent three separate tensile tests. The average values of tensile strength and 0.2% proof stress derived from these tests were collected as test data.
The material preparation procedure was carefully crafted to ensure uniformity and consistency among the specimens. Through the wire-cutting and grinding processes, the specimens were standardized in dimensions and surface finish, thereby reducing any potential impact on the experimental outcomes. Conducting three tests for each test piece enabled us to acquire dependable and consistent data for all types of steel.
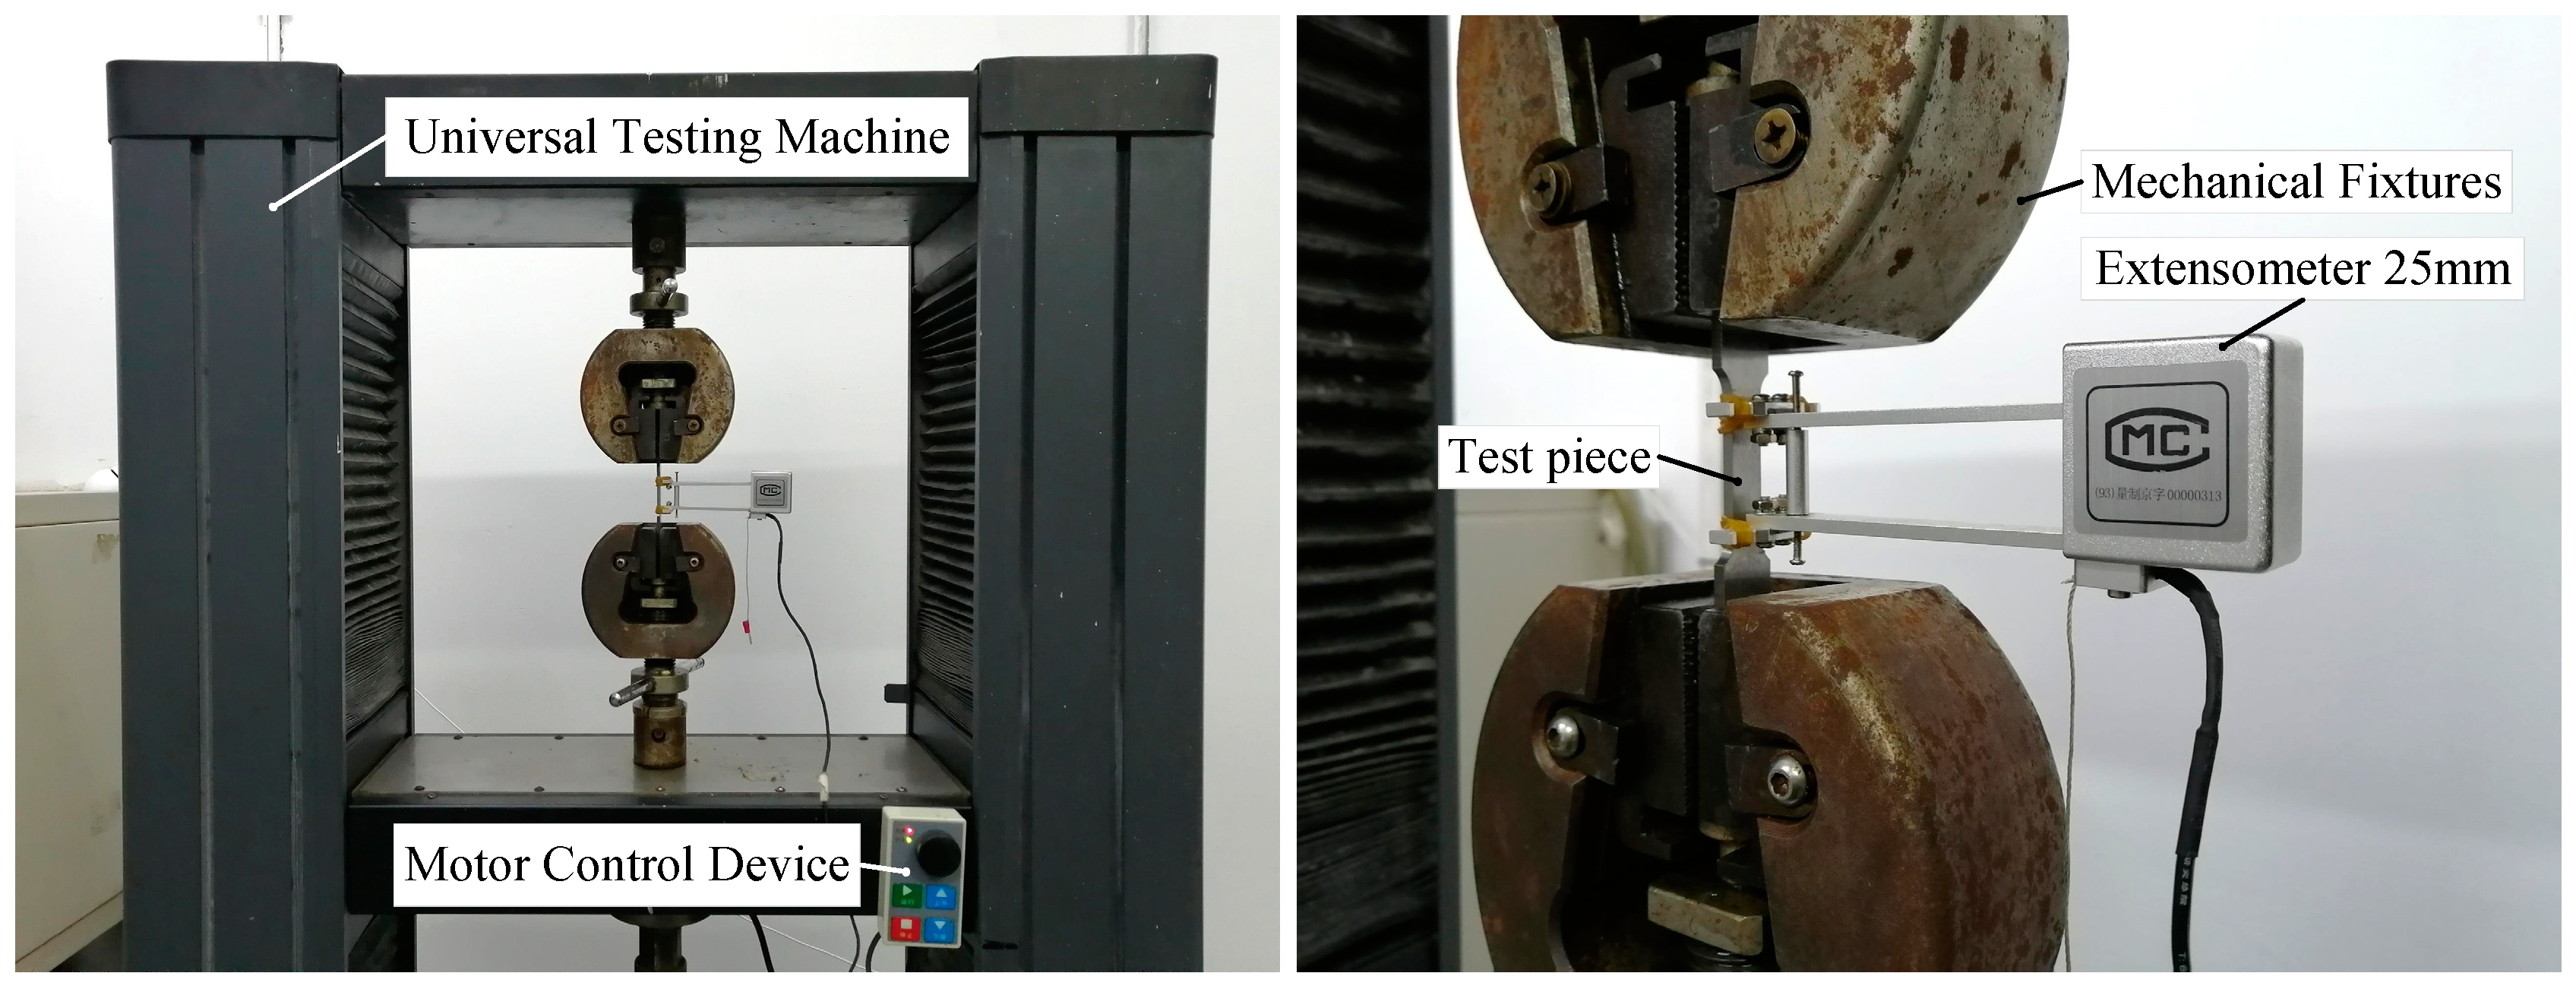
The universal testing machine (UTM) used was HDW-50k with the following parameters: maximum range: 5 × 10⁵ N; accuracy level: 1st rank; error of the indicated value: ±1.0%; load measurement range: 2~100% of the full range; and displacement resolution: 1 × 10⁻² mm. The extensometer’s scale distance for tests is 25 mm, with a relative error of ±1.0% for both the scale distance and the indicated value.
The experimental process involves using the UTM sensor to measure the force on the test pieces and the extensometer to determine their deformation. Photographs of the test site can be found in Figure 15. The specific steps are as follows:
(1)
Mount the test piece in the UTM collet with the extensometer fixed in the middle.
(2)
Axially stretch the test piece using the UTM with a strain rate set to 1.0 mm/min.
(3)
Measure the force of the test piece with the UTM force sensor and the deformation with the extensometer.
(4)
During the test, real-time measurement information is output to UTM software (UTM, Orlando, FL, USA, https://getutm.app) for processing.
(5)
After the test, software is used to calculate the measured information, obtaining the data for tensile strength and 0.2% proof stress.

4.2. Evaluation and Performance Analysis

The predictive capabilities of the four hybrid models are assessed by estimating the tensile strength and 0.2% proof stress of low-alloy steel based on their elemental composition as the input features. The dataset comprises 30 entries, with 21 entries randomly allocated to the training set and the remaining 9 to the test set, maintaining a 7:3 ratio between the training and test sets. Throughout the experiments, the hardware configuration of the computer remained constant, while specific parameters were adjusted as detailed below. For both SMA-SVR and GWO-SVR, the population size was fixed at 200, and the maximum number of iterations was set to 300. The penalty factor ranged between 0.01 and 800, and the kernel parameter was between 0.001 and 50. In the case of PSO-BP, the particle size was set to 30, and the maximum number of iterations was capped at 100, while the hidden layer of the BP network housed 7 nodes. As for SSA-Elman, the sparrow population size was 50, and the maximum number of iterations for the Elman network was set at 1000.
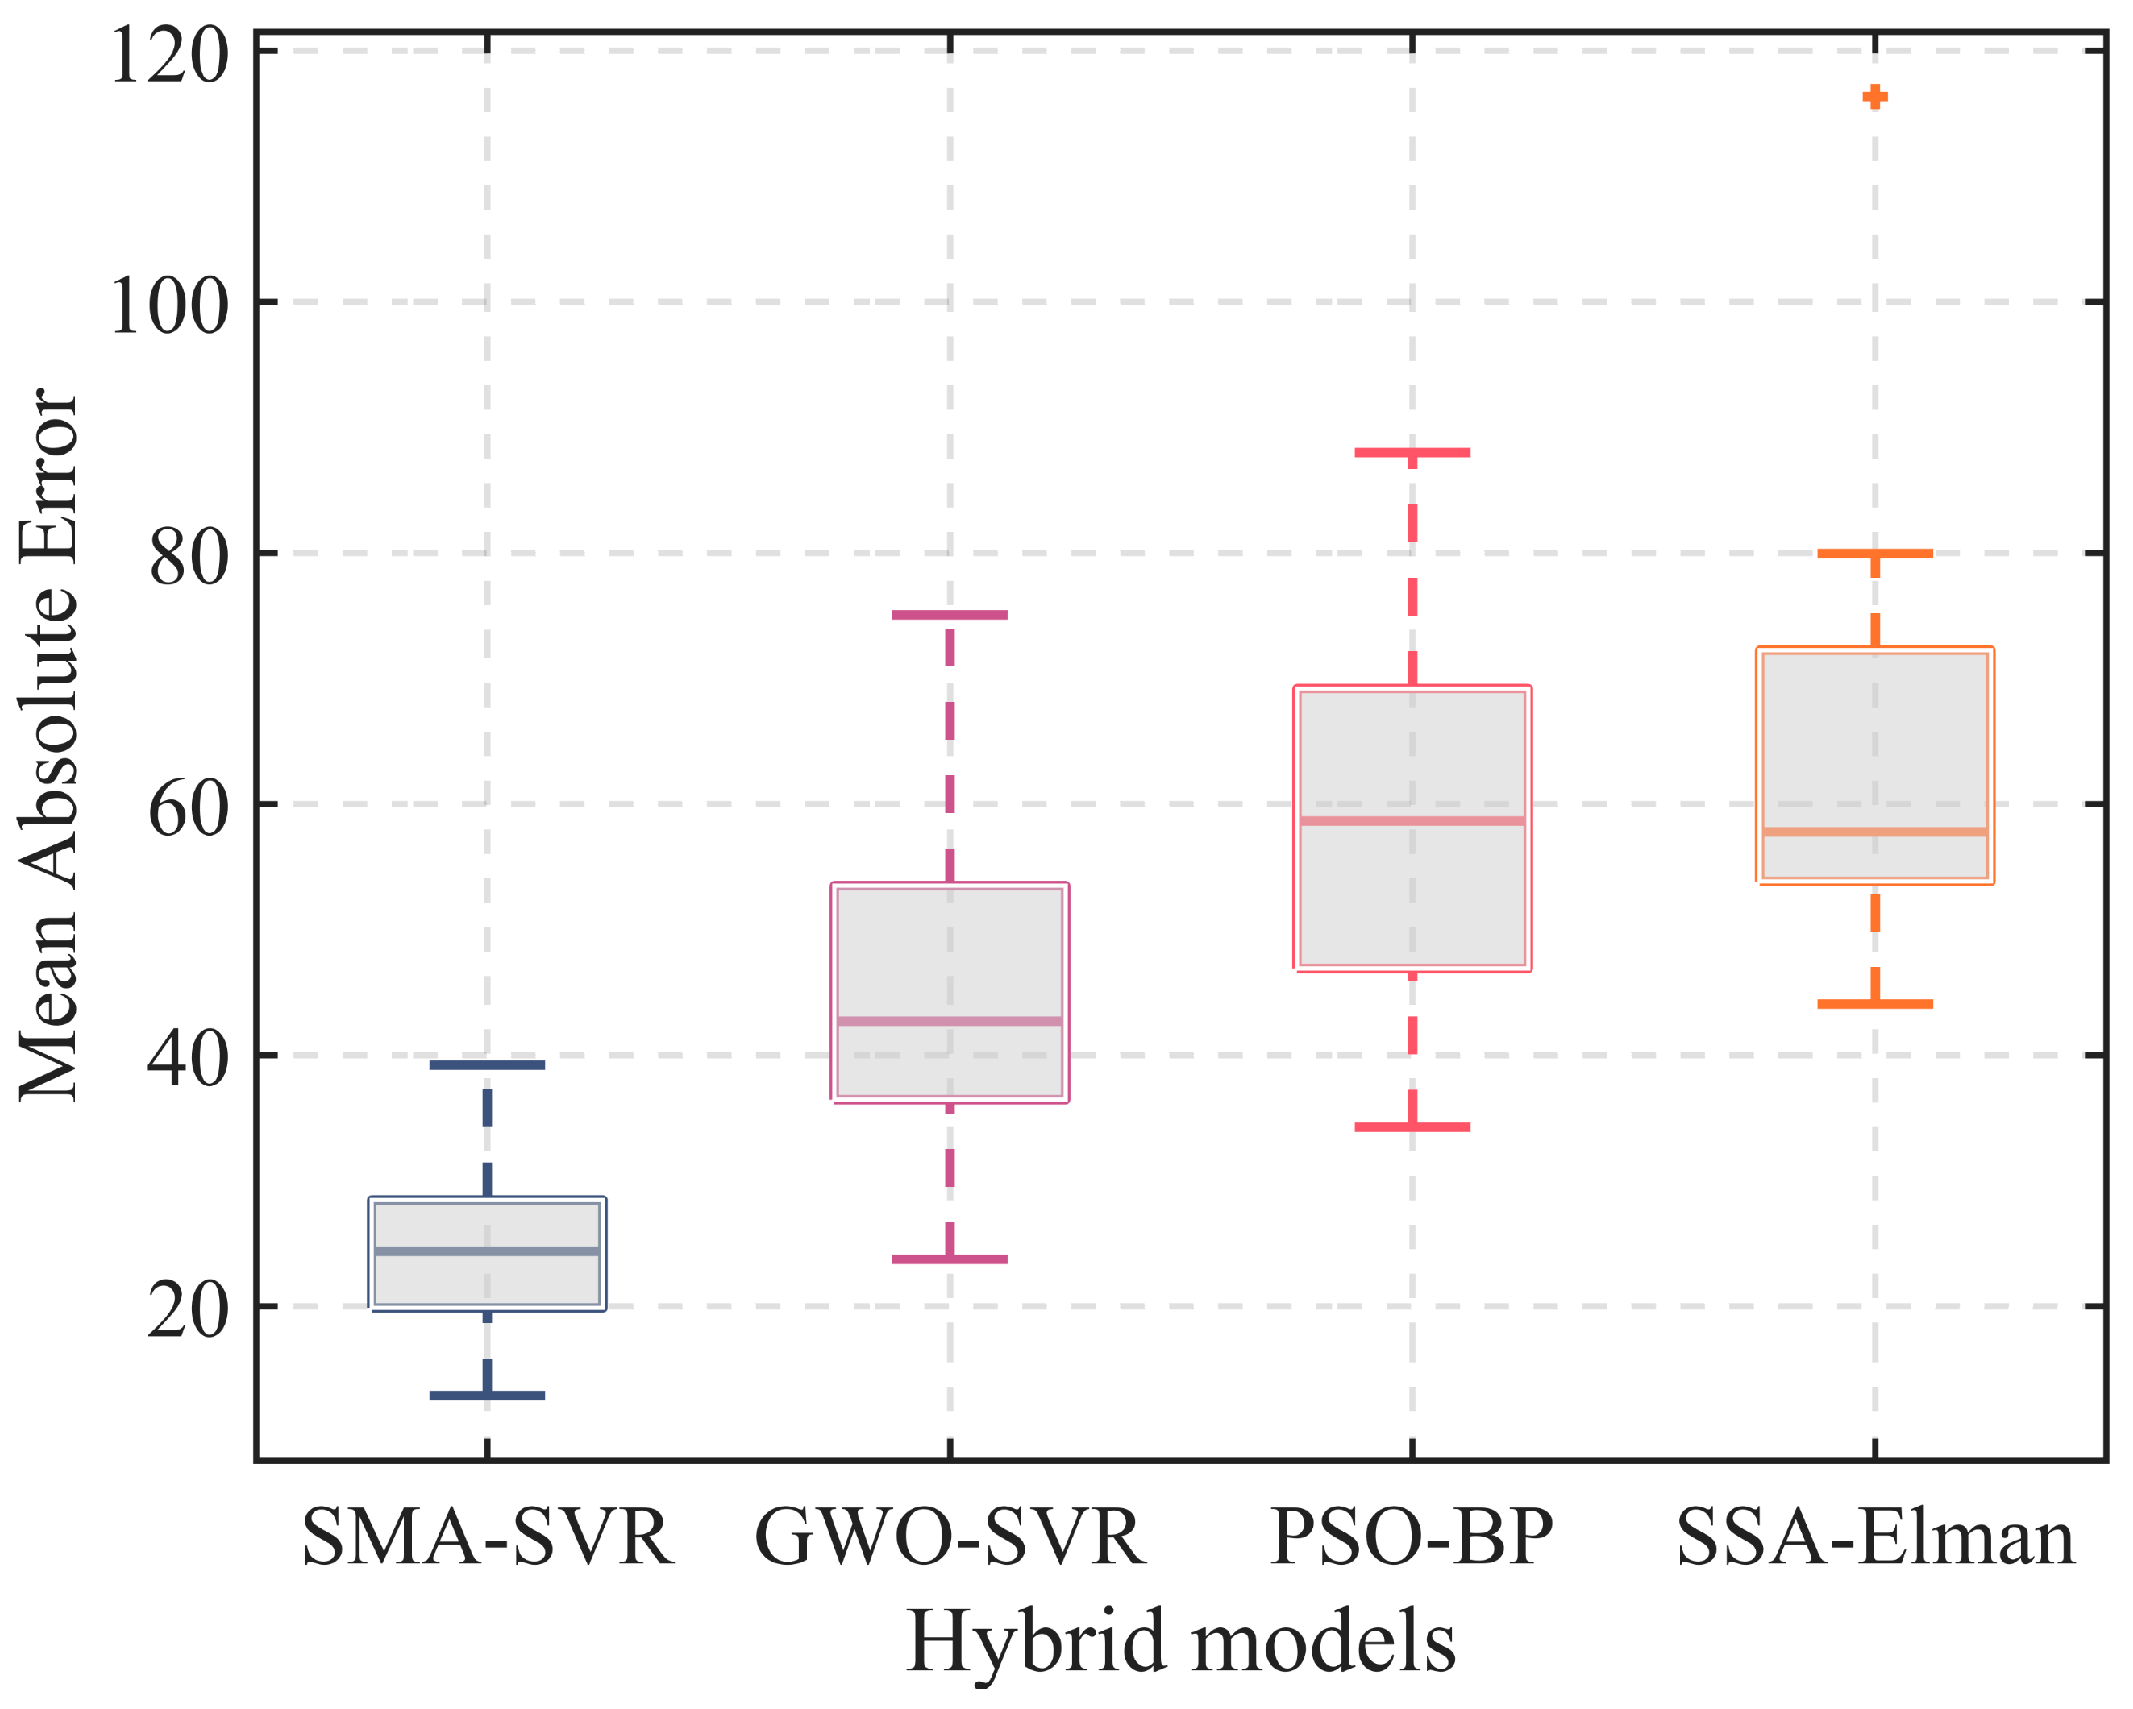
Each model underwent 20 repetitions to acquire prediction results and evaluation metrics, as summarized in Table 9. To illustrate prediction errors visually, box plots depicting MAE were generated, as depicted in Figure 16. Regarding the prediction of tensile strength, SSA-Elman emerged as the hybrid model with the least favorable performance. Despite its commendable accuracy, it was burdened with prolonged computational time and yielded higher MAE and MSE values when contrasted with the other models. In comparison, while PSO-BP exhibited a lower prediction error than SSA-Elman, its R2 value was the most modest, signifying challenges in comprehending the intricate mapping relationship between the material composition and properties.
SMA-SVR and GWO-SVR, both known for their suitability in small sample sizes, outperformed the previous two models. SMA-SVR demonstrates the highest R2 value, which is approximately twice as high as that of GWO-SVR. Moreover, SMA-SVR exhibits a 44.92% smaller MAE value than GWO-SVR, with a shorter computational time. In the 20 conducted tests, SMA-SVR yielded the most favorable outcomes with a penalty factor set to 450.5898 and a kernel parameter set to 0.0073. The resulting values for MAE, MSE, R2, and computational times were 12.5516, 296.5571, 0.9593, and 9.1410 s, respectively. Conversely, GWO-SVR delivered optimal results when the penalty factor was set to 800.0 and the kernel parameter to 0.7702. Under these settings, GWO-SVR displays an MAE of 20.0123, an MSE of 618.0679, an R2 of 0.9324, and a computational time of 10.9094 s.
According to the findings, SMA-SVR exhibits the most robust modeling capability among the four hybrid models. Its predictions are not only accurate but also efficient, rendering it a prudent choice for predicting the tensile strength of low-alloy steel.
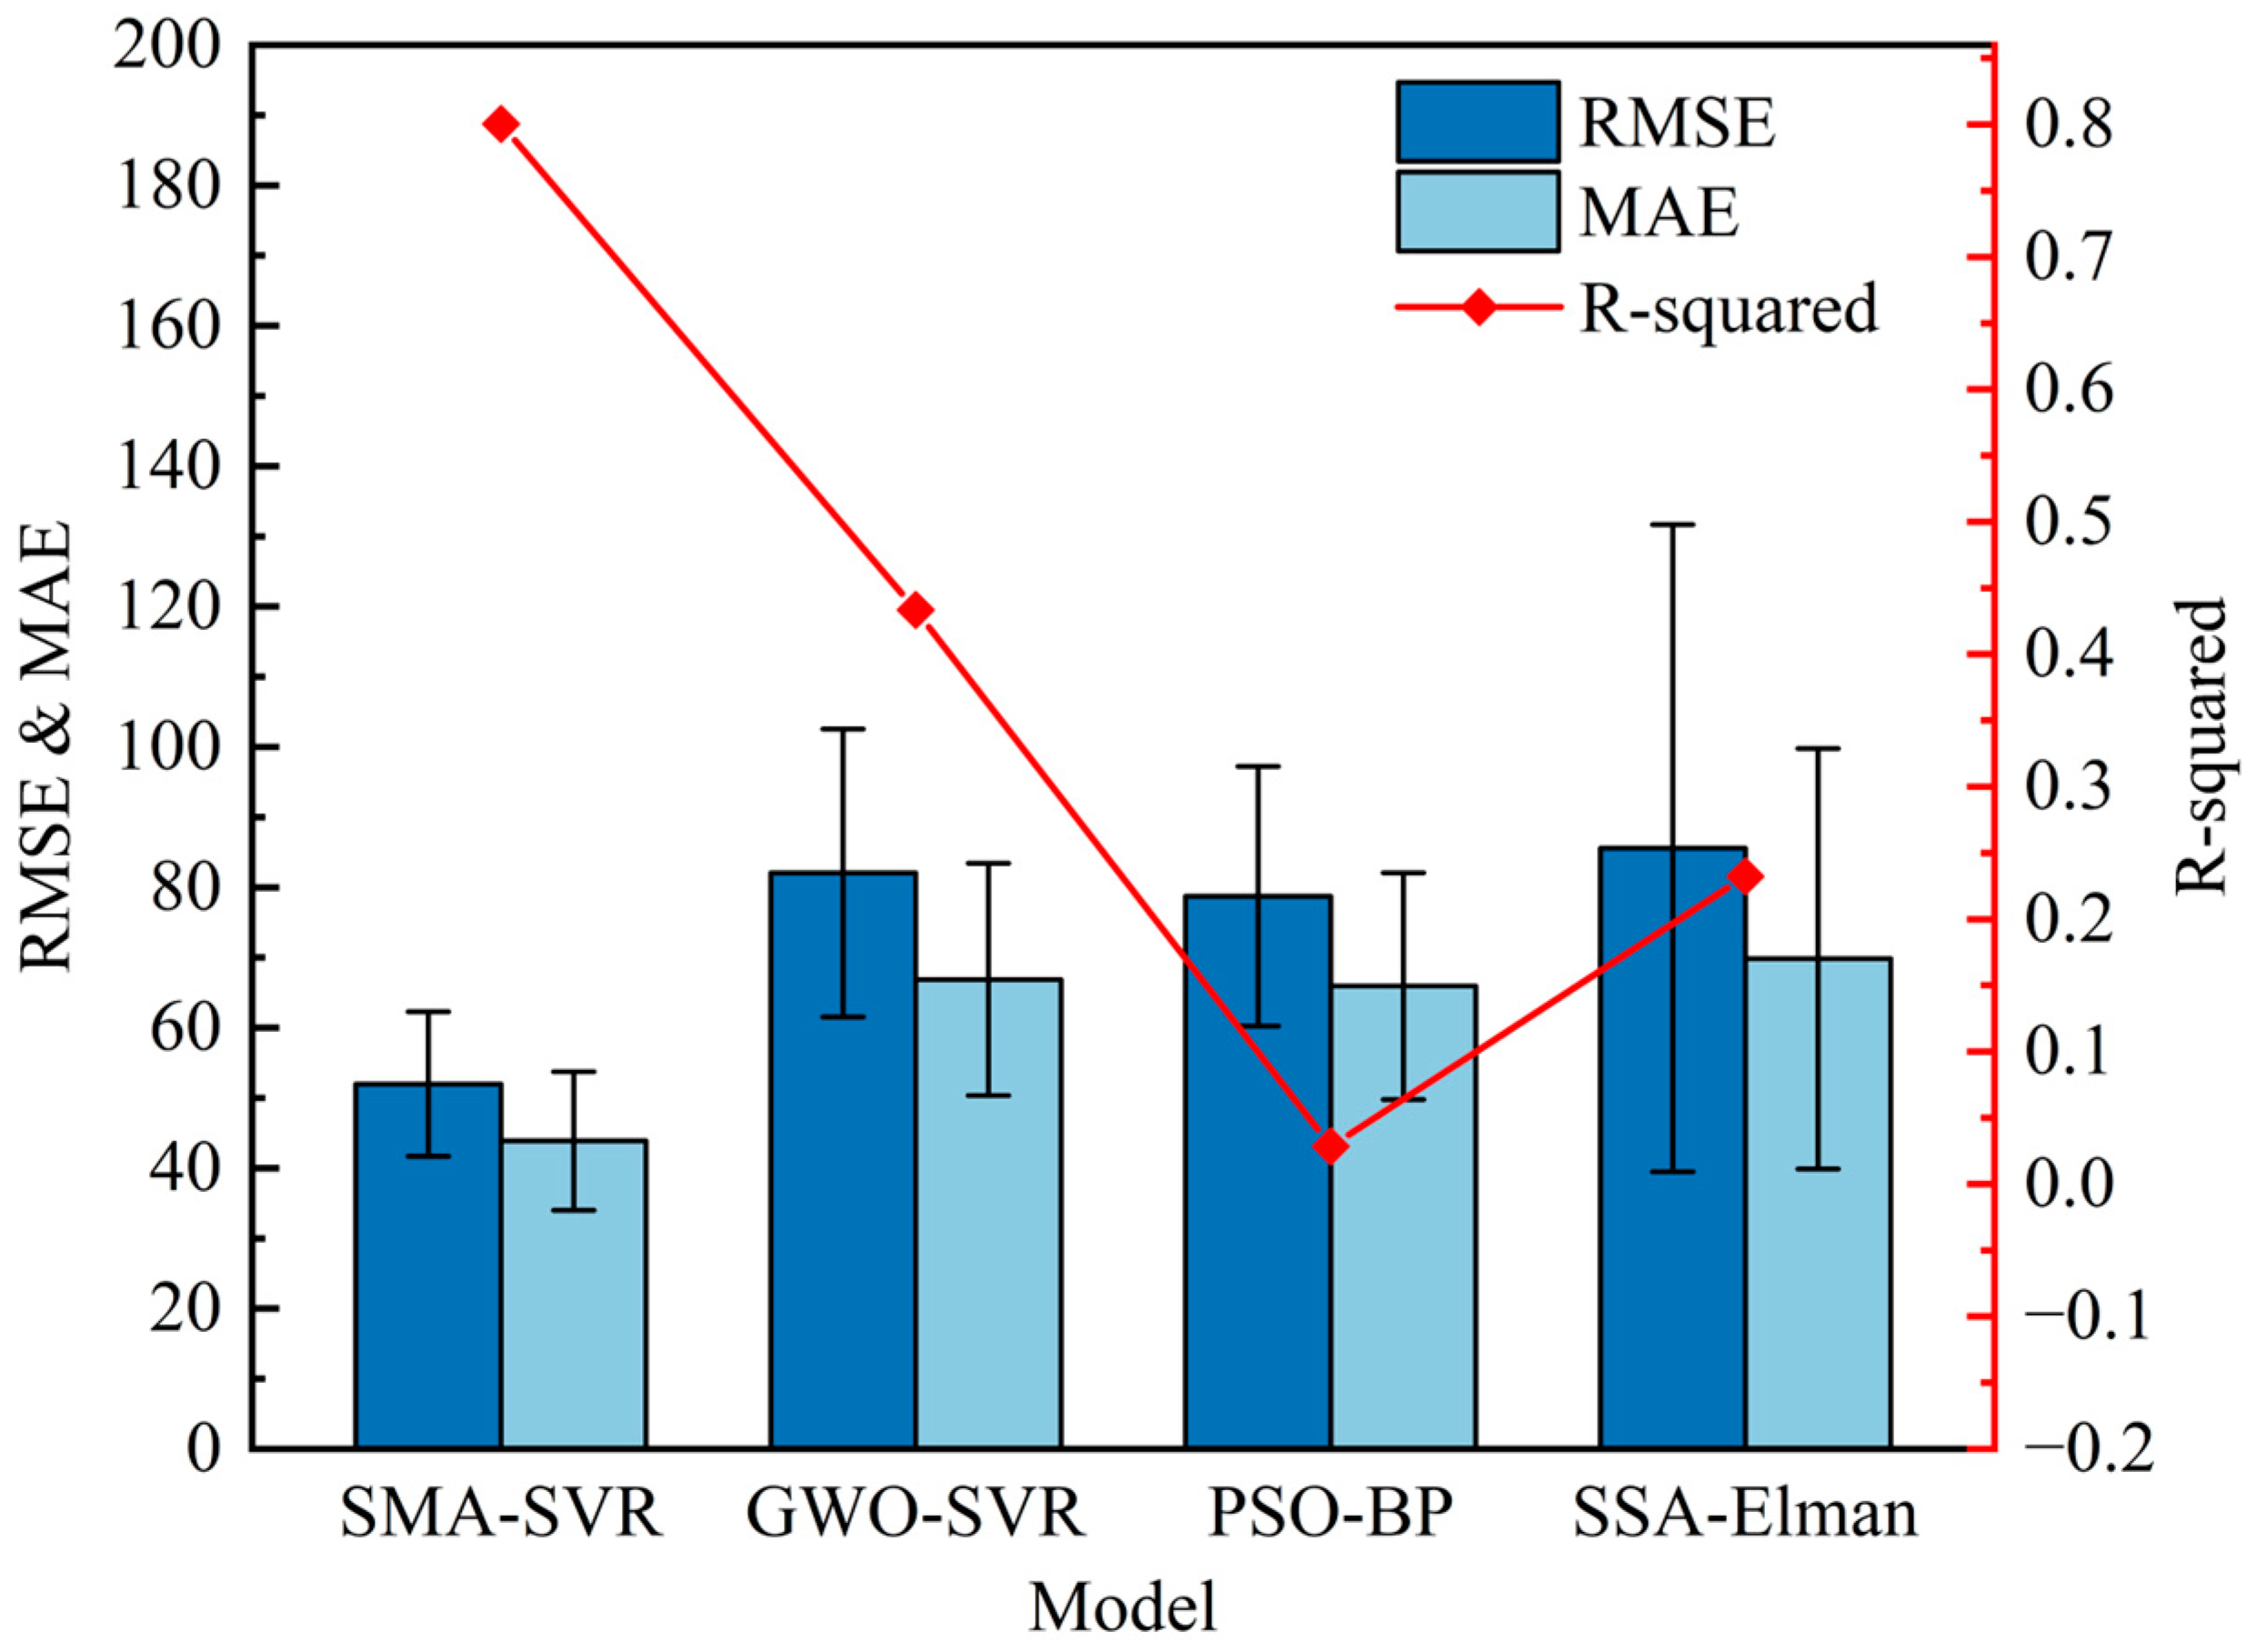
The test results and error measurements of 0.2% proof stress prediction are recorded in Table 10. Based on the experimental results of 0.2% proof stress, a dual Y-axis graph combining a bar chart and a line graph is plotted to visually demonstrate the prediction performance of each model, as shown in Figure 17. It includes the RMSE, MAE, and R-squared data. SMA-SVR also stands out as the best model with the smallest MAE and MSE values, as well as the shortest computational time. This test further demonstrates its robustness. However, a closer examination of the best prediction results from each model reveals some intriguing phenomena.
With the penalty factor set to 536.0331 and the kernel parameter set to 0.0214, SMA-SVR produced the most accurate predictions, achieving an R2 value of 0.9117, RMSE of 30.1331, and MAE of 24.9031. Interestingly, the second-best performing model was not GWO-SVR but rather SSA-Elman, which yielded an R2 value of 0.8434, RMSE of 49.2817, and MAE of 42.2157. This outcome underscores the critical impact of hyperparameter optimization on the learning capabilities of models. The selection of appropriate hyperparameters leads to a considerable improvement in both computational time and prediction accuracy.
The combination of SMA and SVR proves to be highly successful, with the hyperparameter optimization of SMA significantly outperforming that of GWO. The prediction performance and computational efficiency of SMA-SVR are optimal among the experiments conducted. SMA-SVR demonstrates an exceptional ability to learn the complex mapping between chemical compositions and material properties, even with small sample sizes. Moreover, it exhibits a strong generalization ability. These findings support the argument that SMA-SVR is an ideal choice for predicting the 0.2% proof stress of low-alloy steel.

5. Conclusions

Understanding mechanical properties is essential for various industrial applications, such as design, manufacturing processes, and product reliability. Accurately predicting material performance not only aids designers in selecting the right materials but also provides valuable guidance to processors seeking new materials and assists engineers in analyzing product failures. In this study, a hybrid SMA-SVR model is proposed that optimizes two hyperparameters of SVR to create a fast and effective predictor for material properties. To validate our approach, it is compared with other popular models (GWO-SVR, PSO-BP, SSA-Elman) using data from the NIMS Materials Database and material tests conducted on a universal testing machine.
A comprehensive evaluation of the models reveals SMA-SVR as the most accurate and efficient model, requiring a shorter computational time. The integration of SMA and SVR demonstrates significant promise in predicting the mechanical properties of low-alloy steel and enhancing industrial manufacturing processes. And this study concludes the following key points:
  • The accuracy of predicting in SVR hinges on factors like penalty factor and kernel parameters, tailoring to the variables under prediction. The incorporation of SMA not only boosts prediction accuracy but also slashes processing time significantly.
  • Among the experiments, SMA-SVR stands out for its exceptional predictive prowess in tensile strength tests. SMA-SVR outshines PSO-BP, SSA-Elman, and GWO-SVR with the highest R2 ranking, the lowest RMSE ranking, and notably the shortest computational time.
  • SMA-SVR exhibits minimal prediction errors for the 0.2% proof stress, with errors mainly clustered in the range [−25, 25] and absolute error values below 90. GWO-SVR, on the other hand, displays errors mostly around zero, albeit with four errors exceeding 200. Conversely, PSO-BP and SSA-Elman models performed less effectively than SMA-SVR. As the precision in predictions escalates, reference values tend to rise, making SMA-SVR the most practical model within the assessment.
  • Evaluating a material’s microstructure conventionally entails a substantial investment of cost and time, often constrained by limited sample sizes. Nonetheless, SMA-SVR adeptly links a material’s chemical composition to its mechanical properties, even for modest samples, transcending the grade limitations of low-alloy steel. With robust generalization capabilities, SMA-SVR extends its utility across various industrial domains, offering high prediction accuracy and minimal errors for small sample sizes among the models surveyed.
Potential avenues for future exploration encompass leveraging composite strategies to bolster SMA-SVR’s predictive capability or amplifying SMA’s global search proficiency. Conducting further experiments and analyses with reduced sample sizes could study the model’s efficacy across diverse applications, paving the way for the wider adoption of SMA-SVR as a dependable and efficient tool for material property forecasts.

Author Contributions

Conceptualization, Z.C.; methodology, Z.C.; software, Z.C.; validation, Z.C. and C.P.; formal analysis, Z.C.; investigation, Z.C. and C.P.; resources, Z.C. and C.P.; data curation, Z.C. and C.P.; writing—original draft preparation, Z.C.; writing—review and editing, Z.C. and C.P.; visualization, Z.C.; supervision, C.P.; project administration, C.P.; funding acquisition, C.P. All authors have read and agreed to the published version of the manuscript.

Funding

This study was funded by the Fundamental Research Funds for the Central Universities (grant number YWF-23-PTJH-0701), the National Natural Science Foundation of China (grant number 51875029) and the National Key Scientific Instrument and Equipment Development Projects of China (grant number 62227812).

Data Availability Statement

Enquiries about data availability should be directed to the authors.

Conflicts of Interest

The authors declare no conflicts of interest.

References

  1. Merayo, D.; Rodríguez-Prieto, A.; Camacho, A.M. Prediction of Mechanical Properties by Artificial Neural Networks to Characterize the Plastic Behavior of Aluminum Alloys. Materials 2020, 13, 5227. [Google Scholar] [CrossRef] [PubMed]
  2. Deng, Z.-H.; Yin, H.-Q.; Jiang, X.; Zhang, C.; Zhang, G.-F.; Xu, B.; Yang, G.-Q.; Zhang, T.; Wu, M.; Qu, X.-H. Machine-learning-assisted prediction of the mechanical properties of Cu-Al alloy. Int. J. Miner. Met. Mater. 2020, 27, 362–373. [Google Scholar] [CrossRef]
  3. Li, S.; Mo, B.; Xu, W.; Xiao, G.; Deng, Z. Research on nonlinear prediction model of weld forming quality during hot-wire laser welding. Opt. Laser Technol. 2020, 131, 106436. [Google Scholar] [CrossRef]
  4. García-Martino, Á.; García, C.; Prieto, M.M.; Díaz, J. Prediction of Mechanical Properties for High Strength Low Alloyed Steels in a Commercial Hot Dip Galvanizing Line without Soaking Section. Metals 2020, 10, 561. [Google Scholar] [CrossRef]
  5. Ma, W.; Wang, R.; Zhou, X.; Xie, X. The finite element analysis–based simulation and artificial neural network–based prediction for milling processes of aluminum alloy 7050. Proc. Inst. Mech. Eng. Part B J. Eng. Manuf. 2021, 235, 265–277. [Google Scholar] [CrossRef]
  6. Li, B.; Zhou, H.; Liu, J.; Kang, C. Multiaxial fatigue damage and reliability assessment of aero-engine compressor blades made of TC4 titanium alloy. Aerosp. Sci. Technol. 2021, 119, 107107. [Google Scholar] [CrossRef]
  7. El Khoukhi, D.; Morel, F.; Saintier, N.; Bellett, D.; Osmond, P.; Le, V.-D. Probabilistic modeling of the size effect and scatter in High Cycle Fatigue using a Monte-Carlo approach: Role of the defect population in cast aluminum alloys. Int. J. Fatigue 2021, 147, 106177. [Google Scholar] [CrossRef]
  8. Golden, P.J.; Whitney-Rawls, A.; Jha, S.K.; Iii, W.J.P.; Buchanan, D.; Prasad, K.; Chandravanshi, V.; Kumar, V.; John, R. Probabilistic prediction of minimum fatigue life behaviour in α + β titanium alloys. Fatigue Fract. Eng. Mater. Struct. 2019, 42, 674–685. [Google Scholar] [CrossRef]
  9. Bahloul, A.; Ben Ahmed, A.; Mhala, M.M.; Bouraoui, C.H. Probabilistic approach for predicting fatigue life improvement of cracked structure repaired by high interference fit bushing. Int. J. Adv. Manuf. Technol. 2017, 91, 2161–2173. [Google Scholar] [CrossRef]
  10. Hwang, R.-C.; Chen, Y.-J.; Huang, H.-C. Artificial intelligent analyzer for mechanical properties of rolled steel bar by using neural networks. Expert Syst. Appl. 2010, 37, 3136–3139. [Google Scholar] [CrossRef]
  11. Fu, Y.; Shao, Z.; Liu, C.; Wang, Y.; Xu, Y.; Zhu, X. Modeling the Mechanical Properties of Heat-Treated Mg-Zn-RE-Zr-Ca-Sr Alloys with the Artificial Neural Network and the Regression Model. Crystals 2022, 12, 754. [Google Scholar] [CrossRef]
  12. Wang, Y.; Sha, A.; Li, X.; Hao, W. Prediction of the Mechanical Properties of Titanium Alloy Castings Based on a Back-Propagation Neural Network. J. Mater. Eng. Perform. 2021, 30, 8040–8047. [Google Scholar] [CrossRef]
  13. Li, N.; Zhao, S.; Zhang, Z. Property Prediction of Medical Magnesium Alloy based on Machine Learning. In Proceedings of the 2021 IEEE 6th International Conference on Big Data Analytics (ICBDA), Xiamen, China, 5–8 March 2021; pp. 51–55. [Google Scholar]
  14. Huang, J.; Dong, M.; Lu, S.; Li, W.; Lu, J.; Liu, C.; Yoo, J.H. Estimation of the mechanical properties of steel via LIBS combined with canonical correlation analysis (CCA) and support vector regression (SVR). J. Anal. At. Spectrom. 2018, 33, 720–729. [Google Scholar] [CrossRef]
  15. Xu, Y.; Cui, L.; Xu, X. A Prediction Method of Fracture Toughness of Nickel-Based Superalloys. Comput. Syst. Sci. Eng. 2022, 42, 121–132. [Google Scholar] [CrossRef]
  16. Cassar, D.R.; de Carvalho, A.C.; Zanotto, E.D. Predicting glass transition temperatures using neural networks. Acta Mater. 2018, 159, 249–256. [Google Scholar] [CrossRef]
  17. Duan, K.; He, Y.; Li, Y.; Liu, J.; Zhang, J.; Hu, Y.; Lin, R.; Wang, X.; Deng, W.; Li, L. Machine-learning assisted coarse-grained model for epoxies over wide ranges of temperatures and cross-linking degrees. Mater. Des. 2019, 183, 108130. [Google Scholar] [CrossRef]
  18. Konstantopoulos, G.; Koumoulos, E.P.; Charitidis, C.A. Classification of mechanism of reinforcement in the fiber-matrix interface: Application of Machine Learning on nanoindentation data. Mater. Des. 2020, 192, 108705. [Google Scholar] [CrossRef]
  19. Diao, Y.; Yan, L.; Gao, K. Improvement of the machine learning-based corrosion rate prediction model through the optimization of input features. Mater. Des. 2021, 198, 109326. [Google Scholar] [CrossRef]
  20. Wang, C.; Fu, H.; Jiang, L.; Xue, D.; Xie, J. A property-oriented design strategy for high performance copper alloys via machine learning. NPJ Comput. Mater. 2019, 5, 87. [Google Scholar] [CrossRef]
  21. Naser, M. AI-based cognitive framework for evaluating response of concrete structures in extreme conditions. Eng. Appl. Artif. Intell. 2019, 81, 437–449. [Google Scholar] [CrossRef]
  22. Pei, Z.; Yin, J. Machine learning as a contributor to physics: Understanding Mg alloys. Mater. Des. 2019, 172, 107759. [Google Scholar] [CrossRef]
  23. Ghanbari, S.S.; Mahmoudi, A. An improvement in data interpretation to estimate residual stresses and mechanical properties using instrumented indentation: A comparison between machine learning and Kriging model. Eng. Appl. Artif. Intell. 2022, 114, 105186. [Google Scholar] [CrossRef]
  24. Bleiziffer, P.; Hofmann, J.; Zboray, R.; Wiege, T.; Herger, R. Predicting the fiber orientation in glass fiber reinforced polymers using the moment of inertia and convolutional neural networks. Eng. Appl. Artif. Intell. 2021, 104, 104351. [Google Scholar] [CrossRef]
  25. Takemoto, S.; Nagata, K.; Kaneshita, T.; Okuno, Y.; Okuno, K.; Kitano, M.; Inoue, J.; Enoki, M. Prediction of the Mechanical Properties of Aluminum Alloy Using Bayesian Learning for Neural Networks. In TMS 2021 150th Annual Meeting & Exhibition Supplemental Proceedings; The Minerals, Metals & Materials Series; Springer International Publishing: Cham, Switzerland; pp. 473–480.
  26. Zou, Q.; Chen, L.; Xiong, N.; Zou, S.; Wang, C. Prediction and Key Computer Programming of Mechanical Properties of Hot Rolled Plate Based on BP Neural Network. In Proceedings of the 2009 International Conference on Computational Science and Engineering, Vancouver, BC, Canada, 29–31 August 2009; pp. 967–971. [Google Scholar]
  27. Cheng, C.K.; Tsai, J.T.; Lee, T.T.; Chou, J.H.; Hwang, K.S. Modeling and optimizing tensile strength and yield point on steel bar by artificial neural network with evolutionary algorithm. In Proceedings of the 2015 IEEE International Conference on Automation Science and Engineering (CASE), Gothenburg, Sweden, 24–28 August 2015; pp. 1562–1563. [Google Scholar]
  28. He, H.-T.; Liu, H.-M. The research on integrated neural networks in rolling load prediction system for temper mill. In Proceedings of the 2005 International Conference on Machine Learning and Cybernetics, Guangzhou, China, 18–21 August 2005; Volume 7, pp. 4089–4093. [Google Scholar]
  29. Osório, W.; Santos, C.; Quaresma, J.; Garcia, A. Mechanical properties as a function of thermal parameters and microstructure of Zn–Al castings. J. Mater. Process. Technol. 2003, 143–144, 703–709. [Google Scholar] [CrossRef]
  30. Donelan, P. Modelling microstructural and mechanical properties of ferritic ductile cast iron. Mater. Sci. Technol. 2000, 16, 261–269. [Google Scholar] [CrossRef]
  31. Li, Z.; Zhu, B.; Dai, Y.; Zhu, W.; Wang, Q.; Wang, B. Thermal error modeling of motorized spindle based on Elman neural network optimized by sparrow search algorithm. Int. J. Adv. Manuf. Technol. 2022, 121, 349–366. [Google Scholar] [CrossRef]
  32. Bayrami, B. Estimation of Splitting Tensile Strength of Modified Recycled Aggregate Concrete Using Hybrid Algorithms. SSRN J. 2021, 3992623. [Google Scholar] [CrossRef]
  33. Song, Z.; Zhao, Y.; Liu, G.; Gao, Y.; Zhang, X.; Cao, C.; Dai, D.; Deng, Y. Surface roughness prediction and process parameter optimization of Ti-6Al-4 V by magnetic abrasive finishing. Int. J. Adv. Manuf. Technol. 2022, 122, 219–233. [Google Scholar] [CrossRef]
  34. Shen, L.; Tian, L. A static load position identification method for optical fiber-composite structures based on particle swarm optimization- back Propagation neural network algorithm. Meas. Control 2022, 56, 820–831. [Google Scholar] [CrossRef]
  35. Zhou, Z.; Gong, H.; You, J.; Liu, S.; He, J. Research on compression deformation behavior of aging AA6082 aluminum alloy based on strain compensation constitutive equation and PSO-BP network model. Mater. Today Commun. 2021, 28, 102507. [Google Scholar] [CrossRef]
  36. Wang, X.; Dong, X.; Zhang, Z.; Zhang, J.; Ma, G.; Yang, X. Compaction quality evaluation of subgrade based on soil characteristics assessment using machine learning. Transp. Geotech. 2022, 32, 100703. [Google Scholar] [CrossRef]
  37. Guo, Y.; Yang, D.; Zhang, Y.; Wang, L.; Wang, K. Online estimation of SOH for lithium-ion battery based on SSA-Elman neural network. Prot. Control Mod. Power Syst. 2022, 7, 40. [Google Scholar] [CrossRef]
  38. Vapnik, V.; Golowich, S.E.; Smola, A. Support vector method for function approximation, regression estimation and signal processing. In Proceedings of the 9th International Conference on Neural Information Processing Systems (NIPS’96), Denver, CO, USA, 3–5 December 1996; MIT Press: Cambridge, MA, USA, 1996; pp. 281–287. [Google Scholar]
  39. Kanumuri, L.; Srishuka, M.; Gupta, A.K.; Singh, S.K. Application of Support Vector Regression on Mechanical Properties of Austenitic Stainless Steel 304 at Elevated Temperatures. Mater. Today Proc. 2015, 2, 1479–1486. [Google Scholar] [CrossRef]
  40. Zhang, C.; Ding, S.; Sun, Y.; Zhang, Z. An optimized support vector regression for prediction of bearing degradation. Appl. Soft Comput. 2021, 113, 108008. [Google Scholar] [CrossRef]
  41. Cheng, W.D.; Cai, C.Z.; Luo, Y.; Li, Y.H.; Zhao, C.J. Mechanical properties prediction for carbon nanotubes/epoxy composites by using support vector regression. Mod. Phys. Lett. B 2015, 29, 1550016. [Google Scholar] [CrossRef]
  42. Li, S.; Chen, H.; Wang, M.; Heidari, A.A.; Mirjalili, S. Slime mould algorithm: A new method for stochastic optimization. Future Gener. Comput. Syst. 2020, 111, 300–323. [Google Scholar] [CrossRef]
  43. National Institute for Materials Science (NIMS), NIMS Materials Database (MatNavi). Available online: https://cds.nims.go.jp/ (accessed on 8 October 2023).
Figure 1. The modeling process of SMA-SVR hybrid model. The dashed-line enclosed process represents the procedure where SMA simultaneously optimizes the two hyperparameters of SVR.
Mathematics 12 01153 g001
Figure 2. Comparison of MAE and computational time of these models in the test.
Mathematics 12 01153 g002
Figure 3. The comparison charts of the true values and the predicted values.
Mathematics 12 01153 g003
Figure 4. The box plot of R2 for the hybrid models.
Mathematics 12 01153 g004
Figure 5. The regression plot of the SMA-SVR model.
Mathematics 12 01153 g005
Figure 6. The regression plot of the GWO-SVR model.
Mathematics 12 01153 g006
Figure 7. The regression plot of the PSO-BP model.
Mathematics 12 01153 g007
Figure 8. The regression plot of the SSA-Elman model.
Mathematics 12 01153 g008
Figure 9. Comparative analysis of MAE and RMSE of the models in the 0.2% proof stress prediction test.
Mathematics 12 01153 g009
Figure 10. The histogram of the prediction errors of SMA-SVR.
Mathematics 12 01153 g010
Figure 11. The histogram of the prediction errors of GWO-SVR.
Mathematics 12 01153 g011
Figure 12. The histogram of the prediction errors of PSO-BP.
Mathematics 12 01153 g012
Figure 13. The histogram of the prediction errors of SSA-Elman.
Mathematics 12 01153 g013
Figure 14. The design drawing of the test pieces.
Mathematics 12 01153 g014
Figure 15. The photographs of the test site.
Mathematics 12 01153 g015
Figure 16. The box plot of MAE for the hybrid models.
Mathematics 12 01153 g016
Figure 17. The dual-axis graph featuring RMSE, MAE, and R-squared metrics for analysis of the models’ performance.
Mathematics 12 01153 g017
Table 1. Detailed description of the hybrid models.
Hybrid ModelsDescription
SMA-SVRThe combination of the penalty factor and kernel parameter is the objective to be optimized. The boundary of the penalty factor is [0.01, 50]. The Kernel parameter is bounded by [0.1, 100].
GWO-SVRThe position of Alpha Grey Wolf represents the combination of the penalty factor and kernel parameter. And the boundary of the penalty factor is [0.01, 50]. The Kernel parameter is also bounded by [0.1, 100].
PSO-BPThe weight and threshold of BP are optimized by PSO. The parameters of BP are the number of neurons in a hidden layer = 5, target error = 1 × 10⁻⁴, and learning rate = 0.01. The parameters of PSO are as follows: c1 = 1.5, c2 = 1.5, and w = 0.8.
SSA-ElmanThe weight and threshold of Elman are optimized by SSA. The parameters of Elman include the number of neurons in a hidden layer = 5, epochs = 1000, learning rate = 0.01, minimum performance gradient = 1 × 10⁻⁶, and maximum number of failures = 6. The parameters of SSA include an Alarm value = 0.6, a proportion of discoverers = 0.7, and a proportion of scouts = 0.2.
Table 2. The characteristics and description of the dataset.
CharacteristicsDescription
ElementsThe element type and content of each low-alloy steel, including C, Si, N, S, P, Al, V, Cr, Cu, Ni, Mo, Mn
TemperatureTemperature for mechanical property test of each low-alloy steel
Mechanical propertiesTensile strength and 0.2% proof stress
Table 3. The experimental results of tensile strength prediction.
Hybrid ModelsIndicatorsMAERMSER2CT (s)
SMA-SVRMEAN15.936124.74820.960252.4216
STD1.06212.94540.01087.1783
GWO-SVRMEAN31.990253.63770.8154129.5067
STD5.487910.18180.069729.3234
PSO-BPMEAN27.619536.77150.915679.8108
STD2.79863.00940.01460.7885
SSA-ElmanMEAN26.175737.05770.9129283.7778
STD1.78192.87560.018537.4507
Table 4. Ranking of the hybrid models designed for prediction.
IndicatorsSMA-SVRGWO-SVRPSO-BPSSA-Elman
MAE1322
RMSE1322
R21322
CT1324
Total412810
Table 5. The experimental results of 0.2% proof stress prediction.
Hybrid ModelsIndicatorsMAERMSER2CT (s)
SMA-SVRMEAN15.757726.03410.959948.3597
STD1.11675.58740.01556.4954
GWO-SVRMEAN33.646255.59730.8365148.8186
STD2.70553.47920.014327.2309
PSO-BPMEAN24.586336.20340.923280.1724
STD1.50384.23240.01763.4577
SSA-ElmanMEAN25.885036.14940.9229254.7069
STD3.97745.16970.029815.3139
Table 6. The results of S-W tests of the prediction errors.
Hybrid ModelsSample SizeMedianMEANSTDSkewnessKurtosisS-W Tests
SMA-SVR2740.269−1.29720.263−0.6483.4200.945 (0.000)
GWO-SVR2741.1418.83149.2291.7015.3790.839 (0.000)
PSO-BP274−0.508−0.48828.6520.2981.2710.985 (0.006)
SSA-Elman274−3.420−1.48030.5710.5003.3480.965 (0.000)
Table 7. The grades, characteristics and uses of the selected low-alloy steel.
CategoryGrade of Low-Alloy SteelCharacteristics and Uses of Materials
110CrMoAl, 16MnCu, 10Cr4AlSeawater corrosion-resistant low-alloy steel, good corrosion resistance, and pitting resistance, widely used in oil tanks, bridges, oil derricks, etc.
2Q500D, Q460C, Q420E, Q390B, Q345DLow-alloy, high-strength structural steel with high strength, is used for large engineering structures, large ships, bridges, power plant equipment, high-pressure boilers, etc.
3Q550NH, Q415NH, Q235NHWelded weathering steel for structures such as vehicles, bridges, containers, buildings, etc.
4L360, L320, L245, L290, L485, L450, L415, L390Wide and thick steel plates for oil and gas transmission pipelines
5Q460CF-DLow-weld crack sensitivity high-strength steel plate is mainly used for the production of hydroelectric power station pressure steel pipes and railroad vehicles with high requirements for weldability
6AH420Ultra-high-strength grade steel is used in the manufacture of aircraft beams, engine shafts, high-strength bolts, solid rocket motor cases, high-pressure vessels, etc.
7Q550qD, Q460qE, Q420qE, Q345qD, Q235qDStructural steel for bridges
816MnDR, 15MnNiDRLow-alloy steel plates for low-temperature pressure vessels are widely used in petroleum, chemical, power stations, boilers, and other industries
9HP345, HP295Steel plates and strips for welded gas cylinders are mainly used for manufacturing liquid chlorine, liquid ammonia, and other types of low-pressure steel-welded gas cylinders
Table 8. The elemental compositions of the low-alloy steel types.
Alloy CodeCSiMnPSNiCrMoCuVAlN
Q550NH0.1600.6502.0000.0250.0300.3750.775/0.375///
Q500D0.1800.6001.8000.0300.0250.8000.6000.2000.5500.1200.0150.015
L4850.1000.4001.8000.0200.010///////
Q550qD0.1800.5501.3500.0250.0151.0000.8000.4000.5500.0800.0150.012
L4500.1200.4001.6500.0200.010///////
L4150.1200.4001.6500.0200.010///////
Q460C0.2000.5001.8000.0300.0300.8000.3000.2000.5500.2000.0150.015
Q460CF-D0.0900.5001.8000.0200.010///////
L3900.1200.4001.6500.0200.015///////
L3600.2000.3501.4000.0200.015///////
AH4200.2100.5501.7000.3000.030//////0.020
Q415NH0.1200.6501.1000.0250.0300.3850.775/0.375///
Q420E0.2000.5001.7000.0250.0200.8000.3000.2000.3000.2000.0150.015
L3200.2000.3501.4000.0250.015///////
10CrMoAl0.1000.3500.5000.0450.045/1.0000.600//0.600/
L2450.2000.3501.3000.0250.015///////
L2900.2000.3501.3000.0250.015///////
Q390B0.2000.5001.7000.0350.0350.5000.3000.1000.3000.200/0.015
Q460qE0.1800.5501.4000.0200.0100.7000.8000.3500.5500.0800.0150.012
HP3450.2000.3501.5000.0250.015/////0.020/
16MnDR0.2000.3251.4000.0200.010/////0.020/
15MnNiDR0.1800.3251.4000.0200.0010.400///0.0600.020/
Q345D0.1800.5001.7000.0300.0250.5000.3000.1000.3000.1500.0150.012
Q420qE0.1800.5501.3500.0200.0100.7000.8000.3500.5500.0800.0150.012
16MnCu0.1600.4001.4000.0500.050///0.300///
HP2950.1800.1001.0000.0250.015/////0.020/
Q345qD0.1800.5501.3000.0250.0200.5000.8000.2000.5500.0800.0150.012
10Cr4Al0.1300.0500.050/0.025/4.100///0.900/
Q235NH0.1300.2500.4000.0300.0300.6500.600/0.400///
Q235qD0.1700.3501.4000.0250.0250.3000.300/0.300/0.0150.012
Table 9. The test results and evaluation indicators of tensile strength prediction.
Hybrid ModelsIndicatorsMEANSTDMedian
SMA-SVRMAE23.9016 7.5074 23.8317
MSE987.2799 603.6388 962.3523
RMSE30.1312 9.1417 31.0218
R20.8563 0.0511 0.8525
Time (s)7.9878 0.6714 7.7287
GWO-SVRMAE43.3931 15.0256 41.6687
MSE4077.4096 2698.6676 3357.6671
RMSE60.4693 21.0482 57.9448
R20.4389 0.2425 0.3924
Time (s)8.5734 1.5607 8.5828
PSO-BPMAE57.2008 18.0336 57.3019
MSE6153.8801 3859.8489 4744.1278
RMSE74.2614 25.9377 68.8694
R2−0.0255 0.5288 0.0399
Time (s)109.7039 10.0224 102.8430
SSA-ElmanMAE62.0889 17.7758 57.3609
MSE7179.0305 6843.9529 4948.5308
RMSE79.6986 29.5075 70.3273
R20.2047 0.1992 0.1065
Time (s)155.6183 7.9242 158.3449
Table 10. The test results and error measurements of 0.2% proof stress prediction.
Hybrid ModelsIndicatorsMEANSTDMedian
SMA-SVRMAE43.8716 9.8879 45.1705
MSE2804.1741 1037.3345 2724.4200
RMSE51.9970 10.2846 52.1958
R20.8003 0.0474 0.7913
Time (s)8.9335 1.0544 8.6116
GWO-SVRMAE66.8823 16.5486 60.4250
MSE7131.4586 3980.1947 5977.6832
RMSE82.0430 20.5301 77.3122
R20.4334 0.1400 0.4168
Time (s)9.1828 2.0273 8.9995
PSO-BPMAE65.9220 16.1245 63.6380
MSE6523.8342 3154.8717 5521.9045
RMSE78.7286 18.5142 74.2658
R20.0283 0.3379 −0.0410
Time (s)105.3629 7.5211 101.3413
SSA-ElmanMAE69.8350 29.9387 61.8377
MSE9342.1954 13,999.0466 5335.6513
RMSE85.5847 46.0829 73.0385
R20.2323 0.2137 0.1536
Time (s)167.4383 14.8824 163.9477
Disclaimer/Publisher’s Note: The statements, opinions and data contained in all publications are solely those of the individual author(s) and contributor(s) and not of MDPI and/or the editor(s). MDPI and/or the editor(s) disclaim responsibility for any injury to people or property resulting from any ideas, methods, instructions or products referred to in the content.

