1. Introduction
Network alignment, also known as graph alignment, is a technique used to identify and match nodes that represent the same entity or role in different networks [
1]. This technique has various applications in multiple domains. For instance, in social network analysis, network alignment can identify the accounts of the same user on different platforms and enable friend recommendation [
2]. In bioinformatics, identifying and comparing similar biological functions among different species can promote the transfer of functional knowledge across species [
3]. Aligning the gene co-expression network of patients provides a scientific basis for precise treatment [
4]. Furthermore, network alignment can facilitate the construction and integration of knowledge graphs by combining knowledge from different sources to enhance the completeness of knowledge graphs [
5,
6].
Most traditional network alignment algorithms rely on heuristic methods or optimization strategies and perform well on small to medium-sized networks [
1,
7]. However, as networks become larger and more structurally complex, these conventional methods face significant challenges in terms of computational efficiency and scalability. To overcome these challenges, embedding-based network alignment techniques have attracted much attention from the academic community in recent years. These techniques can effectively handle more complex network structures and large datasets. Their main advantage is that they map network nodes into a low-dimensional vector space, and these representations (node embeddings) aim to preserve the topological structure and node attributes of the network [
8]. Through this mapping, nodes representing the same entity can have similar representations even in different networks, thus simplifying the task of node correspondence identification. Embedding-based network alignment methods are mainly divided into two categories: one is to learn the vector representations of nodes by random walk or by directly exploiting the network structure, such as REGAL [
9], NAWAL [
10], PALE [
11], and so on. These methods typically adopt a shallow neural network model and optimize the loss function to ensure that the nodes with similar structures in the network also maintain consistency in the vector representation. The other type of method captures the high-level structure and semantic information of the network more deeply through a Graph Neural Network (GNN), such as GAlign [
12], WAlign [
13], and CCNE [
14]. These models use a multi-layer neural network structure, where each layer can effectively aggregate information from neighboring nodes to learn more robust node embeddings. This not only improves the accuracy of the alignment, but also increases the adaptability of the model to the complexity of the network structure.
Although network embedding technology has remarkable advantages in feature extraction and representation, which have greatly advanced research in network alignment, this field still faces several limitations. First, the sensitivity of network alignment methods to structural noise is a critical issue. Since the node representation is highly dependent on the network topology, noise or abnormal connections in the network may be erroneously incorporated during the model learning process and amplify these effects, which in turn negatively affects the accuracy of the alignment results. Second, some models may require known node correspondences (anchor nodes) to aid the learning process during the training phase. However, in real-world applications, it is often difficult to collect a large number of anchor nodes, and this reliance on prior knowledge can limit the applicability of the model.
The concept of Matched Neighborhood Consistency (MNC) [
7,
15] has gained attention as a key principle in enhancing network alignment. MNC focuses on the similarity between the neighborhoods of nodes in different networks, positing that nodes with similar local structures are more likely to represent the same entity. This approach aims to improve network alignment by considering the similarity of local structures rather than global network properties. Although MNC has potential, its application in unsupervised network alignment remains an open research question. Most existing methods do not fully exploit the power of MNC to enhance alignment accuracy, particularly in the absence of anchor nodes.
This paper proposes an unsupervised network alignment method called MANNA (MAtched Neighbor consistency for Network Alignment) to address the above challenges. Our approach employs a GNN model to capture network structure and attributes, and trains the GNN in an unsupervised manner. To ensure consistency in node embeddings between the source and target networks, we use a weight-sharing mechanism during training. Furthermore, to improve the model’s robustness to noise, a random perturbation strategy is implemented. The GNN produces multi-order node embeddings from different layers, which can capture the nodes’ multi-scale features. These multi-order node embeddings are used to construct the alignment matrix. High-quality pseudo-anchor nodes are identified based on MNC using the alignment matrix. These anchor nodes are used to refine the GNN model and optimize the network representation. In the final step, we refine the alignment matrix through a fine-tuning process, which reinforces the consistency of the neighborhood structures between corresponding nodes and improves alignment accuracy.
The main contributions of our study are as follows:
- (1)
We propose an unsupervised network alignment method that significantly reduces the model’s sensitivity to network noise by introducing a random perturbation strategy. In addition, we use a self-supervised learning approach to optimize network representations, thereby mitigating the excessive dependence on anchor nodes in existing methods;
- (2)
Following the MNC principle, we adopt two optimization strategies. First, we carefully select high-confidence pseudo-anchor nodes by analyzing the neighborhood similarity of cross-network node matches, which are used in subsequent self-supervised learning processes. Second, we apply an iterative update method to refine the alignment matrix, increasing the similarity between nodes with similar neighborhood structures across the two networks, thereby further improving the accuracy of network alignment;
- (3)
We performed experimental evaluations on three publicly available datasets. The results show that the proposed method is clearly superior to the most advanced comparison method, and its validity is effectively verified;
The remainder of this manuscript is structured as follows:
Section 2 introduces several current embedding-based network alignment methods;
Section 3 discusses the MANNA in more detail; in
Section 4, experiments are performed to prove the effectiveness of the MANNA; finally, the research content of the manuscript is summarized.
2. Related Work
Embedding-based network alignment methods typically consist of the following steps:
Network Embedding: Network embedding is the process of mapping each node in the network to a low-dimensional vector space using a network-embedding algorithm such as Node2Vec [
16] or LINE [
17], or a graph neural network such as GCN [
18] or GAT [
19]. The objective of this process is to capture the structural information of the nodes. If the network contains node attribute information, these attributes are also considered during the embedding process to generate richer node embeddings.
Embedding Space Construction: After the embedding process, each node in the network is assigned a vector representation. Nodes with similar embeddings are positioned closer to each other in this embedding space. However, direct node matching can lead to incorrect matches if the embedding spaces of different networks are learned independently. This is because the embedding spaces of different networks may have different distributions, which can cause the positions of similar nodes in the embedding space to not align. In this case, it is necessary to align the embedding spaces to ensure that matching nodes from different networks maintain similar feature representations in the final embedding space.
Node Matching: In the embedding space, the similarity between nodes can be evaluated by calculating the similarity between node embedding vectors (e.g., cosine similarity). This allows for the identification of corresponding node pairs in two networks. This process typically involves finding the most similar pair of nodes in the embedding space or employing more sophisticated matching strategies.
Some works use anchor nodes to align embedding spaces. PALE [
11] proposes a two-stage framework that consists of embedding and matching. In the embedding phase, PALE maps the networks to a low-dimensional space. In the matching phase, PALE ensures that anchor nodes remain close in the embedding space by learning a mapping function. To optimize the mapping process, PALE employs a loss function based on anchor nodes to minimize the difference in node embeddings before and after mapping. PALE provides two options for mapping functions: linear mapping and multi-layer perceptron (MLP). RAN [
20] is similar to PALE as it also uses anchor nodes to reconcile the embedding spaces of the source and target networks. To enhance node representation, RAN generates a two-layer network consisting of a structure layer and an attribute layer. Biased random walk and language modelling techniques are then used to learn the node embedding. In contrast, CCNE [
14] uses a collaborative optimization strategy instead of relying on complex mapping functions. CCNE employs two separate encoders to obtain node embeddings and reconstruct the original networks using a shared decoder. The objective function comprises intra-network and inter-network losses. Technical term abbreviations are explained when first used. The intra-network loss aims to minimize the reconstruction error to preserve the internal structure of the network. Simultaneously, the inter-network loss aims to minimize the distance between anchor nodes to preserve the inter-network structure. The encoder and decoder parameters are updated through back-propagation during training. The two losses work together to gradually bring the embedding space closer. Additionally, CCNE employs a hard negative sampling strategy to maintain distance between anchor nodes and non-anchor nodes (hard negative samples) in the latent space.
Obtaining anchor nodes in the real world can be difficult, making it challenging to align the embedding space under unsupervised conditions. NAWAL [
10] uses Generative Adversarial Networks (GAN) [
21] to learn the correspondence between networks adaptively. After embedding learning, NAWAL employs GAN to initialize the mapping function, aligning the embedding space of the source network with that of the target network. The aligner generates mappings to match nodes, while the discriminator distinguishes real from generated embeddings. NAWAL selects the most similar pair of nodes as the initial anchor and iteratively optimizes the mapping function, minimizing the embedding difference using the Procrustes solution until the optimal mapping is found. Similarly, WAlign [
13] optimizes node correspondences through self-supervised learning without anchors. This transforms the graph alignment problem into minimizing the Wasserstein distance in the embedding space. The Wasserstein distance discriminator is a neural network that optimizes embeddings through an adversarial training framework. Its goal is to maximize the similarity of pairs of similar nodes by generating pseudo-anchors. These pseudo-anchors are defined automatically based on the Wasserstein distance principle and updated iteratively to reflect the best node correspondences. REGAL [
9] uses implicit matrix factorization to learn node embeddings without relying directly on the network adjacency structure. It generates identity information for each node by constructing a similarity matrix that combines structure and attribute information. The embedding representation is learned by computing its similarity with randomly selected landmark nodes. This approach provides a network alignment solution without explicit anchors.
Parameter sharing is a crucial technique in neural networks that enables the model to reuse the same weights for different inputs, rather than learning a new set of weights for each input. This strategy is especially significant in network alignment, as it guarantees that corresponding nodes in the source and target networks can share a consistent embedding representation. By utilizing parameter sharing, GAlign [
12] is able to effectively map the nodes of both the source and target networks into a shared embedding space without the need for labeled data. To achieve this, GAlign employs the multi-order characteristics of the Graph Convolutional Network (GCN) [
18] to capture node information across different neighborhood structures at varying levels of embedding. This method of multi-order embedding enables the model to comprehend the global network structure while retaining the local structure information, resulting in a more profound comprehension of network alignment. GAlign enhances the resilience of alignment outcomes by simulating noise and inconsistency in actual networks through data augmentation and noise adaptation loss functions. GATAL [
22] also utilizes the parameter-sharing strategy. Unlike GAlign, GATAL adopts the multi-layer architecture of the Graph Attention Network (GAT) [
19]. GAT assigns different weights to each node through the attention mechanism, enabling GATAL to capture the complex relationships between nodes more effectively.
Inferring node correspondences solely based on network structure and attribute information is a challenging task when explicit anchor links are absent. To enhance alignment accuracy, researchers have investigated various strategies. For instance, Grad-Align [
23] utilizes GNN to acquire low-dimensional representations of nodes, capturing both structural and attribute information from the networks. The approach adopts a gradual alignment strategy to iteratively identify and match node pairs across networks, leveraging information from previously aligned nodes to guide subsequent matches. In addition, Grad-Align utilizes the Tversky similarity measure to align networks with different scales, thereby improving the accuracy of the alignment process. Grad-Align+ [
24] also introduces node feature enhancement technology to enrich the node feature representation by calculating the centrality of nodes. SANA [
25], on the other hand, continuously optimizes the similarity matrix by using the topological structure similarity of the source and target networks through an iterative refinement process to improve the alignment quality. Other methods, such as NAME [
26], capture the first-order proximity, high-order proximity and global network structure information of nodes by constructing shallow, deep and community-based embedding, and fuse these embeddings to improve alignment accuracy. By defining high-order topological consistency based on edge orbits, HTC [
27] not only considers direct neighbors, but also pays attention to the structural role of nodes in the network, and integrates this consistency into the information aggregation process of GCN to identify and align corresponding nodes more accurately. MINING [
28] adopts the multi-granularity alignment framework and contrastive learning strategy, decomposes the large network into sub-networks of different granularities, and combines the graph SAGE encoder to learn discriminative node features to achieve more accurate alignment at both coarse and fine granularities. Together, these methods have advanced the state of the art in network alignment techniques, enabling models to learn important information from unlabeled data to aid alignment.
Although GNN has made remarkable progress in the field of network alignment, it still faces some challenges, including sensitivity to noise and dependence on anchor nodes. To overcome these problems, this paper proposes an unsupervised network alignment method combining GNN and self-supervised learning, which aims to improve the accuracy and robustness of the alignment, especially when noisy data and anchor nodes are scarce. The core innovation of this method is the use of pseudo-anchor links for self-supervised learning. This method allows the model to learn effectively in the absence of real anchor nodes by introducing pseudo-anchor nodes in the source and target networks. As a regularization factor for model training, the pseudo-anchor nodes encourage the model to learn a better network representation and ensure that the embedding of the pseudo-anchor nodes in the source and target networks is as similar as possible.
3. Proposed Method
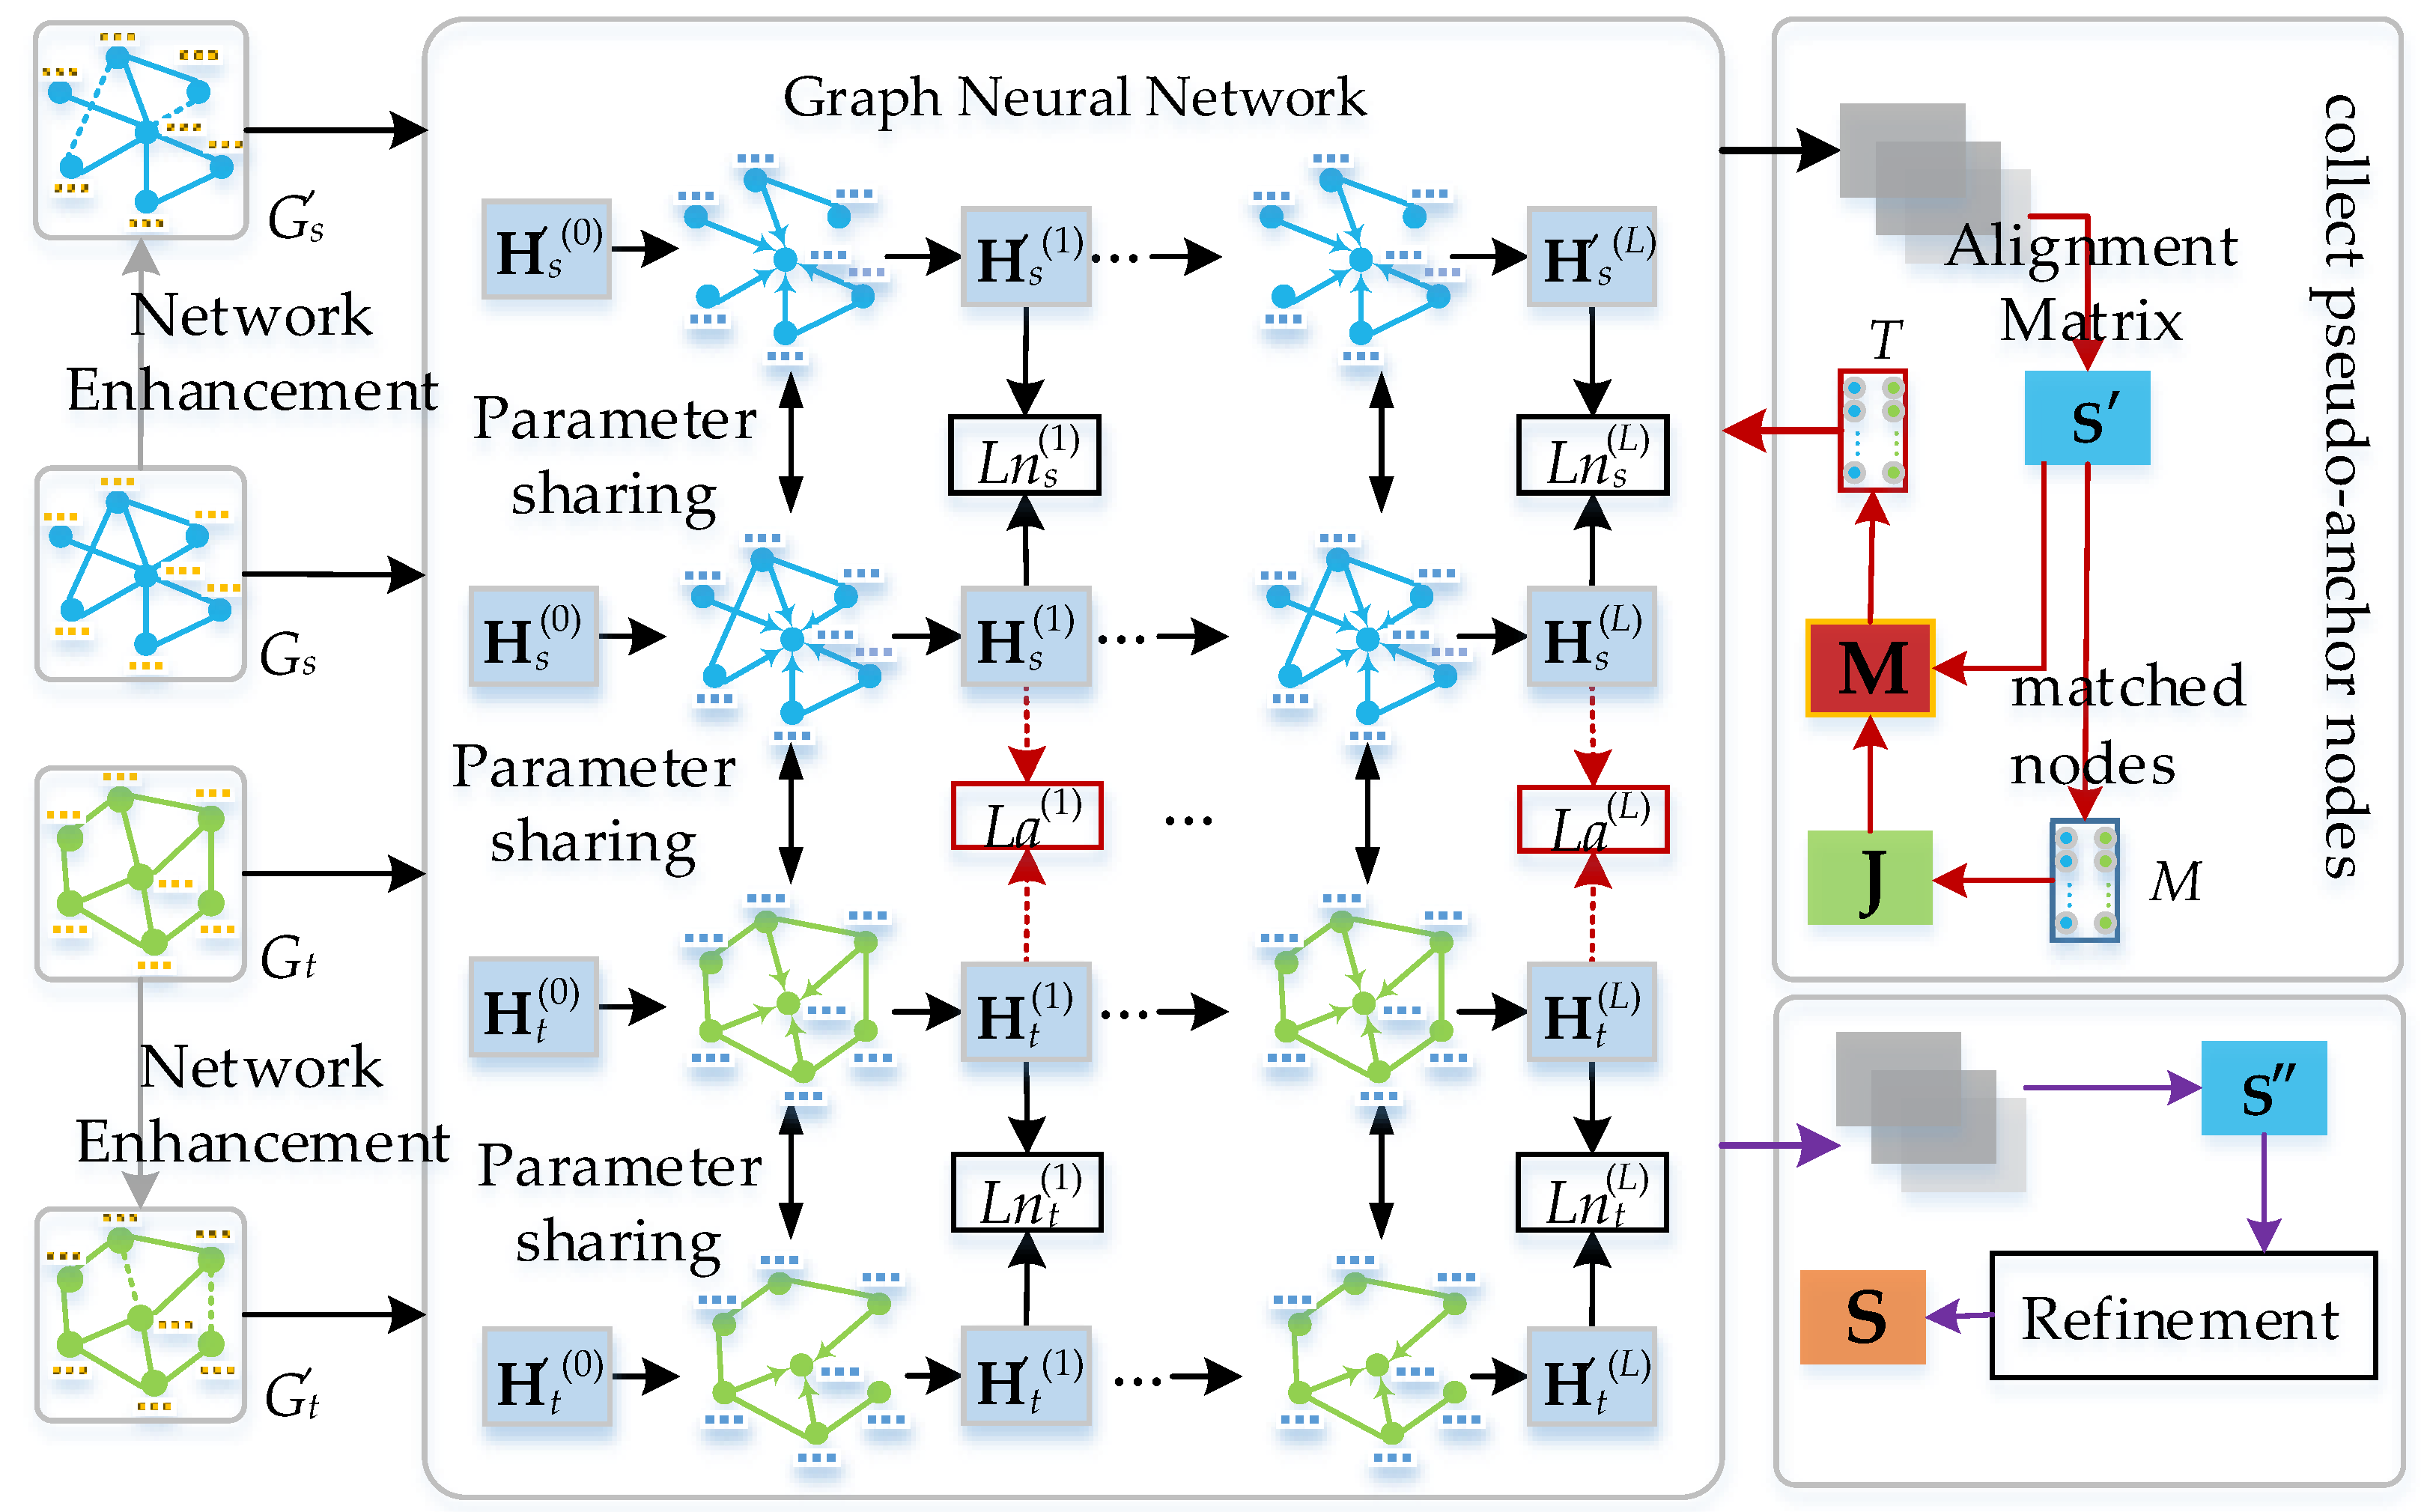
This chapter provides a detailed description of the MANNA framework, as shown in
Figure 1. The framework includes the following main sequential steps. First, a GNN is initialized to capture the structural and attribute features of the networks. To enhance the model’s robustness to noise, the algorithm introduces controlled structural and attribute perturbations during the training phase, ensuring that the learned representations are not overly sensitive to network imperfections. The GNN is used to generate multi-order node embeddings that capture the multi-scale neighborhood characteristics of each node. This provides a comprehensive representation of space for the alignment process. The algorithm applies the MNC principle to identify pseudo-anchor nodes from the similarity matrices derived. These pseudo-anchor nodes act as self-supervised guidance, enabling the model to learn more accurate network representations. The algorithm improves the alignment matrix by iteratively applying the MNC strategy. This strategy adjusts the similarity scores between pairs of nodes to strengthen the consistency of the neighborhood structures between aligned nodes. The iterative process is governed by a termination condition to optimize the alignment quality without over-fitting to noise.
3.1. Notation and Problem Definition
Consider two networks, and , where is the source network and is the target network. To simplify the presentation, we use an asterisk (*) as a wildcard to represent either the source or the target network, without specifying which one. Let and denote the sets of nodes and edges, respectively, within the network. The attribute matrix provides the initial feature for each node, where is the dimension of the feature. In this paper, we assume that both networks are undirected and unweighted, and we use the adjacency matrix to represent the connectivity relationships between nodes. In the adjacency matrix, the element describes the relationship between nodes and . Specifically, if there is a direct edge between nodes and , then ; otherwise, . We denote by the set of first-order neighbors of node in the adjacency matrix of the network.
The objective of network alignment is to obtain a mapping matrix (alignment matrix) , where the element represents the similarity between node in the source network and node in the target network. The values of typically satisfy the following criteria:
Non-negativity: , since similarity scores are inherently non-negative.
Normalization: For each row , the sum of all elements equals 1, i.e., , indicating that each node in the source network is aligned with, at most, one node in the target network.
Matched Neighborhood Consistency (MNC) [
7,
15,
25] is a key concept in network alignment that measures the similarity between the sets of neighbors of two nodes that correspond to the same entity in different networks. This similarity can be quantified by calculating the similarity of the neighbors of the nodes.
In this paper, we use the node neighborhood similarity matrix
to measure the similarity between pairs of nodes in two networks. Here,
denotes the neighborhood similarity between node
in
and node
in
. Given a set of node mappings
, the formula for computing
is as follows:
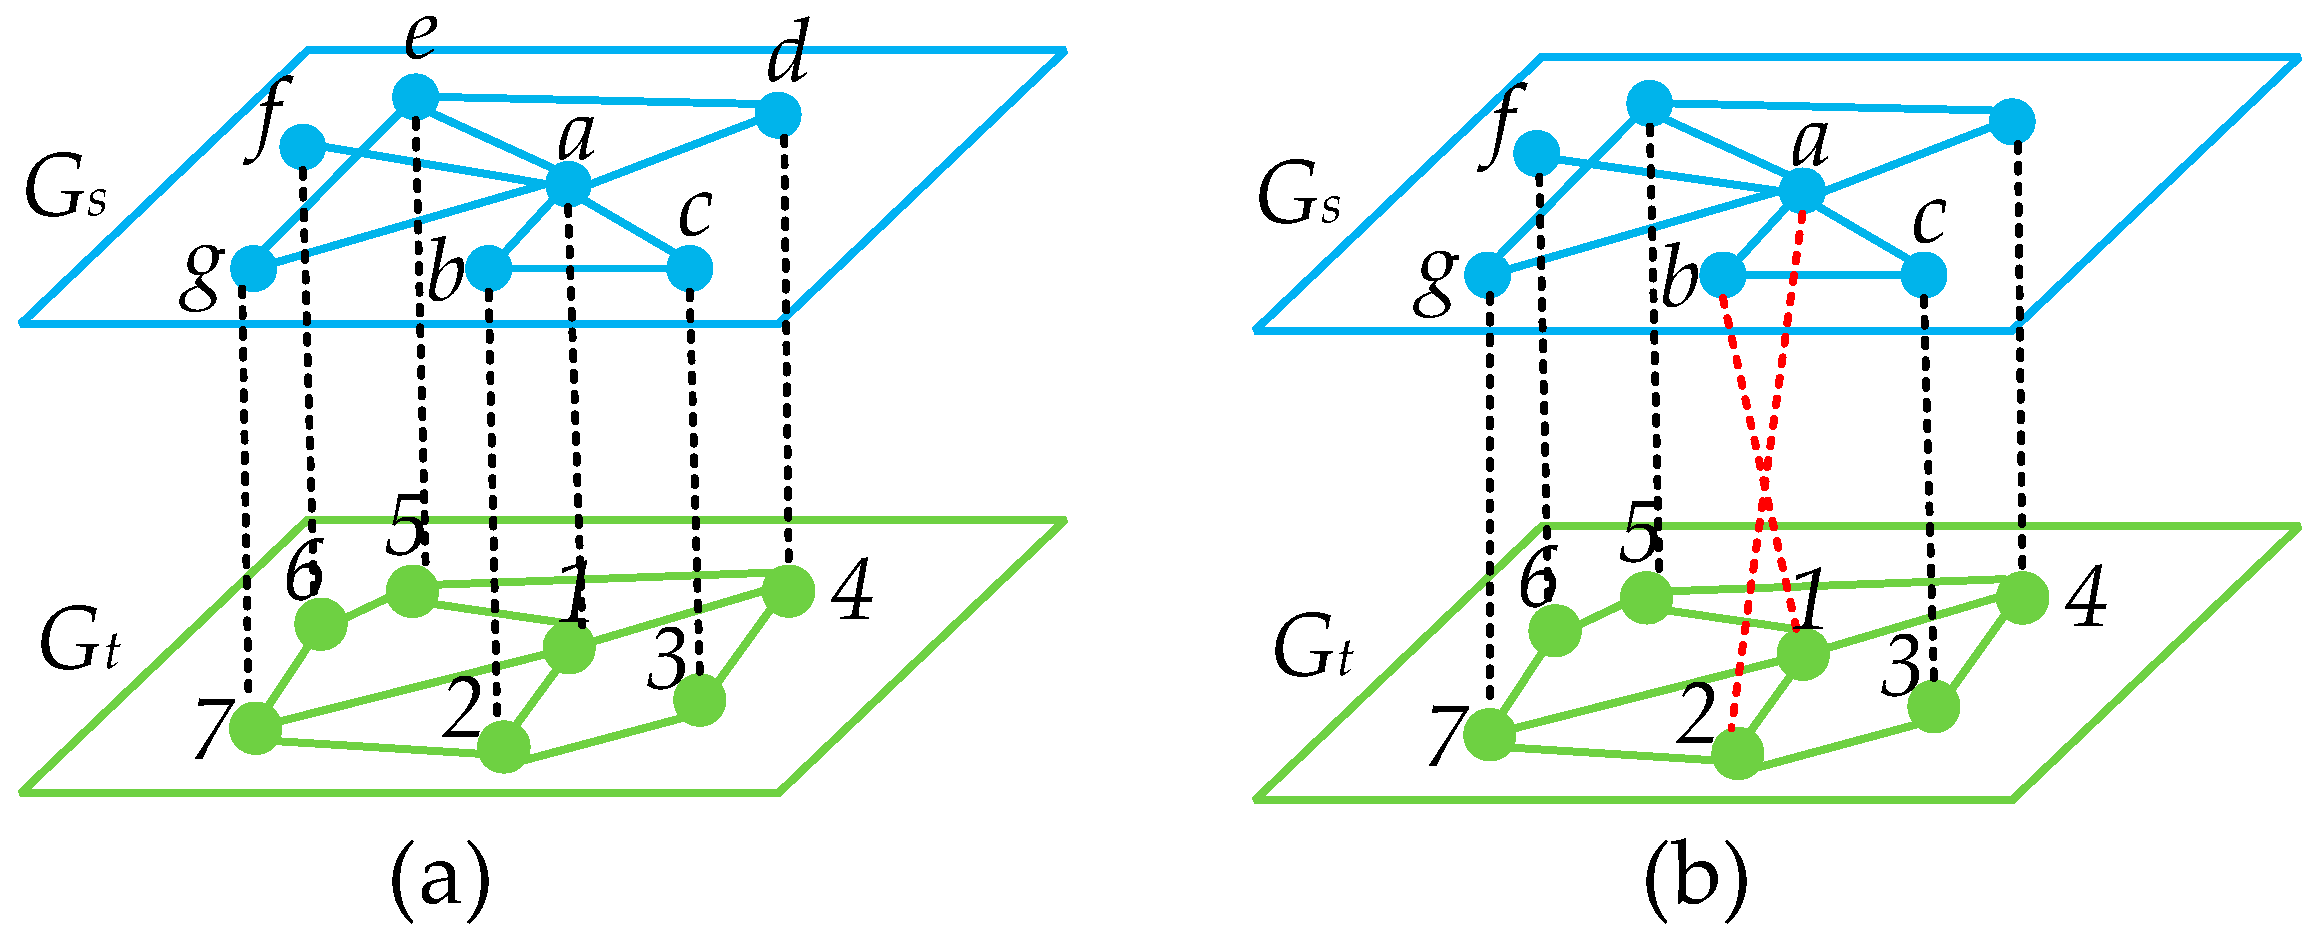
Figure 2 displays two distinct node mappings. For instance, we use the node pair (
a, 1) to demonstrate how MNC is employed to assess the alignment quality of the node pair. In this scenario,
of node
in the source network is
, and
of node 1 in the target network is
. In
Figure 2a,
,
of node 1 is
. Consequently, the value of
. In
Figure 2b,
, the mapped neighborhood set
for node 1 is
, and
. It is clear that a higher score indicates a more similar neighborhood structure between node
a in the source network and node 1 in the target network under different mappings, which typically indicates better alignment quality.
We can calculate the MNC score for all pairs of mappings in
M using the following formula:
where, |
M| is the number of mapping pairs. The formula calculates the average neighborhood similarity across all mapping pairs, which serves as a metric for the quality of network alignment. Higher MNC values indicate that the node pairs in the two networks are more aligned, suggesting that their neighborhood structures are more similar.
3.2. Generation Nodes Embedding Using Graph Augmentation
A Graph Neural Network (GNN) consists of multiple convolutional layers, with each layer updating the node embeddings based on the previous layer’s representations. However, as the number of layers increases, over-smoothing can occur. This phenomenon causes the node representations to lose their diversity and distinctiveness, which reduces their discriminative power and can lead to matching ambiguity. Moreover, noise in the network can be amplified by propagation and aggregation across multiple layers, affecting matching accuracy.
To mitigate the problem of over-smoothing, we obtain multi-order node embeddings by extracting outputs from the different layers of the GNN model. The multi-order embedding captures the node feature at different neighborhood scales. In our study, we use the GNN architecture proposed in [
29]. Let
L denote the depth of the GNN model. For each node
in a network, its multi-order node embeddings are denoted as
,
, …,
, where
and
is the embedding of node
at layer l. At the
k-th layer of the GNN, the feature vector
for node
is computed as follows:
where
and
is the weight matrices in the
k-th layer of the GNN that are shared between the source and target networks. Weight sharing avoids the complex process involved in traditional methods that first learn the node embeddings and then perform spatial alignment.
is the activation function. In our study, we choose theTanh function.
To increase the robustness of the model to noise, we introduce two types of noise, structural and attribute noise, into the model training process so that our model can cope better with noisy or incomplete network data. For structural noise, we simulate structural changes in the network by randomly removing a certain percentage of edges. For attribute noise, we perturb the features of the nodes by adding Gaussian noise to the attribute matrix. Specifically, we generate a Gaussian noise matrix
whose elements
follow a normal distribution with mean 0 and standard deviation 0.1. We then multiply this noise matrix by the original feature matrix
to obtain the final noisy feature matrix
:
The GNN model is trained using an unsupervised learning strategy to discover and understand the inherent structure and features of the data without relying on labelled data. The training process includes two loss functions: structural-aware loss (Ls) and noise-aware loss (Ln). The structural-aware loss ensures that the model accurately captures and preserves the topological properties of the network data. The noise aware loss function aims to enhance the model’s robustness to data noise, enabling steady learning even in its presence. These two loss functions work together to guide the model in effectively learning deep representations of network data under unsupervised conditions.
The learning process of node embedding is guided by the loss function
Ls, which measures the discrepancy between the predicted adjacency matrix, based on the node features output by different network layers, and the given multi-order adjacency matrix. The formula for calculating this function is as follows:
where
is the predicted adjacency matrix, and
is the matrix of order
k, which captures more distant neighbor information by considering
k-hop relationships between nodes, constructed from the adjacency matrix. The multi-order matrix is constructed using the following method:
where
,
, and, as
k increases,
encapsulates information over additional hops, thereby facilitating the model’s ability to capture long-range dependencies within the network. This approach allows each node to learn not only from its immediate neighbors, but also from more distant neighbors, thereby improving the model’s understanding of the structure and features of the network. The diagonal matrix
is computed from
as follows:
The noise-aware loss function aims to guide the GNN model in generating representations that are consistent with the original data-embedding vectors, even when faced with augmented data. This loss function targets embedding vectors that deviate from the original embedding vectors within a pre-set threshold and encourages the model to be insensitive to these variations. This increases the model’s robustness to noise in the input data. The model can maintain important structural information while allowing for some level of noise with the use of the noise-aware loss function. The formula for calculating this function is as follows:
where
is the
k-th order embedding of the
i-th node in either the source or target network;
is the
k-th order embedding of the
i-th node in the perturbed source or target network;
signifies the Euclidean norm, commonly referred to as the length of a vector;
is a predefined threshold; and
is an indicator function that assumes a value of 1 when its internal condition is true, and 0 otherwise.
3.3. Pseudo-Anchor Nodes Collection and Self-Supervised Learning
Anchor nodes can act as a direct supervisory signal to guide the model towards learning more accurate network representations, thereby enhancing the performance of network alignment tasks. Furthermore, anchor nodes can serve as a regularization mechanism, helping the model avoid over-fitting and improving its generalization capabilities. However, obtaining anchor nodes can be challenging in real-world applications, especially within large-scale networks. In response, researchers have introduced pseudo-anchor nodes to optimize network alignment performance. However, if the selection of pseudo-anchor nodes is biased, it may lead the model to learn incorrect mapping relationships, subsequently compromising the alignment outcome. In this work, we employ the MNC strategy to collect high-quality pseudo-anchor nodes.
Specifically, we calculate the similarity between multi-order embeddings to obtain several similarity matrices. These matrices are then combined to create a composite embedding similarity matrix (alignment matrix), denoted
, using the following formula:
After obtaining the alignment matrix
, we create an initial node mapping set
using a greedy matching algorithm [
30]. Following this, the neighborhood similarity matrix
is calculated for all node pairs using Equation (1). A fixed ratio of node pairs is then selected as pseudo-anchor nodes, based on both the neighborhood similarity matrix and the alignment matrix.
The execution process of the pseudo-anchor nodes generation is summarized in Algorithm 1.
| Algorithm 1 Collect Pseudo-Anchor Nodes |
Input: source network , target network , alignment matrix , ratio of pseudo-anchor nodes .
Output: pseudo-anchor nodes set .
Calculate the number of the pseudo-anchor nodes, . Obtain the mapping set using a greedy matching algorithm and the alignment matrix . Compute the neighborhood similarity matrix for the nodes of the two graphs. Compute the weighted similarity matrix . For each row of matrix , identify the index of the maximum value and the corresponding value. Items = [(node1, node2, similarity)|node1 ∈ Vs, node2 ∈ Vt, similarity ∈ Value] Sort the Items list in descending order based on similarity values. T = ItemsSorted[:TrainNum] Return T
|
During the second phase of model training, we utilize the pseudo-anchor node pairs within set
T to provide enhanced supervisory signals. These pseudo-anchor node pairs are instrumental in enabling the model to learn correspondences between nodes in the two networks with greater accuracy. Specifically, for each node pair (
i,
j) in
T, we employ the loss function
La to measure the discrepancy between their embedding vectors. The design principle of the loss function
La is to minimize the disparity between the embedding vectors of matched node pairs, thereby ensuring that similar nodes in the source and target graphs are assigned similar embedding representations. The calculation of the loss function
La is as follows:
3.4. Alignment and Refinement
After completing the second phase of model training, we obtain an updated alignment matrix . Following this, a refinement process is carried out to optimize the alignment matrix and improve alignment accuracy. The process involves iteratively adjusting the similarity scores between matched node pairs, thereby strengthening the consistency of the neighborhood structure among matched nodes. This strategy uses the topological information of the network to refine the matching quality between nodes iteratively.
During each iteration, the model updates the alignment matrix using the adjacency matrices of the source network and the target network. The iterative update rule is as follows:
where symbol
denotes the Hadamard product, and
is a small positive scalar. The use of
introduces randomness, which can help to reduce the risk of over-fitting in the model.
To prevent a potential decrease in alignment accuracy caused by too many iterations, the module includes a termination mechanism. The iteration is automatically stopped if the consistency score of matched neighbors starts to deteriorate during the iterative process. This ensures that the final alignment score is maximized.
The process of executing MANNA is summarized in Algorithm 2.
| Algorithm 2 MANNA |
Input: source network , target network , hyper-parameters epochs, , , , T.
Output: final alignment matrix S.
Obtain the enhanced graphs and . ModelInitialize the GNN model. for some epochs do , . Obtain structural aware loss using (6), (7) and (8). , . Obtain structural aware loss using (6), (7) and (8). Obtain noise aware loss using (12) and (13). Back-propagation and optimization of the model parameters. Calculate the similarity matrix using (14) and (15). Obtain pseudo-anchor nodes use Algorithm 1. for some epochs do , . Obtain structural aware loss using (6), (7) and (8). Obtain anchors aware loss using (16) and (17). , . Obtain structural aware loss using (6), (7) and (8). Obtain noise aware loss using (12) and (13). Back-propagation and optimization of the model parameters. Calculate the similarity matrix using (14) and (15). for iteration in 1, 2, …, T do Calculate the update similarity matrix using (18). if termination_condition(, As, At) then break . Return S
|
The time complexity of the MANNA algorithm is influenced by several components that work in tandem to provide an efficient and accurate network alignment. These components include the Network Enhancement Module, the GNN Module, the Self-Supervised Learning Module, and the Alignment Refinement Module. Below is a more detailed analysis of how each of these components contributes to the overall time complexity.
Network Enhancement Module: This component introduces controlled structural and attribute perturbations to the network to enhance the model’s robustness to noise. The complexity of generating structural noise by randomly removing edges is linear with respect to the number of edges, , where is the number of edges in the network. For attribute noise, if each node has features, the complexity of adding Gaussian noise to the feature matrix is , where is the number of nodes.
GNN Module: The GNN module is at the core of the MANNA algorithm, responsible for learning the structural and attribute features of the networks. The complexity of this module is primarily determined by the depth of the GNN ( layers) and the size of the networks. Each layer processes the nodes and their connections, leading to a time complexity of , where is the dimensionality of the node features.
Self-Supervised Learning Module: This module identifies high-quality pseudo-anchor nodes based on the MNC principle. The process involves calculating the similarity matrix and selecting pseudo-anchor nodes, which can be computationally intensive. The complexity of this module can be approximated as , where is the number of pseudo-anchor nodes selected.
Alignment Refinement Module: The alignment refinement module iteratively updates the alignment matrix to strengthen the consistency of neighborhood structures between matched nodes. Each iteration involves recalculating the alignment matrix based on the current node embeddings, with a complexity of . Over iterations, the total complexity for this module is .
4. Evaluation
4.1. Datasets
We use three openly available datasets: douban online/offline [
12,
22,
23], allmovie/imdb [
12,
22,
23], and flickr/myspace [
12,
27]. The douban dataset comprises two subsets, douban online and douban offline, obtained from Douban, a Chinese social application. These subsets were created by analyzing users’ social interactions. The application douban online reflects users’ online social networks, while douban offline tracks their real-world social activities, such as attending events in the physical world. The allmovie/imdb dataset consists of two subnetworks that are based on the relationships between actors in films. Each node in this dataset represents a movie, and each edge indicates a connection between two movies that feature at least one common actor. The flickr/myspace dataset combines networks from the separate social media platforms Flickr and Myspace. Nodes represent individual users, while edges represent the friendships between them.
Table 1 provides a detailed description of these datasets.
4.2. Baselines
In order to evaluate the performance of the proposed model, the following six models are compared:
REGAL [
9]: REGAL combines the topological structure and node attributes to generate a matrix that represents the similarity of different network nodes. The Nyström [
31] method is then used to decompose the similarity matrix and obtain node embeddings, which are later used for node matching.
GAlign [
12]: GAlign is a network alignment method that is based on a graph convolutional network. The model achieves node matching between different networks by learning the embedding of nodes and optimizing using the consistency loss function and adaptive loss function.
GATAL [
22]: GATAL is an unsupervised network alignment model that utilizes graph attention networks. It is comprised of three parts: an enhancement learning process, multi-level GAT embedding, and alignment computation. The model enhances adaptability by simulating noise in the real world and employs multi-level GAT to learn the latent features of the nodes.
WAlign [
13]: WAlign is a network alignment method that uses node embedding learning and a Wasserstein distance discriminator to achieve efficient and accurate network alignment. The method minimizes the distance between the embedding distributions of the source and target networks.
Grad-Align [
23]: Grad-Align is a method that uses a stepwise matching strategy to achieve network alignment. This is done through multi-layer embedding similarity calculation and Tversky similarity coefficient, resulting in improved accuracy and efficiency of alignment.
Grad-Align+ [
24]: Grad-Align+ is an enhanced version of Grad-Align that uses centrality-based node feature augmentation (CNFA) to improve the performance of GNN in network alignment tasks. Additionally, it employs a gradual alignment strategy to accurately identify correspondences between nodes across networks, even without additional information.
4.3. Parameter Setting and Evaluation Metrics
The experimental procedures were conducted on a personal computer running Windows 10, equipped with an Intel® i7-4790 processor clocked at 3.60 GHz and 16 GB of RAM. During the MANNA training phase, we employed the Adam optimizer with an initial learning rate of 0.005. The graph neural network architecture consisted of 2 convolutional layers, and we iterated the training for 30 epochs. We set the sampling rate for pseudo-anchor nodes to 0.1, and the embedding dimension to 100. The benchmark algorithm parameters were adjusted according to the recommendations of the original papers, with the exception of the embedding dimensionality, number of convolutional layers, and training epochs, which remained consistent with MANNA. The optimal performance under these parameter configurations was recorded.
Building on previous research, we used two evaluation metrics—
MAP (Mean Average Precision) [
12,
22] and
Precision@k [
12,
22,
23,
24]—to compare the alignment effectiveness of different methods.
The
MAP metric was used to evaluate the performance of algorithms in identifying corresponding nodes (anchor nodes) in the target network for each node in the source network. This metric considers alignment results for all nodes in the source network and calculates the average of the inverse ranks. For each node
i in the source network, all nodes in the target network are ranked based on the alignment scores (similarity) in the alignment matrix. The position of the true anchor node for node
i in the ranking is determined, and the inverse of its rank is computed. Subsequently, the inverses of the ranks of the true anchor nodes for all nodes in the source network are averaged to obtain the
MAP value. The formula is as follows:
where
denotes the rank of the true anchor node for the node
in the source network within the alignment results.
Precision@k measures the proportion of correctly identified true anchor nodes among the top
k candidate anchor nodes for each node. To achieve this, we first identify the top
k target network nodes with the highest alignment scores to node
in the alignment matrix and place these target nodes in the set
for each node
in the source network. We then check whether the node pair
appears in the set of true anchor node pairs
for each node
in the set
. If the node pair
is present in the set
, it indicates a correct match and is counted as a successful match. The
Precision@k value is calculated by dividing the number of successful matches by the total number of nodes in the source network as follows:
where the indicator function
is a function that takes the value of 1 when the condition is true and 0 otherwise.
4.4. Model Performance Comparison
To evaluate the performance of the method proposed in this paper, we compared it with six baselines.
Table 2 presents the experimental results of the proposed method and the other six baselines on three datasets. The optimal results of each column are in bold, and the best results of the baseline are underlined.
The experimental results show that there are significant performance differences among various baselines on different datasets. REGAL uses xNetMF, a low-rank approximation and implicit matrix decomposition technique, to learn node representations in different networks. In contrast, other baselines use Graph Neural Networks (GNNs) to learn node representations from graph data. GNNs can effectively capture both the local and global neighborhood information of nodes by transferring and aggregating information on graphs. This makes them more efficient in expressing complex dependencies between nodes. However, xNetMF mainly relies on node degree distribution and attribute information, which may limit its flexibility in capturing complex interactions and dependencies between nodes. Among all baseline algorithms, REGAL has the worst performance. Of the GNN-based baselines, WAlign performs the worst. This could be attributed to the weight-sharing mechanism used by other algorithms. The weight-sharing mechanism allows the model to learn common, meaningful representations from both networks, which is crucial for the network alignment task. Additionally, both Grad-Align and Grad-Align+ employ a stepwise network alignment strategy to gradually discover node pairs through an iterative process. The importance of the structural positions of the nodes in their respective networks is emphasized by measuring the similarity of the aligned cross-network node pairs, thus optimizing the alignment results. Grad-Align+ outperformed other baselines on the douban online/offline and allmovie/imdb datasets, while Grad-Align outperformed other baselines on the flickr/myspace dataset.
MANNA consistently outperformed the baselines in all three datasets, demonstrating its superior performance. Compared to the highest-performing baseline, Grad-Align+, on the douban dataset, MANNA showed a significant improvement in performance metrics: approximately 15.3% in MAP, 27.3% in Precision@1, 20.6% in Precision@5, and 14.2% in Precision@10. MANNA outperformed Grad-Align+ on the almovie/imdb dataset with a remarkable enhancement of around 33.5% in MAP, 45.9% in Precision@1, 24.0% in Preci-sion@5, and 15.5% in Precision@10. Similarly, on the flickr/myspace dataset, MANNA surpassed Grad-Align with significant gains of approximately 12.9% in MAP, 39.6% in Precision@1, 11.4% in Precision@5, and 20.3% in Precision@10.
4.5. Ablation Experiment
In this section, we conducted experiments on three datasets to investigate the contributions of various key modules within our model to the overall performance. To evaluate the efficacy of the different components of the model more clearly, we removed some key modules from the original model and monitored the resulting performance changes.
Base Model (BM): This version uses only unsupervised learning techniques to train the graph neural network for node representation. It removed all the modules designed to improve matching performance.
To evaluate the impact of individual components on model performance, we incorporated each of the following modules into the base model separately: the Network Enhancement (NE) module, the Self-Supervised Learning (SL) module, and the Alignment Refinement (AR) module. This enabled an evaluation of their respective contributions to the model’s overall performance. The study analyzed the performance of three configurations: the model with only the NE module (only NE), the model with only the SL module (only SL), and the model with only the AR component (only AR).
Experiments were conducted to investigate the impact of the absence of each component on the model’s performance by removing them individually. The configurations tested included the model without the NE component (w/o-NE), the model without the SL component (w/o-SL), and the model without the AR component (w/o-AR).
The experimental results are detailed in
Table 3, where the optimal results in each column are highlighted in bold, and the suboptimal results are underlined.
The experimental findings suggest that across the three datasets, the comprehensive model achieves the highest performance. Among all the variant models, the one lacking the Network Enhancement (NE) component (w/o-NE) demonstrates the most superior performance. Specifically, the integration of the NE component singularly enhances the model’s efficacy on the douban online/offline and allmovie/imdb datasets. Conversely, on the flickr/myspace dataset, the inclusion of the NE component does not enhance accuracy, potentially due to the scarcity of attribute features in this dataset. The incorporation of the Self-Supervised Learning (SL) component universally improves the model’s performance across all three datasets, indicating that modifying the distance between pseudo-anchor nodes aids in the extraction of node features that are more aligned with the network alignment task. The Alignment Refinement (AR) component contributes most significantly to the enhancement of alignment performance. For the douban dataset, the model comprising solely the AR component outperforms the Base Model (BM) with improvements of approximately 13.4% in MAP, 17.1% in Precision@1, 10.1% in Precision@5, and 6.0% in Precision@10. On the allmovie/imdb dataset, the only AR model surpasses the BM with enhancements of around 20.3% in MAP, 28.2% in Precision@1, 12.7% in Precision@5, and 8.6% in Precision@10. On the flickr/myspace dataset, the only AR model exceeds the BM with significant gains of approximately 29.8% in MAP, 46.7% in Precision@1, 19.8% in Precision@5, and 100% in Precision@10. The removal of the AR component in isolation results in a notable degradation of the model’s performance. Overall, the AR component’s iterative refinement of the similarity matrix, which reinforces the neighborhood consistency of matched node pairs, emerges as the most effective strategy for enhancing alignment accuracy. While the NE module and the SL module also contribute to performance improvement, their impact is relatively less pronounced compared to the AR component.
4.6. Hyper-Parameter Sensitivity Analysis
This section analyzes the impact of three parameters on the experimental results: embedding dimensionality, number of epochs, and the ratio of pseudo-anchor nodes. The target parameter is changed while keeping all other parameters constant.
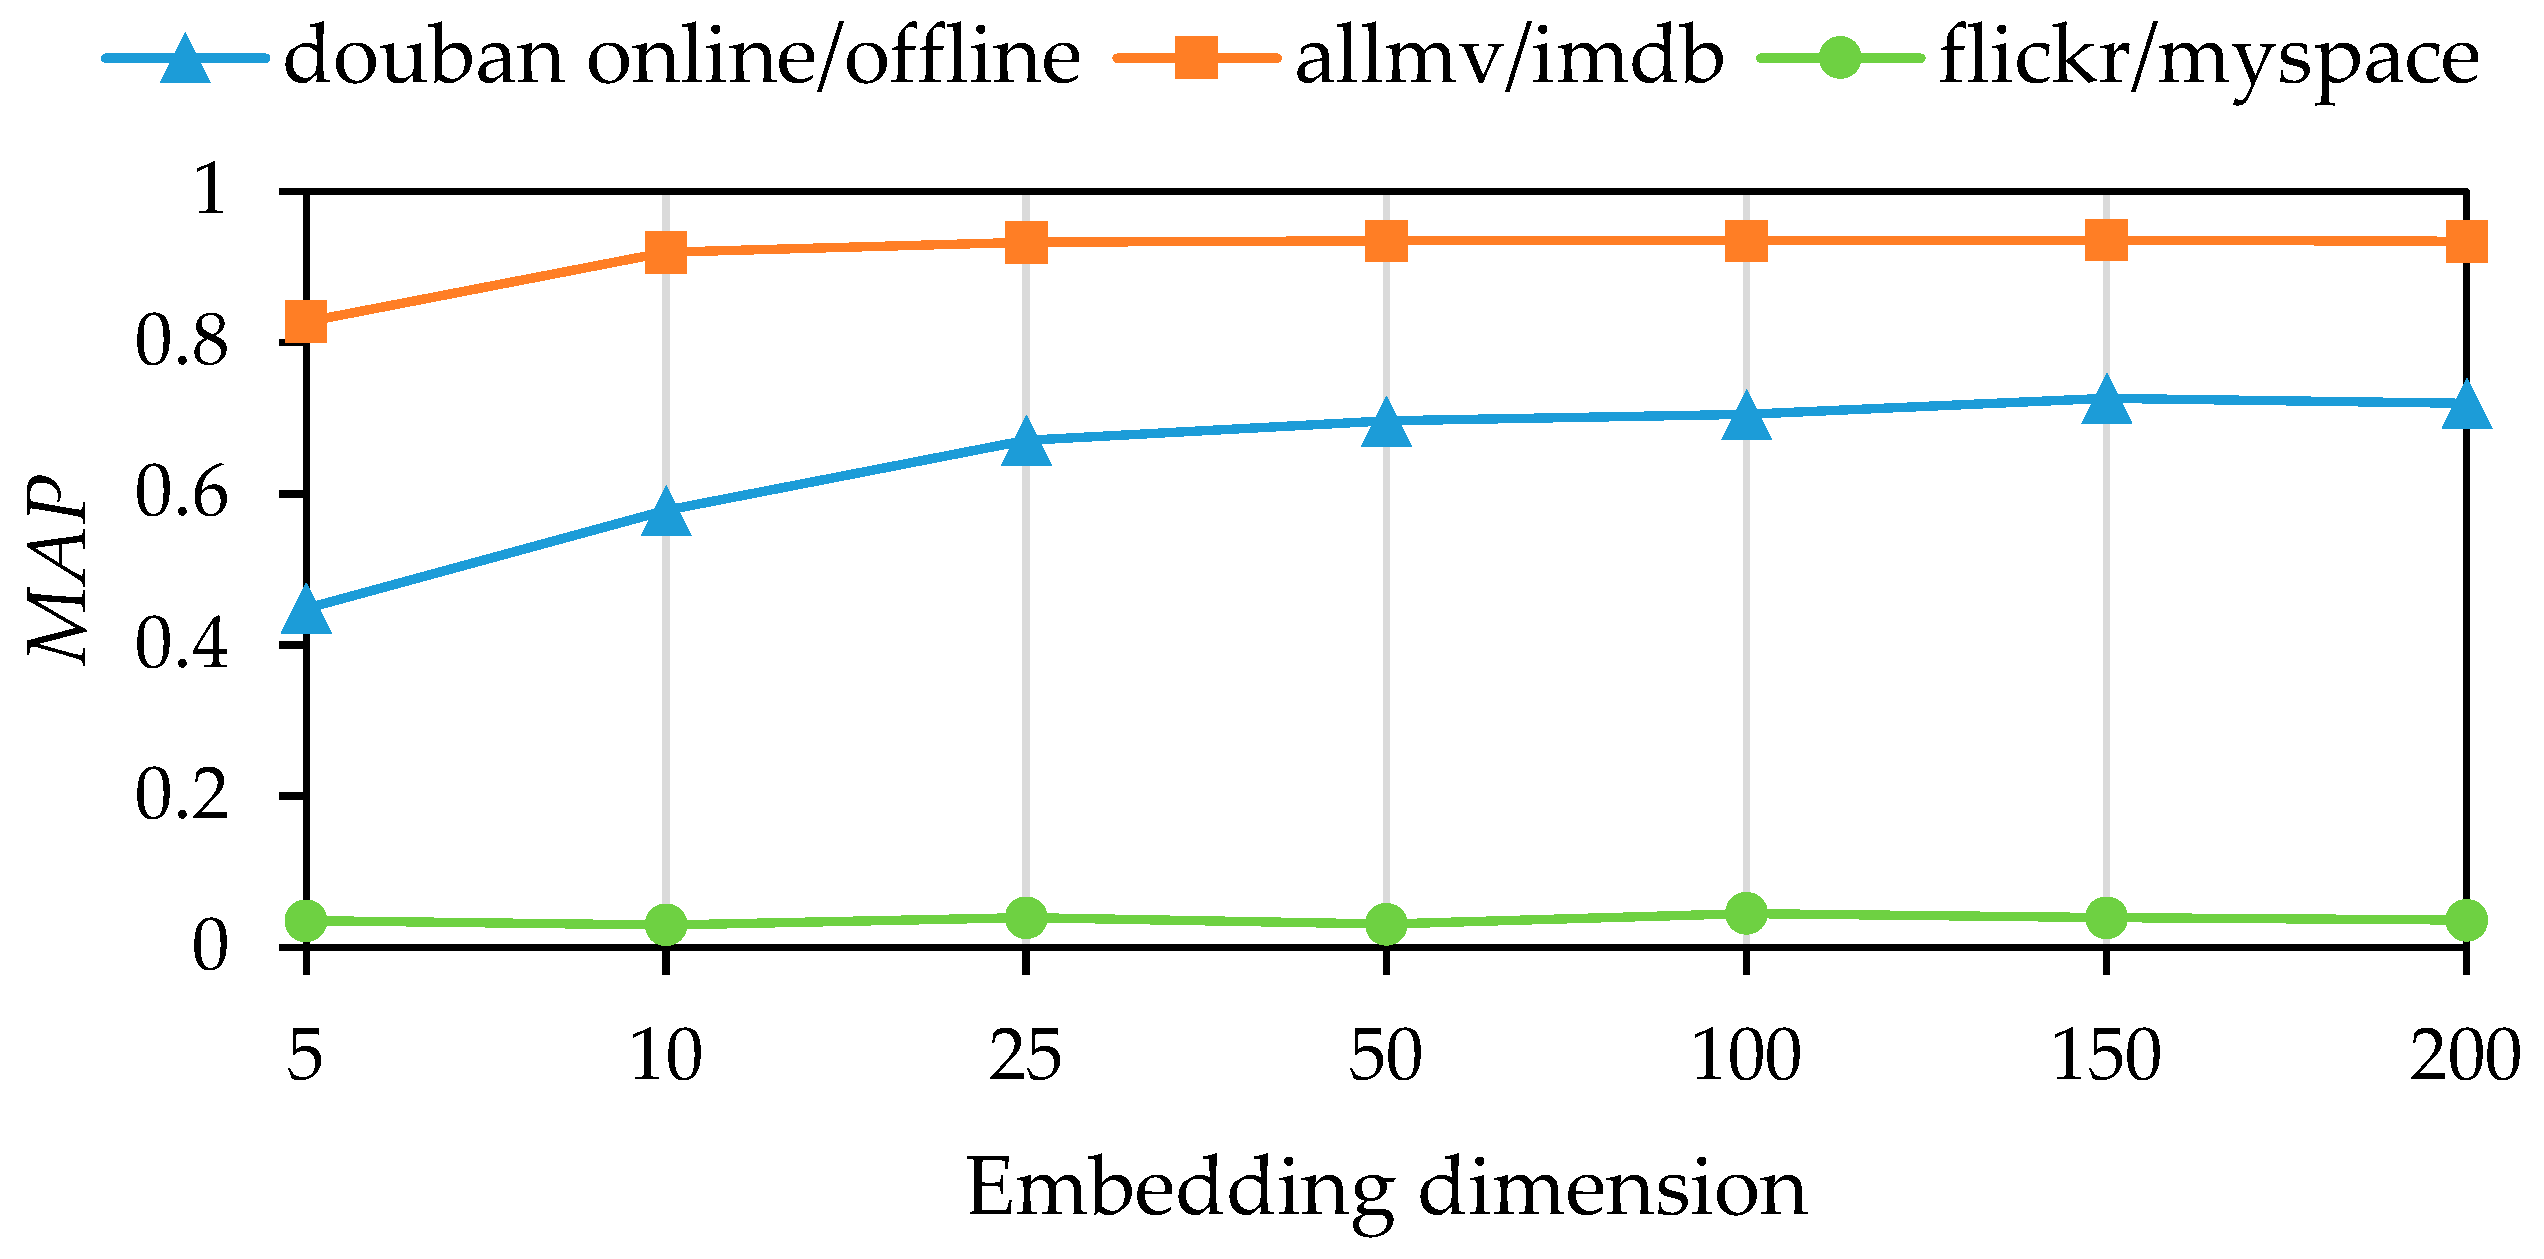
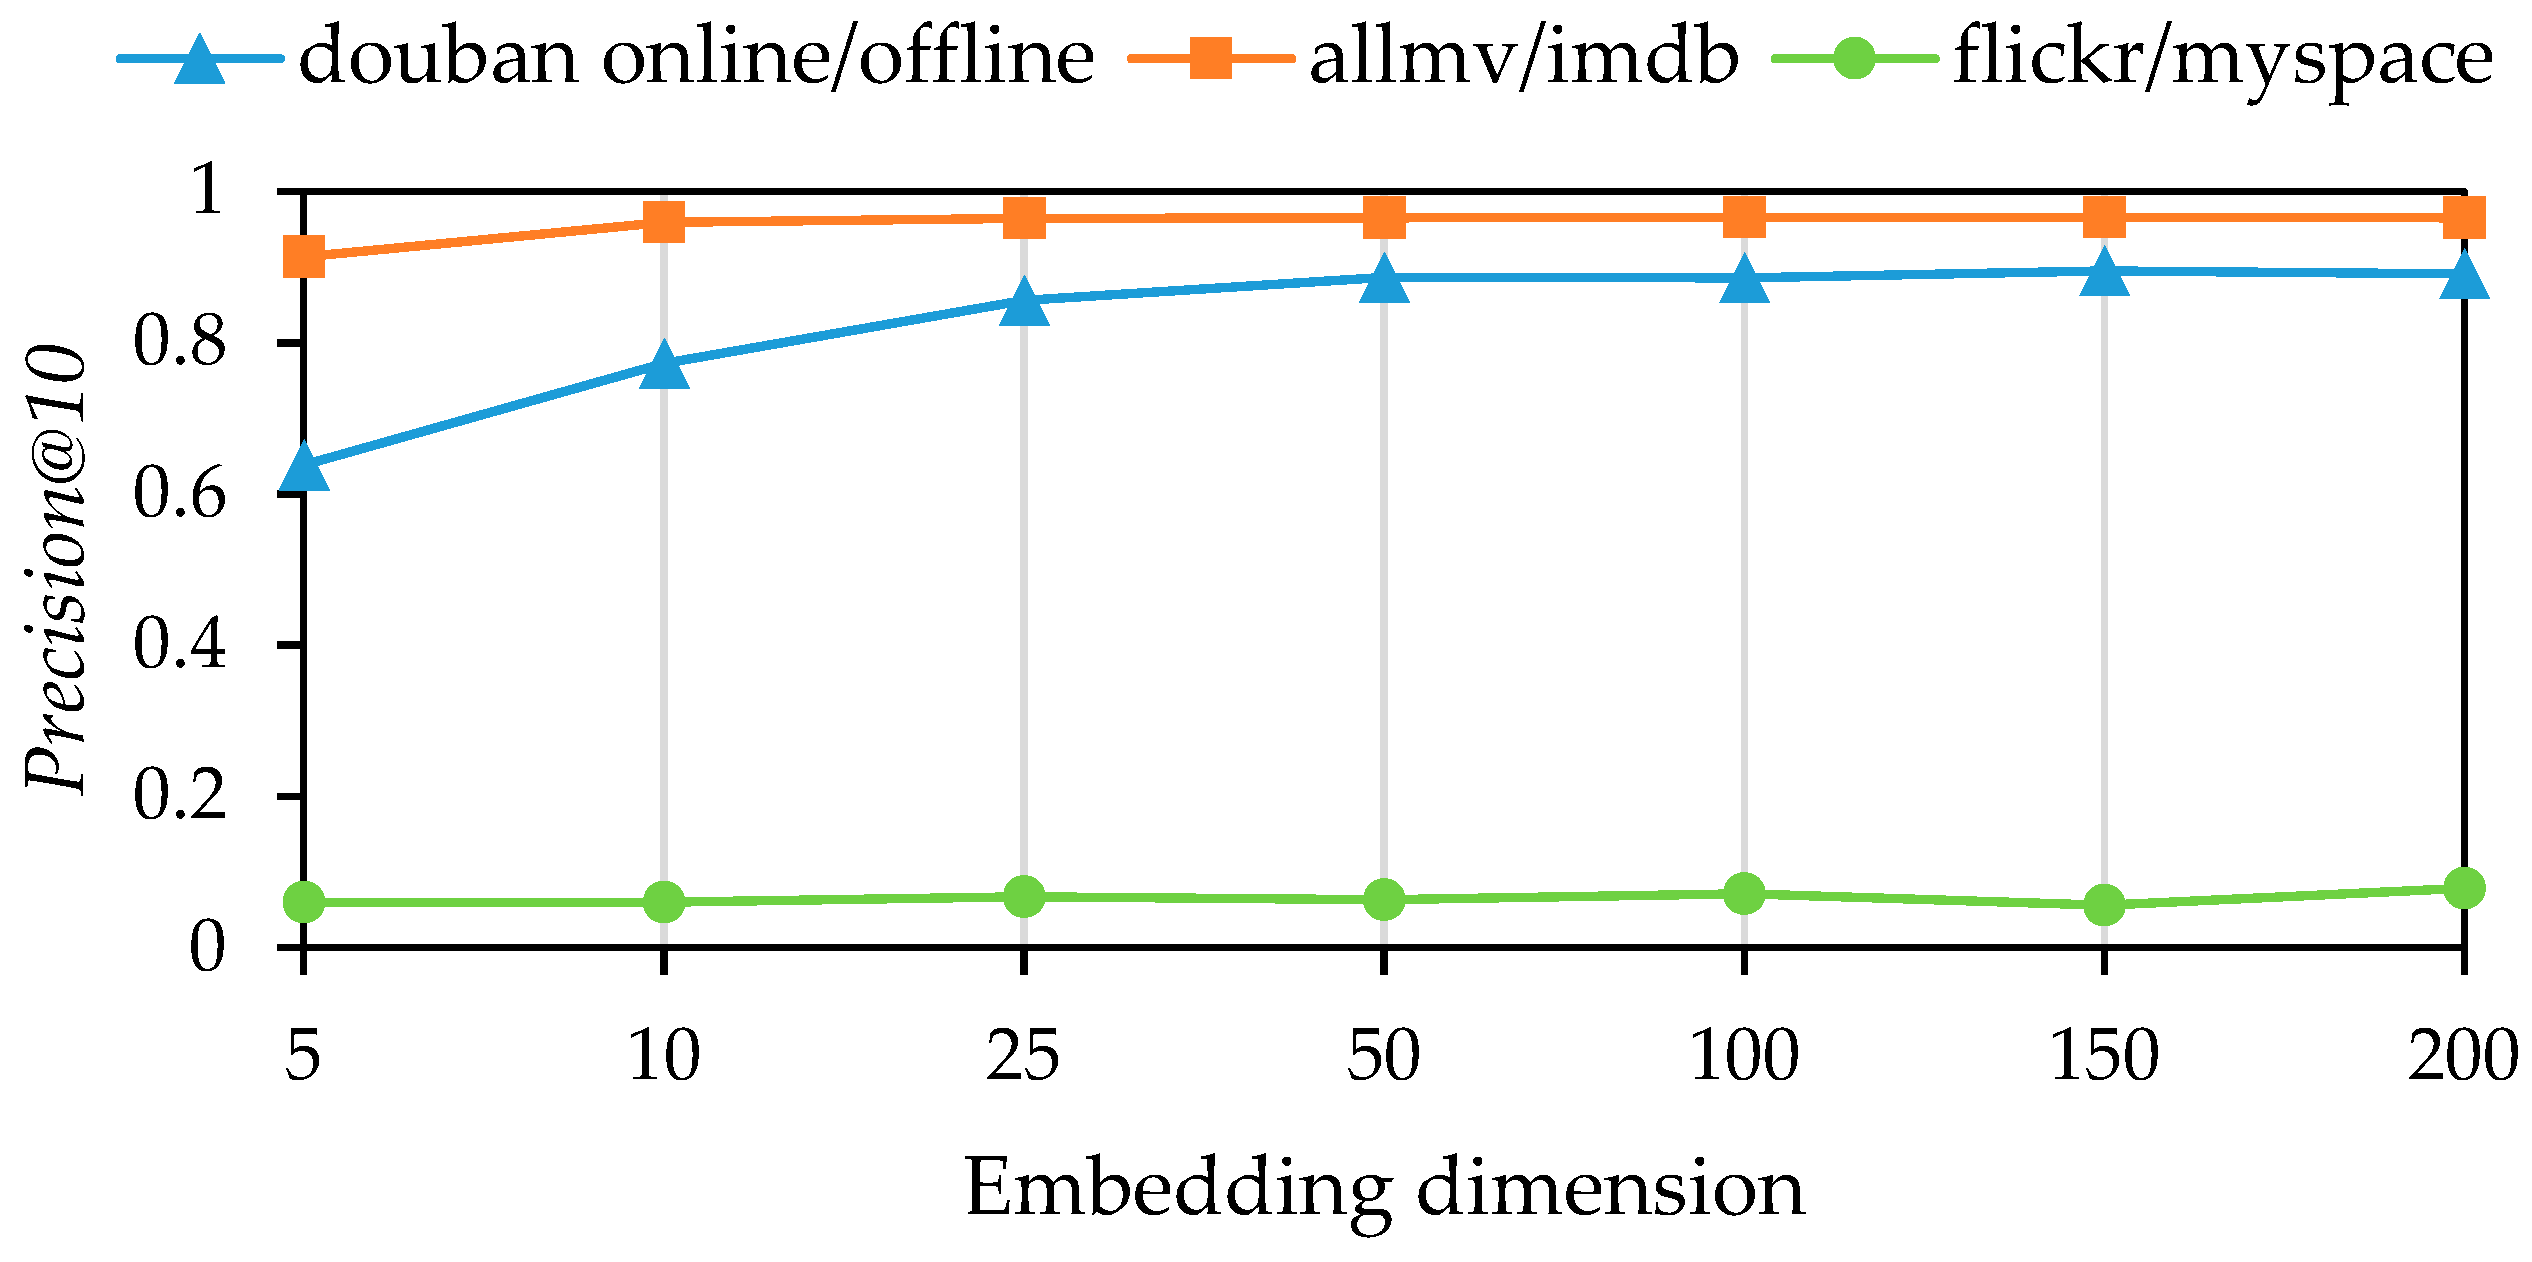
First, we analyzed the influence of different embedding dimensions (5, 10, 25, 50, 100, 150, 200) on model performance. The experimental results are presented in
Figure 3 and
Figure 4.
Figure 3 shows the trends in the
MAP value as the embedding dimensionality increases. Similarly,
Figure 4 displays the performance of the
Precision@10 value under the same conditions. According to the analysis, the model performs optimally with an embedding dimensionality of 150 for the douban online/offline and allmovie/imdb datasets. However, for the flickr/myspace dataset, the model’s performance becomes unstable as the embedding dimensionality increases. The
MAP value reaches its peak at an embedding dimensionality of 100, while the
Precision@10 value is best at 200. The fluctuation in performance can be attributed to the sparse network structure and insufficient node attribute information.
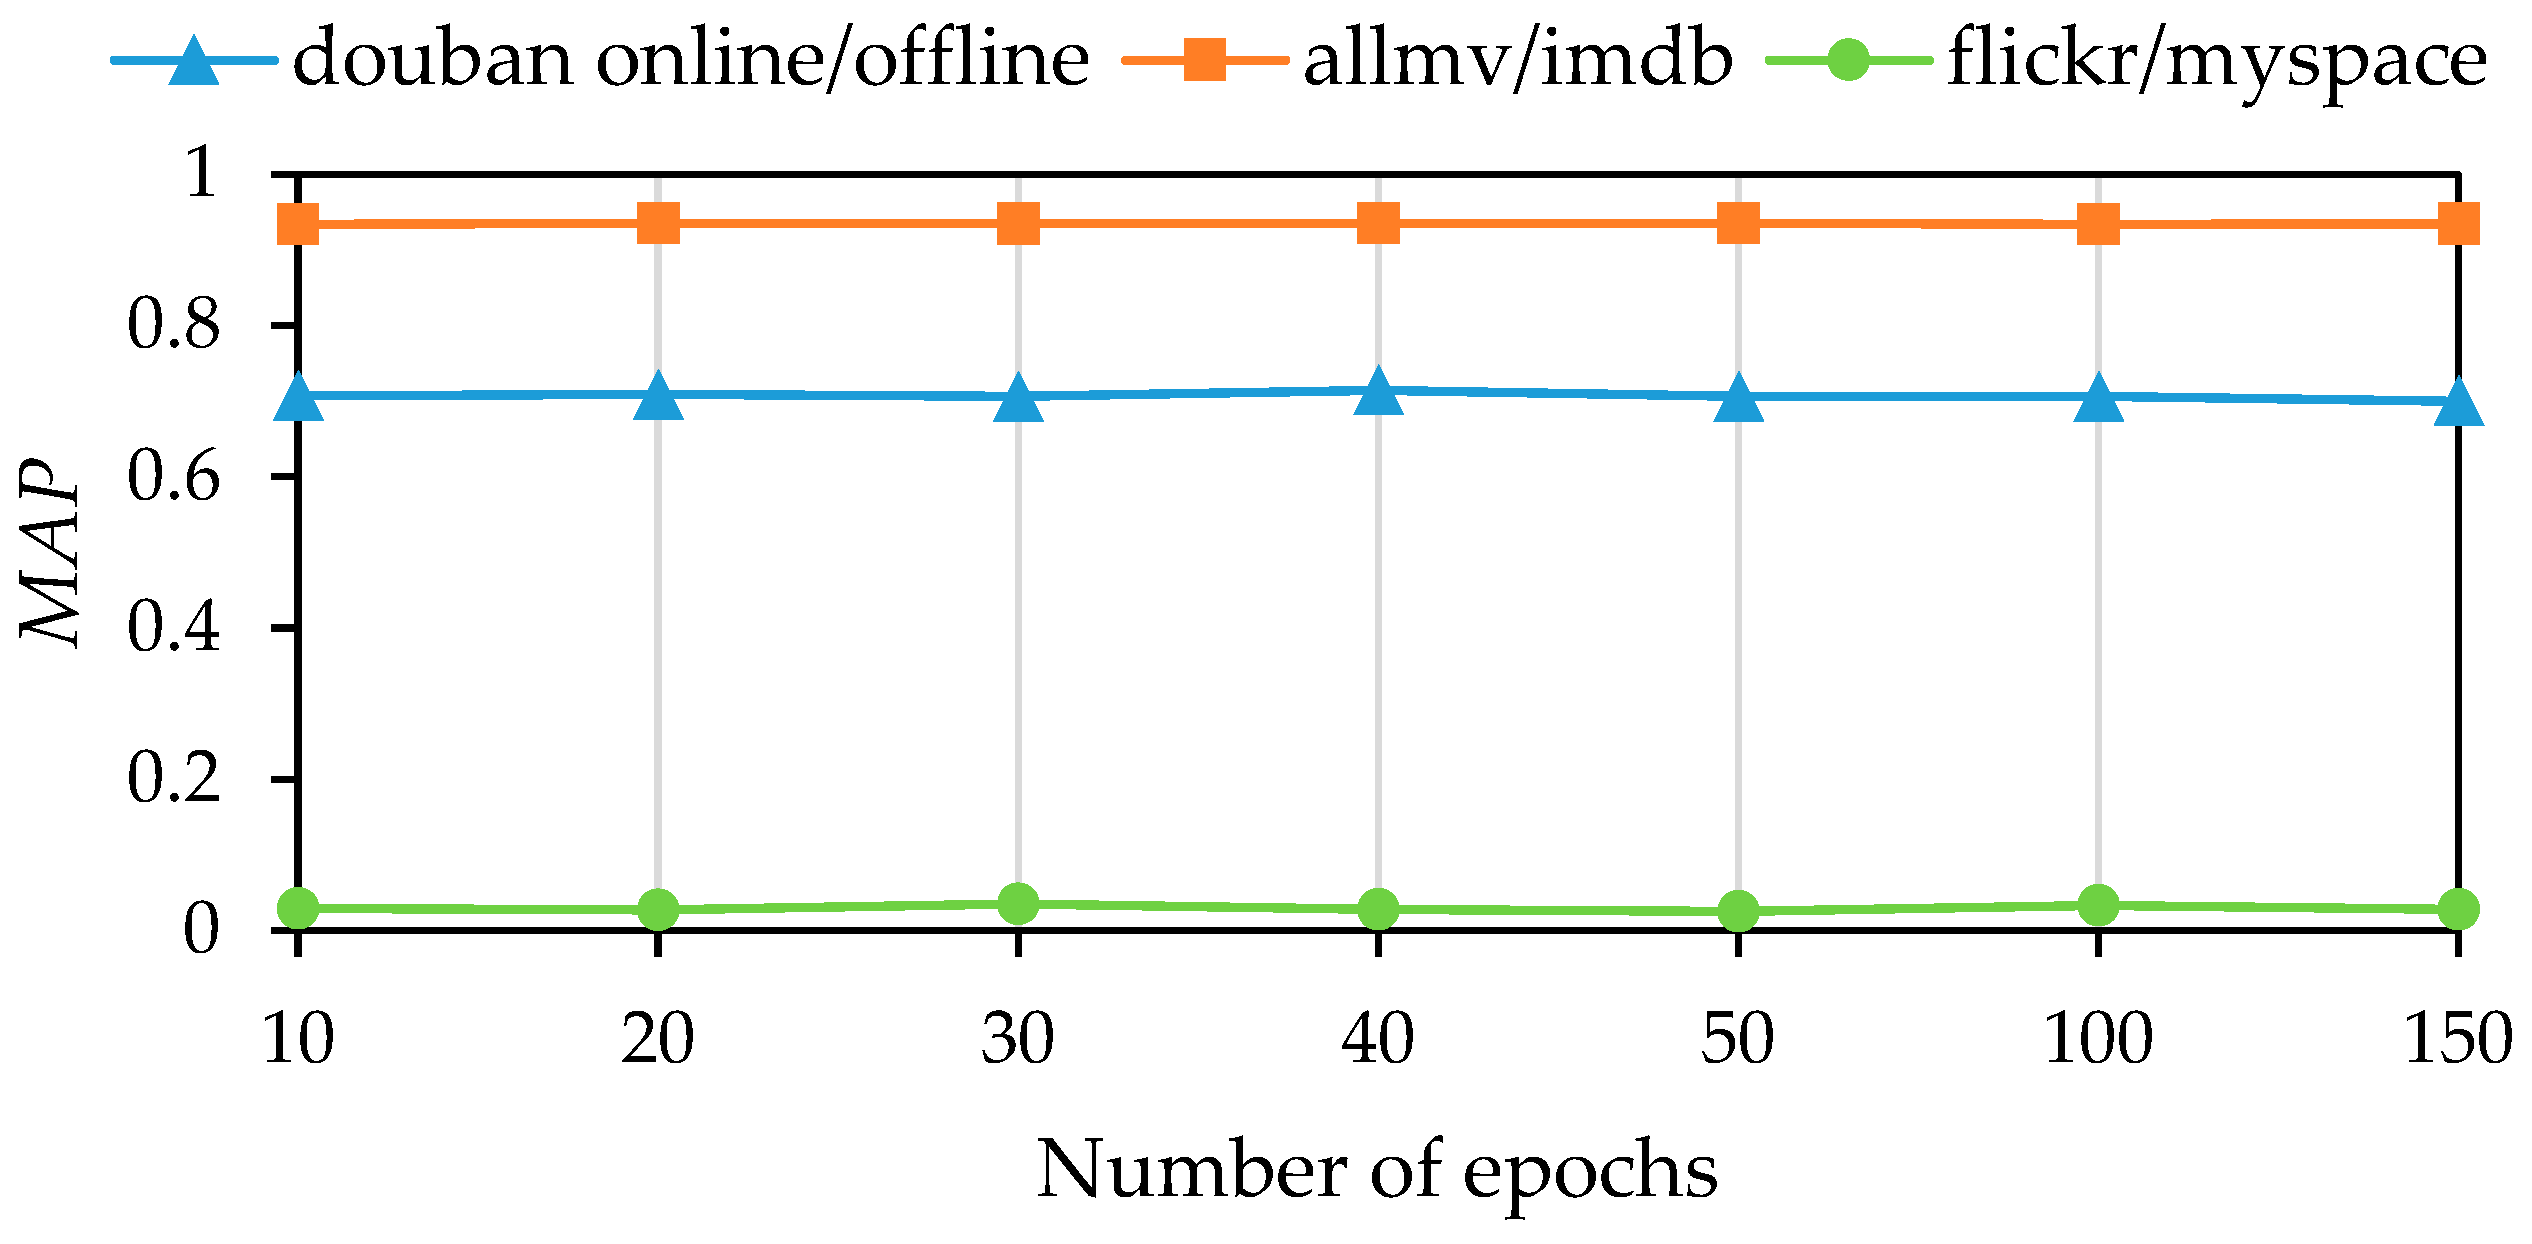
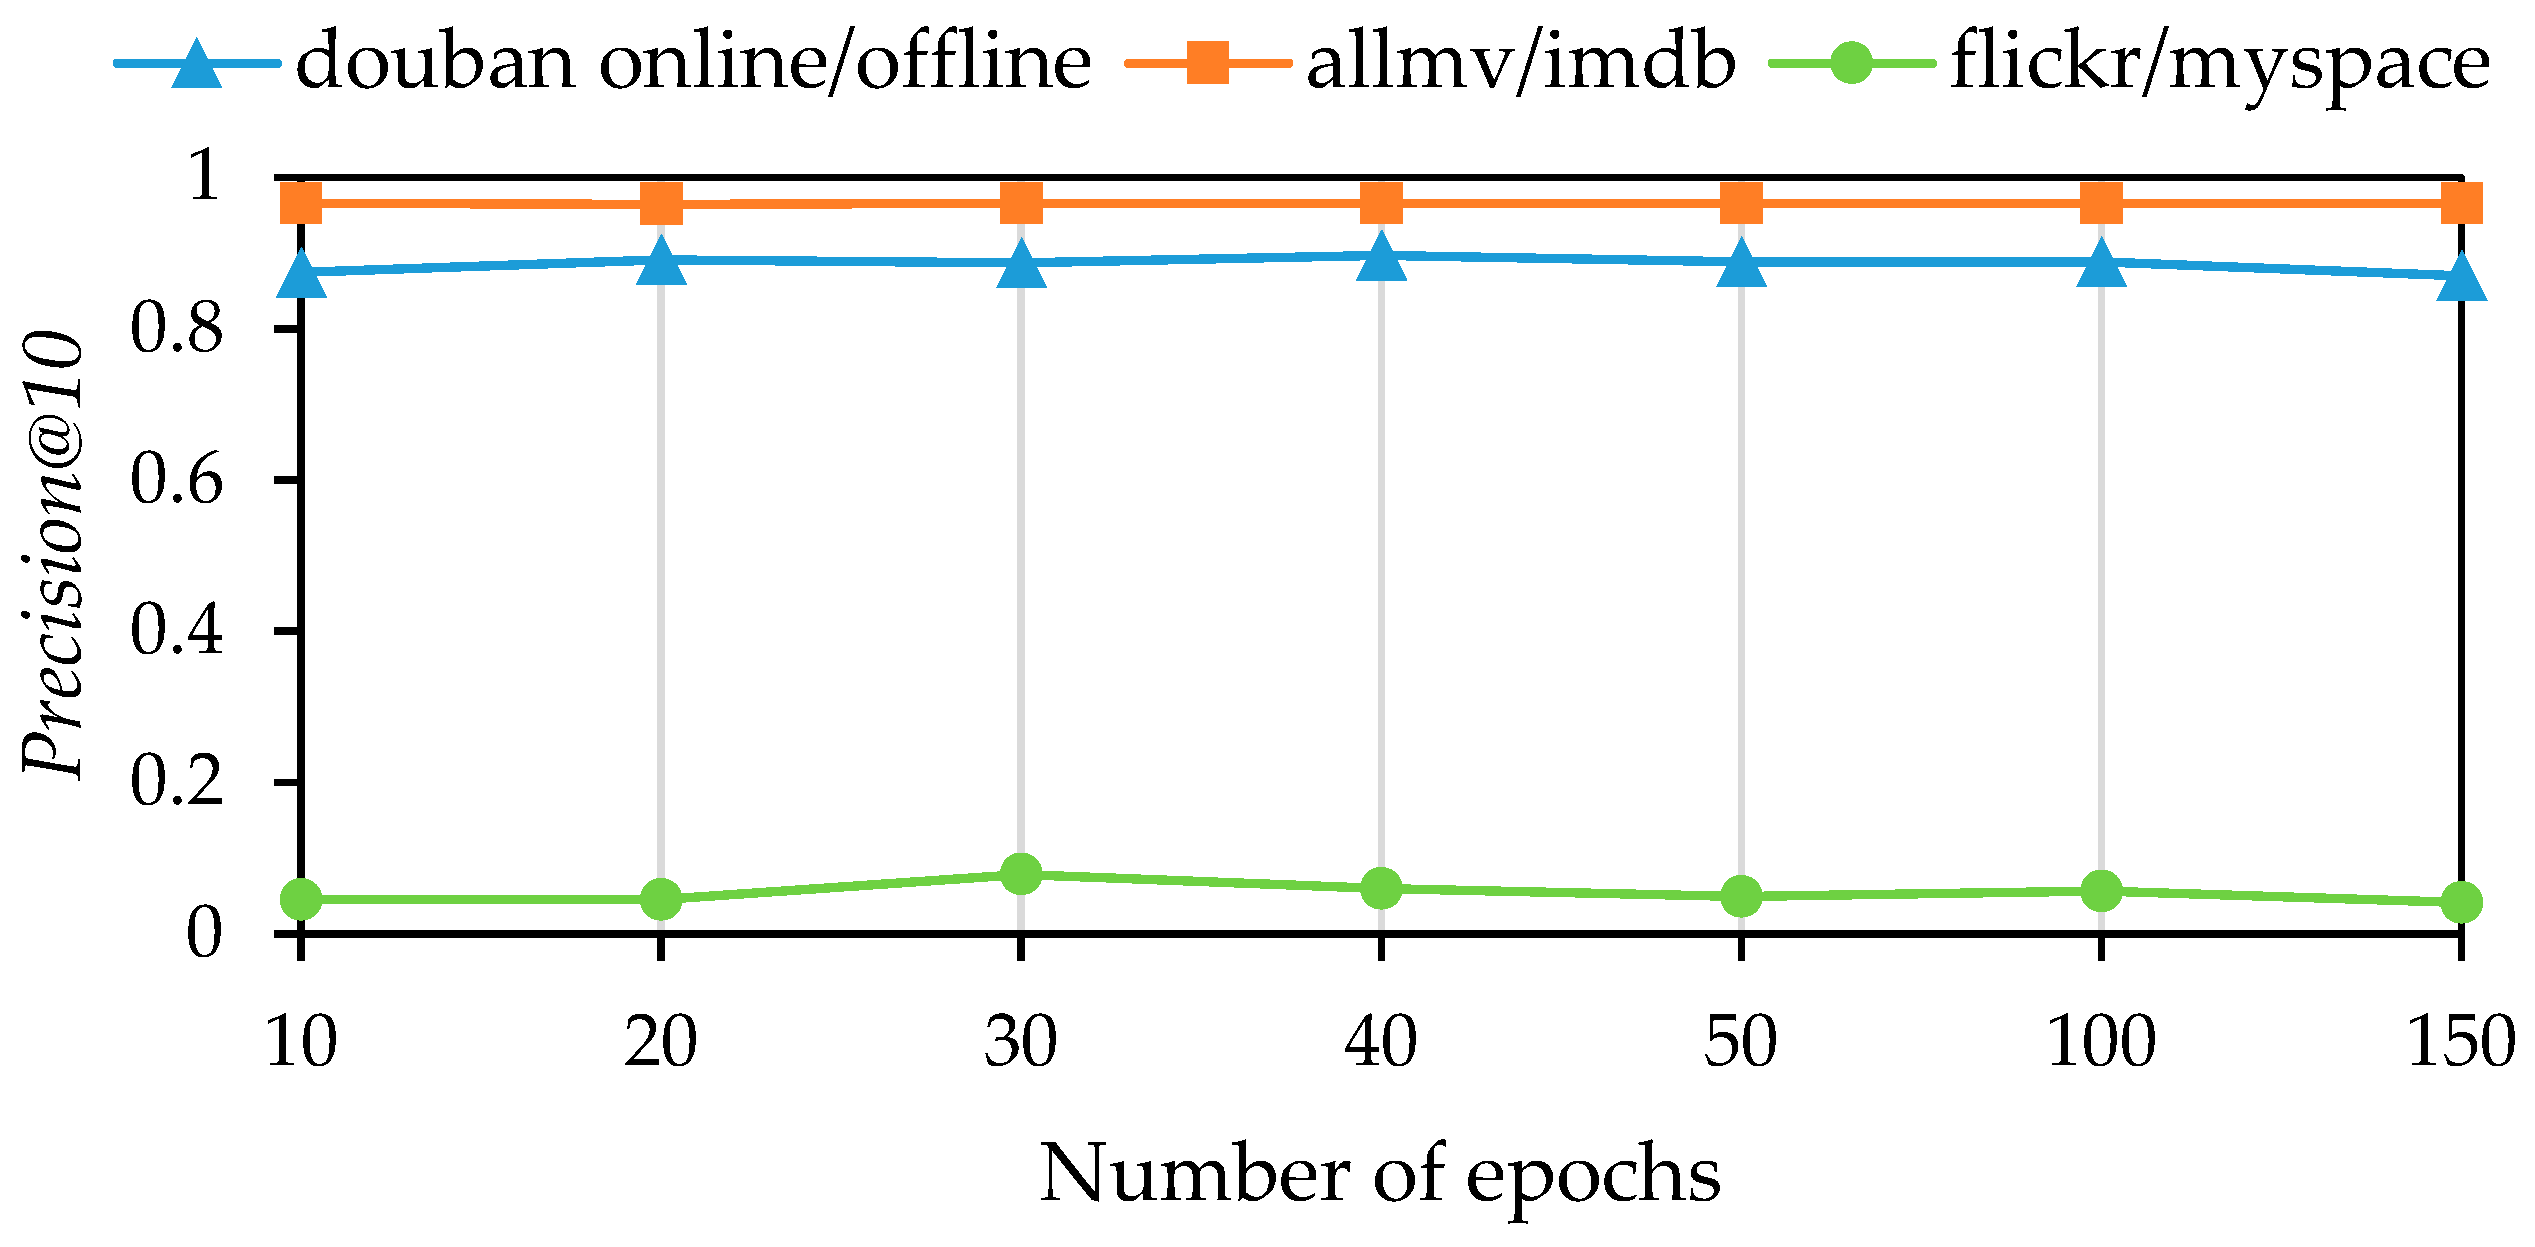
Next, we analyzed the effects of varying the number of epochs for the graph neural network. The experimental setup involved setting the number of epochs to 10, 20, 30, 40, 50, 100, and 150. The results of this experiment are depicted in
Figure 5 and
Figure 6.
Figure 5 shows the
MAP metric, while
Figure 6 shows the
Precision@10 metric, as in the previous experiment. The results indicate that the model achieved satisfactory performance with a relatively low number of epochs across all three datasets. However, the optimal point varies for each dataset. The douban online/offline and allmovie/imdb datasets achieve their optimal performance at 40 epochs. After this point, performance slightly declines with additional epochs. On the flickr/myspace dataset, the model’s performance plateaus at 30 epochs, with only slight improvements observed thereafter.
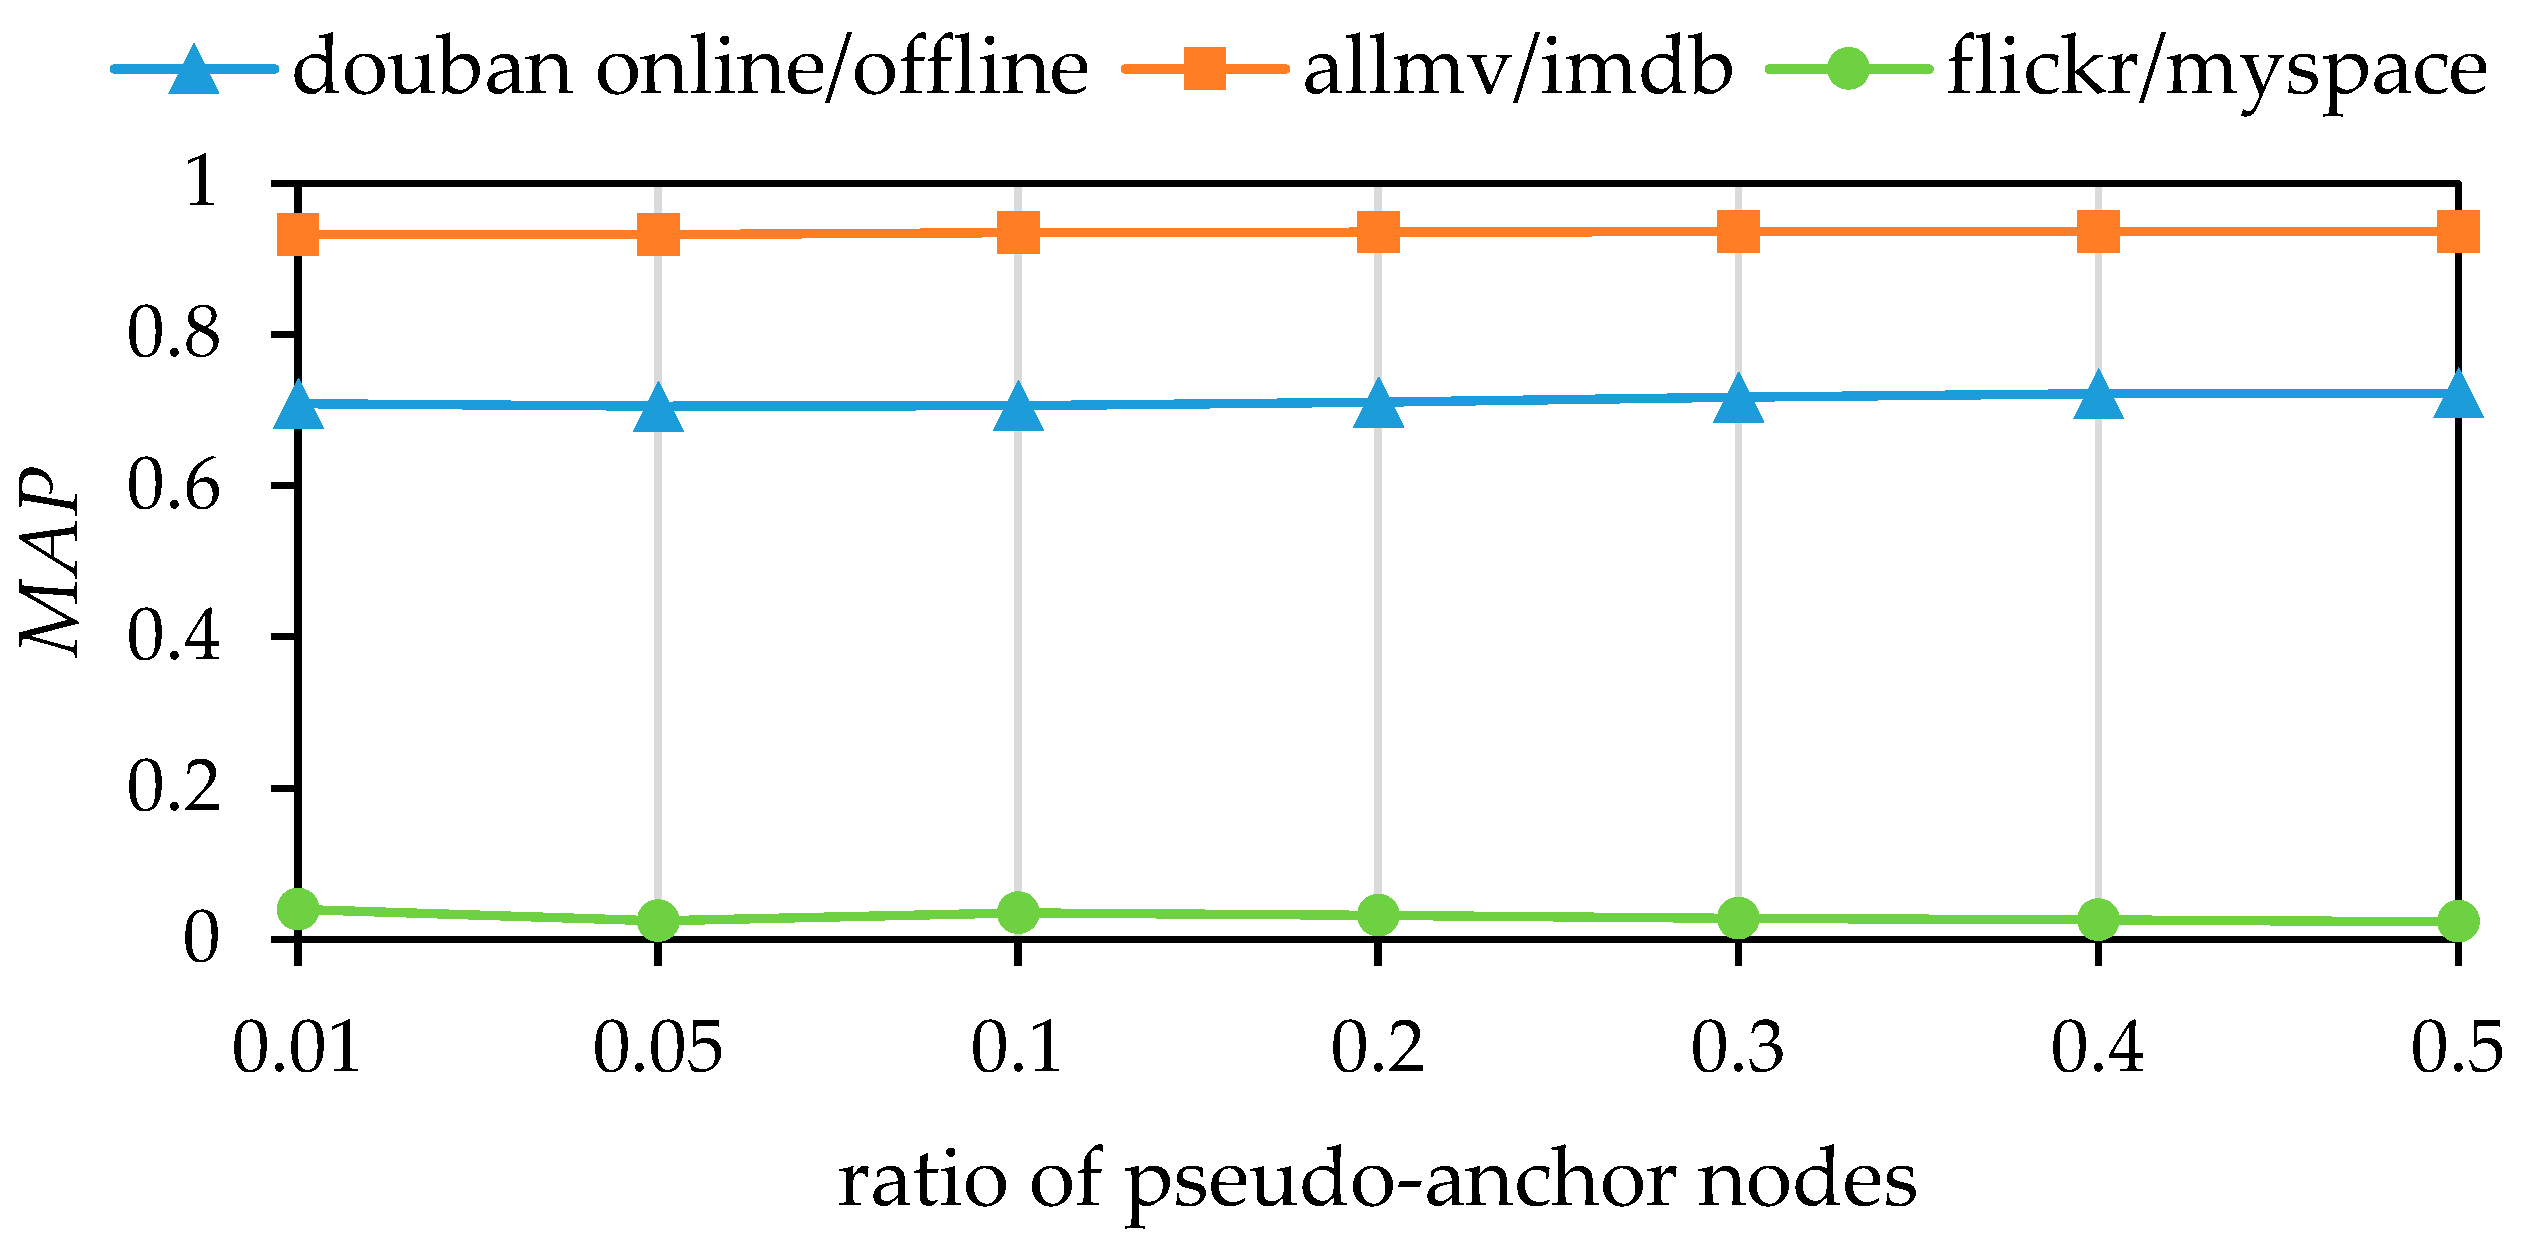
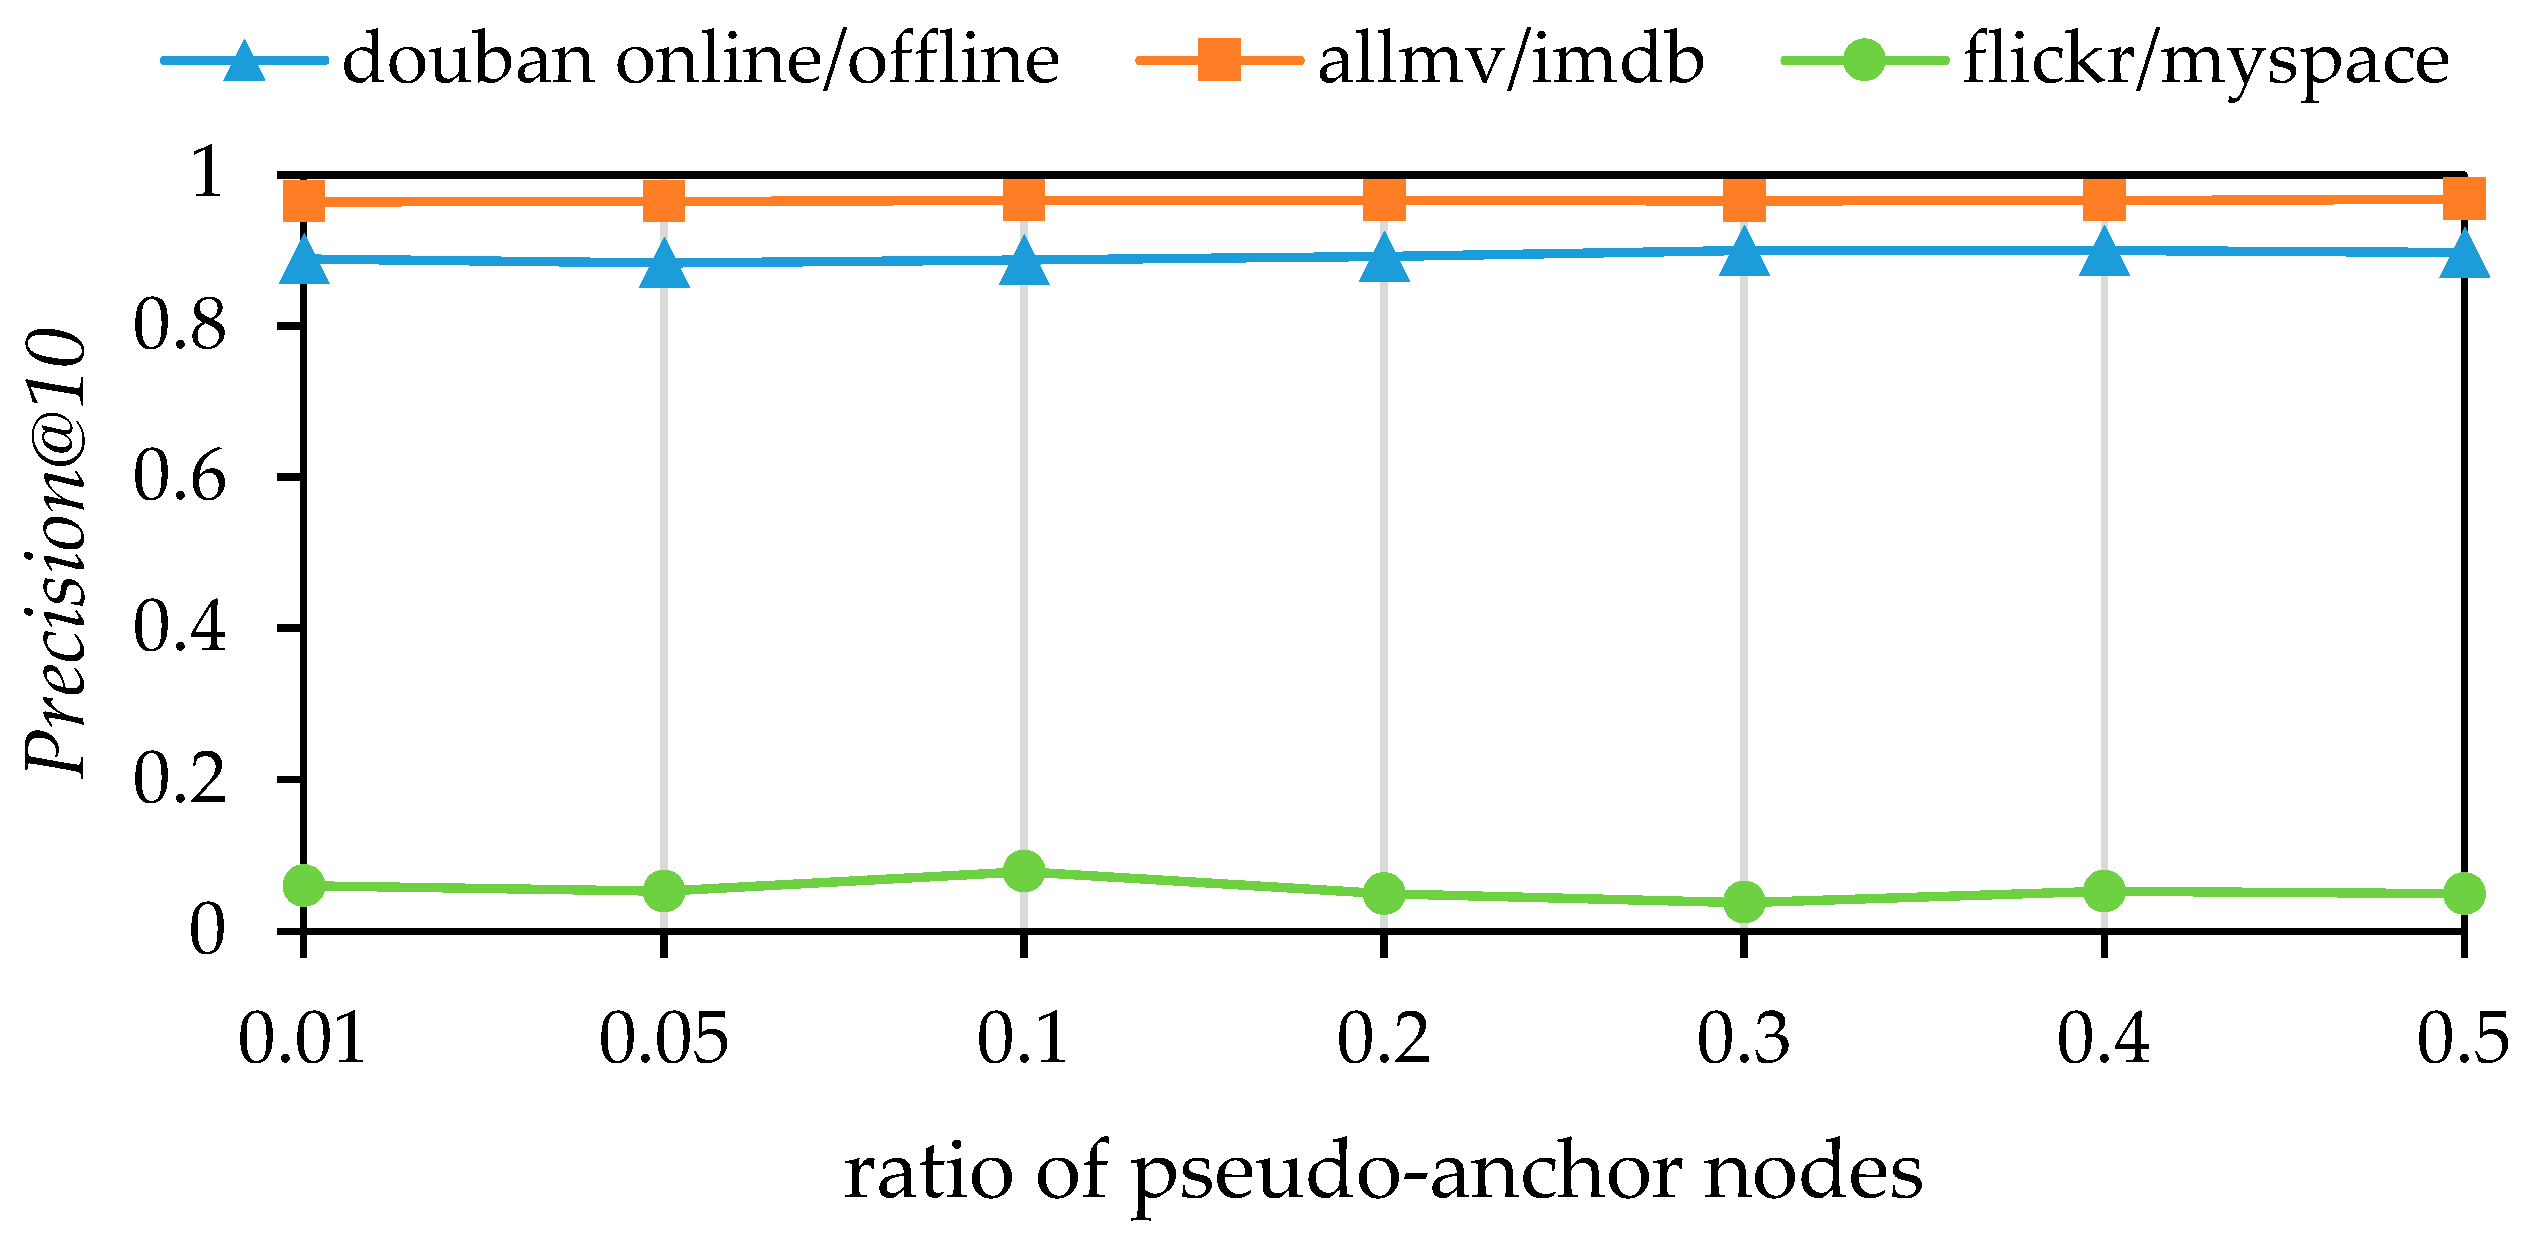
Finally, we analyzed the impact of the varying ratios of pseudo-anchor nodes on experimental outcomes. The experiment involved setting the ratio of pseudo-anchor nodes to 0.01, 0.05, 0.1, 0.2, 0.3, 0.4 and 0.6. The results of this investigation are visualized in
Figure 7 and
Figure 8. As with the previous experiments,
Figure 7 represents the
MAP, while
Figure 8 represents the
Precision@10. The visualizations show that the model’s performance improves with an increase in the proportion of pseudo-anchor nodes across all three datasets. The model’s alignment performance, as measured by the
MAP, is marginally enhanced with the increase in the proportion of pseudo-anchor nodes in the douban online/offline and allmovie/imdb datasets, although the improvement is not significant. In the flickr/myspace dataset, the model’s performance plateaus at a pseudo-anchor node proportion of 0.1. Further increases in this proportion lead to a decline in performance, as shown by
Precision@10. This phenomenon may be attributed to the sparse and locally clustered network structures in the flickr/myspace datasets. Achieving matching neighbor consistency in network structures is challenging. An increase in the proportion of pseudo-anchor nodes may introduce excessive noise, potentially interfering with the alignment algorithm’s performance.


