Article

Dynamics of the Diphtheria Epidemic in Nigeria: Insights from the Kano State Outbreak Data

1
Department of Mathematics, Faculty of Natural and Applied Sciences, Sule Lamido University Kafin Hausa, P.M.B 048, Kafin Hausa 741103, Nigeria
2
Department of Mathematics, Faculty of Computing and Mathematical Sciences, Aliko Dangote University of Science and Technology, Wudil-Kano 713101, Nigeria
3
Intelligent and Nonlinear Dynamic Innovations Research Center, Department of Mathematics, Faculty of Applied Science, King Mongkut’s University of Technology North Bangkok, Bangkok 10800, Thailand
*
Authors to whom correspondence should be addressed.
Mathematics 2025, 13(7), 1189; https://doi.org/10.3390/math13071189
Submission received: 19 February 2025 / Revised: 29 March 2025 / Accepted: 3 April 2025 / Published: 4 April 2025
(This article belongs to the Special Issue Mathematical Modeling of Disease Dynamics)

Abstract

:
Diphtheria is a severely infectious and deadly bacterial disease with Corynebacterium diphtheriae as the causative agent. Since the COVID-19 pandemic, contagious diseases such as diphtheria have re-emerged due to disruptions in routine childhood immunization programs worldwide. Nigeria is witnessing a significant increase in diphtheria outbreaks likely due to an inadequate health care system and insufficient public enlightenment campaign. This paper presents a mathematical epidemic diphtheria model in Nigeria, which includes a public enlightenment campaign to assess its positive impact on the prevalence of the disease. The mathematical analysis of the model reveals two equilibrium points: the diphtheria infection-free equilibrium and the endemic equilibrium. These equilibrium points are shown to be stable globally asymptotically if R c < 1 and R c > 1 , respectively. The model was fit using the confirmed diphtheria cases data of Kano State from January to December 2023. Sensitivity analysis indicates that the transmission rate and recovery rate of asymptomatic peopleare crucial parameters to be considered in developing effective strategies for diphtheria control and prevention. This analysis also reveals that the implementation of a high-level public enlightenment campaign and its high efficacy effectively reduce the prevalence of diphtheria. Finally, numerical simulations show that combining the public enlightenment campaign and isolating infected individuals is the best strategy to contain the spread of diphtheria.
MSC:
26A33; 33E30; 70G10; 37N30; 65L05

1. Introduction

Diphtheria is a contagious disease caused by the diphtheriae bacteria, which produce harmful toxins that make people sick. The infection can spread through respiratory droplets, such as from coughing or sneezing, and also through open wounds of infected individuals [1]. Diphtheria can spread easily between people through direct contact as well as contact with contaminated objects [2]. Symptoms of diphtheria appear within 2–7 days after infection and may include fever, fatigue, cyanosis, sore throat, headache, difficulty swallowing, rapid breathing, and blood-stained nasal discharge. Severe cases of diphtheria, if left untreated, can destroy healthy respiratory tissues, resulting in the formation of a thick grayish coating called “Pseudomembrane” that can damage the heart and kidneys. Diphtheria was a leading cause of mortality worldwide especially in childhood before the introduction of the Diphtheria Toxoid vaccine in 1923 [3]. The outbreak of diphtheria in the developed world is rare nowadays. Still, since the COVID-19 pandemic [4,5], there has been a significant increase in diphtheria outbreaks around the globe because routine childhood immunization was disrupted globally, and countries such as Bangladesh, Pakistan, Yemen, Niger, and Nigeria have reported confirmed cases of diphtheria [6].
Immunization against diphtheria is a crucial preventive measure for people of all ages. If infected, diphtheria is treated with antibiotics to eradicate the bacteria. In cases of respiratory diphtheria, diphtheria antitoxins are administered to neutralize the bacterial toxin and prevent further harm to the body [2]. The absence of data beyond 2006 is likely due to an incomplete reporting system and inadequate disease surveillance in Nigeria [7]. Diphtheria has re-emerged in Nigeria (2022) with diphtheria cases under-reported due to a lack of public awareness of the disease. The Nigeria Center For Disease Control [2] officially declared the situation as an outbreak of diphtheria cases in Nigeria with Kano State as the epicenter of the diphtheria outbreak. Compartmental models in epidemiology play a role in predicting the transmission dynamics of infectious diseases [8,9,10,11,12,13,14,15,16,17,18,19]. Several epidemiological models of diphtheria exist in the literature (see, for example, [20,21,22,23,24,25,26,27,28,29,30,31,32]).
Adewale et al. [20] studied a five-compartment SEQIR model to understand the effect of quarantining exposed individuals on the dynamic spread of diphtheria in a population. The model illustrates how quarantining exposed individuals can reduce the number of diphtheria-infected individuals in the community.
Ilaihi and Widiana [24] developed an SEIR model to examine the effectiveness of vaccines in controlling diphtheria outbreaks. The model analysis and simulation results indicate that the vaccine effectively reduces the spread of diphtheria; however, it serves only as a preventive measure and not as a cure.
In 2018, Matsuyama et al. [32] estimated the basic reproduction number of a diphtheria epidemic in the Rohingya refugee camp in Bangladesh using a statistical method. The threshold value ranged from 4.7 to 14.8, with an estimated median of 7.2. Husain [23], in his study, discusses an SIR model of diphtheria transmission by simplifying assumptions and parameters that influence endemic and non-endemic conditions. The model analyzes and interprets the basic reproduction number of the SIR mathematical model. Findings from Djafaraa et al. [22] indicate that vaccination coverage and booster doses for children are essential in preventing future outbreaks.
Izzati and Andriani [30] explored an SEIQR model to assess the natural immunity rate of exposed individuals in the spread of diphtheria. The model incorporates the coverage of a complete basic immunization program and quarantine as preventive measures. Islam et al. [29] developed a controlled SLIR model to identify latent individuals in the population, illustrating the transmission dynamics of diphtheria epidemics due to their fragile nature. Kanchanarat et al. [31] formulated an SVEAIR diphtheria model incorporating asymptomatic infection, logistic growth, and vaccination to examine the effects of asymptomatic infection and imperfect immunization coverage on controlling the spread of diphtheria. Akhi et al. [21] describe the transmission of diphtheria among high-risk individuals in the Rohingya ethnic group. The model was developed to forecast the impact of a diphtheria outbreak within this population. Ilham et al. [25] proposed a susceptible-infectious-recovered (SIR) model to analyze the impact of booster vaccination in controlling diphtheria and to examine the distribution of diphtheria cases in West Java, Indonesia.
Loyinmi and Ijaola [26] presented a fractional-order SEIR model to investigate the overall effectiveness of various control strategies in mitigating the dynamics of diphtheria transmission. Their numerical simulations demonstrated that the implementation of a combination of these control measures contributes significantly to flattening the diphtheria epidemic curve. Ahmed et al. [27] investigated the transmission dynamics of the diphtheria epidemic using the Caputo fractional derivative approach. The sensitivity analysis of their model indicated that the reduction in contact rate, infection rate and recruitment rate (birth) plays a key role in the control of diphtheria. Kamadjue et al. [28] estimated the generation time of the diphtheria epidemic in Kano using a statistical approach. Their analysis, based on data collected between 18 August 2022 and 29 November 2023 suggests a rapid diphtheria transmission cycle in Kano, with a generation time of approximately 2.8 days.
Building on the above studies, the present study develops a mathematical model of diphtheria transmission dynamics, extending the work of Adewale et al. [20] by incorporating an asymptomatic infection compartment and public enlightenment campaign as a preventive measure. Moreover, we replaced in their model the quarantined of exposed individuals with the isolation of infected individuals to assess the effect of the campaign and isolation on the dynamics of the bacteria. In addition to the stability results of the disease-free and disease-persistence equilibrium points when the basic reproduction number is respectively greater than and less than the unity presented in [20], we fit the proposed model with Kano State outbreak data of diphtheria from January to December 2023. Furthermore, we show via sensitivity analysis that a public enlightenment campaign would have a positive impact if there is compliance from the population in reducing effective contact with infectious agents. It also underscores that isolation of infected individuals would have a positive impact if the proportion of exposed individuals becoming infectious increases together with their associated progression rate to the infected class. This is because the higher the proportion of exposed subpopulation moving to the infectious class, the lower the number of asymptomatic individuals and the higher the isolation rate. On a similar note, the numerical simulation results reveal that combining the public enlightenment campaign and isolation of infected individuals is the best strategy to contain the spread of diphtheria.
The remainder of this paper is organized as follows: Section 2 presents the model formulation, while Section 3 focuses on the model analysis. Section 4 includes the sensitivity analysis of model parameters, along with model fitting and parameter estimation. Numerical simulation results are provided in Section 5. Finally, Section 6 concludes the paper with a summary of the key findings.

2. Model of Diphtheria Transmission

We categorize the human population N ( t ) at any given time t into six compartments: susceptible S, (individuals who can contract diphtheria), exposed E , (individuals who have been exposed to diphtheria but are not yet infectious), asymptomatic A , (individuals who have the disease without symptoms or with mild infection), infected I , (individuals who have the disease and exhibit symptoms), isolated Q , (infected individuals who have been separated from the population), and recovered R , (individuals who have recovered from the disease). The transitions between these compartments are illustrated in Figure 1. The total population N is the sum of these six compartments.
We assume that
(i)
Susceptible individuals have equal chances of contracting the diphtheria disease (i.e., homogeneous mixing).
(ii)
The transmission rate of isolated humans is negligible, so only asymptomatic and infected humans transmit the disease.
(iii)
Force of infection is via frequency dependence incidence,
λ = β ( 1 c ϵ ) θ A + I N ,
where ( 1 c ϵ ) modeled the public enlightenment campaign as in [33].
(iv)
Only infected and isolated infected humans die due to the disease.
One can see from Figure 1 the following systems of nonlinear differential equations is obtained below: (1).
d S d t = π μ S λ S , d E d t = λ S μ E δ E , d A d t = ( 1 p ) δ E μ A γ 2 A , d I d t = p δ E ( μ + α 1 ) I η I γ 1 I , d Q d t = η I ( μ + α 2 ) Q γ 3 Q , d R d t = γ 1 I + γ 2 A + γ 3 Q μ R ,
with
S ( 0 ) = S 0 0 , E ( 0 ) = E 0 0 , A ( 0 ) = A 0 0 , I ( 0 ) = I 0 0 , Q ( 0 ) Q 0 and R ( 0 ) = R 0 0 .
All the variables and parameters of model (1) are assumed to be nonnegative, and they are described in Table 1.

3. Analysis of the Model

3.1. Mathematical Well Posedness

Theorem 1.
The domain D of model (1) defined by
D = ( S , E , A , I , Q , R ) R + 6 : 0 < N π μ ,
is an invariant positive attractor.
Proof. 
We sum the equations of model (1) to obtain
d N d t = π μ N α 1 I α 2 Q .
Upon simplification, we obtain
d N d t π μ N ,
which gives
N ( t ) π μ + N ( 0 ) π μ e μ t .
It follows that if t tends to zero, then N ( t ) approaches N ( 0 ) , which implies that π μ is the upper bound of N ( t ) and N ( t ) π μ provided t tends to + .
Thus, model (1) is well posed and meaningful biologically. □

3.2. Diphtheria Infection-Free Equilibrium (DIFE)

When there is no diphtheria infection in the population, all the infectious compartments of (1) are empty (i.e., E = A = I = Q = R = 0 ). Then, the equilibrium point is
E 0 = S , E , A , I , Q , R = π μ , 0 , 0 , 0 , 0 , 0 .
To establish the linear stability of the equilibria of model (1), we computed the threshold parameter given by R 0 = ρ ( F V 1 ) , known as the basic reproduction number. This parameter is determined using the next-generation operator method described in [13,14]. The associated threshold parameter of model (1) is referred to as the control reproduction number, as it accounts for an isolation and public enlightenment campaign for preventive measures aimed at controlling the spread of diphtheria. We derived the following matrices from the new infection and transition terms of system (1).
F = 0 θ β c ϵ + 1 S N β c ϵ + 1 S N 0 0 0 0 0 0 0 0 0 0 0 0 0 ,
and
V = K 1 0 0 0 1 p δ K 2 0 0 δ p 0 K 3 0 0 0 η K 4 .
The control reproduction number R c is the spectral radius of F V 1 given by
R c = β δ 1 c ϵ [ θ 1 p K 3 + p K 2 ] K 1 K 2 K 3 ,
where
K 1 = μ + δ , K 2 = μ + γ 2 , K 3 = μ + α 1 + η + γ 1 , K 4 = μ + α 2 + γ 3 .
We now present the local asymptotic stability result of the diphtheria infection-free equilibrium in the following theorem.
Theorem 2.
The diphtheria infection free equilibrium of model (1) is stable locally asymptotically in D if R c < 1 and unstable when R c > 1 .
Proof. 
The result follows from [Theorem 2] [13]. □
This local stability result of E 0 allows us to establish its global asymptotic stability result as well.
Theorem 3.
The equilibrium point E 0 of model (1) is stable globally asymptotically in D when R c < 1 and unstable whenever R c > 1 .
Proof. 
We prove the theorem above using the method presented in [34]. Let Y = S , Z = ( E , A , I , Q , R ) and Y * = π μ , 0 for model (1). Then
d Y d t = F ( Y , Z ) = π μ S λ S ,
and
d Z d t = G ( Y , Z ) = λ S μ E δ E ( 1 p ) δ E μ A γ 2 A p δ E ( μ + α 1 ) I η I γ 1 I η I ( μ + α 2 ) Q γ 3 Q γ 1 I + γ 2 A + γ 3 Q μ R ,
If Z = 0 (i.e., E = A = I = Q = R = 0 ), then F ( Y , 0 ) = π μ S with
M = D G ( Y * , 0 ) = K 1 β ( 1 c ϵ ) θ β ( 1 c ϵ ) 0 0 ( 1 p ) δ K 2 0 0 0 p δ 0 K 3 0 0 0 0 η K 4 0 0 γ 1 γ 2 γ 3 μ ,
a matrix with nonnegative off-diagonal entries known as a Metzler matrix. Now, we obtain from G ( Y , Z ) = M Z G ^ ( Y , Z ) that
G ^ ( Y , Z ) = β ( 1 c ϵ ) θ A 1 S N + β ( 1 c ϵ ) I 1 S N 0 0 0 0 .
It can be seen that G ^ ( Y , Z ) 0 as S N . Thus, Y * = π μ , 0 is a stable global asymptotic equilibrium point of d Y d t = F ( Y , 0 ) . Then, it follows from the result in [34] that E 0 is stable globally asymptotically whenever R c < 1 .
Theorem 3 epidemiologically proves that if the control reproduction number can be maintained as less than unity R c < 1 , the number of diphtheria infections can be controlled with the current interventions even if there is a large diphtheria outbreak.

3.3. Endemic Equilibrium Point

The persistence of diphtheria in a community occurs when one or more of the infectious compartments of model (1) is not empty. Such an equilibrium point denoted by
E * = ( S * , E * , A * , I * , Q * , R * ) ,
which is obtained in terms of λ * using Maple 18 software, version 2021 as presented in (12).
S * = π λ * + μ , E * = λ * Π K 1 λ * + μ , A * = δ p λ * Π K 1 K 2 λ * + μ , I * = p 1 δ λ * Π K 1 λ * + μ K 3 , Q * = δ η p λ * Π K 1 K 2 K 4 λ * + μ , R * = Π δ λ * η p K 3 γ 3 p K 2 K 4 γ 2 + p K 3 K 4 γ 1 + K 2 K 4 γ 2 μ K 1 K 2 K 3 K 4 λ * + μ ,
with λ * = β ( 1 c ϵ ) A * θ + I * N * .
To find λ * , we have
λ * ( S * + E * + Q * + R * ) + [ λ * β ( 1 c ϵ ) θ ] A * + [ λ * β ( 1 c ϵ ) ] I * = 0 .
Using Equation (12), we obtain after algebraic simplification the following polynomial in terms of λ * .
λ * ( a λ * b ) = 0 ,
where
a = δ η μ p K 3 + δ η p K 3 γ 3 δ μ p K 2 K 4 + δ μ p K 3 K 4 δ p K 2 K 4 γ 2 + δ p K 3 K 4 γ 1 + δ μ K 2 K 4 + δ K 2 K 4 γ 2 + μ K 2 K 3 K 4 , = K 2 K 4 [ δ ( μ + γ 2 ) ( 1 p ) + μ K 3 ] + δ p K 3 [ η ( μ + γ 3 ) + K 4 ( μ + γ 1 ) ] . b = μ K 4 ( β c δ ϵ p θ K 2 β c δ ϵ p K 3 β c δ ϵ θ K 2 β δ p θ K 2 + β δ p K 3 + β δ θ K 2 K 1 K 2 K 3 ) . = μ i = 1 4 K i ( R c * 1 ) ,
with
R c * = β δ 1 c ϵ [ θ 1 p K 2 + p K 3 ] K 1 K 2 K 3 .
Thus, λ * = 0 corresponds to diphtheria infection-free equilibrium and
λ * = μ i = 1 4 K i ( R c * 1 ) K 2 K 4 [ δ ( μ + γ 2 ) ( 1 p ) + μ K 3 ] + δ p K 3 [ η ( μ + γ 3 ) + K 4 ( μ + γ 1 ) ]
is for the endemic equilibrium E * which exists if R c * > 1 . Hence, model (1) has one endemic equilibrium point.
The uniqueness of E * enable us to establish a global asymptotic stability result in the following theorem.
Theorem 4.
The equilibrium point ( E * ) of diphtheria model (1) is stable globally asymptotically in the interior of the domain D if R c is greater than unity and is unstable otherwise.
Proof. 
To prove this theorem, let β ˜ = β μ ( 1 c ϵ ) π then λ = β ˜ ( θ A + I ) , using N = π μ since π μ is the upper bound for N ( t ) provided N ( 0 ) π μ . From system (1), we have the following relations at steady state.
π = ( μ + λ * ) S * , ( μ + δ ) = λ * S * E * , ( μ + γ 2 ) = ( 1 p ) δ E * A * , ( μ + η + γ 1 + α 1 ) = p δ E * I * , ( μ + γ 3 + α 2 ) = η I * Q * .
To obtain a Lyapunov function, we use the positive definite Volterra function ( V = x 1 ln x ) with respect to each of the state variables in system (1). Let H S = V ( S ) = S * V S S * , then the 1st time derivative of H S is
d d t S * V S S * = 1 S * S [ π μ S β ˜ ( θ A + I ) S ] .
Using the first equation of (14), we have
d d t S * V S S * = 1 S * S μ S * + β ˜ θ A * S * + β ˜ I * S * μ S β ˜ θ A S β ˜ I S , = β ˜ θ A * S * 1 A S A * S * S * S + A A * , + β ˜ I * S * 1 I S I * S * S * S + I I * + μ S * 2 S S * S * S .
Similarly, we obtain H E , H A , H I , and H Q with their associated respective first derivatives after simplification as follows:
H ˙ E = β ˜ θ A * S * 1 E E * + A S A * S * A S E * A * S * E + β ˜ I * S * 1 I S E * I * S * E E E * + I S I * S * , H ˙ A 1 p δ E * 2 A A * A * A , H ˙ I p δ E * 2 I I * I * I , H ˙ Q η I * 2 Q Q * Q * Q .
We now define the Lyapunov function as
H ( S , E , A , I , Q ) = H S + H E + H A + H I + H Q .
Then the derivative of H along the solutions of model (1) is
H ˙ = H ˙ S + H ˙ E + H ˙ A + H ˙ I + H ˙ Q .
It follows from Equation (16) after algebraic simplification that
H ˙ λ * S * 3 S * S E E * S E * S * E μ S * V S S * + V S * S 1 p δ E * V A A * + V A * A p δ E * V I I * + V I * I η I * V Q Q * * + V Q * Q .
For the fact that the arithmetic mean surpasses the geometric mean, we have from the first term of (17) as
3 S * * S E E * S E * S * E 0 .
Also, the terms in the square brackets of (17) are Volterra type functions, which are positive definite. It can be seen that H ˙ < 0 in the interior of the domain D . We obtain H ˙ = 0 if and only if S S * = 1 , E E * = 1 , A A * = 1 , I I * = 1 , and Q Q * = 1 is satisfied. Thus, the singleton set { E * } is the largest invariant set in { ( S , E , A , I , Q ) D : H ˙ = 0 } . Therefore, by applying LaSalle’s invariance principle [35], the result follows. □

4. Model Fitting and Parameter Estimation

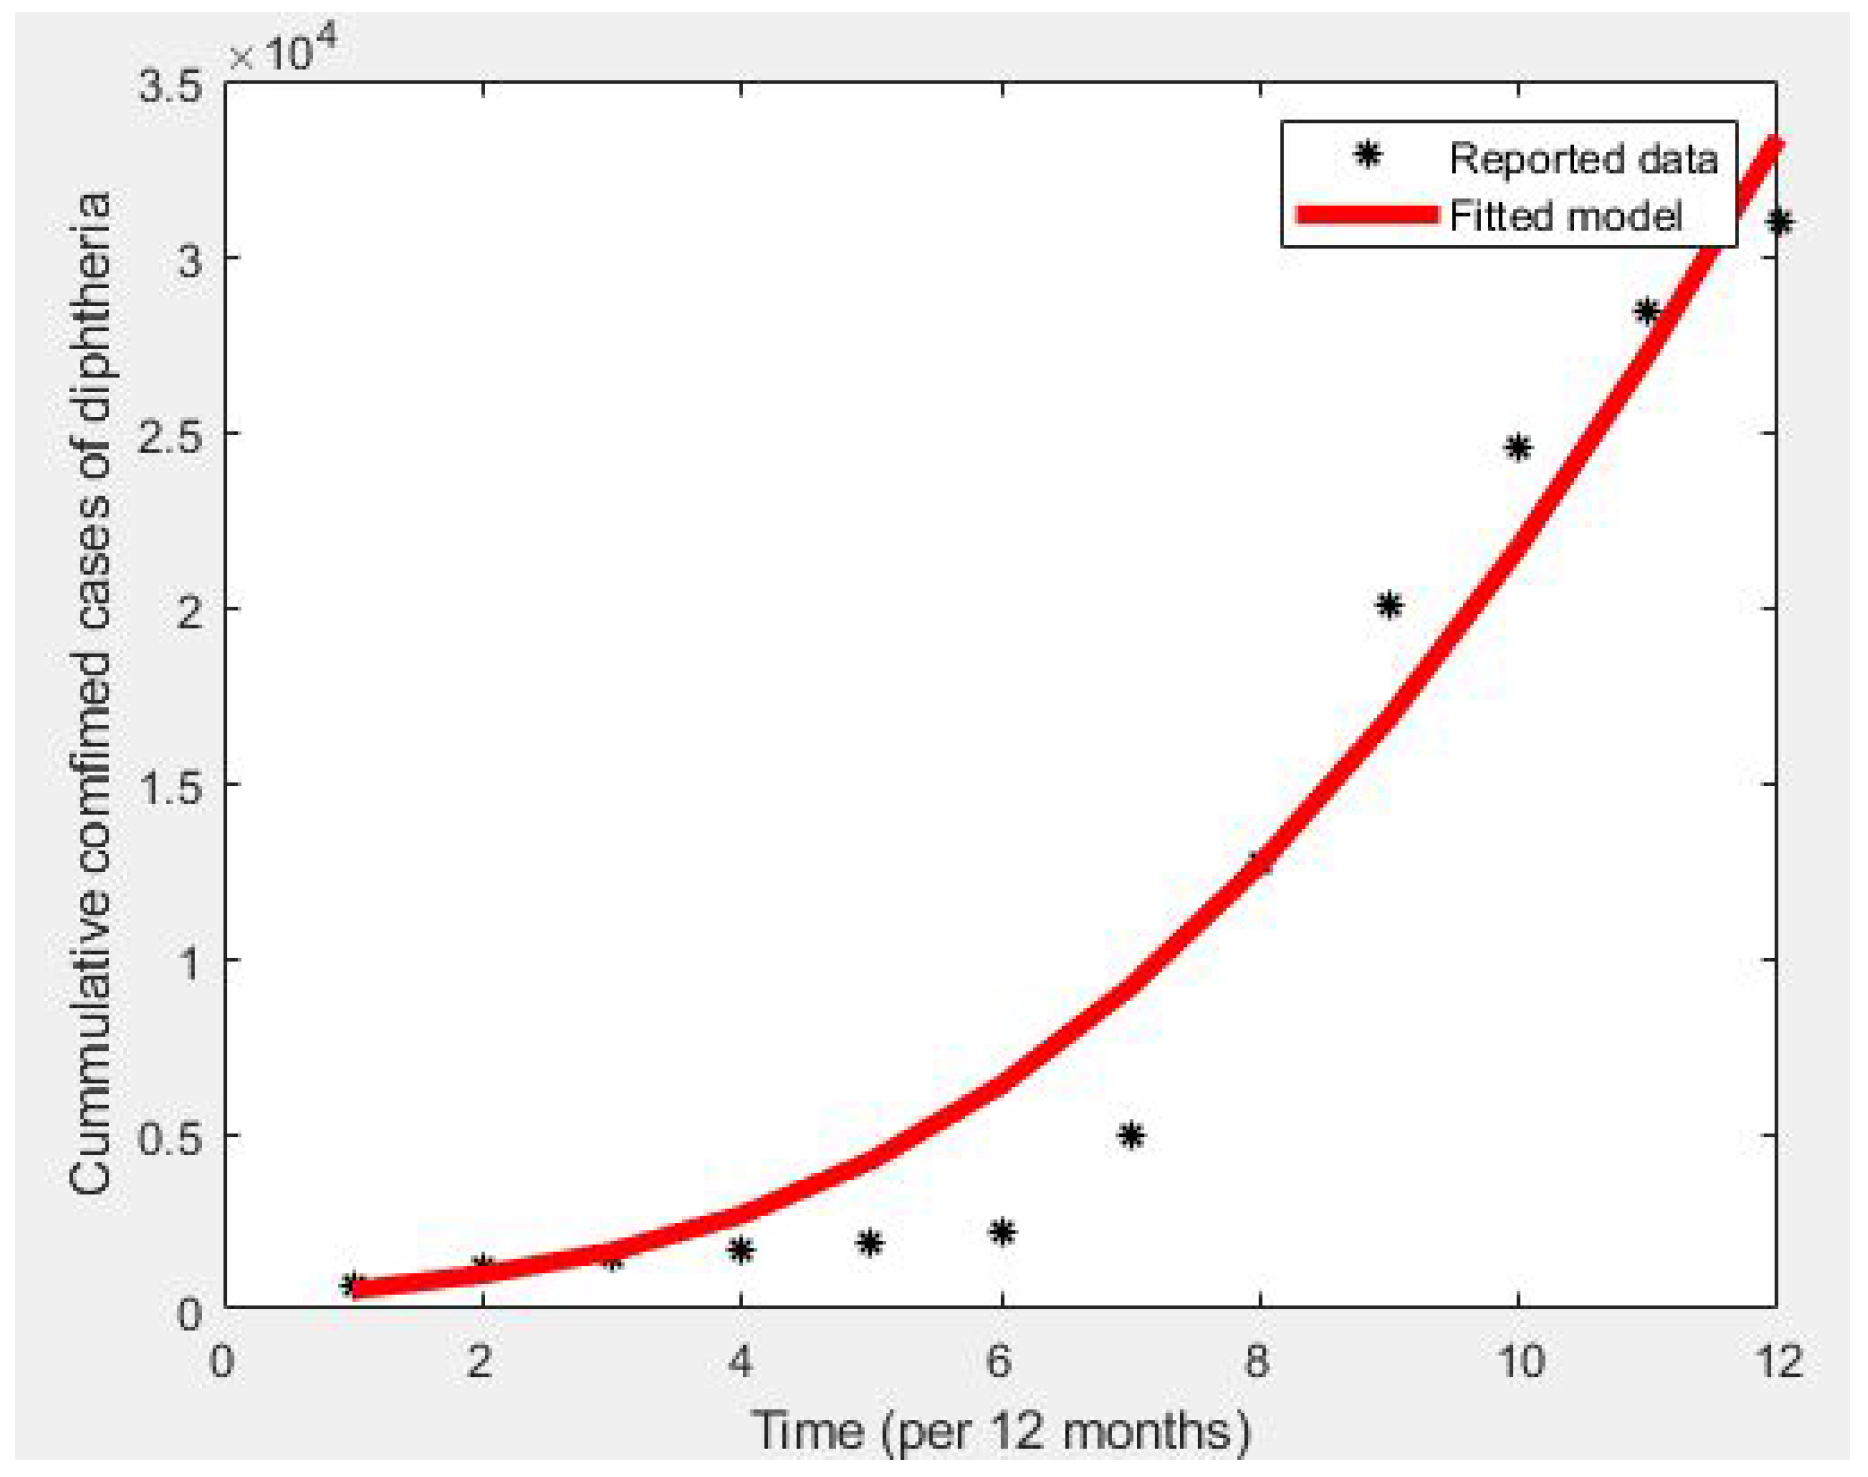
A crucial step in modeling is validating the model using real data and estimating parameter values. Since parameter values are often not directly obtainable from collected data, estimation becomes necessary. Various parameter estimation methods exist, with the least squares method being the most commonly used. Data from the Kano State Ministry of Health, covering the period from January to December 2023, were used to fit the model using the least squares method. Table 2 lists the estimated model parameters obtained through this fitting process. The best-fitting curve of model (1) is illustrated in Figure 2.

4.1. Most Sensitive Parameters

In this part, we evaluate the effect of each model parameter on the associated threshold parameter, R c . This analysis aids in designing effective control strategies to contain the spread of diphtheria within a community. To assess the impact of each parameter on R c , we employ the normalized forward sensitivity index, as described in [37].
The sensitivity index of R c with respect to a given parameter, say ( η ), is defined as follows:
χ η R c = η R c × R c η = K 3 + p K 2 K 3 .
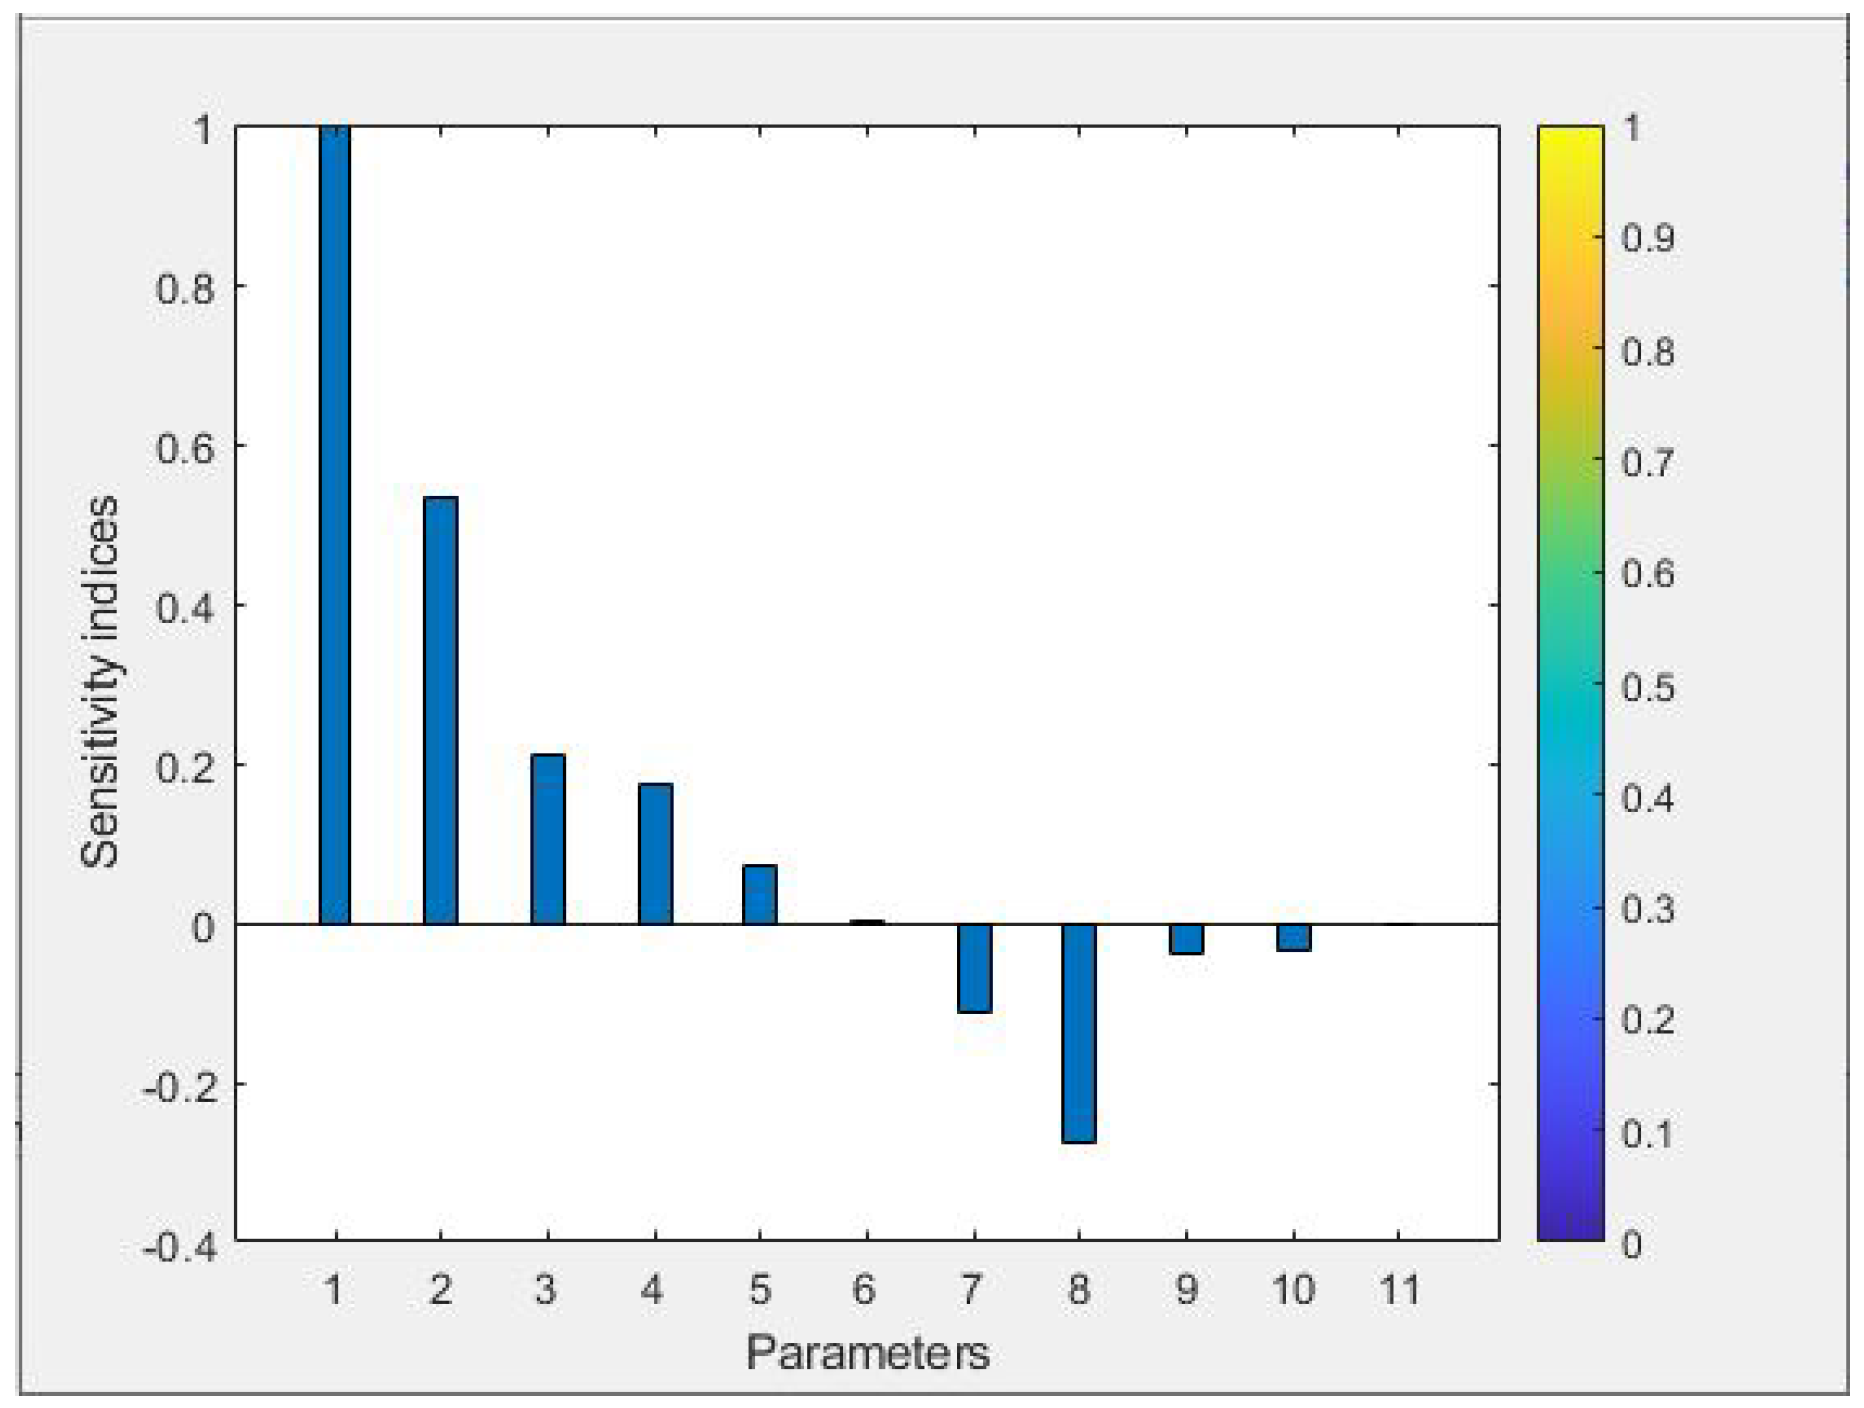
Using a similar approach as for η , we computed the sensitivity indices for the remaining eight model parameters, utilizing the parameter values from Table 2. The results are presented in Table 3, where the parameters are arranged in order of sensitivity, from the most to the least sensitive.
As shown in Table 3 and Figure 3, parameter β is the most sensitive, while p is the least sensitive. Moreover, parameters with positive sensitivity indices have a direct relationship with R c , meaning that an increase (or decrease) in these parameters results in an increase (or decrease) in R c . Conversely, parameters with negative sensitivity indices have an inverse relationship with R c , so a decrease in these parameters leads to an increase in R c and vice versa. Therefore, the persistence of diphtheria infection can be mitigated by either decreasing a parameter with a positive sensitivity index or increasing a parameter with a negative sensitivity index.

4.2. Surface Plots of Some Model Parameters with R c

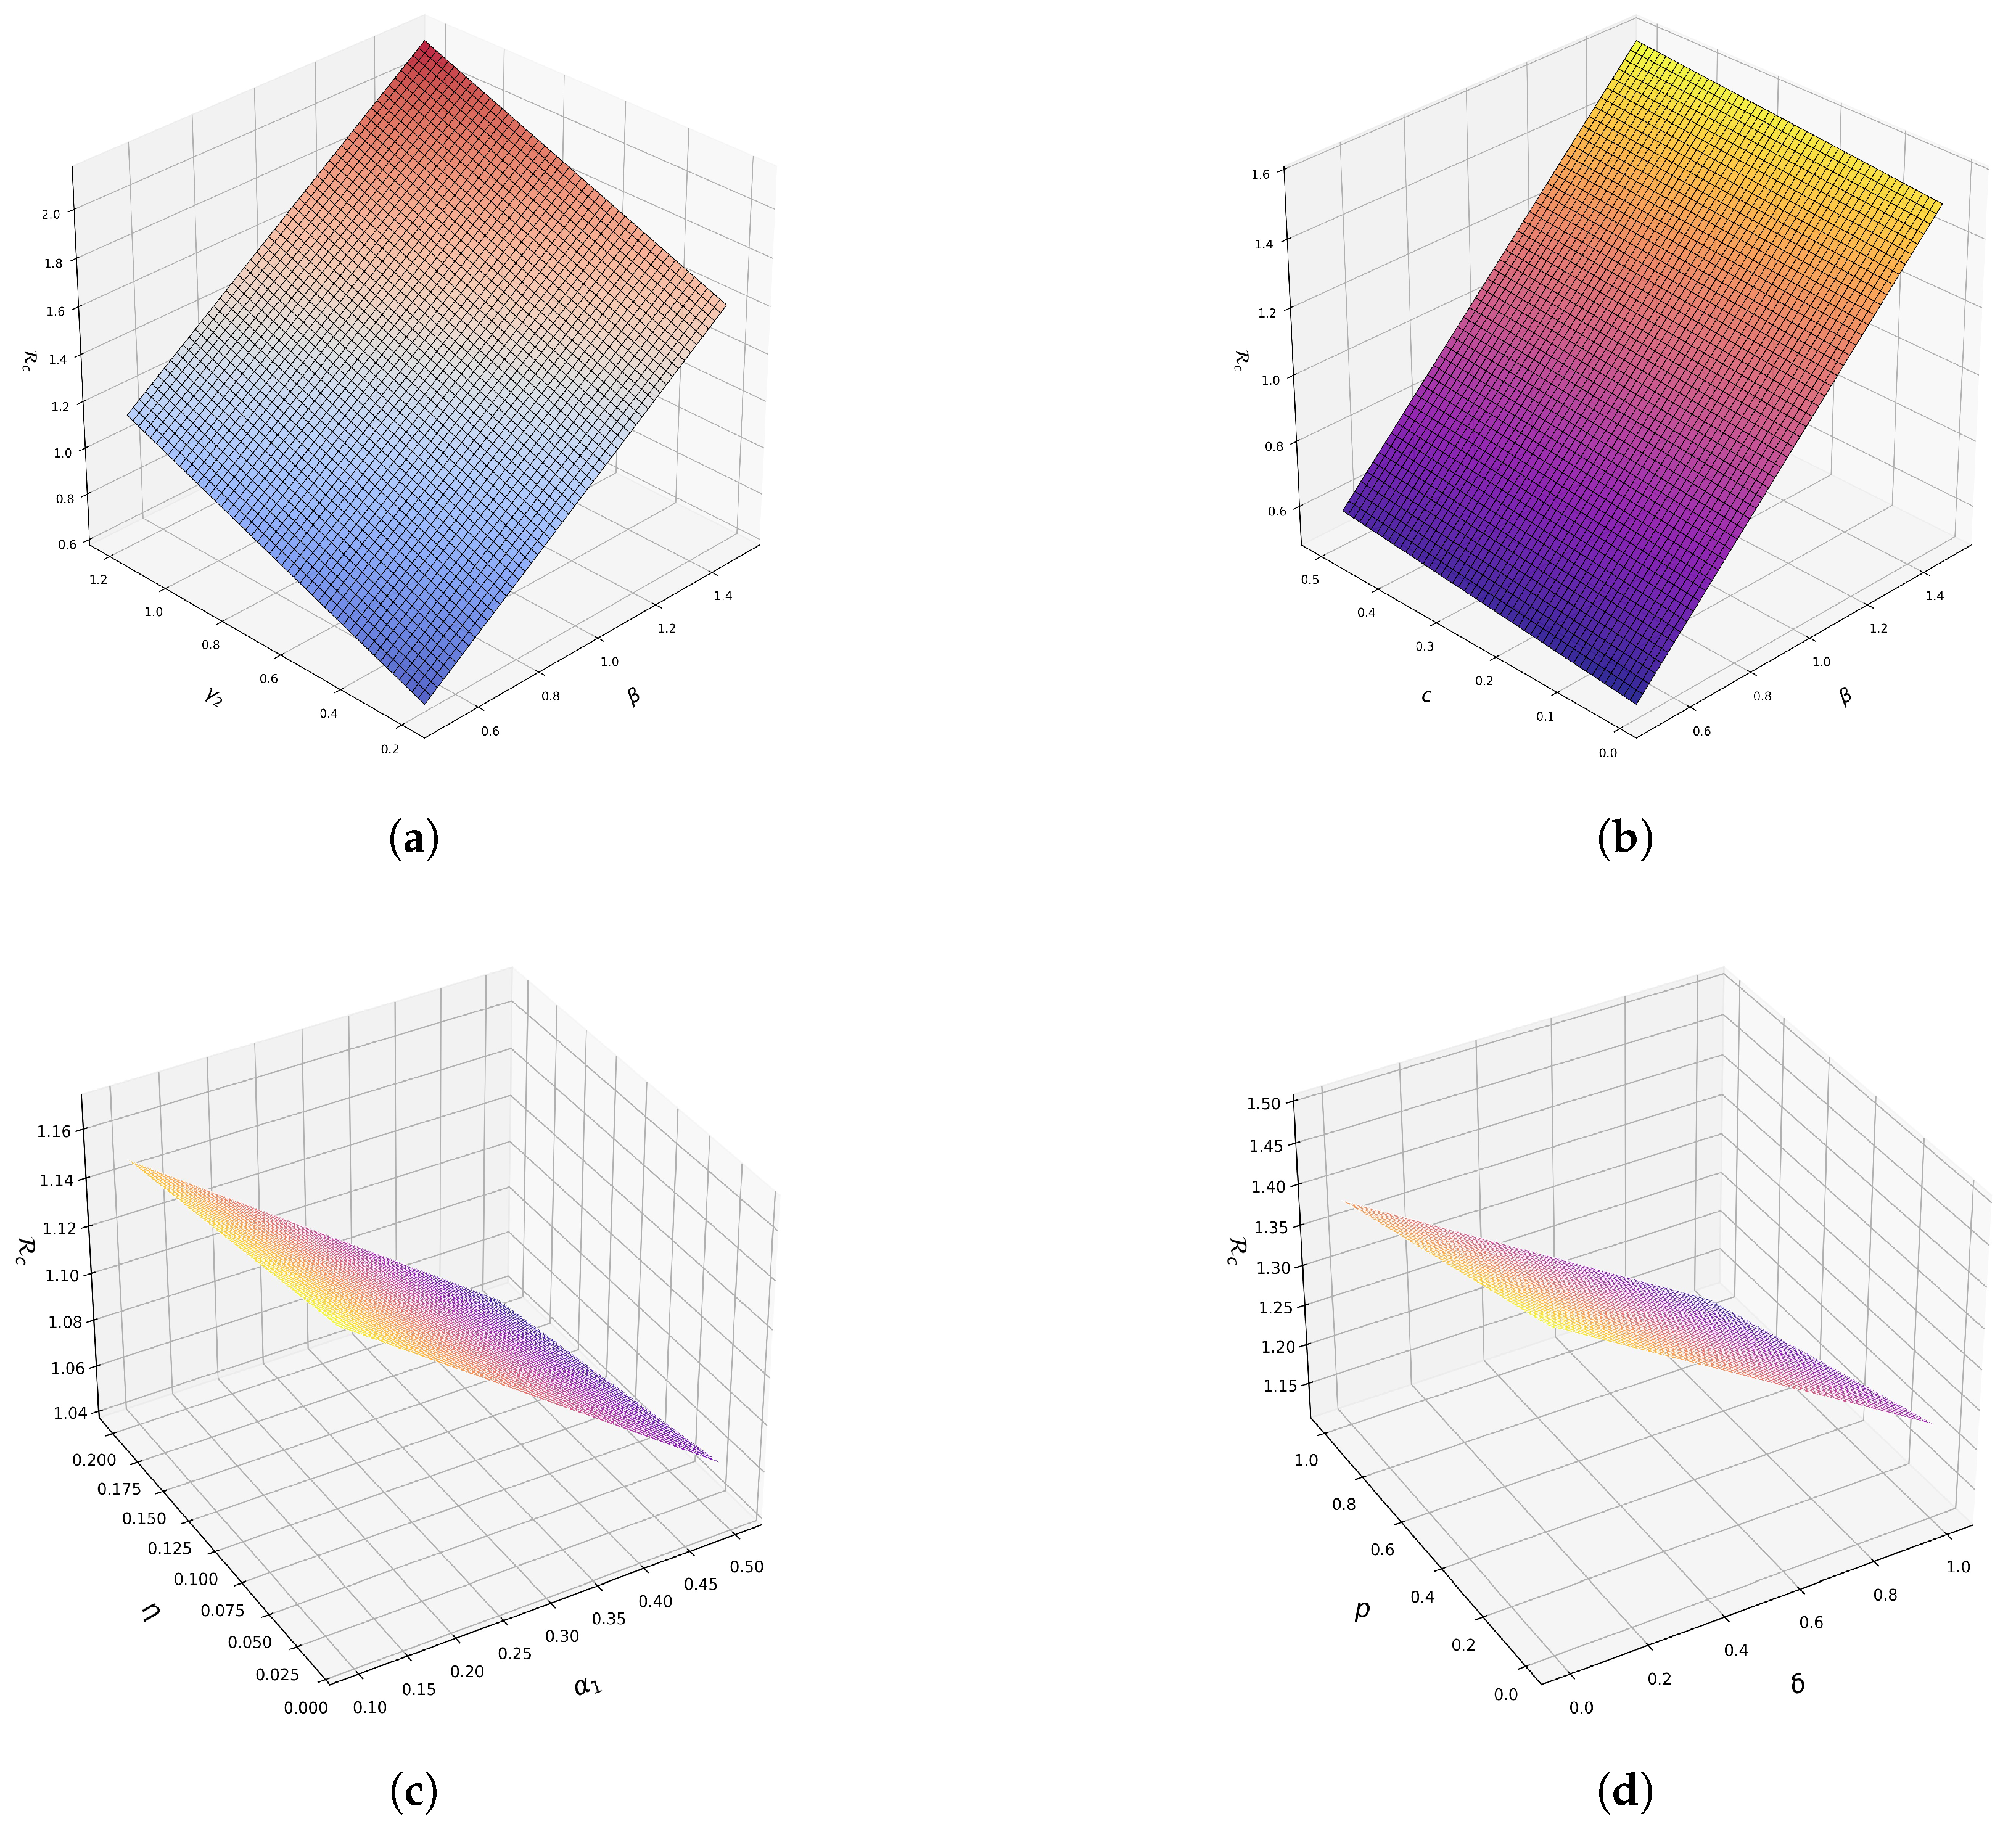
Surface plots provide insight into the interrelation between transmission, control measures, and disease severity, helping to determine the persistence or eradication of infectious diseases such as diphtheria. In this section, we analyze the impact of β , c, γ 2 , α 1 , η , δ , and p on R c through a series of surface plots.
The surface plot in Figure 4a indicates that the value of R c increases as the contact rate β increases despite the increasing recovery rate ( γ 2 ) of asymptomatic individuals, leading to persistence of the disease in the community. Also, in Figure 4b, the threshold parameter R c increases with β , although the rate of public enlightenment campaign c is increasing as well. This reveals that a high-level public enlightenment campaign without compliance of the healthy population to reduce contact with infectious agents could lead to the spread of diphtheria.
On the other hand, as shown in Figure 4c, increasing the isolation rate of infected individuals η and the disease-induced death rate α 1 reduced the value of R c . This is because as the value of these two parameters increases, the infectious pool decreases in the community resulting in low persistence of diphtheria. On a similar note, R c decreases when both the proportion of exposed individuals becoming infected (p) and the rate at which they become infectious ( δ ) increase. This occurs as the pool of infected individuals is more than that of the exposed, leading to high isolation rate of infectious agents. This scenario shows the positive impact of isolation in reducing the spread of diphtheria and the negative contribution of asymptomatic individuals for the spread of the disease in the community.
Moreover, these results suggest that a well-implemented public enlightenment campaign such as Radio jingles, Billboards, Newspaper, community engagement and social media platforms can effectively mitigate the spread of diphtheria, particularly in high-density areas. Also, enhancing case identification, improving isolation protocols, and increasing disease progression rates through early diagnosis can effectively eradicate diphtheria outbreaks. Therefore, public health workers and policymakers should prioritize rapid case detection, efficient isolation measures for the infected subpopulation, and strengthened healthcare responses to reduce diphtheria spread within communities.

5. Numerical Simulations

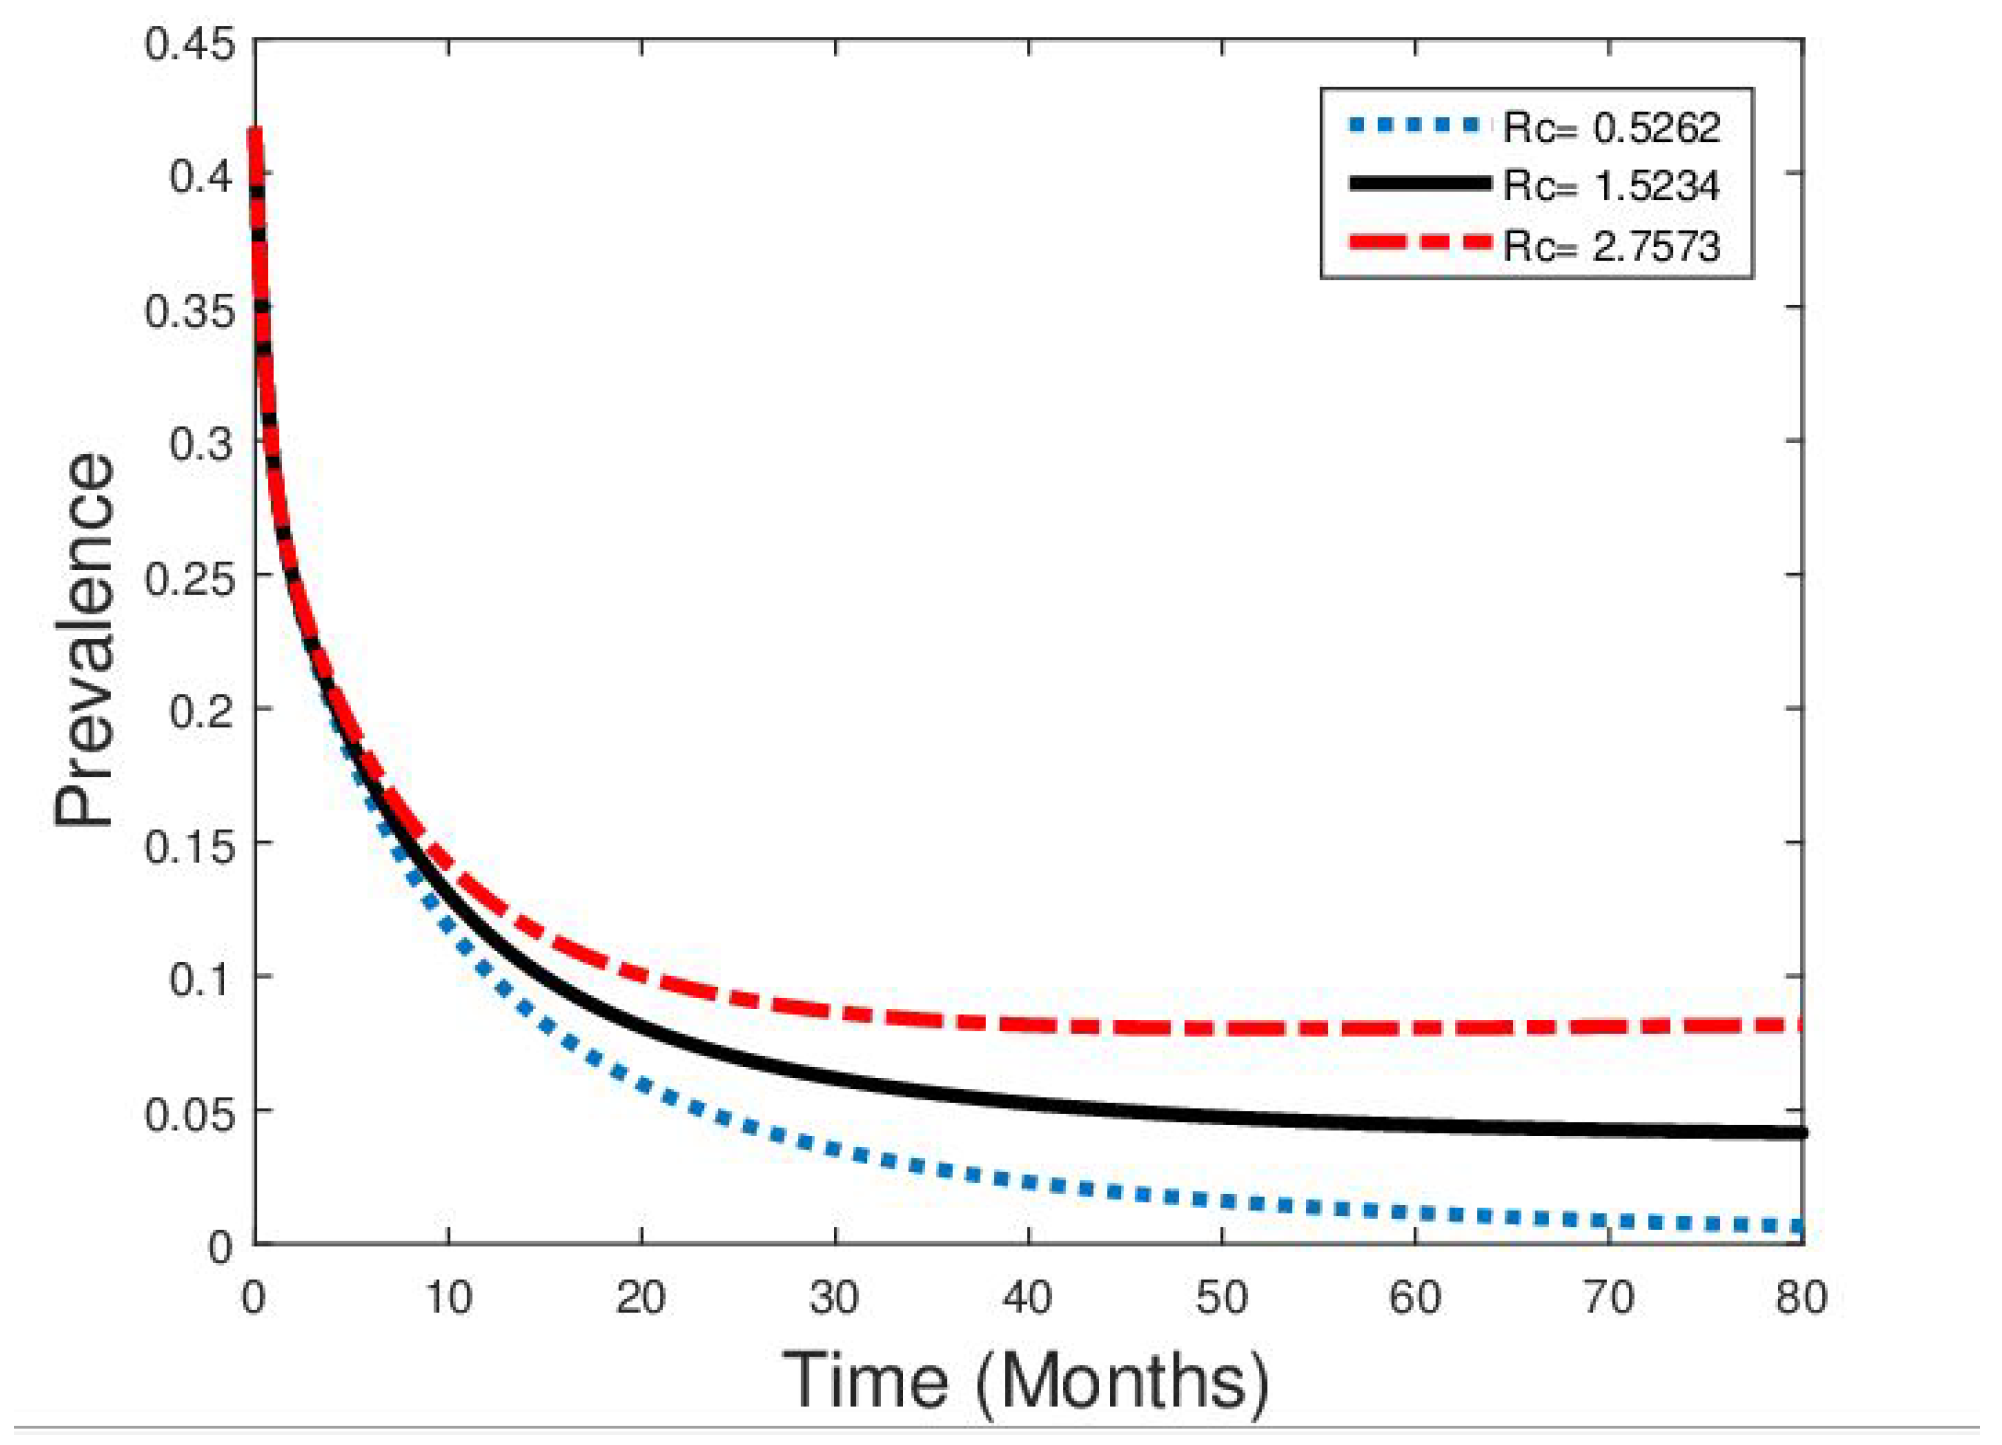
To gain a clear understanding of the positive impact of the public enlightenment campaign on model (1), a plot of diphtheria prevalence over time is shown in Figure 5. This figure illustrates that when both the campaign rate and its efficacy are high, diphtheria prevalence remains low. In this scenario, the control reproduction number is less than unity ( R c = 0.5262 < 1 ) , while the basic reproduction number remains greater than one ( R 0 = 2.7822 > 1 ) , indicating a reduction in diphtheria prevalence due to the combined effect of a high campaign rate and its efficacy.
Conversely, when either the campaign rate is sufficient but its efficacy is less ( R c = 1.5234 < R 0 = 2.7822 ) or the campaign rate is not sufficient but its efficacy is high ( R c = 2.7573 < R 0 = 2.7822 ) , diphtheria prevalence increases, with the latter scenario showing a greater rise. These three cases highlight that the most effective strategy for diphtheria eradication is a combination of both a sufficient public enlightenment campaign rate and high efficacy.
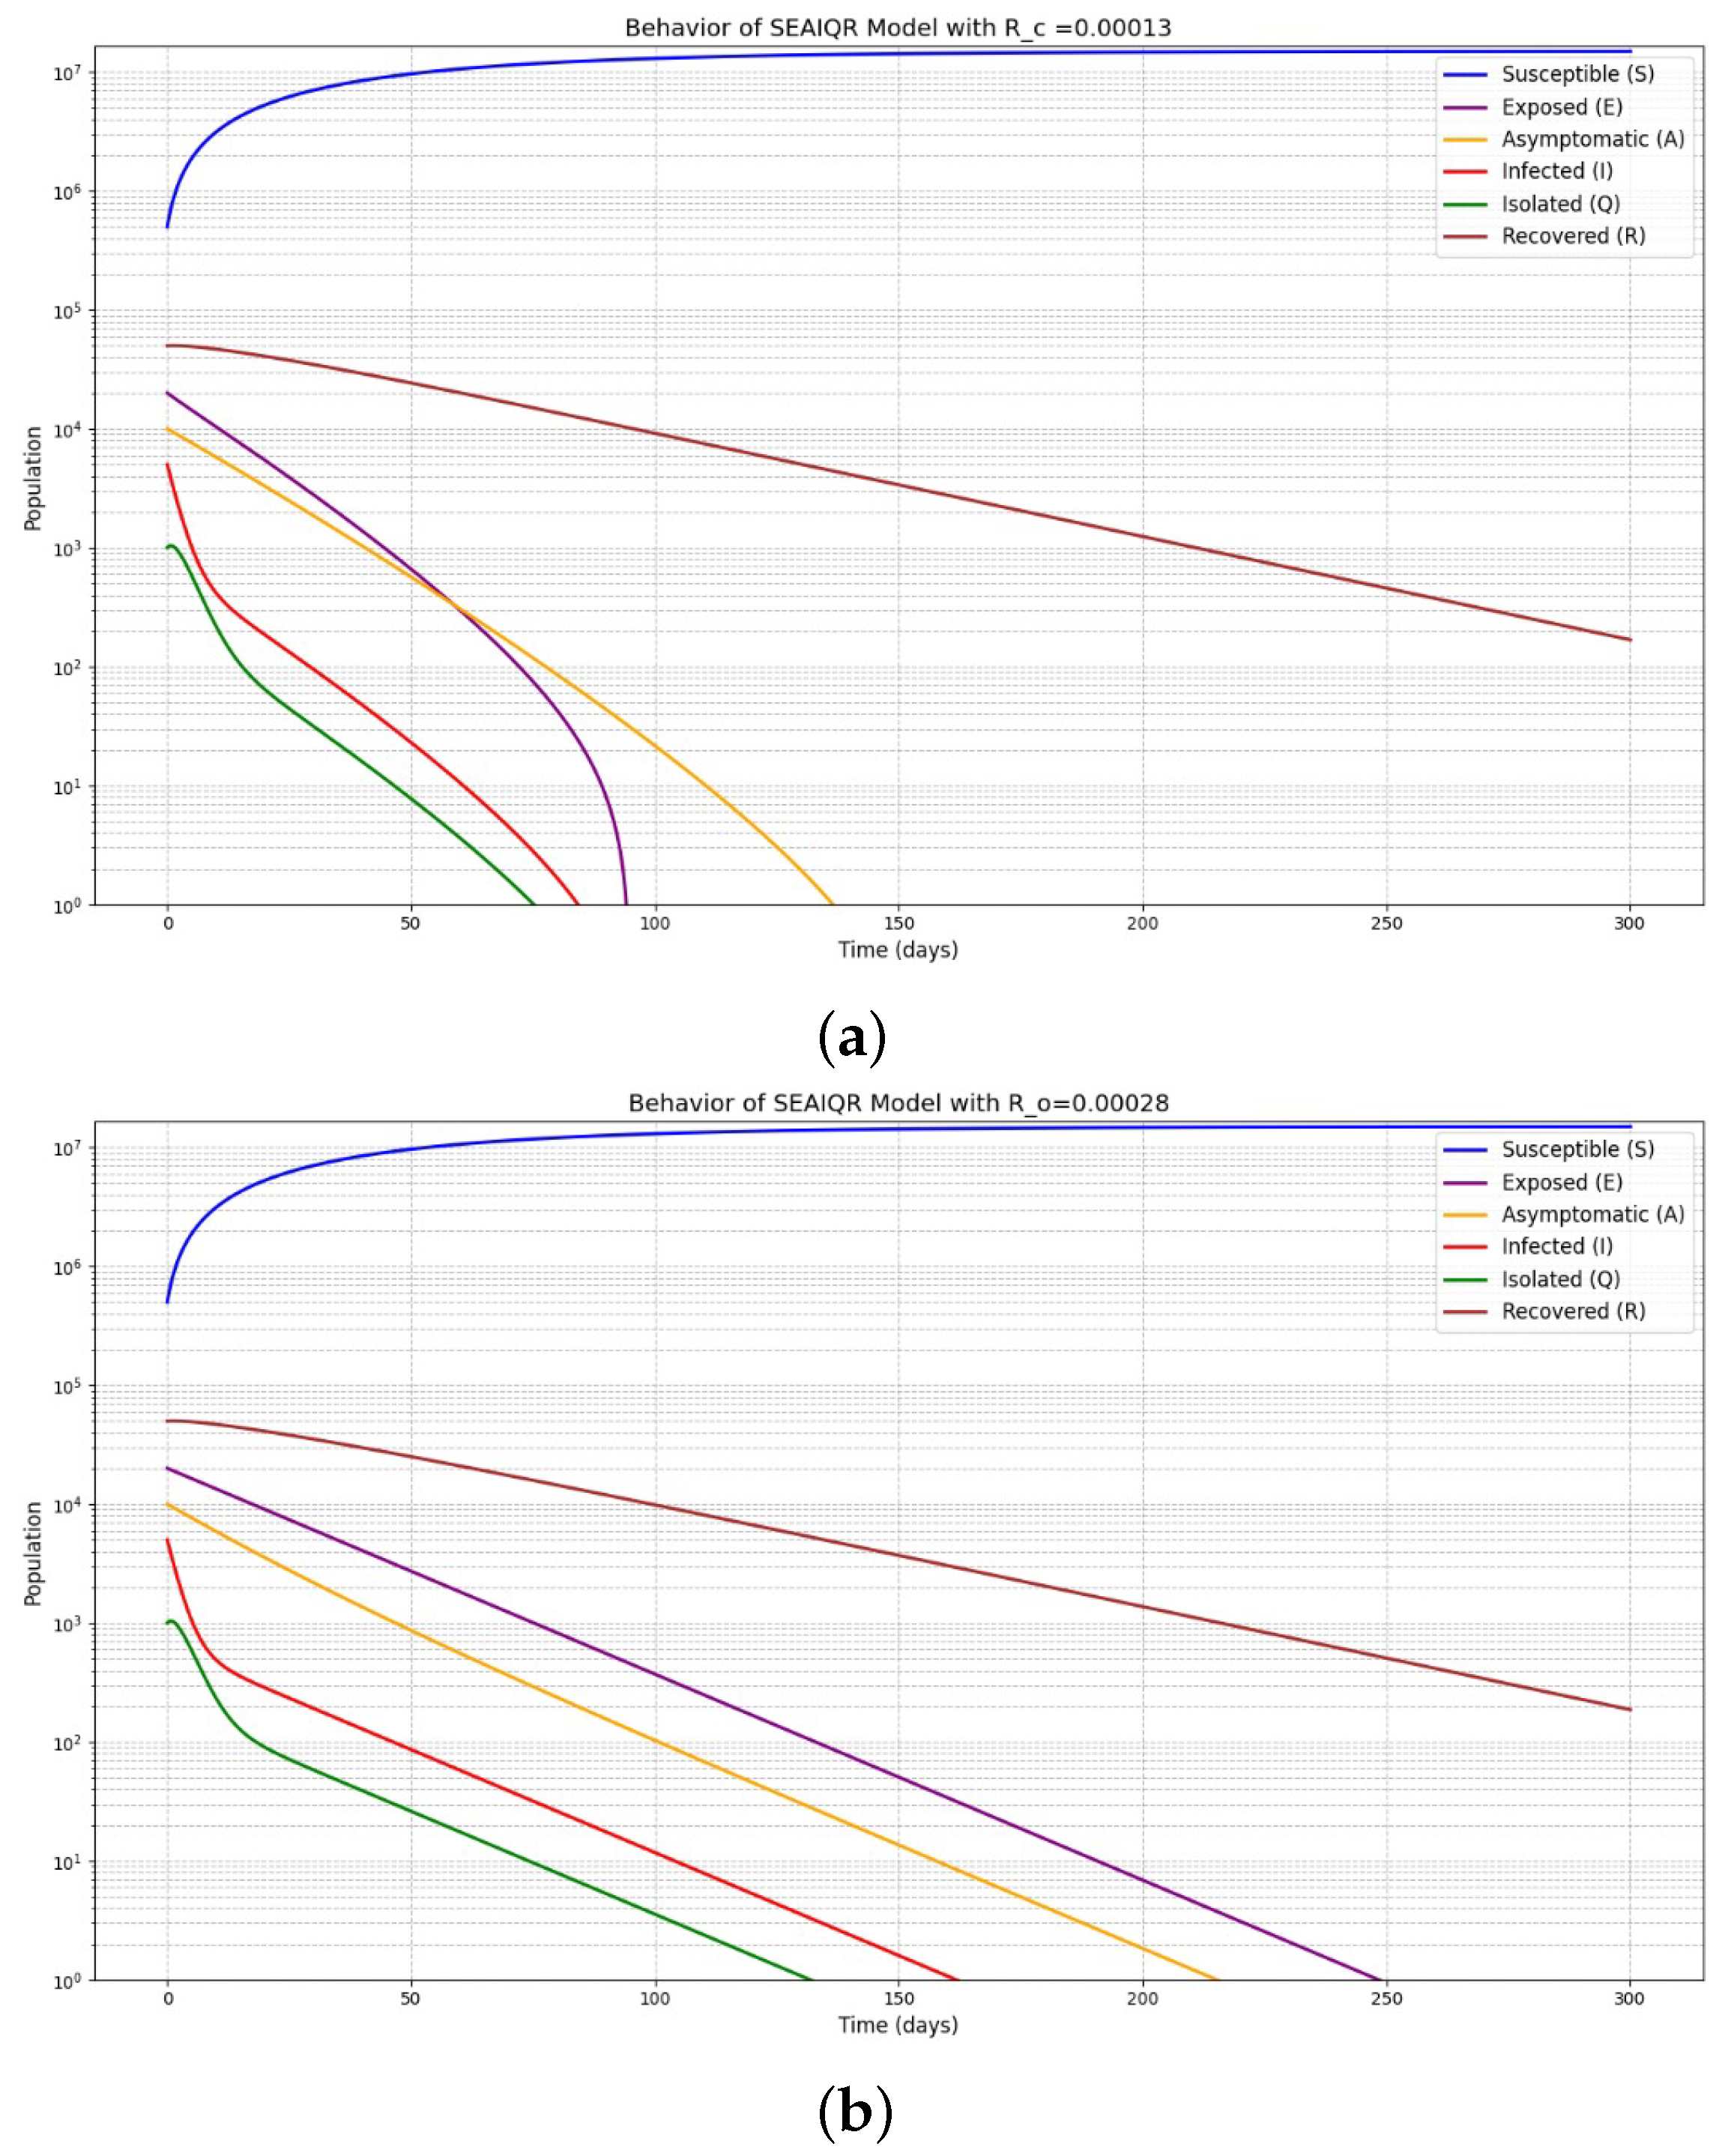
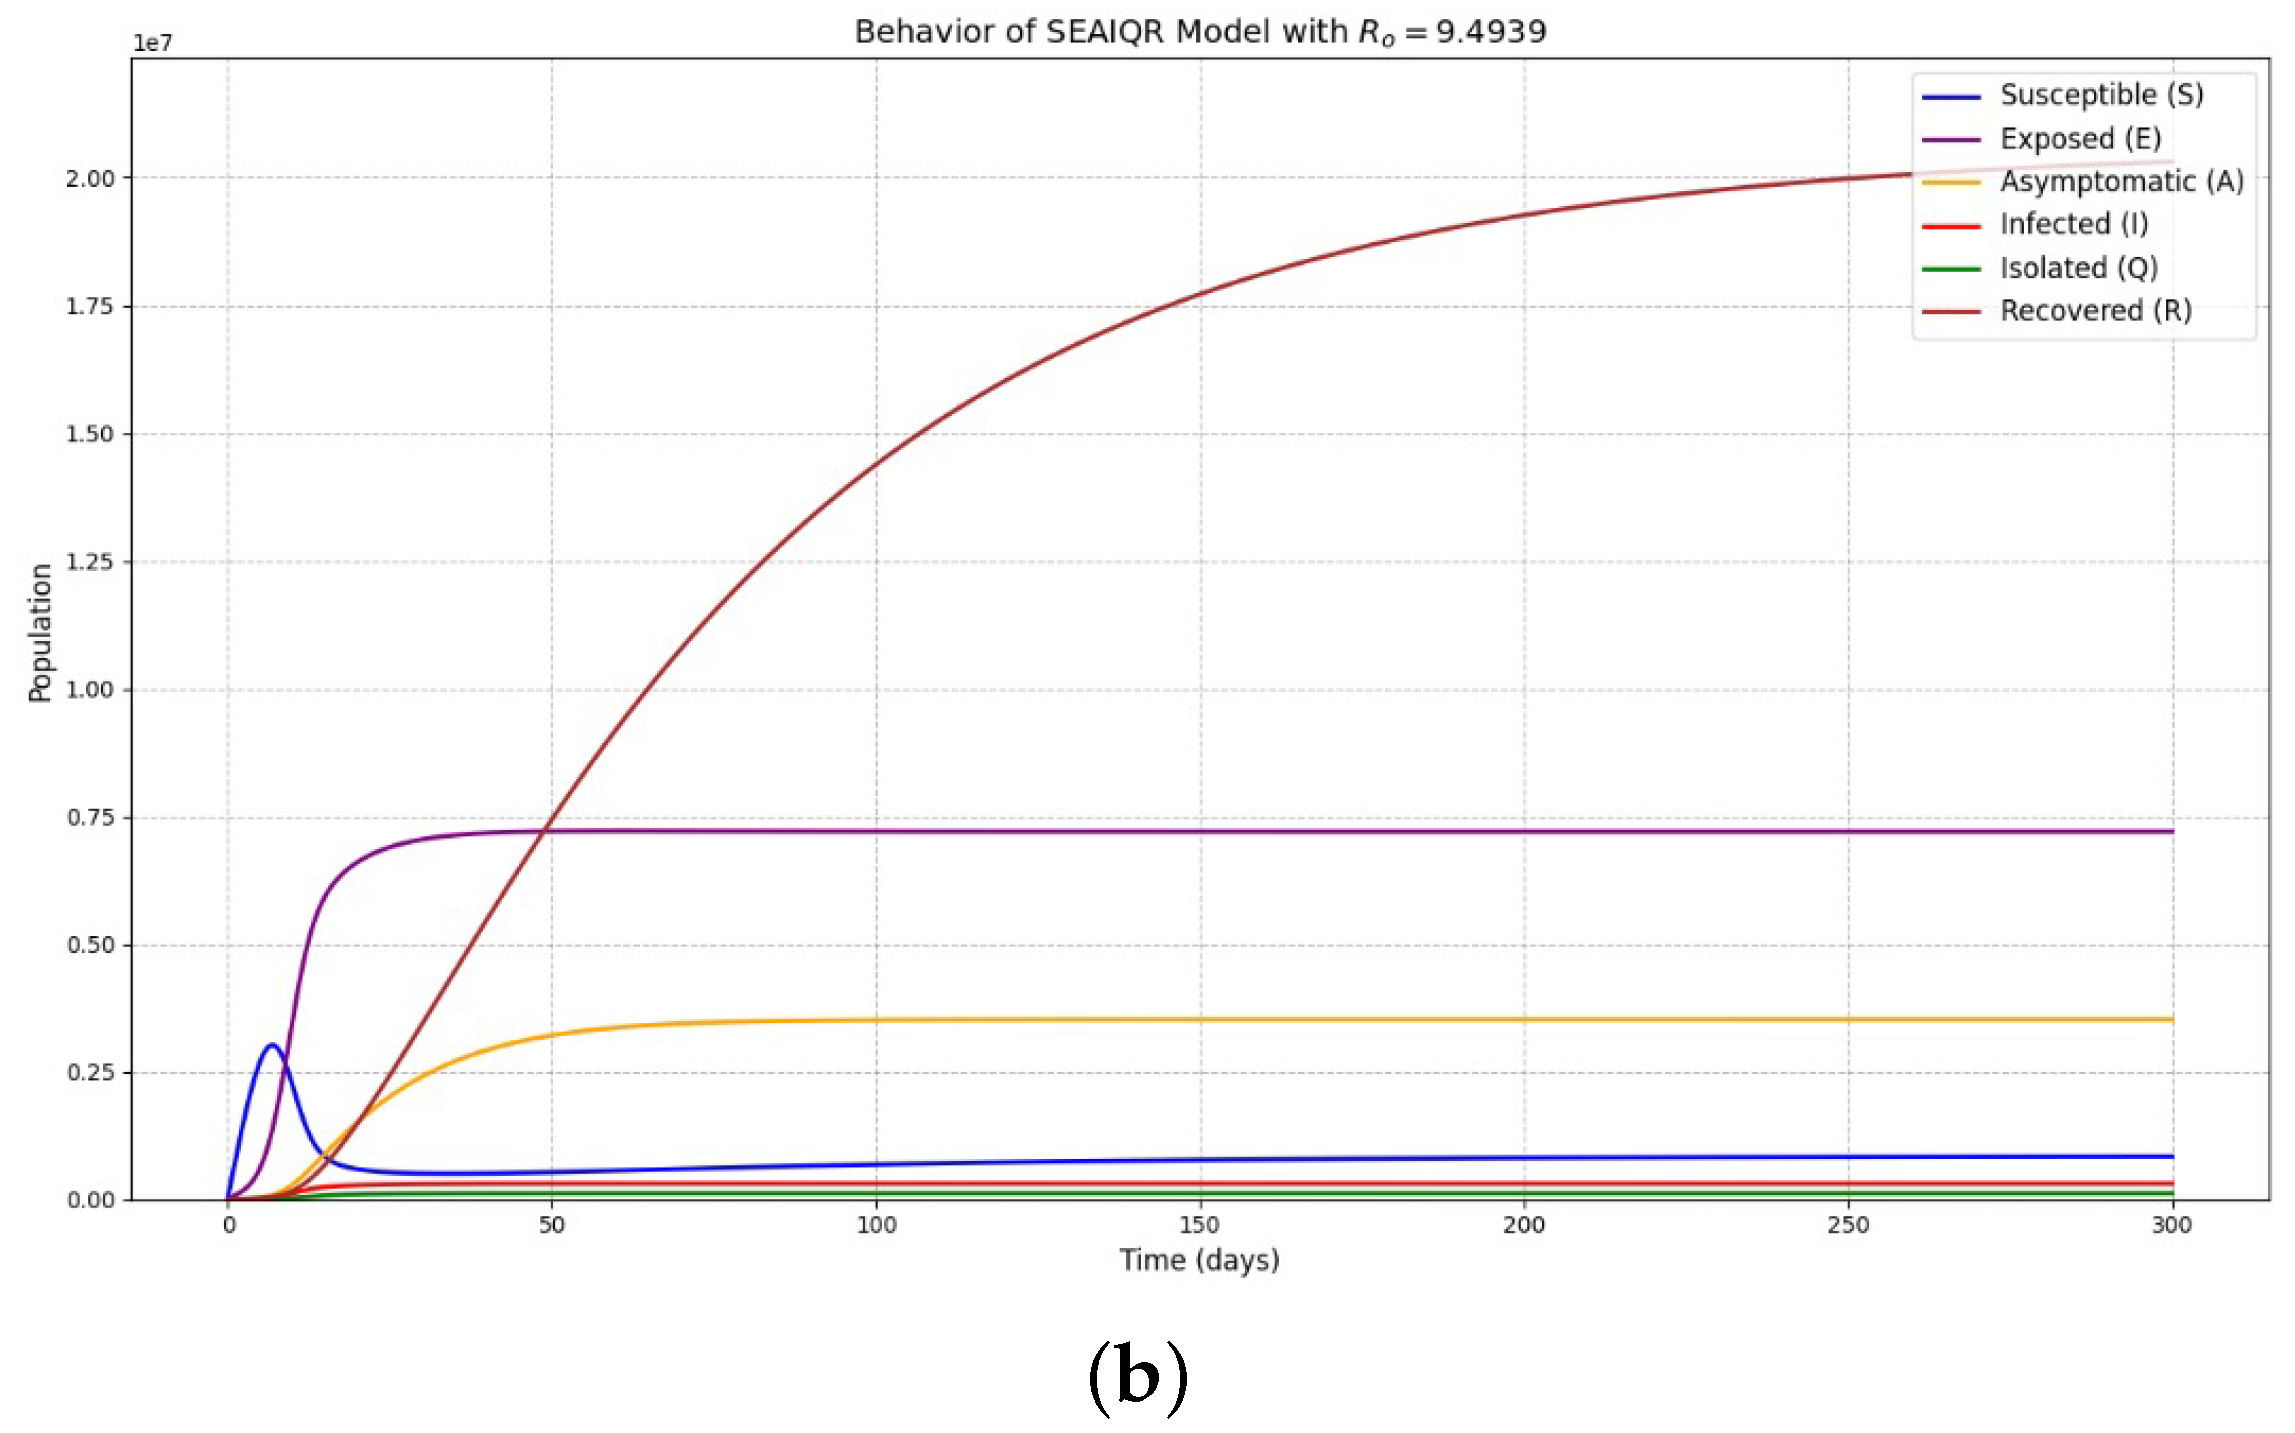
We also present time-series plots in Figure 6 and Figure 7 to examine the behavior of each subpopulation when both R c and R 0 are less than and greater than one, respectively.
As shown in Figure 6, when both threshold parameters are less than unity, the infectious subpopulation declines to zero within a finite time. This indicates that diphtheria infection will eventually die out. Furthermore, the infectious classes diminish more rapidly in Figure 6a compared to Figure 6b, highlighting the positive impact of the public enlightenment campaign and isolation of infectious agents. Conversely, when both R c and R 0 are greater than one, the disease persists endemically, as depicted in Figure 7. Despite this persistence, the susceptible, exposed, and asymptomatic subpopulation are larger in Figure 7a than in Figure 7b), which can be attributed to the effect of the public enlightenment campaign and isolation strategies. These findings suggest that a public enlightenment campaign and isolation of infected humans could significantly reduce the spread of diphtheria infection within a community.

6. Conclusions

We developed an extended version of the diphtheria transmission dynamics model originally proposed by Adewale et al. (2017) [20]. In this extension, we incorporated an asymptomatic infection compartment and replaced the quarantine of infected individuals with isolation. Additionally, the model accounts for the role of the public enlightenment campaign as a control intervention to effectively mitigate diphtheria outbreaks. We demonstrated that the proposed diphtheria model is well-posed and computed the threshold parameter R c , which governs the spread of diphtheria infection.
Some key findings from our qualitative and quantitative analyses are as follows:
i.
The diphtheria infection-free equilibrium of model (1) exhibits both local and global asymptotic stability, indicating that the disease will be eradicated if R c < 1 .
ii.
The existence of an endemic equilibrium in the presence of diphtheria infection has been confirmed. This equilibrium is shown to be globally asymptotically stable when R c > 1 , implying that diphtheria will persist as long as asymptomatic or infected individuals continue to generate new cases within the population.
iii.
A nonlinear least squares curve-fitting approach, utilizing MATLAB’s version 2023 optimization toolbox, was employed to fit the model to the data of Kano State confirmed cases from January to December 2023.
iv.
Sensitivity analysis identified the effective contact rate ( β ) as the most sensitive model parameter. Additionally, ( β ) is associated with the public enlightenment campaign c and its efficacy ( ϵ ) . Thus, prioritizing ( c ) and ( ϵ ) is crucial for effectively managing diphtheria outbreaks.
vi.
We show via sensitivity analysis that a public enlightenment campaign would have a positive impact on the community if the efficacy of the campaign is high. It also underscores that isolation of infected individuals would have a positive impact when the proportion of exposed individuals becoming infectious is large and their associated progression rate to the infected class is high. This is because the higher the proportion of exposed subpopulation moving to the infectious class, the lower the number of asymptomatic individuals and the higher the isolation rate. On a similar note, the numerical simulation results reveal that combining the public enlightenment campaign and isolation of infected individuals is the best strategy to contain the spread of diphtheria.
v.
Numerical simulations of model (1) demonstrated that increasing the level of an effective public enlightenment campaign significantly reduces the prevalence of diphtheria in the population.
In conclusion, this study is limited to the assessment of the effects of some non-pharmaceutical control strategies on the dynamics of diphtheria in the community. For further study, it may be instructive to incorporate some pharmaceutical control measures of the disease to investigate the best strategy or combined strategies among them for effective diphtheria eradication.

Author Contributions

Conceptualization, S.M. and S.U.; methodology, S.M., S.U. and I.A.; software, I.A. and C.K.; validation, S.M., S.U., I.A., J.T. and C.K.; formal analysis, S.M. and S.U.; investigation, J.T.; resources, C.K.; data curation, S.M., S.U. and I.A.; writing—original draft preparation, S.M., S.U. and I.A.; writing—review and editing, J.T. and C.K.; visualization, S.M. and S.U.; supervision, J.T. and C.K.; project administration, J.T. and C.K.; funding acquisition, J.T. and C.K. All authors have read and agreed to the published version of the manuscript.

Funding

This research was funded by King Mongkut’s University of Technology North Bangkok. Contract no. KMUTNB-67-KNOW-28.

Data Availability Statement

All the data analyses are included in this article.

Acknowledgments

The authors acknowledge the financial support provided by King Mongkut’s University of Technology North Bangkok (KMUTNB).

Conflicts of Interest

The authors declare no conflicts of interest.

References

  1. Centers for Disease Control and Prevention (CDC). Available online: http://www.cdc.gov (accessed on 30 December 2023).
  2. Nigerian Center for Disease Control and Prevention. Available online: www.ncdc.gov.ng (accessed on 30 December 2023).
  3. Islam, Z. Developing a Mathematical Model for Optimal Cost-Effective Treatment Strategies Applied to a Diphtheria Outbreak. 2020. Available online: http://lib.buet.ac.bd:8080/xmlui/handle/123456789/5873 (accessed on 30 December 2023).
  4. Momani, S.; Batiha, I.M.; Bendib, I.; Al-Nana, A.; Ouannas, A.; Dalah, M. On finite-time stability of some COVID-19 models using fractional discrete calculus. Comput. Methods Programs Biomed. Update 2025, 7, 100–188. [Google Scholar]
  5. Momani, S.; Batiha, I.M.; Hijazi, M.S.; Bendib, I.; Ouannas, A.; Anakira, N. Fractional-Order SEIR Model for COVID-19: Finite-Time Stability Analysis and Numerical Validation. Int. J. Neutrosophic Sci. (IJNS) 2025, 26, 266–282. [Google Scholar]
  6. Oyeyemi, B.O.; Suleiman, A.O.; Suleiman, B.M.; Ajetomobi, B.M.; Ibrahim, A. A report of two clusters of diphtheria outbreak involving three contiguous Local government areas in Katsina State. Abstract 013 presented at Annual General and Scientific conference of the Paediatric Association of Nigeria. Niger. J. Paediatr. 2011, 38, 10–64. [Google Scholar]
  7. Sadoh, A.E.; Okhakhu, A.; Omuemu, V.; Lofor PV, O.; Oviawe, O. Diphtheria in Nigeria: Is there resurgence? Ann. Biomed. Sci. 2009, 8. [Google Scholar] [CrossRef]
  8. Blythe, S.P. Towards a Unified Theory of Mixing and Pair Formation; Department of Rural Sociology [New York State College of Agriculture and Life Sciences]: New York, NY, USA, 1990; Volume 2. [Google Scholar]
  9. Blythe, S.; Busenberg, S.; Castillo-Chavez, C. Affinity in paired event probability. Math. Biosci. 1995, 128, 265–284. [Google Scholar] [CrossRef] [PubMed]
  10. Busenberg, S.; Castillo-Chavez, C. Interaction, pair formation and force of infection terms in sexually transmitted diseases. In Mathematical and Statistical Approaches to AIDS Epidemiology; Springer: Berlin/Heidelberg, Germany, 1989; pp. 289–300. [Google Scholar]
  11. Brauer, F. Epidemic models with treatment and heterogeneous mixing. Bull. Math. Biol. 2008, 70, 1869–1885. [Google Scholar] [CrossRef]
  12. Brauer, F. Age-of-infection and the final size relation. Math. Biosci. Eng. 2008, 5, 681–690. [Google Scholar] [PubMed]
  13. van den Driessche, P.; Watmough, J. Reproduction numbers and sub-threshold endemic equilibria for compartments models of disease transmission. Math. Biosci. 2002, 180, 29–48. [Google Scholar] [CrossRef]
  14. Diekmann, O.; Heesterbeek JA, P.; Roberts, M.G. The construction of next-generation matrices for compartmental epidemic models. J. R. Soc. Interface 2010, 7, 873–885. [Google Scholar] [CrossRef] [PubMed]
  15. Hethcote, H.W. The mathematics of infectious diseases. SIAM Rev. 2000, 42, 599–653. [Google Scholar] [CrossRef]
  16. Hethcote, H.W. An age-structured model for pertussis transmission. Math. Biosci. 1997, 145, 89–136. [Google Scholar] [CrossRef]
  17. Hethcote, H.W. Three basic epidemiological models. In Applied Mathematical Ecology; Springer: Berlin/Heidelberg, Germany, 1989; pp. 119–144. [Google Scholar]
  18. Hethcote, H.W.; Stech, H.W.; van den Driessche, P. Periodicity and stability in epidemic models: A survey. In Differential Equations and Applications in Ecology, Epidemics, and Population Problems; Academic Press: Cambridge, MA, USA, 1981; pp. 65–82. [Google Scholar]
  19. Hethcote, H.W. An immunization model for a heterogeneous population. Theor. Popul. Biol. 1978, 14, 338–349. [Google Scholar] [CrossRef] [PubMed]
  20. Adewale, S.O.; Olopade, I.A.; Adeniran, G.A.; Ajao, S.O. Mathematical Analysis of Quarantine on the Dynamical Transmission of Diphtheria Disease. Int. J. Sci. Eng. Investig. 2017, 6, 8–17. [Google Scholar]
  21. Akhi, A.A.; Tasnim, F.; Akter, S.; Kamrujjaman, M. A Mathematical Model of a Diphtheria outbreak in Rohingya Settlement in Bangladesh. J. Mahani Math. Res. Cent. 2023, 12, 547–563. [Google Scholar]
  22. Djaafara, B.; Adrian, V.; Eriawati, E.; Elyazar, I.R.; Hamers, R.L.; Baird, J.K.; Thwaites, G.E.; Clapham, H.E. Transmission Dynamics and Control Strategies During the 2017 Diphtheria Outbreak in Jakarta, Indonesia: A Modelling Study. Preprint 2023. [Google Scholar] [CrossRef]
  23. Husain, H.S. An SIR mathematical model for Dipterid disease. J. Phys. Conf. Ser. 2019, 1280, 022051. [Google Scholar] [CrossRef]
  24. Ilahi, F.; Widiana, A. The effectiveness of vaccine in the outbreak of diphtheria: Mathematical model and simulation. IOP Conf. Ser. Mater. Sci. Eng. 2018, 434, 012006. [Google Scholar] [CrossRef]
  25. Fauzi, I.S.; Nuraini, N.; Sari, A.M.; Wardani, I.B.; Taurustiati, D.; Simanullang, P.M.; Lestari, B.W. Assessing the impact of booster vaccination on diphtheria transmission: Mathematical modeling and risk zone mapping. Infect. Dis. Model. 2024, 9, 245–262. [Google Scholar] [CrossRef] [PubMed]
  26. Loyinmi, A.C.; Ijaola, A.L. Investigating the effects of some controls measures on the dynamics of diphtheria infection using fractional order model. Math. Comput. Sci. 2024, 5, 26–47. [Google Scholar]
  27. Ahmed, I.; Kiataramkul, C.; Muhammad, M.; Tariboon, J. Existence and sensitivity analysis of a Caputo fractional-order diphtheria epidemic model. Mathematics 2024, 12, 2033. [Google Scholar] [CrossRef]
  28. Kamadjeu, R.; Okunromade, O.; Lawal, B.B.; Gadanya, M.; Suwaid, S.A.; Blanco, E.C.; Kelvin, E.A. Diphtheria transmission dynamics-unveiling generation time and reproduction numbers from the 2022–2023 outbreak in Kano State, Nigeria. Infect. Dis. Model. 2025, 10, 680–690. [Google Scholar] [CrossRef]
  29. Islam, Z.; Ahmed, S.; Rahman, M.M.; Karim, M.F.; Amin, M.R. Global stability analysis and parameter estimation for a diphtheria model: A case study of an epidemic in Rohingya refugee camp in Bangladesh. Comput. Math. Methods Med. 2022, 2022, 6545179. [Google Scholar] [CrossRef] [PubMed]
  30. Izzati, N.; Andriani, A. Dynamical analysis of diphtheria epidemic model with natural immunity rate on exposed individuals. J. Phys. Conf. Ser. 2021, 1869, 012117. [Google Scholar] [CrossRef]
  31. Kanchanarat, S.; Chinviriyasit, S.; Chinviriyasit, W. Mathematical assessment of the impact of the imperfect vaccination on diphtheria transmission dynamics. Symmetry 2022, 14, 2000. [Google Scholar] [CrossRef]
  32. Matsuyama, R.; Akhmetzhanov, A.R.; Endo, A.; Lee, H.; Yamaguchi, T.; Tsuzuki, S.; Nishiura, H. Uncertainty and sensitivity analysis of the basic reproduction number of diphtheria: A case study of a Rohingya refugee camp in Bangladesh, November–December 2017. PeerJ 2018, 6, e4583. [Google Scholar] [CrossRef] [PubMed]
  33. Usman, A.; Akinwande, N.I.; Ashezua, T.T.; Gweryina, R.; Somma, S.A.; Oguntolu, F.A.; Kadunad, F.S.; Adajimee, T.P.; Kuta, F.A.; Shehu, M.D.; et al. Mathematical model of COVID-19 transmission dynamics incorporating booster vaccine program and environmental contamination. Heliyon 2022, 8, e11513. [Google Scholar]
  34. Castillo-Chavez, C. On the computation of r. And its role on global stability carlos castillo-chavez, zhilan feng, and wenzhang huang. Math. Approaches Emerg. Reemerging Infect. Dis. Introd. 2002, 1, 229. [Google Scholar]
  35. La Salle, J.P. The Stability of Dynamical Systems; Society for Industrial and Applied Mathematics: Philadelphia, PA, USA, 1976. [Google Scholar] [CrossRef]
  36. Truelove, S.A.; Keegan, L.T.; Moss, W.J.; Chaisson, L.H.; Macher, E.; Azman, A.S.; Lessler, J. Clinical and epidemiological aspects of diphtheria: A systematic review and pooled analysis. Clin. Infect. Dis. 2020, 71, 89–97. [Google Scholar]
  37. Chitnis, N.; Hyman, J.M.; Cushing, J.M. Determining important parameters in the spread of malaria through the sensitivity analysis of a mathematical model. Bull. Math. Biol. 2008, 70, 1272–1296. [Google Scholar]
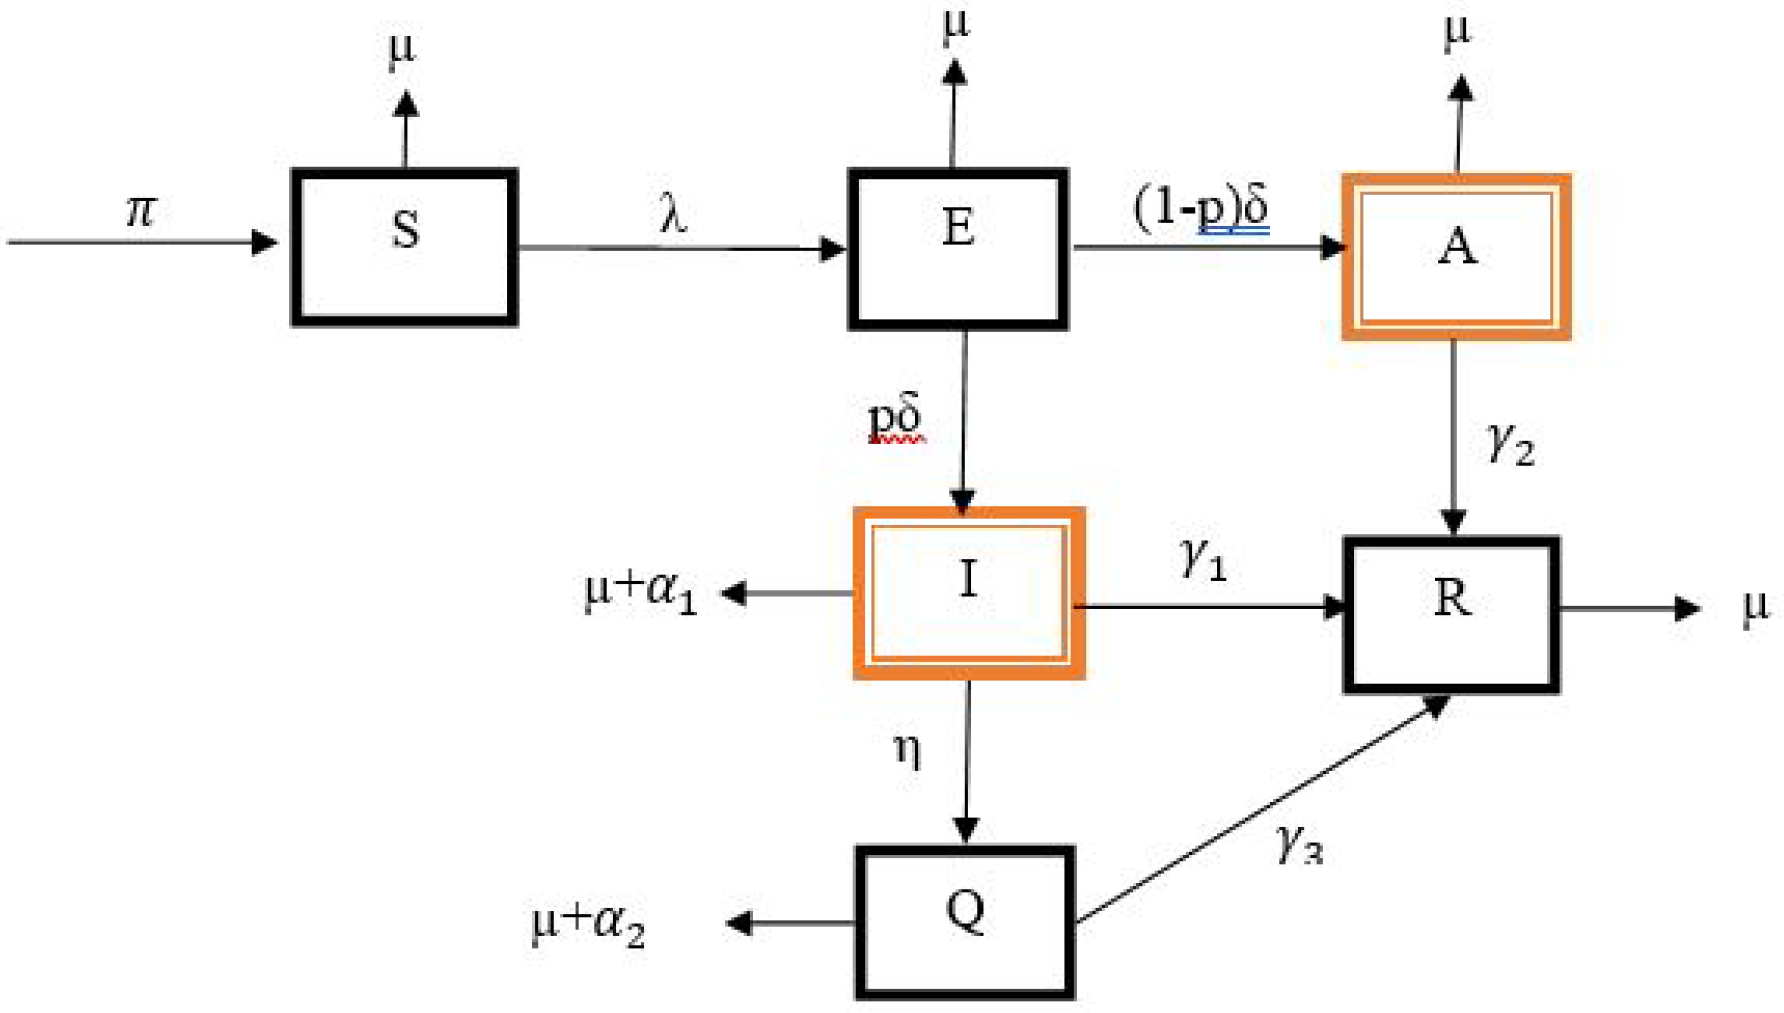
Figure 1. Schematic diagram for diphtheria model.
Mathematics 13 01189 g001
Figure 2. Best fit curve of model (1) (Solid red line) and reported confirmed cases of diphtheria between January and December 2023 (asterisks) from the Infectious Disease Hospital (IDH) in Kano State.
Mathematics 13 01189 g002
Figure 3. Sensitivity analysis of model (1).
Mathematics 13 01189 g003
Figure 4. Three-dimensional plots showing the impact of β , γ 2 , c, η , α 1 , δ , and p on R c . The threshold R c increases when β , γ 2 and c increase in (a,b), while there is a decrease in R c in (c,d) for increasing values of η , α 1 , δ , and p.
Mathematics 13 01189 g004
Figure 5. Prevalence of diphtheria as a function of time for model (1) showing the impact of both the rate of the public enlightenment campaign (c) and efficacy of the public enlightenment campaign ( ϵ ): when c = 0.005 ; ϵ = 0.9 (Red-dash line); then R c = 2.7573 < R 0 = 2.7822 ; when c = 5 ; ϵ = 0.09 (Black-solid line); then R c = 1.5234 < R 0 = 2.7822 ; when c = 0.9 ; ϵ = 0.9 (Blue-dot line); then R c = 0.5262 < R 0 = 2.7822 . Other parameter values are given in Table 2.
Mathematics 13 01189 g005
Figure 6. Simulations of model (1) showing the behaviors of the compartments. (a) the impact of a public enlightenment campaign and isolation of infected humans, while (b) is only isolation. The combined effect of these preventive measures in (a) leads to a rapid decline of isolated (Green line), infected (Red line), exposed (purple line) and asymptomatic (Yellow line) humans leaving susceptible and recovered individuals to grow compared to that in (b) with isolation only. Moreover, in both cases, R c and R 0 are less than unity with R c = 00013 < R 0 = 00028 . Parameter values used are given in Table 2.
Mathematics 13 01189 g006
Figure 7. Simulations of model (1) showing the behaviors of the compartments. In both (a,b) the subpopulations of isolated and infected individuals are low but the number of susceptible individuals is higher in (a) than (b) due to the combined positive impact of the public enlightenment campaign and the isolation of infected humans. Furthermore, R c = 4.0 < R 0 = 9.4939 . Parameter values used are given in Table 2 with the exception of c = 0.005 and ϵ = 0.9 for (a).
Mathematics 13 01189 g007aMathematics 13 01189 g007b
Table 1. The state variables and parameters of model (1).
VariableDescription
NTotal human population
SSusceptible individuals
EExposed individuals
AAsymptotic infected individuals
QIsolated individuals
RRecovered individuals
Parameter
π Recruitment rate
μ Natural mortality rate
α 1 Mortality rate due to disease in infected class
α 2 Mortality rate due to disease in isolated class
γ 1 Progression rate from infected to recovered class
γ 2 Progression rate from asymptomatic to recovered class
γ 3 Progression rate from isolated to recovered class
pProportion of exposed population becoming infectious
θ Modification parameter
β Transmission rate
cPublic enlightenment campaign rate
ϵ Efficacy (people compliance) rate of public enlightenment campaign
δ Progression rate from exposed to either asymptomatic
class or infected class
η Progression rate from infected class to isolated class
Table 2. Parameter estimation table.
ParameterEstimated ValueSources
μ 0.0254 fitted
Π 6,808,999fitted
θ 0.6667 [1]
β 0.000097 Assumed
η 0.11 fitted
c 0.9 [33]
ϵ 0.6 [33]
α 1 0.7 fitted
α 2 0.13 fitted
γ 1 0.99 fitted
γ 2 0.05 fitted
γ 3 0.5 fitted
δ 0.0509 fitted
p 0.55 [36]
Table 3. Values of sensitivity indices.
ParameterIndexIndex Value
β χ β R c 1.0000
γ 2 χ γ 2 R c 0.5349
α 1 χ α 1 R c −0.2760
θ χ θ R c 0.2089
c χ c R c 0.1725
η χ η R c −0.1111
μ χ μ R c 0.06951
γ 1 χ γ 2 R c −0.0381
δ χ δ R c −0.0357
ϵ χ ϵ R c 0.0020
p χ p R c −0.00001
Disclaimer/Publisher’s Note: The statements, opinions and data contained in all publications are solely those of the individual author(s) and contributor(s) and not of MDPI and/or the editor(s). MDPI and/or the editor(s) disclaim responsibility for any injury to people or property resulting from any ideas, methods, instructions or products referred to in the content.