Article

Hyperbolic Representation of the Richards Growth Model

Quantum Chemistry Department, Adam Mickiewicz University of Poznań, Uniwersytetu Poznańskiego 8, 61-614 Poznań, Poland
Mathematics 2025, 13(8), 1316; https://doi.org/10.3390/math13081316
Submission received: 3 March 2025 / Revised: 14 April 2025 / Accepted: 15 April 2025 / Published: 17 April 2025
(This article belongs to the Section E3: Mathematical Biology)

Abstract

:
The phenomenological universalities (PU) approach is employed to derive the Richards growth function in the unknown hyperbolic representation. The formula derived can be applied in theoretical modeling of sigmoid and involuted growth of biological systems. In the model proposed, the exponent in the Richards function has the following clear biological meaning: it describes the number of cells doubling, leading to an increase in a biomass of the system from m 0 (birth or hatching mass) to the limiting value m (mass at maturity). The generalized form of the universal growth function is derived. It can be employed in fitting the weight–age data for a variety of biological systems, including copepods, tumors, fish, birds, mammals and dinosaurs. Both the PU methodology and the Richards model can be effectively applied in the theoretical modeling of infectious disease outbreaks. To substantiate this assertion, the simplest PU-SIR (Susceptible–Infective–Removed) epidemiological model is considered. In this approach, it is assumed that the number of births is approximately equal to the number of deaths, while the impact of recovered (quarantined) individuals on the dynamics of the infection is negligible.

1. Introduction

Among the various mathematical models utilized in the theoretical representation of growth phenomena, the most frequently employed are the exponential, Gompertz, von Bertalanffy, West–Brown–Enquist (WBE), power law, logistic (Verhulst), and Richards (theta or generalized logistic) models [1]. These models can be systematically derived from fundamental principles [2,3,4,5] and subsequently applied to simulate changes in length, volume, weight, or cell numbers over time within complex systems. A particularly notable approach for constructing and categorizing growth models is the PU concept, introduced by Castorina, Delsanto, and Guiot (CDG) [6]. This framework enables the derivation of the exponential, Gompertz, von Bertalanffy, and WBE functions from a set of first-order differential equations, which incorporate the so-called generating function [6]
Φ ( x ) = x + c 2 x 2 + c 3 x 3 +
expanded into a power series in the vicinity of x = 0 at the assumptions Φ ( 0 ) = c 0 = 0 , c 1 = 1 . For Φ ( x ) = 0 , the CDG method generates the exponential, for Φ ( x ) = x the Gompertz function, whereas for Φ ( x ) = x + c 2 x 2 the von Bertalanffy and WBE functions belonging to the U 0 , U 1 , and U 2 classes of PU, respectively. The PU concept and CDG methodology are useful for their applicative relevance in various fields of research, including physics, chemistry, biology, ecology, engineering, economics, and social sciences [6]. In particular, this strategy is extremely effective in the study of complex systems whose development is governed by nonlinear processes, resulting in the appearance of the specific growth patterns. Consequently, the CDG approach can be employed to obtain different growth models widely applied in biology, medicine, and ecology [7,8,9].
The PU concept has been extended [10] to include unconventional forms of the generating functions Φ ( x ) = x + c 0 + ( x + c 0 ) 2 and Φ ( x ) = c 1 ( x + c 0 / c 1 ) 2 , applied [11] to generate the universal WBE growth curve [5] and power law (fractal) [12] function that are well known and widely applied in the fields of life sciences and beyond. Those results indicate that the form of the growth functions derived in the CDG scheme depends not only on different powers n = 0 , 1 , 2 of the truncated series Φ ( x ) but also on the relationship between parameters c 0 , c 1 , and c 2 and the presence (absence) of the term ( x + c 0 / c 1 ) in the series. Such modifications are useful in producing new forms of the growth functions known and unknown in the domain of developmental biology [1] and other sciences.
A summary of the results obtained thus far suggests that the CDG approach successfully generates all major growth functions, with the exception of the Richards function [4,13]. This observation raises two key questions: is it possible to derive the Richards function within the CDG framework, and what is the specific form of Φ ( x ) that yields the Richards model? The primary objective of this study is to address these questions and demonstrate that the extended PU methodology indeed generates the Richards function in a previously unrecognized hyperbolic representation. The formula derived can be applied in the theoretical modeling of sigmoid and involuted growth of biological systems. In the model proposed, the exponent in the Richards function has the following clear biological meaning: it describes the number of cells doubling, leading to an increase in a biomass of the system from birth (or hatching mass) to the limiting value, representing mass at maturity.

2. Materials and Methods

The extended CDG theory [10] is based on the set of nonlinear equations
d ψ ( q ) d q x ( q ) ψ ( q ) = 0 , d ψ ( q ) d q + x ( q ) ψ ( q ) = 0 ,
d x ( q ) d q + Φ ( x ) = 0 , Φ ( x ) = c 1 ( x ± c 0 / c 1 ) + c 2 ( x ± c 0 / c 1 ) 2 +
in which ψ ( q ) and ψ ( q ) are growth and regression (decay) functions, respectively, whereas Φ ( x ) is a generating function expanded into a power series in the vicinity of x = ± c 0 / c 1 . It significantly differs from that applied originally by [6], in particular, parameters c 0 0 and c 1 1 are taken into consideration. The set of Equations (2) and (3) produce the most important growth (regression) functions [10,11]
ψ ( q ) = exp q x ( q ) d q + C ψ ( q ) = exp q x ( q ) d q + C
belonging to the U 0 , U 1 , and U 2 classes of PU to be obtained for different powers n = 0 , 1 , 2 of the truncated series (3). One may prove that the new subclass U 2 3 of PU including the Richards growth function can be obtained by making use of the generating function
Φ ( x ) = c 0 c 2 ( x c 0 / c 1 ) 2 c i > 0
which differs from those considered so far by the presence of the minus signs and therelationship between parameters c i > 0 . In view of this, the solutions of the CDG Equation (2) depend not only on the order of the expansion, but also on the positive or negative values of parameters c i defining the system. Inserting (5) to the first of the CDG Equation (3) and integrating it with respect to x-coordinate provides
Φ ( x ) 1 d x = c 0 c 2 1 / 2 tanh 1 c 2 ( c 0 c 1 x ) c 1 c 0 c 2 = q ,
which can be reverted to the form
x ( q ) = c 0 c 2 tanh ( q c 0 c 2 ) + c 0 c 1 .
Taking advantage of Equations (4) and (7), one may derive ψ ( q ) as follows:
ψ ( q ) = ψ 0 exp c 0 c 1 q tanh 2 q c 0 c 2 1 1 2 c 2
or alternatively, by using the identity cosh 2 ( z ) = 1 tanh 2 ( z ) , as follows:
ψ ( q ) = ψ 0 i 1 / c 2 exp c 0 c 1 q cosh q c 0 c 2 1 c 2 .
Here, i = 1 is an imaginary number. By taking advantage of the relationship cosh ( z ) = [ exp ( z ) + exp ( z ) ] / 2 , function (9) can be rewritten to the exponential form
ψ ( q ) = ψ 0 ( 2 i ) 1 c 2 exp c 0 c 1 c 0 c 2 q 1 + exp 2 q c 0 c 2 1 c 2 ,
which can be treated as a template for generating different growth models for the function (5). For example, the classes of sigmoid, involuted or exponential solutions can be obtained for
c 0 c 1 c 0 c 2 = 0 Sigmoid < 0 Involuted > 0 Exponential
The sigmoid version of function (10) has an inflection point q i and takes the value ψ ( q i ) equal to
q i = ln ( c 2 ) 2 c 0 c 2 , ψ ( q i ) = ψ 0 ( 2 i ) 1 c 2 ( 1 + c 2 ) 1 c 2 .
The Richards growth model in the original form ψ ( q ) = Θ ( t ) is recovered by redefining the parameters c i in function (10):
c 0 , c 1 , c 2 b , c , c 0 c 1 c 0 c 2 = 0
2 c 0 c 2 = 2 c 1 = b c , c 2 = b , q = t t i + ln ( b ) / b c
resulting in the conversion of Equation (10) to the form
Θ ( t ) = Θ 1 + b exp b c ( t t i ) 1 / b .
It represents the Richards function in which Θ = ψ 0 ( 2 i ) 1 / b stands for the limiting value of Θ ( t ) = Θ , whereas t i is an inflection point satisfying ( d 2 Θ ( t ) / d t 2 ) t = t i = 0 . Taking into account the initial condition Θ ( t 0 ) = Θ 0 , Equation (15) can be changed to the form
Θ ( t ) = Θ 0 1 + b exp b c t i 1 / b 1 + b exp b c ( t t i ) 1 / b ,
which is useful in the fitting of experimental data when Θ 0 , instead of Θ , is determined.
In this work, we propose to use an alternative parametrization
c 0 , c 1 , c 2 a , b , c
c 0 = b c 2 , c 1 = b c a , c 2 = 1 b , c 0 c 2 = c , q = t t 0
converting functions (9) and (10) to the equivalent hyperbolic and exponential forms
ψ ( t ) = ψ 0 i b exp a c ( t t 0 ) cosh c ( t t 0 ) b ,
ψ ( t ) = ψ 0 ( 2 i ) b exp ( a b ) c ( t t 0 ) 1 + exp [ 2 c ( t t 0 ) ] b .
To validate and demonstrate the practical utility of the derived formulae, they were applied to determine the parameters of the Richards model, which characterizes sigmoidal growth (e.g., copepods, tumors, fish, birds, mammals, dinosaurs) and involuted growth (e.g., thymus in mammals or bursa of Fabricius in birds) in biological systems. The parameters were estimated by fitting the various experimental datasets using a nonlinear least-squares routine, with statistical weights assigned as the inverse squares of the standard deviations (SDs) associated with the data [14]. In cases where SDs were unavailable, the data were weighted by the reciprocal mass of the system. This approach was originally developed and applied by Laird [15] in the fitting of tumor growth data. For computational analysis, an executable Fortran-based program designed for numerical data analysis was utilized [14]. This program enables the estimation of freely fitted parameters alongside their associated standard errors, as well as the assessment of multiple indicators of the goodness of fit. Specifically, the following indicators were considered:
(i)
The normalized standard deviation (NSD):
N S D = 1 N D N P i = 1 N D m i e x p m i t h e o u i 2
in which N D and N P denote the numbers of data and parameters fitted, u i is the SD of i-th experimental mass m i e x p , whereas m i t h e o is the theoretically calculated mass by the model function. If reproduction of the data is performed within u i , then N S D 1 , and the theory reproduces the data with experimental accuracy.
(ii)
The coefficient of determination R 2 :
R 2 = 1 i = 1 N D m i e x p m i t h e o 2 Σ i = 1 N D m i e x p 1 N D i = 1 N D m i t h e o 2
where the best fits are represented by R 2 1 .
(iii)
The standard deviation (SD):
S D = i = 1 N D m i e x p m i t h e o 2 N D
applied together with R 2 when the experimental SDs of the data are unavailable.
(iv)
Akaike Information Criterion (AIC) and Bayesian Information Criterion (BIC) defined in [16,17], respectively: They have been used to select the best model with the optimal number of parameters fitted and to avoid overfitting. The smaller values of AIC and BIC indicate the model more preferred and statistically reliable. The explicit form of the AIC and BIC formulae used in the calculations is presented in [14].
The results presented in Table 1 and Table 2 can also be reproduced using other relevant software employed for fitting age–weight data. For example, calculations conducted with SigmaPlot version 11 yielded values that were either identical to or consistent with those reported in Table 1 and Table 2, within the estimated error range. However, an exception was identified in which SigmaPlot was unable to fit the parameter m0 for the Tyrannosaurus rex data, whereas the Fortran program successfully generated this parameter. In this case, m0 should be constrained to the value of 2.06 [kg], as estimated by Myhrvold [18]. Calculations performed in the constrained scheme provided b = 11.71 ( 11 ) [y−1] and c = 0.0766 ( 37 ) , which are in full agreement with the results presented in Table 1.

3. Results

Taking into account the relation (11), one may consider two classes of solutions produced by (19) and (20): sigmoid for a = b and involuted for a < b , which will be analyzed separately in the next subsections.

3.1. Sigmoid Richards Growth

To obtain a sigmoid version ( a = b ) of the Richards functions (19) and (20) that are useful in the fitting of experimental data, especially weight–age data ψ ( t ) = m ( t ) , let us consider their limit values:
m ( t 0 ) = ψ 0 i b exp b c t 0 cosh c t 0 b = m 0 ,
m ( t 0 ) = ψ 0 ( 2 i ) b 1 + exp [ 2 c t 0 ] b = m 0
in which m 0 is an initial value of the Richards function. Having derived the equations specified above, one may rewrite (19) and (20) to the equivalent forms
m ( t ) = m 0 exp b c ( t t 0 ) cosh c ( t t 0 ) b exp b c t 0 cosh c t 0 b ,
m ( t ) = m 0 1 + exp [ 2 c ( t t 0 ) ] b 1 + exp ( 2 c t 0 ) b .
Now, let us consider the asymptotic limit of (27)
m ( t ) = m 0 1 + exp ( 2 c t 0 ) b = m ,
which, for t 0 = 0 , reduces to a simple formula
m ( t ) = m 0 2 b = m ,
which allows for a precise biological interpretation of the b-parameter for growing biosystems: it describes the number of cells doubling, leading to an increase in a biomass from m 0 (in the case of animals, it is birth or hatching mass) to the limiting value m (mass at maturity). The interpretation proposed is correct for t 0 = 0 and predicts that the value of b-parameter should be equal (within standard error) to an integer number. The results of the test calculations presented in Table 1 confirm this hypothesis.
Finally, one may pass to generate the equation governing the Richards sigmoid growth, by substituting Equations (18) into (7) and then Equations (7) into (2), yielding
d d t + c b tanh c ( t t 0 ) c b m ( t ) = 0 ,
or alternatively
1 m ( t ) d m ( t ) d t = 2 b c 1 m ( t ) m 1 / b .
For comparison, the original Richards growth function (20) satisfies
1 Θ ( t ) d Θ ( t ) d t = c 1 Θ ( t ) Θ b ;
consequently, both models are equivalent, and characterized by the growth rates 2 c and c , respectively. In this way, we have complete characteristics of the dynamics of the sigmoid Richards growth characterized by the hyperbolic function (26) or its alternative exponential version (27).
To demonstrate the applicability of the functions (26) and (27) in the quantitative analysis of the weight–age data and to prove the correctness of the relation (29), we employ them to model the post-natal growth of fish, tilapia nile Oreochromis niloticus [21]; bird, Athens-Canadian male chicken Gallus gallus domesticus [22]; and mammal, zebra Equus Burchelli antiquorum [23], that were already tested in our previous work [14] using the von Bertalanffy growth function [2,3]. We verified that the inclusion of only post-natal data allows for their satisfactory reproduction with a fixed value of the parameter t 0 = 0 . These data were supplemented with additional ones obtained for submillimeter multicellular marine copepod (metazoan) Calanus pacificus [24], Flexner–Jobling (FJ) cancer [25], and dinosaur Tyrannosaurus rex [18]. In the last case, the Myhrvold data were enriched by hatchling mass m 0 = 2.06 ( 13 ) [Kg] reported by [26]. The results of calculations are presented in Table 1.

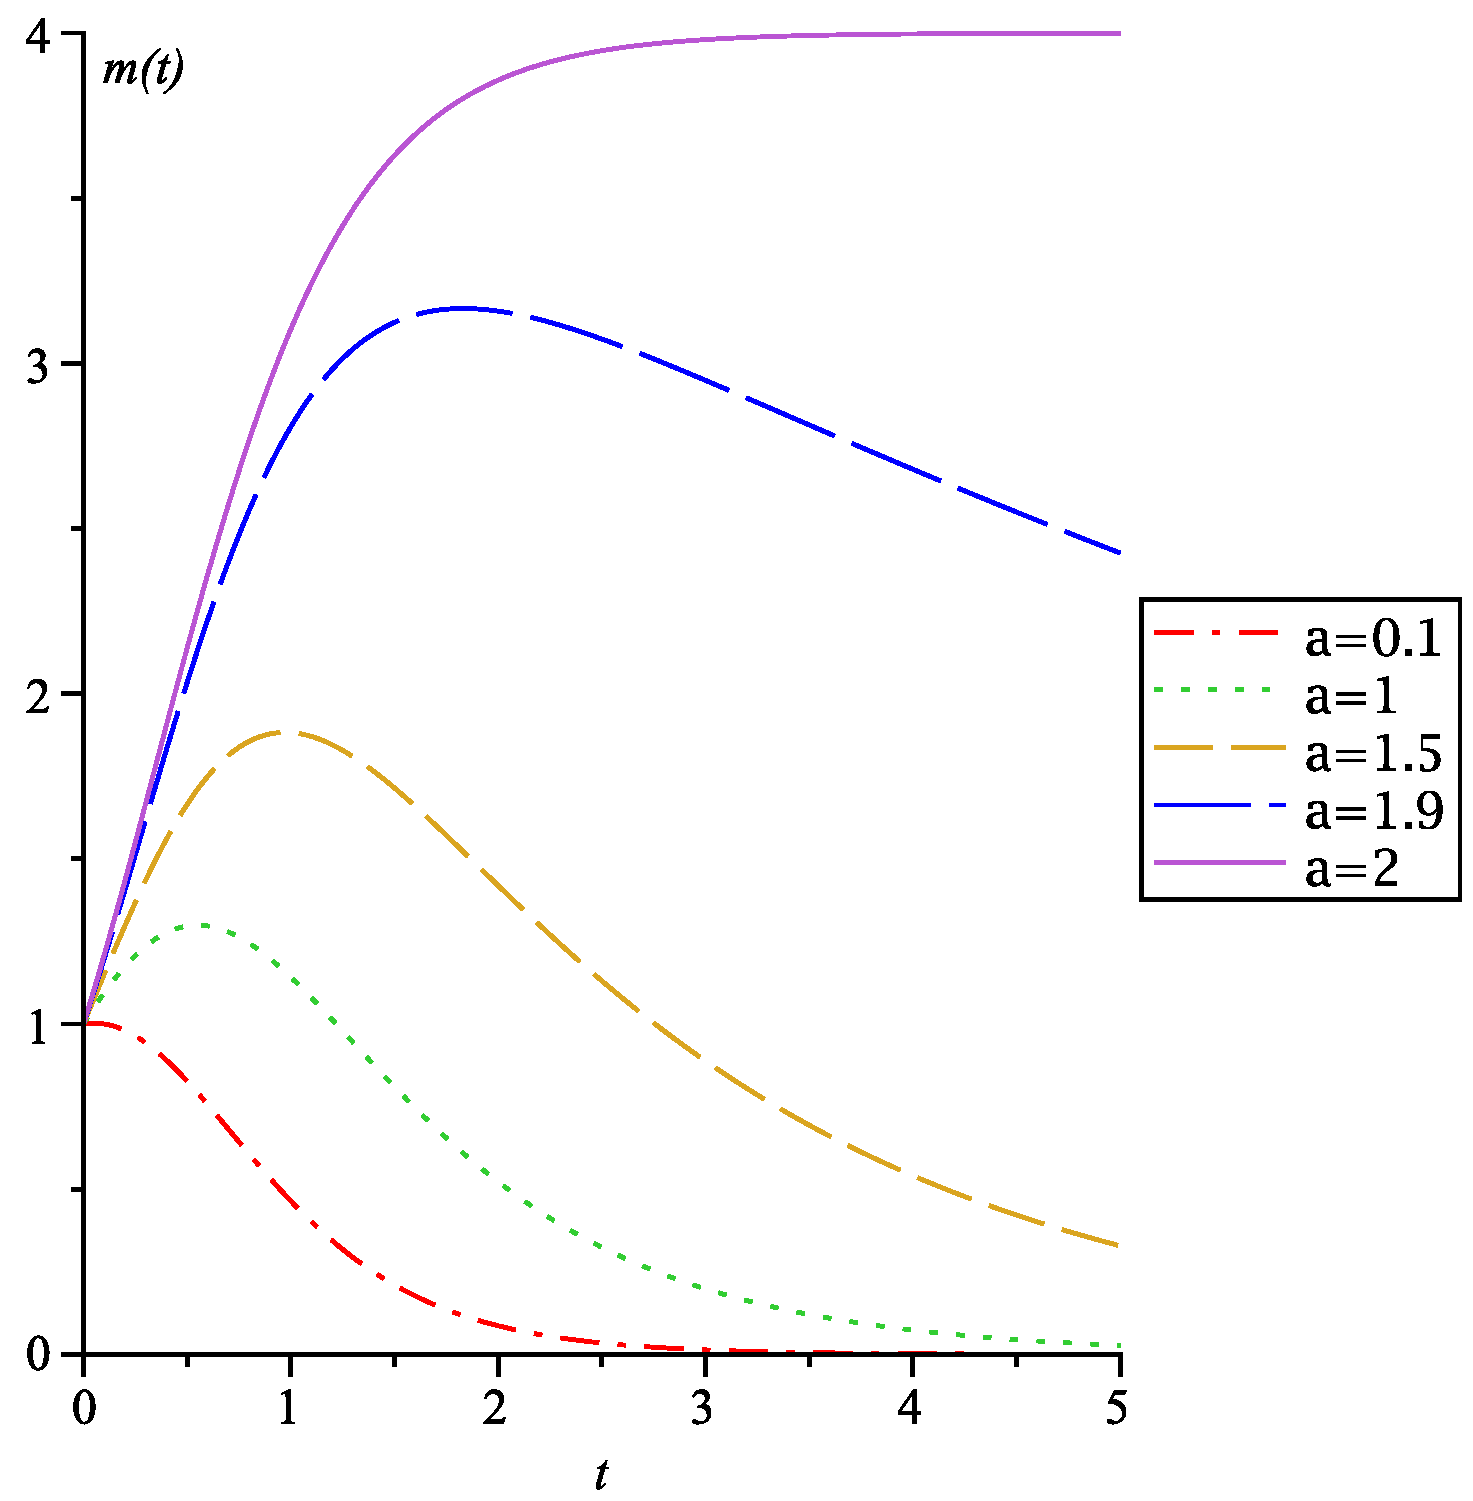
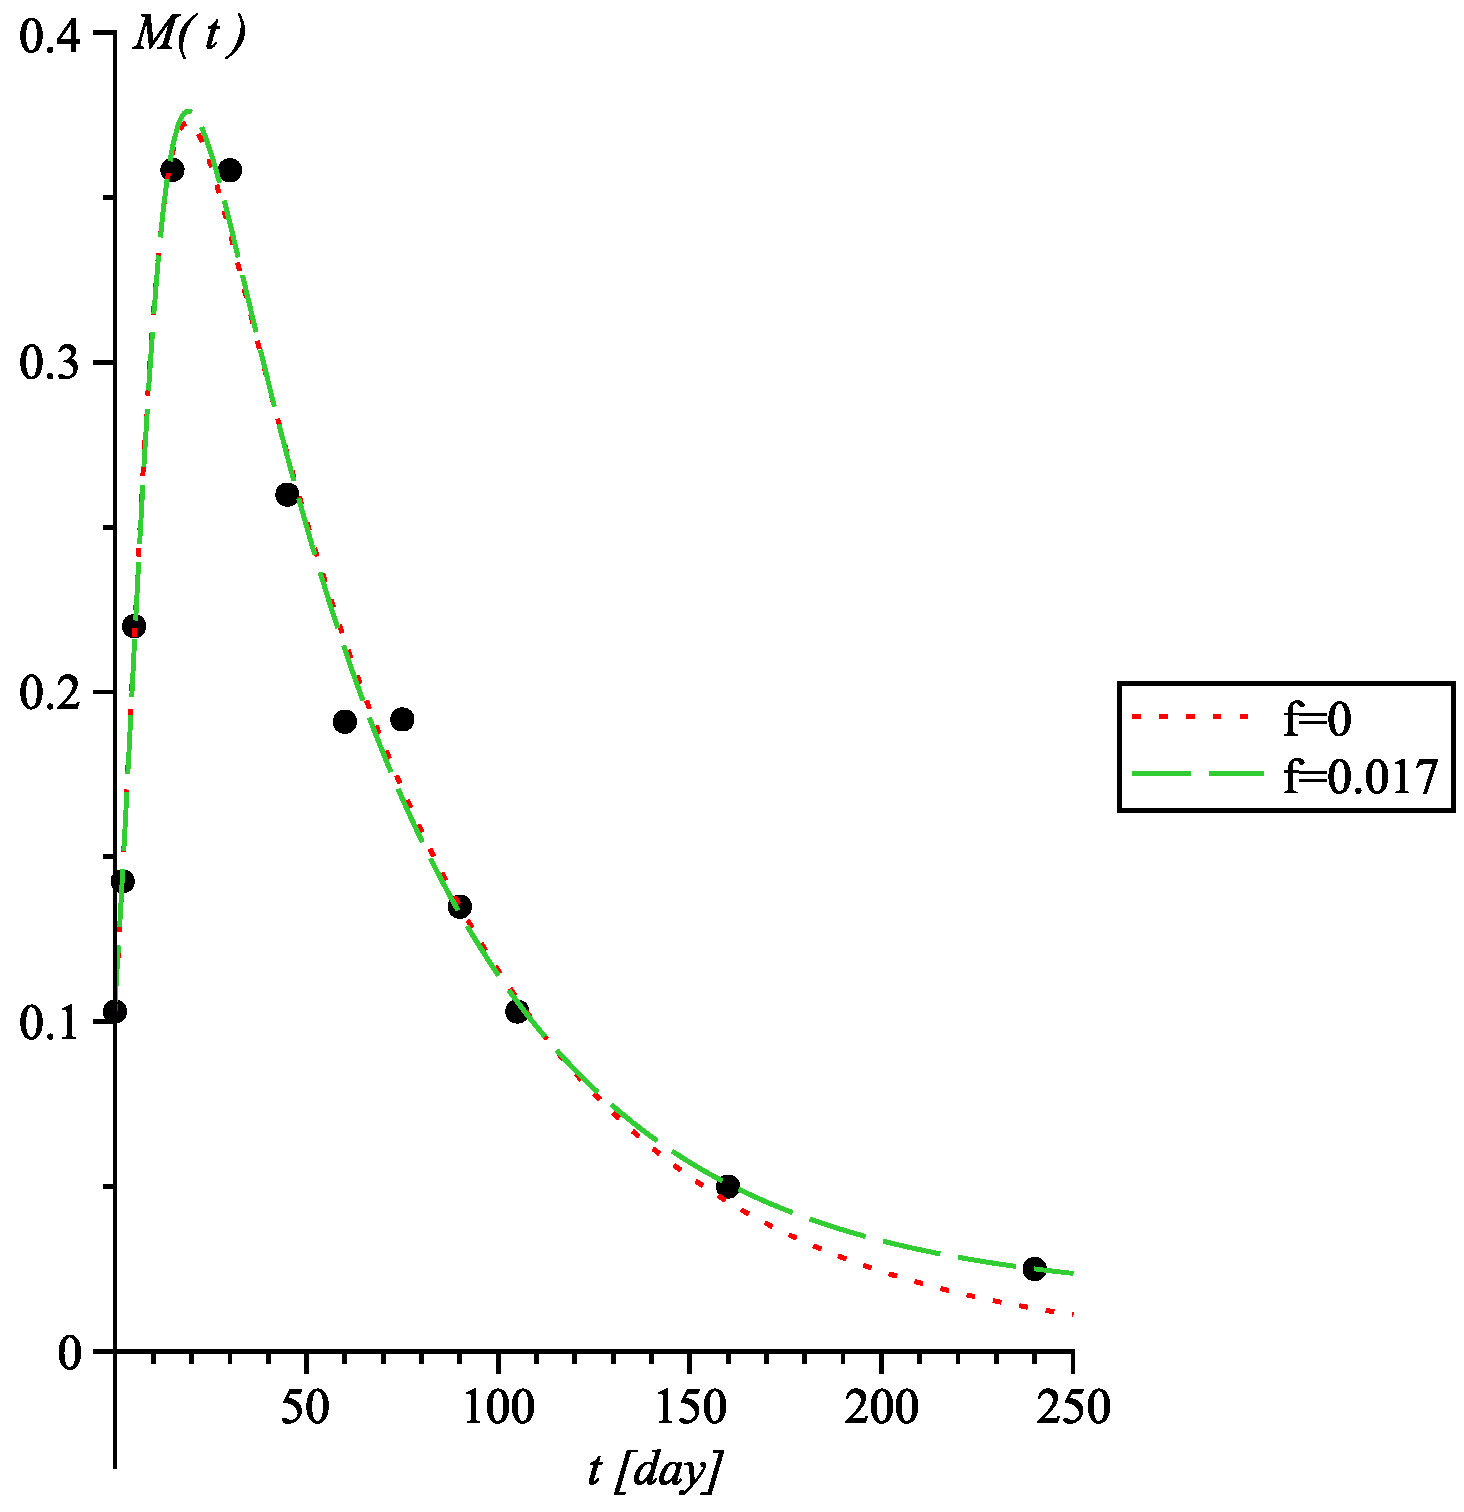
3.2. Involuted Richards Growth

Now, let us focus our attention to the general expressions (19) and (20) with ψ ( t ) = M ( t ) and M ( t = 0 ) = m 0 for a < b
M ( t ) = m 0 exp a c ( t t 0 ) cosh c ( t t 0 ) b exp a c t 0 cosh c t 0 b ,
M ( t ) = m 0 exp ( a b ) c t ) 1 + exp [ 2 c ( t t 0 ) ] b 1 + exp ( 2 c t 0 ) b .
They represent a family of curves whose shape depends on the value of a-parameter in relation to b. For a = b , one always obtains the sigmoid Richards curve, whereas for a < b , formulae (33) and (34) describe the systems which undergo involution in the course of time (e.g., thymus in mammals or bursa of Fabricius in birds). The plots of function (34) for different values of a in relation to fixed b are presented in Figure 1. Its analysis reveals that the shape of the involuted Richards curves depends on the difference d = b a between parameters defining the model. Consequently, one may rewrite (33) in the form of an involuted Richards function m ( t ) :
M ( t ) = exp ( a b ) c t m ( t ) , a < b
in which M ( t ) m ( t ) for b a stands for the sigmoidal Richards growth model (27). The function (35) satisfies the kinetic equation of the involuted growth:
d d t + c b tanh c ( t t 0 ) c a M ( t ) = 0
as it is a generalized form of the expression (30).
Because lim t M ( t ) = 0 , hence, in the analysis of the data for the systems with asymptotic behavior lim t M ( t ) = f , the modified function (35)
M ( t ) = exp ( a b ) c t m ( t ) + f
should be taken into consideration. In such circumstances, the initial value of M ( t ) is defined as follows:
M 0 = lim t 0 M ( t ) = m 0 + f .
Consequently, the functions (33) and (34) should be changed to the forms
M ( t ) = ( M 0 f ) exp a c t cosh c ( t t 0 ) b cosh c t 0 b + f ,
M ( t ) = ( M 0 f ) exp ( a b ) c t 1 + exp [ 2 c ( t t 0 ) ] b exp 1 + exp ( 2 c t 0 ) b + f .
It should be pointed out that the limit M ( t ) = f has only mathematical meaning due to the restricted existence time of biological systems; hence, both functions (35) and (37) should describe an involuted growth in shorter intervals with comparable accuracy. In order to verify this thesis and demonstrate the usefulness of functions (39) and (40) in the analysis of the involuted growth, we fitted 12 data points representing thymic-to-body mass ratio of male Wistar rats reported in [19]. They were measured in the interval ( 0 240 ) [d] and S D = 0.014 [mg/100 g]. Application of the relative instead of absolute thymus weights guarantees the existence of an asymptote with f 0 , while the fit of the absolute weight data provides the unsatisfactory value f = 0.0033 ± 0.0135 . The results of calculations are presented in Table 2 and Table 3, whereas plots of functions (36) and (37) are displayed in Figure 2.
In the second analysis of the involuted growth, we fitted 12 experimental data points representing the absolute weights of bursa of Fabricius in Chinese yellow quail measured by [20] in the interval ( 0 252 ) [d] with variable accuracy S D = 1.21 7.71 [mg]. The results of calculations are presented in Table 2 and Table 4, whereas the plots of functions (36) and (37) are displayed in Figure 3.

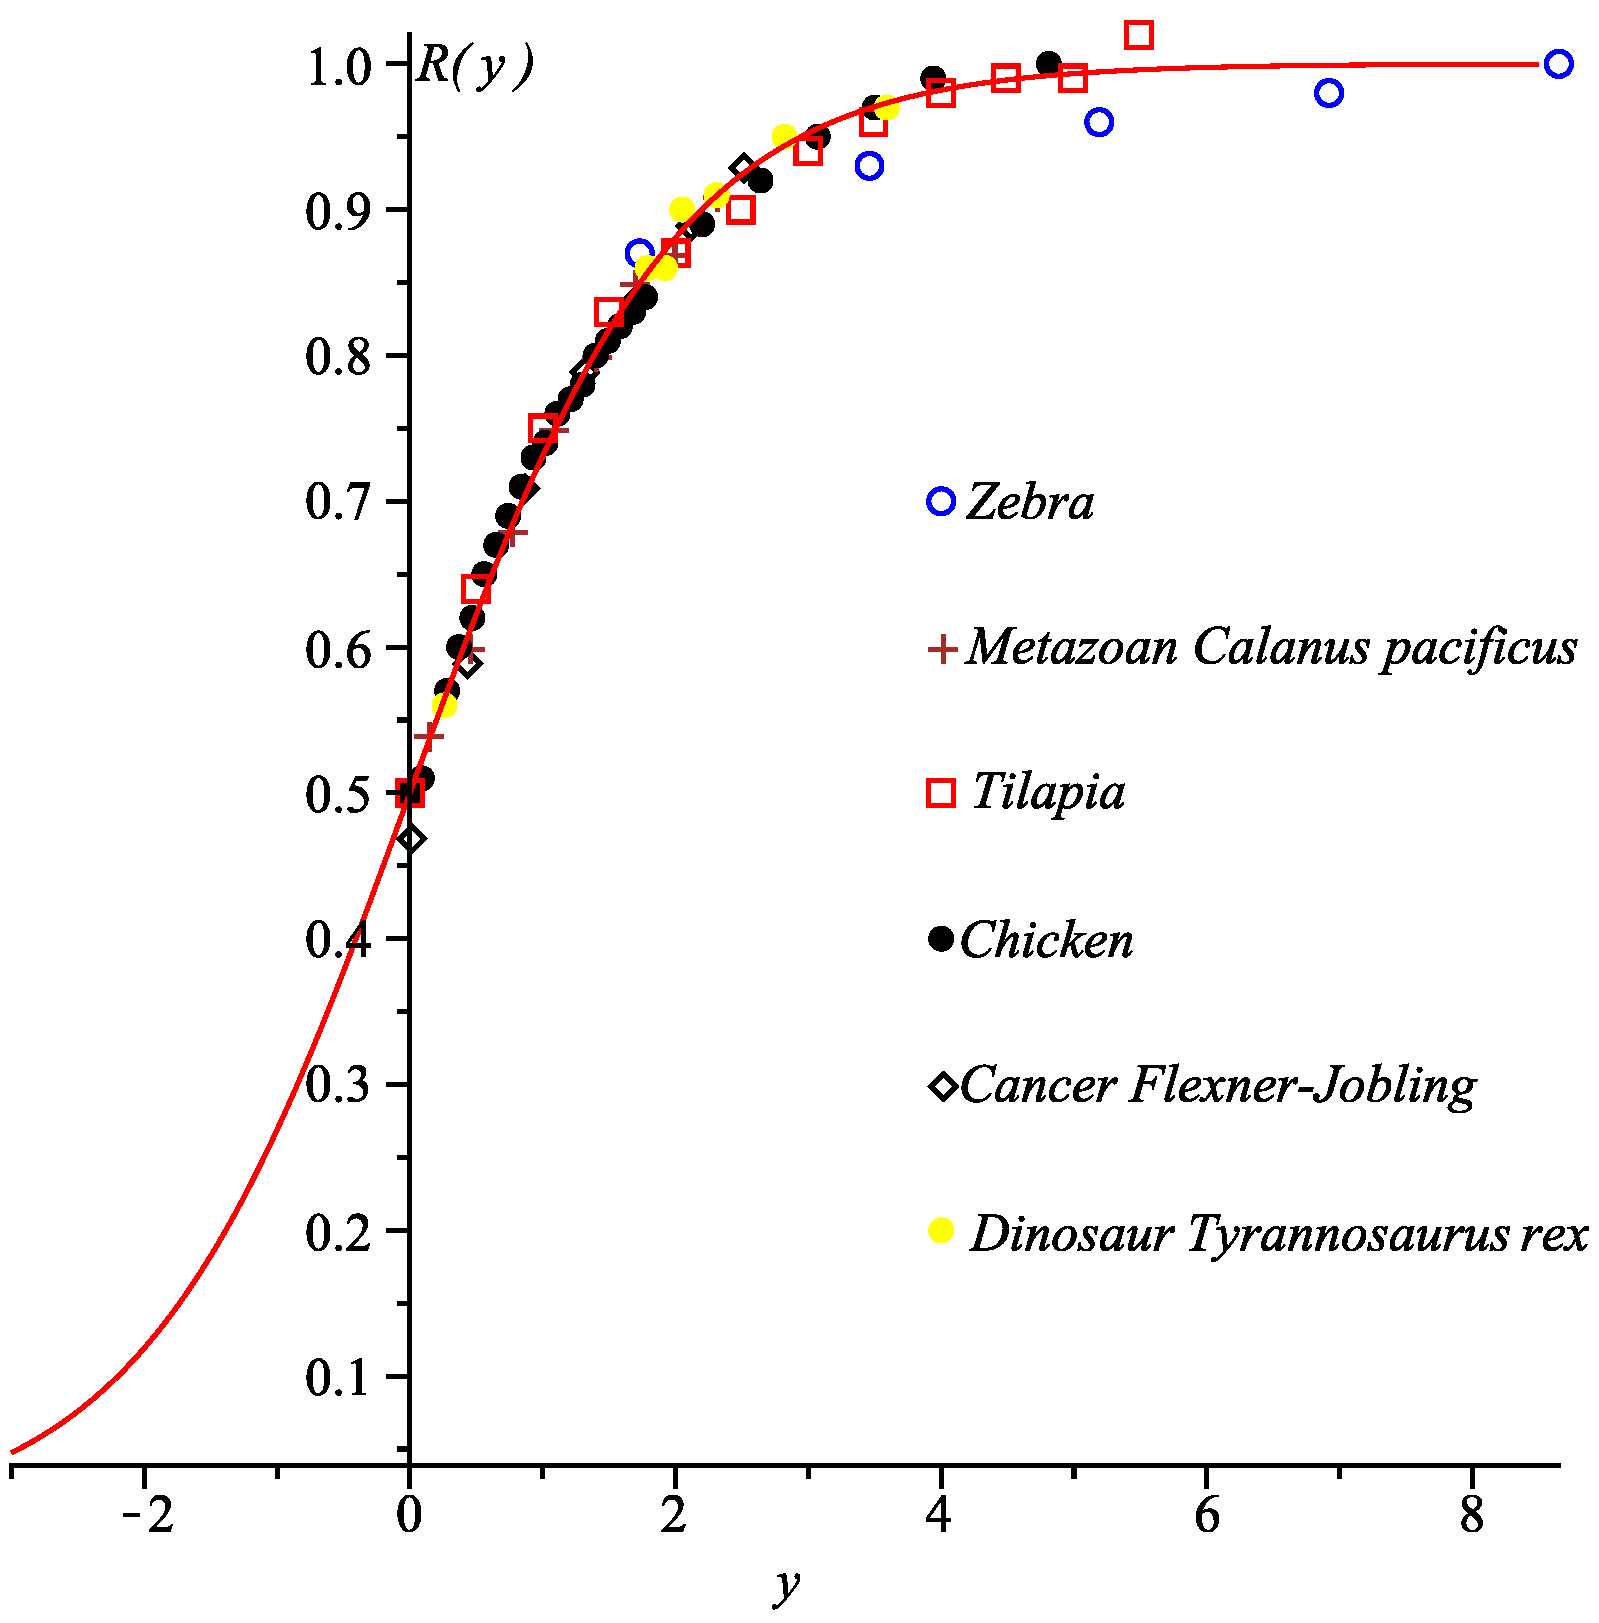
3.3. Generalized Universal Growth Curve

The Richards function (27) can be converted to the form
R ( y ) = 1 1 + exp ( y ) ,
defined by the dimensionless time y and mass R ( y )
y = 2 c t t 0 , R ( y ) = m ( t ) m 0 1 + exp ( 2 c t 0 ) b 1 / b ,
which, for t 0 = 0 , reduces to
y = 2 c t , R ( y ) = m ( t ) m 0 2 b 1 / b .
Equation (41) is a generalization of the universal growth function R ( y ) = 1 exp ( y ) introduced by [5]. The last thesis can be proven by employing the approximation R ( y ) = 1 / ( [ 1 + exp ( y ) ] 1 exp ( y ) . The generalized universal growth curve (41) and experimental weight–age data points expressed in terms of y and R ( y ) are presented in Figure 4. Its analysis reveals that all the data considered satisfy a universal law of growth (41), which can be successfully employed in fitting the weight–age data for a variety of biological systems, including copepods, tumors, fish, birds, mammals, and dinosaurs, ranging from metazoan Calanus pacificus with m = 5.8 × 10 3 [g] and ending on Tyrannosaurus rex with m = 7.124 × 10 6 [g] (the values of m were calculated from Equation (29) and parameters from Table 1. It is noteworthy that the latter value conforms acceptably with m = 7.000 ( 980 ) × 10 6 [g], as reported by Lee [26].

3.4. PU-SIR Epidemic Model

The PU methodology can be successfully applied in modeling the systems whose time evolution depends on several coupled processes. As an example, the use in the description of ecological population growth can be given [9]. This approach can be adapted to the prediction of the outbreak of infective diseases. To substantiate this thesis, we will use the SIR epidemiological model [27,28,29,30] in a simplified form, as proposed by [31]. In this approach, the number of births is approximately equal to the number of deaths, and, additionally, it is assumed that the individuals in the infected class restrict its social activity after being recovered (quarantined). Consequently, the impact of recovered individuals on the dynamics of the infection is negligible, and the denominator in the transmission term in the original SIR model is the sum of susceptible and infected individuals S + I and not the total population N = S + I + R , including recovered class R. In view of this, the simplified SIR approach is based on the following set of equations [31]:
d S ( q ) d q = β I ( q ) S ( q ) + I ( q ) S ( q ) , d I ( q ) d q = β S ( q ) S ( q ) + I ( q ) γ I ( q ) ,
d R ( q ) d q = γ I ( q ) R ( q ) R ( q ) , S ( q ) + I ( q ) + R ( q ) = N ,
in which S ( q ) , I ( q ) , and R ( q ) represent the numbers of individuals in the susceptible, infective, and removed (recovered, quarantined) classes at the time q; β and γ are the transmission and recovery rates, whereas N stands for the total (constant) population. Taking into account the relation (45), we only have to solve the set of Equation (44) and then R ( q ) can be determined from (45). Equation (44) can be rewritten according to the PU convention in the following manner:
d S d q = x ( q ) S , d I d q = y ( q ) I ,
x ( q ) = β I S + I , y ( q ) = β S S + I γ ,
or, alternatively, in a compact matrix notation:
x , x + β y + γ β , y + γ S I = 0 .
Here, we use the normalized forms of S ( q ) and I ( q ) :
S = S ( q ) S ( 0 ) , lim q 0 S = 1 , I = I ( q ) I ( 0 ) lim q 0 I = 1 ,
in which S ( 0 ) denotes the initial number of individuals in the susceptible class who will eventually be infected, while I ( 0 ) stands for an initial number of infections. Since R ( 0 ) = 0 , the term normalized function R means that it is defined by the equation R = N S I containing the normalized functions S and I.
Employing Equations (47) and (49), one may determine the initial values of x ( q ) and y ( q ) :
lim q 0 x ( q ) = β 2 , lim q 0 y ( q ) = β 2 γ
The above expressions and q = ( 0 , t ) are useful in calculating definite integrals. The set of homogenous Equation (48) has non-trivial solutions provided that the determinant of the squared matrix is equal to zero, resulting in the relationships
x ( q ) [ y ( q ) γ + β ] = 0 , I = x β + x S .
Differentiating the first of the above equations with respect to the temporal q-coordinate and taking into account the relation (3) adapted to the two-component PU model
d x ( q ) d q + d [ y ( q ) γ + β ] d q = Φ ( x ) + Φ ( y ) = 0 ,
one obtains the important information that in the PU-SIR scheme, only Φ ( x ) and x ( q ) or Φ ( y ) and y ( q ) are required to obtain the final solutions:
S = exp 0 t x ( q ) d q
and
I = exp 0 t y ( q ) d q = S exp ( β γ ) t ,
in which the relation (51) is taken into account. A comparison of Equations (51) and (54) provides the relationship
exp ( β γ ) t = x x + β ,
and important formulae
x ( t ) = β exp ( β γ ) t exp ( β γ ) t + 1 , t ( x ) = ln x β + x 1 β γ .
The former permits calculating S and I by taking advantage of Equations (53) and (54):
S = 2 β β γ 1 + exp [ ( β γ ) t ] β β γ
I = 2 β β γ 1 + exp [ ( β γ ) t ] β β γ exp ( β γ ) t ,
while the latter yields the implicit formula for the generating function Φ ( x ) by making use of the relation (3) in a slightly modified version:
Φ ( x ) = d t ( x ) d x 1 = β 1 ( β γ ) ( β + x ) x .
One may rewrite Φ ( x ) specified above into the form consistent with Equation (5):
Φ ( x ) = ( β γ ) β 4 ( β γ ) β x + β 2 2 = c 0 c 2 x + c 0 c 1 2 ,
whereas Equations (57) and (58) can be given in the hyperbolic representation:
S = exp β 2 t cosh ( β γ ) 2 t β β γ ,
I = exp β 2 t cosh ( β γ ) 2 t β β γ exp ( β γ ) t .
Additionally, from (45), we have
R = N S I = N S 1 + exp ( β γ ) t , d R d t = γ I ,
which are valid for exponential (57) and hyperbolic (61) representations of S. Plots of the S, I, and R functions for the selected values of β and γ are presented in Figure 5. Equation (60) reveals that the generating function in the PU-SIR model differs from (5) by the sign in the second-order term. Consequently, all formulae derived for Φ ( x ) in the form (5) can be converted to those appearing in the PU-SIR model by the substitution c 1 c 1 and c 0 c 2 c 0 c 2 in the original equations. In particular, the general solution (10) for the generating function (60) takes the form
ψ ( q ) = ψ 0 ( 2 i ) 1 c 2 exp c 0 c 1 + c 0 c 2 q 1 + exp 2 q c 0 c 2 1 c 2 .
The transmission and recovery rates β and γ in the SIR model proposed by [31] enable the calculation of the basic reproductive ratio R 0 = β / γ . This descriptor is extremely useful in guiding the control strategies for epidemics. According to the epidemiological definition [32], it describes the average number of secondary cases produced by one infected individual introduced into a population of susceptible individuals.

4. Discussion

The original Richards function is of empirical nature that characterizes many incredible coincidences with biological, medical, ecological, and epidemic data, despite the fact that it depends on the b-exponent that does not have a clear biological meaning [31]. In the SIR model proposed by [31], the exponent in the Richards function b = 1 / ( 1 R 0 1 ) has a one-to-one nonlinear correspondence to the basic reproduction number R 0 (or reproductive ratio). In this work, we propose another interpretation of b-parameter; it describes the number of cells doubling, leading to an increase in a biomass of the system from m 0 (birth or hatching mass) to the limiting value m (mass at maturity). This interpretation is valid for sigmoidal but can also be extended to involuted growth. Since the involuted Richards Formula (35) is the product of decay exp [ ( a b ) c t ] and sigmoidal m ( t ) functions, b-exponent characterizes the pattern formation of the organ at the hypothetical absence of involution represented by the a-dependent decay term. This interpretation becomes clear if the limit
lim t exp [ ( a b ) c t ] m ( t ) = 0 · m 0 2 b = 0 · m , t 0 = 0
will be taken into consideration. A look into Table 1 reveals that the b-parameter fitted to the biological data considered is equal (or close) to the integer in the range of the standard deviations quoted. The calculations provided the following b-values: 6.20 ( 18 ) , 10.99 ( 64 ) , 5.93 ( 12 ) , 5.953 ( 61 ) , 3.22 ( 81 ) , and 11.77 ( 61 ) . One may confront them with the values generated from (29), specified in an alternative form:
b = 1 ln ( 2 ) ln m m 0
with m and m 0 measured or fitted by other models of growth. For example, in the case of T. rex, m = 7000 ( 980 ) [Kg] and m 0 = 2.06 ( 13 ) [Kg] are estimated by the von Bertalanffy model [26], yielding b = 11.73 ; for the FJ cancer, m = 48.4 [g] and m 0 = 0.015 [g] are calculated using the Gompertz function [15], providing b = 11.66 ; for Athens-Canadian male chicken, m = 2192.7 [g] and m 0 = 37.00 ( 3.02 ) [g] are determined by the logistic model [22], supplying b = 5.889 ; for zebra, m = 316.86 ( 2.10 ) [Kg] and m 0 = 33.70 ( 2.78 ) [g] are obtained from the von Bertalanffy model [23], giving b = 3.23 . All b-values calculated in this way conform acceptably with those presented in Table 1.
The b-interpretation proposed is no longer substantiated in the case of relative thymic-to-body mass ratio data for male Wistar rats reproduced by the function (37) with f = 0 and b = 2.42 ( 16 ) . The situation changes radically when b is determined using the absolute thymus weight–age data [19]. The calculations performed with f = 0 provided the parameters a = 5.88 ( 30 ) , b = 5.96 ( 58 ) , c = 0.0410 ( 41 ) [d−1], and m 0 = 0.0060 ( 25 ) [g], fitted with N S D = 1.608 and R 2 = 0.976 , clearly indicating that b-exponent for this organ is again represented by an integer number. We conclude that the interpretation proposed is valid only for absolute mass of organisms and organs but fails in the case of abstractive relative mass of the system.
A look into Table 2 and Table 3 reveals that both functions (36) and (37) describe an involuted thymus growth in a short time interval t ( 1 160 ) [d] with identical accuracy. A discrepancy appears only for M ( t = 240 [ d ] ) [g], indicating that the data collected for a larger time period should be analyzed only by means of function (37) with f 0 . In this way, the proper asymptotic behavior of the involuted Richards function will be taken into consideration. However, the values of the AIC and BIC indicators reported in Table 2 clearly inform us that in the case of reproducing the data for rat thymus, the inclusion of the f-parameter leads to the deterioration of the statistical characteristics of the fit, unlike in the case of data for the bursa of Fabricius. It can be observed that the AIC and BIC goodness-of-fit metrics provide guidance on the selection of the number of parameters that yield a statistically optimal fit to the experimental data. In this manner, the issue of overfitting can be identified and mitigated.

5. Conclusions

The findings of this study confirm that the PU methodology is highly effective in generating growth functions, with potential applications across various fields of the life sciences. In particular, this approach can be employed to obtain analytical solutions to the differential equations of the SIR model, thereby expanding the range of existing methods utilized for this purpose [33,34,35,36]. Furthermore, the application of a modified form of the generating function (5) enables the derivation of the sigmoidal and involuted Richards function in a previously unrecognized hyperbolic representation. This formulation extends the broad class of re-parameterized and unified Richards models discussed by [13], incorporating a novel variant of this widely utilized function. The derived formula has practical applications in epidemic modeling and the quantitative analysis of growth in biological systems, including thymus, bursa of Fabricius, copepods, tumors, fish, birds, mammals, and even dinosaurs. Additionally, it has been demonstrated that the analyzed growth data conform to a universal growth curve (41), which generalizes the function traditionally used for fitting weight–age data across a diverse range of species [5]. The approach proposed facilitates a precise biological interpretation of the b-exponent in the Richards functions (19) and (20). Specifically, the interpretation describes the number of cell doublings that contribute to the increase in biomass, from the birth or hatching mass to the limiting value representing the mass at maturity. The proposed interpretation predicts that the bb-parameter should correspond to an integer value (within the standard error of estimation), and the results of the calculations support this hypothesis. Application of the generalized PU methodology allows for a significant extension of the U 2 class of PU discovered by [6]—it originally contained only subclass U 2 0 represented by the WBE and von Bertalanffy growth functions. Improvement of the original CDG approach to include the generating function (3) allowed us to obtain [11] the following new subclasses: U 2 1 , embracing the universal growth curve [5], and U 2 2 , for the self-similar fractal function [12]. The results obtained here enriches the U 2 class by U 2 3 represented by the sigmoid and involuted Richards growth models in the hyperbolic representation unknown so far in the area of biosciences and beyond. This model cannot be derived in the original CDG approach [6], where the parameter c 0 , relevant for derivation, is neglected. The hyperbolic solution of the CDG equations can be employed to solve the Fokker–Planck equation [10] and generate the time-dependent probability distribution function. This framework can be further generalized through the incorporation of stochastic differential equations (SDEs) [37,38,39], wherein the growth equation is augmented by a perturbative term that accounts for stochastic (e.g., Brownian or Wiener) processes. This stochastic component introduces a statistical influence factor that enhances the realism of the growth functions by modifying the deterministic growth trajectories reproduced by conventional models.

Funding

This research received no external funding.

Data Availability Statement

The data reported can be found in the papers specified in the references.

Conflicts of Interest

The author declares no conflicts of interest.

Abbreviations

The following abbreviations are used in this manuscript:
AICAkaike Information Criterion
BICBayesian Information Criterion
CDGCastorina Delsanto Guiot
NSDNormalized Standard Deviation
PUPhenomenological Universalities
PU-SIRPhenomenological Universalities Susceptible–Infective–Removed
SDStandard Deviation
SDEStochastic Differential Equation
SIRSusceptible–Infective–Removed

References

  1. Gilbert, S.F. Developmental Biology; Sinauer Associates: Sunderland, MA, USA; Swarthmore College: Swarthmore, PA, USA, 2000; ISBN 10:0-87893-243-7. [Google Scholar]
  2. Bertalanffy, V.L. Problems of organic growth. Nature 1949, 163, 156–158. [Google Scholar] [CrossRef] [PubMed]
  3. Bertalanffy, V.L. Quantitative laws in metabolism and growth. Q. Rev. Biol. 1957, 32, 217–231. [Google Scholar] [CrossRef]
  4. Richards, F.J. A flexible growth function for empirical use. J. Exp. Bot. 1959, 10, 290–300. [Google Scholar] [CrossRef]
  5. West, G.B.; Brown, J.H.; Enquist, B.J. A general model for ontogenetic growth. Nature 2001, 413, 628–631. [Google Scholar] [CrossRef]
  6. Castorina, P.; Delsanto, P.P.; Guiot, C. Classification Scheme for Phenomenological Universalities in Growth Problems in Physics and Other Sciences. Phys. Rev. Lett. 2006, 96, 188701. [Google Scholar] [CrossRef]
  7. Gliozzi, A.S.; Guiot, C.; Delsanto, P.P. A new computational tool for the phenomenological analysis of multipassage tumor growth curves. PLoS ONE 2009, 4, e5358. [Google Scholar] [CrossRef]
  8. Barberis, L.; Condat, C.A.; Gliozzi, A.S.; Delsanto, P.P. Concurrent growth of phenotypic features: A phenomenological universalities approach. J. Theor. Biol. 2010, 264, 123–129. [Google Scholar] [CrossRef]
  9. Barberis, L.; Condat, C.A. Describing interactive growth using vector universalities. Ecol. Model. 2012, 227, 56–63. [Google Scholar] [CrossRef]
  10. Molski, M. Extended class of phenomenological universalities. Phys. Lett. A 2017, 381, 2629–2635. [Google Scholar] [CrossRef]
  11. Molski, M. Quantum and classical phenomenological universalities. Phys. Lett. A 2018, 382, 79–84. [Google Scholar] [CrossRef]
  12. Golmankhaneh, A.K.; Tunç, S.; Schlichtinger, A.M.; Asanza, D.M.; Golmankhaneh, A.K. Modeling tumor growth using fractal calculus: Insights into tumor dynamics. Biosystems 2024, 235, 105071. [Google Scholar] [CrossRef] [PubMed]
  13. Tjørve, E.; Tjørve, K.M.C. A unified approach to the Richards model family for use in growth analysis: Why we need only two model forms. J. Theor. Biol. 2010, 267, 417–425. [Google Scholar] [CrossRef] [PubMed]
  14. Molski, M. Theoretical modeling of pre and postnatal growth. J. Theor. Biol. 2018, 458, 58–67. [Google Scholar] [CrossRef] [PubMed]
  15. Laird, A.K. Dynamics of tumor growth. Br. J. Cancer 1964, 18, 490–502. [Google Scholar] [CrossRef] [PubMed Central]
  16. Akaike, H. A new look at the statistical model identification. IEEE Trans. Autom. Control 1974, 19, 716–723. [Google Scholar] [CrossRef]
  17. Schwarz, G. Estimating the dimension of a model. Ann. Stat. 1978, 6, 461–464. [Google Scholar] [CrossRef]
  18. Myhrvold, N.P. Revisiting the estimation of dinosaur growth rates. PLoS ONE 2013, 8, e81917. [Google Scholar] [CrossRef]
  19. Rhouma, K.B.; Sakly, M. Involution of rat thymus: Characterization of cytoplasmic glucocorticoid receptors, evidence of glucocorticoid resistant dexamethasone receptor-positive cells. Arch. Int. Physiol. Biochim. Biophys. 1994, 102, 97–102. [Google Scholar] [CrossRef]
  20. He, M.; Liang, X.; Wang, K.; Pu, H.; Hu, Y.; Ye, G.; Li, X.; Liu, L. Age-related development and histomorphological observation of bursa of Fabricius in yellow quails. Can. J. Anim. Sci. 2015, 95, 487–491. [Google Scholar] [CrossRef]
  21. Dampin, N.; Tarnchalanukit, W.; Chunkao, K.; Maleewong, M. Fish growth model for Nile Tilapia (Oreochromis niloticus). Procedia Environ. Sci. 2012, 13, 513–524. [Google Scholar] [CrossRef]
  22. Aggrey, S.E. Comparison of three nonlinear and spline regression models for describing chicken growth curves. Poult. Sci. 2002, 81, 1782–1788. [Google Scholar] [CrossRef] [PubMed]
  23. Smuts, G.L. Pre- and post-natal growth phenoena of Burchell’s zebra Equus burchelli antiquorum. Koedoe 1975, 18, 69–102. [Google Scholar] [CrossRef]
  24. Kempes, C.P.; Dutkiewicz, S.; Follows, M.J. Growth, metabolic partitioning, and the size of microorganisms. Proc. Natl. Acad. Sci. USA 2012, 109, 495–500. [Google Scholar] [CrossRef] [PubMed]
  25. Sugiura, K.; Benedict, S.R. The influence of certain diets upon tumor susceptibility and growth in albino rats. J. Cancer Res. 1920, 5, 373–401. [Google Scholar]
  26. Lee, S.A. Incubation times of dinosaur eggs via embryonic metabolism. Phys. Rev. E 2016, 94, 022402. [Google Scholar] [CrossRef]
  27. Hethcote, H.W. The Mathematics of Infectious Diseases. SIAM Rev. 2000, 42, 599–653. [Google Scholar] [CrossRef]
  28. Kröger, M.; Schlickeiser, R. Analytical solution of the SIR-model for the temporal evolution of epidemics. Part A: Time-independent reproduction factor. J. Phys. Math. Theor. 2020, 53, 505601. [Google Scholar] [CrossRef]
  29. Schlickeiser, R.; Kröger, M. Analytical solution of the SIR-model for the temporal evolution of epidemics. Part B: Semi-time case. J. Phys. Math. Theor. 2021, 54, 175601. [Google Scholar] [CrossRef]
  30. Sivaraman, N.K.; Gaur, M.; Baijal, S.; Muthiah, S.B.; Sheth, A. Exo-SIR: An epidemiological model to analyze the impact of exogenous spread of infection. Int. J. Data Sci. Anal. 2025, 19, 303–318. [Google Scholar] [CrossRef]
  31. Wanga, X.-S.; Wu, J.; Yang, Y. Richards model revisited: Validation by and application to infection dynamics. J. Theor. Biol. 2012, 313, 12–19. [Google Scholar] [CrossRef]
  32. van den Driessche, P. Reproduction numbers of infectious disease models. Infect. Dis. Model. 2017, 2, 288–303. [Google Scholar] [CrossRef]
  33. Biazae, J. Solution of the epidemic model by Adomian decomposition method. Appl. Math. Comput. 2006, 173, 1101–1106. [Google Scholar] [CrossRef]
  34. Rafei, H.; Daniali, H.; Ganji, D.D. Variational iteration method for solving the epidemic model and the prey and predator problem. Appl. Math. Comput. 2007, 186, 1701–1709. [Google Scholar] [CrossRef]
  35. Rafei, H.; Ganji, D.D.; Daniali, H. Solution of the epidemic model by homotopy perturbation method. Appl. Math. Comput. 2007, 187, 1056–1062. [Google Scholar] [CrossRef]
  36. Engida, H.A.; Theuri, D.M.; Gathungu, D.; Gachohi, J.; Alemneh, H.T. A mathematical model analysis for the transmission dynamics of leptospirosis disease in human and rodent populations. Comput. Math. Methods Med. 2022, 1, 1806585. [Google Scholar] [CrossRef] [PubMed]
  37. Kapur, P.K.; Anand, S.; Yamada, S.; Yadavalli, V.S.S. Stochastic Differential Equation-Based Flexible Software Reliability Growth Model. Math. Probl. Eng. 2009, 2009, 581383. [Google Scholar] [CrossRef]
  38. Samoletov, A.; Vasiev, B. A mathematical framework for the statistical interpretation of biological growth models. BioSystems 2024, 246, 105342. [Google Scholar] [CrossRef]
  39. Baltazar-Larios, F.; Delgado-Vences, F.; Ornelas, A. Parameter estimation and model selection for stochastic differential equations for biological growth. Environ. Ecol. Stat. 2025, 32, 195–227. [Google Scholar] [CrossRef]
Figure 1. The plots of the function (34) for different values of a and b = 2 , c = m 0 = 1 , and t 0 = 0 . For a = b = 2 , one obtains the sigmoid Richards growth function.
Mathematics 13 01316 g001
Figure 2. The plots of involuted Richards functions (35) and (37) defined by parameters from Table 2. Black circles represent the thymic-to-body mass ratio of male Wistar rats measured by [19].
Mathematics 13 01316 g002
Figure 3. The plots of involuted Richards functions (35) and (37) defined by parameters from Table 2. Black circles represent the absolute weights of bursa of Fabricius yellow quail measured by [20].
Mathematics 13 01316 g003
Figure 4. The generalized universal growth curve (41) and experimental data points for exemplary biological systems taken into consideration.
Mathematics 13 01316 g004
Figure 5. The plots of normalized S, I, and R functions for β = 10.8 , γ = 0.9 , and S + I + R = 2 .
Mathematics 13 01316 g005
Table 1. The parameters of the hyperbolic Richards function (40) obtained by the fit of N D experimental weight–age data points. The uncertainty in parentheses is one estimated standard deviation in units of the last quoted digits of the values of parameters fitted.
ParameterC. pacificusFJ CancerT. Rex
m04.83(80) [g × 10−6]0.0199(116) [g]2.04(87) [Kg]
c [d−1]0.0873(65)0.0303(35)0.0747(48) [y−1]
b6.20(18)10.99(64)11.77(61)
SD4.568 [g × 10−6]0.438 [g]283 [Kg]
R20.9960.9950.979
ND878
ChickenZebraTilapia
m0 [g]35.5(1.1)33,864(1858)5.83(44)
c [d−1]0.0155(4)0.0024(2)0.0089(5)
b5.953(61)3.22(81)5.93(12)
NSD0.6000.6690.611
R20.9930.9500.951
ND281713
Table 2. The parameters of the involuted Richards functions (35) and (37) obtained by the fit of 12 experimental relative weight–age data points in units [g/100 g] [19] for the thymi of male Wistar rats and 12 data representing absolute weights [mg] of bursa of Fabricius in Chinese yellow quail [20]. The uncertainty in parentheses is one estimated standard deviation in units of the last quoted digits of the values of the parameters fitted.
ThymusBursa of Fabricius
Parameter Equation (35) Equation (37) Equation (35) Equation (37)
m00.103(11)0.106(11)4.60(3.90)9.01(2.01)
a2.24(16)2.44(28)4.86(1.25)7.16(1.89)
b2.42(16)2.65(30)5.12(1.22)7.69(1.86)
c [d−1]0.086(12)0.083(11)0.0613(193)0.0501(99)
d = b − a0.182(35)0.210(50)0.26(10)0.53(17)
f00.017(16)07.58(1.54)
NSD1.06841.07072.18951.3924
R20.98600.98770.94530.9815
AIC−94−915850
BIC−96−955646
Table 3. Theoretical reproduction of 12 experimental relative weight–age data measured with S D = u i = 0.0140 [g/100 g] by [19] for thymi of male Wistar rats by the involuted Richards functions (35) and (37) with parameters from Table 2.
f = 0 f = 0.017(16)
Time [d] m i exp ( u i ) m i exp m i theo u i m i theo m i exp m i theo u i m i theo
00.10310.02640.1027−0.17460.1055
20.1426−0.20360.1455−0.19130.1453
50.22000.29810.21580.50250.2130
150.3584−0.37780.3637−0.49910.3654
300.35831.35690.33931.15100.3422
450.2599−0.86910.2721−0.81700.2713
600.1910−1.75260.2155−1.56330.2129
750.19171.50760.17061.71760.1677
900.1349−0.00800.13500.14760.1328
1050.1031−0.26790.1069−0.21000.1060
1600.05000.33440.0453−0.05870.0508
2400.02500.85610.0130−0.00470.0251
Table 4. Theoretical reproduction of 12 experimental data measured with S D = u i for absolute weights ([mg]) of bursa of Fabricius in Chinese yellow quail [20] by the involuted Richards functions (35) and (37) with parameters from Table 2.
f = 0 f = 7.58(1.54)
Time [d] m i exp ( u i ) m i exp m i theo u i m i theo m i exp m i theo u i m i theo
05.28(2.15)0.31434.6041−1.73729.0148
725.97(4.92)0.391524.04371.524518.4694
2170.77(7.71)−1.187279.9236−0.655875.8266
35100.23(6.47)2.250785.66820.316498.1829
6363.21(3.90)1.284558.20030.677860.5664
9124.43(3.88)−3.299837.2332−2.192832.9379
11919.43(1.96)−2.217523.7763−0.073819.5746
14715.23(1.75)0.027315.18221.127113.2599
17512.83(2.54)1.23459.69441.009210.2576
2039.98(3.52)1.07666.19030.31598.8678
2248.15(1.21)3.08114.4218−0.14558.3261
2527.45(3.28)1.41052.8235−0.15177.9477
Disclaimer/Publisher’s Note: The statements, opinions and data contained in all publications are solely those of the individual author(s) and contributor(s) and not of MDPI and/or the editor(s). MDPI and/or the editor(s) disclaim responsibility for any injury to people or property resulting from any ideas, methods, instructions or products referred to in the content.

