Abstract
Effective coordination between fiscal and monetary policy is crucial for macroeconomic stability, yet achieving it presents significant challenges due to differing objectives and institutional setups. This study evaluates the strategic interaction between fiscal and monetary authorities in Hungary from 2013 to 2023, employing the Nash equilibrium framework under the assumption of non-cooperative behavior. By modeling the authorities as independent players optimizing distinct payoff functions based on key economic indicators (interest rates, government spending, inflation, output gap, fiscal deficit, and public debt), the analysis estimates the best response strategies and computes the resulting Nash equilibrium. The key findings reveal persistent deviations between actual policies and the computed equilibrium strategies. Specifically, actual fiscal policy was consistently more expansionary (average actual deficit −2.6% to 7.6% GDP vs. equilibrium recommendations ranging from 8.5% surplus to −3.0% deficit) than the Nash equilibrium indicated, particularly during periods of economic growth. Monetary policy often lagged in equilibrium recommendations, maintaining low interest rates (e.g., 0.9% actual vs. 11.5% equilibrium in 2019) before implementing sharp increases (13% actual vs. approx. 3.5–3.8% equilibrium in 2022–2023) that significantly overshot the equilibrium. These misalignments underscore potential suboptimal outcomes arising from independent policymaking, contributing to increased public debt and heightened inflationary pressures in the Hungarian context. This study highlights the potential benefits of aligning policies closer to mutually consistent strategies, suggesting that improved coordination frameworks could enhance macroeconomic stability, offering insights relevant to Hungary and similar economies.
MSC:
91A10
1. Introduction
Fiscal and monetary policies are the primary instruments governments and central banks employ to manage macroeconomic outcomes. Fiscal policy, concerning government spending and taxation, directly impacts aggregate demand and resource allocation [1]. Monetary policy, typically managed by an independent central bank, focuses on price stability through adjustments in interest rates and money supply [2]. Despite distinct tools and immediate goals, these policies are deeply intertwined. Fiscal decisions affect aggregate demand and inflation, shaping the environment for monetary policy [3], while monetary actions influence interest rates and credit conditions, impacting government borrowing costs and the effectiveness of fiscal measures.
When pursued in isolation, uncoordinated fiscal and monetary actions can yield conflicting outcomes or unintended consequences, potentially destabilizing the economy. For example, expansionary fiscal policy might fuel inflation, necessitating monetary tightening that counteracts the initial stimulus. Conversely, fiscal consolidation could dampen the impact of monetary easing [4]. Such interactions highlight the strategic interdependence between policy authorities. Various game theory frameworks can be employed to analyze such non-cooperative strategic interactions, including the Nash equilibrium (analyzing simultaneous moves), Stackelberg games (modeling leader–follower dynamics), and more complex Dynamic Stochastic General Equilibrium (DSGE) models (incorporating micro-foundations and rational expectations). Each framework offers a unique lens through which to understand the strategic choices and potential outcomes when policymakers act independently [5,6]. This study focuses on the Nash equilibrium framework to analyze these dynamics.
Hungary’s recent economic history, marked by significant fiscal adjustments and evolving monetary policy responses, particularly between 2013 and 2023, presents a compelling case study. This period witnessed tensions between fiscal objectives and monetary stability goals, potentially leading to policy conflicts and suboptimal results, such as persistent output gaps or volatile interest rates, when coordination is absent [4]. The observed dynamics provide valuable empirical grounding for examining theories of policy interaction. However, the Hungarian context includes complexities such as high economic openness, vulnerability to external shocks (including effects from the global financial crisis, the COVID-19 pandemic, and the war in Ukraine), and the influence of factors like unemployment and income distribution, which are acknowledged limitations not fully incorporated into the simplified model used herein.
The potential for conflicting incentives and macroeconomic instability arises when authorities optimize independently. This motivates the investigation of non-cooperative scenarios through the lens of Nash equilibrium [7]. While recognizing that some level of formal or informal coordination might have occurred between Hungarian authorities during the study period, this analysis adopts the assumption of independent, non-cooperative action. This specific assumption is made for analytical tractability and to isolate the potential consequences of strategic interaction when binding coordination mechanisms are absent or imperfect. It allows the study to establish a benchmark based on non-cooperative game theory, highlighting the inherent tensions and potential inefficiencies that can arise even if some coordination exists in practice [8]. This study examines how independent optimization, given Hungary’s fiscal deficits, public debt trajectory, and inflation dynamics [9], might lead to a Nash equilibrium that is suboptimal for overall economic welfare. This paper evaluates the strategic interaction between fiscal and monetary authorities in Hungary (2013–2023) using a Nash equilibrium model. It aims to (1) develop a model capturing the authorities’ strategic behavior based on estimated payoff functions derived from key macroeconomic data (interest rates, government spending, inflation, output gap, fiscal deficit, and public debt) and (2) analyze how observed policy decisions deviated from the computed Nash equilibrium strategies, assessing the implications for macroeconomic stability within this non-cooperative framework. The analysis draws on theoretical foundations [10,11] adapted to Hungary’s context, acknowledging the model’s limitations regarding the independence assumption and exclusion of external shocks and other structural factors.
The primary contribution of this study is the application of the Nash equilibrium framework to empirically assess fiscal–monetary interactions in Hungary during the specific 2013–2023 period, characterized by unique economic pressures and policy responses. Unlike broader theoretical work or studies focused on different economies or timeframes, this research provides updated, country-specific empirical evidence on the potential costs of policy misalignment calculated via deviations from a computed Nash equilibrium. By quantifying these deviations, this study offers specific insights into the tensions between fiscal needs and monetary stability mandates in Hungary under non-cooperative assumptions. While acknowledging model limitations, the findings provide considerations for Hungarian policymakers regarding potential weaknesses in policy frameworks and offer relevant insights for other economies facing similar coordination challenges [12,13,14].
This paper is structured as follows: Section 2 reviews the relevant literature on policy coordination models and interactions. Section 3 details the theoretical framework and methodology, including the Nash equilibrium model specification and data sources. Section 4 presents the empirical results, including parameter estimations, best response simulations, Nash equilibrium computation, and comparison with actual policies. Section 5 discusses the findings, concludes the study, outlines limitations, and suggests directions for future research.
2. Literature Review
2.1. Theoretical Framework
The interaction between fiscal and monetary authorities can be effectively analyzed using game theory, which provides tools for understanding strategic decision-making among interdependent actors. Within this field, the Nash equilibrium, developed by John Nash [15], is a central concept in non-cooperative game theory. It describes a stable state in a strategic interaction where no single player can improve their outcome by unilaterally changing their strategy, given the strategies chosen by the other players [16,17].
In the context of macroeconomic policy, the fiscal authority (controlling government spending and debt) and the monetary authority (managing inflation and interest rates) can be modeled as players with distinct, sometimes conflicting, objectives. The Nash equilibrium framework is particularly relevant for analyzing scenarios where these authorities act independently, without binding coordination agreements. It helps identify potential suboptimal outcomes that can arise even when each authority acts rationally based on its own mandate [8]. While other game theoretic concepts exist, such as Stackelberg equilibrium (assuming a leader–follower relationship) or cooperative game theory (assuming binding agreements), the Nash equilibrium is chosen for this study because it directly addresses the challenges arising from simultaneous, non-cooperative decision-making, reflecting situations where neither authority has clear dominance and formal coordination is lacking [5].
Applying this concept requires defining the “strategies” available to each player (e.g., levels of government spending, target interest rates) and their “payoff functions”, which quantify the objectives or utility each authority derives from different macroeconomic outcomes (e.g., output gap, public debt levels, inflation rate, interest rate stability) resulting from the combined policy choices. The equilibrium occurs when each authority’s chosen strategy is its best response to the strategy chosen by the other authority.
It is important to acknowledge that this framework typically assumes rational players with well-defined and stable payoff functions. Real-world policymaking, however, often involves complexities such as political considerations, imperfect information, time-varying objectives, and bounded rationality, which represent limitations to the direct applicability of the theoretical model [9]. Nonetheless, the Nash framework provides a valuable benchmark for understanding the inherent strategic tensions [18].
Conceptually, the payoff for each authority depends on key macroeconomic variables influenced by both policies. For the fiscal authority, objectives often relate to stabilizing the economy (e.g., minimizing the output gap, ) while ensuring fiscal sustainability (e.g., managing public debt, ). Its payoff can thus be considered a function dependent on these variables. Similarly, the monetary authority typically focuses on price stability (e.g., keeping inflation, , near a target) and potentially smoothing interest rates (), making its payoff dependent on these factors [1,4]. The specific mathematical forms translating these dependencies into operational payoff functions are detailed in the Section 3.
2.2. Fiscal and Monetary Policy Interactions
A rich stream of the literature has examined the complex interactions between fiscal and monetary policies, focusing on both the incentives for policy coordination and the potential for conflict. Early contributions by Sargent and Wallace [11] and Leeper [10] provided a framework for highlighting the conditions under which either fiscal or monetary policy might dominate, as well as the implications of such dominance for macroeconomic stability. These foundational studies highlight that the lack of coordination often results in high inflation and volatile growth, showing the inherent tension between independent policy actions. Subsequent research has built on these early insights by utilizing dynamic game frameworks and empirical models to further explore the strategic interactions between policy authorities, often revealing suboptimal macroeconomic equilibria when each authority pursues its agenda independently [4,8,19]. This focus on non-cooperative behavior is particularly relevant given the real-world challenges of achieving and sustaining effective coordination. These challenges stem from several factors, including conflicting objectives between fiscal goals (like growth and employment) and monetary goals (price stability), as well as different time horizons in their policy adjustments. Central bank independence, while vital for credibility, can create institutional separation. Political pressures often drive fiscal policy, potentially misaligning it with monetary objectives. Furthermore, information gaps, commitment issues, the complexity of economic systems, and historical precedents can all impede effective and lasting coordination [20].
In addition to theoretical developments, empirical studies have provided valuable evidence on the real-world implications of fiscal–monetary policy interactions. Researchers have studied cases where policy misalignment has caused harmful economic effects. For instance, Chibi, Chekouri, and Benbouziane [21] analyzed the Algerian context, where changes in fiscal and monetary policies highlighted the fragility of economic stability due to conflicting objectives. Although focused on Algeria, such empirical evidence has resonated across different economies, including Hungary, which has recently shown similar trends of fiscal imbalance along with monetary adjustments. This body of the literature importantly shows that coordinated policy frameworks are not just academic ideas but have significant practical implications for addressing challenges like inflation control and debt sustainability across different economic regimes.
Furthermore, the discussion on fiscal and monetary coordination includes finding institutional factors that help or block effective policymaking. Chortareas and Mavrodimitrakis [14] showed how leadership in a monetary union can create more aligned fiscal policies, reducing the risk of conflict. A wide range of the literature shows that conflicts often come from unclear commitment strategies, which makes policy coordination less effective. These findings highlight that, although independent optimization sounds good in theory, we need to look more closely at ways to align policy objectives in practice. This extensive review of the literature shows that more research is needed into coordinated frameworks. This study aims to help by applying the Nash equilibrium model to the Hungarian case, offering new perspectives on resolving the tension between fiscal and monetary mandates.
2.3. Empirical Studies on Policy Coordination
A broad spectrum of empirical studies has explored the dynamics of policy coordination, showing how fiscal and monetary interactions affect macroeconomic stability both globally and within Europe. Early empirical investigations, such as those by Sargent and Wallace [11] and Leeper [10], provided compelling evidence that independent policy actions often result in suboptimal outcomes, especially when fiscal imbalances weaken monetary objectives. Reinhart and Rogoff’s [22] important work on debt and growth emphasized the risks of fiscal unsustainability, generally understood as a situation where government debt grows persistently faster than the government’s ability to service it without drastic policy changes (like sharp spending cuts, tax hikes, or inflationary financing), potentially leading to crises of confidence, default risks, or severe economic instability. It showed how different fiscal and monetary strategies can cause long periods of economic instability. These studies have paved the way for more localized analyses, which have looked at the detailed effects of policy coordination in different economic settings.
In Europe, empirical research has looked at the challenges faced by member states and economies working under common monetary systems. Engwerda, van Aarle, and Anevlavis [23] studied how introducing eurobonds affects debt stabilization in a monetary union. They found that better fiscal coordination can reduce the spread of fiscal shocks across countries. Similarly, Chortareas and Mavrodimitrakis [14] looked at how political leadership and institutional frameworks help align fiscal policies in the Eurozone. Their findings suggest that coordinated fiscal responses are crucial for maintaining macroeconomic stability and preventing disruptive inflation and output volatility when fiscal or monetary authorities act alone.
On a global scale, empirical studies have demonstrated that policy coordination is not a one-size-fits-all solution [24]. It requires a careful consideration of country-specific factors. Di Bartolomeo and Di Gioacchino [4], for instance, used panel data approaches to show that countries with disciplined fiscal frameworks and consistent monetary policies tend to have better long-term growth prospects and lower inflation variability. Their work, along with studies by Saulo, Rêgo, and Divino [8], supports the idea that strong and predictable coordination mechanisms can greatly improve the effectiveness of macroeconomic policy. Contemporary studies emphasize the challenges posed by overlapping crises (e.g., pandemic, energy shocks), which necessitate even greater coordination yet often strain institutional capacities [25]. These empirical investigations highlight the importance of adapting policy coordination to each country’s institutional and economic realities, while keeping the overall principles of alignment consistent.
In Hungary specifically, several studies have shown [26,27,28] that times of excessive fiscal spending and reactive monetary adjustments have caused financial instability. Although Hungary has not been studied as much as other European economies, the available evidence shows similarities with broader European experiences. The lack of deliberate coordination often leads to policy conflict and economic fragility. The Hungarian case is an important example for testing theories of policy interaction, especially using the Nash equilibrium framework, which captures the interdependent decision-making of fiscal and monetary authorities. Overall, the empirical literature from both global and European contexts shows the critical need for a coordinated approach to economic policy. This is a central theme of the present study.
2.4. Historical Perspective on Fiscal and Monetary Policies
Over the past decade, Hungary has experienced significant fluctuations in both fiscal and monetary policies, reflecting its response to both domestic challenges and broader European economic dynamics. Hungary’s fiscal story includes times of high public spending, periodic fiscal deficits, and challenges in managing debt [26]. These issues have often led to conflicts between fiscal prudence and the desire for economic stimulus. Researchers such as Bennett and Loayza [9] have noted that policy biases can occur when fiscal and monetary authorities have different goals. This is especially true in Hungary’s case, where quick policy changes have sometimes led to unintentional macroeconomic consequences.
In parallel, the monetary policy environment in Hungary has been marked by an evolving framework that has aimed to balance inflation control with the need to support growth. The Hungarian central bank has frequently adjusted its policy rate in response to both domestic economic signals and the broader policy directives within the European monetary sphere. Di Bartolomeo and Di Gioacchino [4] provide a useful framework for understanding how the mix of fiscal expansion and monetary tightening, in a context of high public debt, can create a dynamic but often conflicting economic equilibrium. This tension has been evident in Hungary’s efforts to stabilize the currency and control inflation while simultaneously addressing structural issues such as an output gap and external imbalances. The repeated episodes of volatile inflation and interest rates highlight the cost of operating in an environment where coordination between fiscal and monetary authorities is not fully established.
Adding another layer to this complex picture, recent studies have highlighted how political factors and institutional reforms have influenced policy directions. Chortareas and Mavrodimitrakis [14] argue that leadership within governmental frameworks and a commitment to fiscal discipline can enhance the effectiveness of macroeconomic policies, a lesson that many European countries have begun to internalize. In Hungary, efforts to modernize fiscal rules and reduce public debt have coexisted with a cautious approach to monetary easing. These evolving policy responses show that while Hungary is trying to align with broader European trends, the legacy of past fiscal imbalances and institutional inertia still poses challenges. Thus, the Hungarian experience over the past decade shows how historical policy decisions and external shocks combine to shape current macroeconomic realities. This context not only enriches our understanding of fiscal–monetary interactions in transitional economies but also highlights the critical need for effective coordination strategies, an issue that this research aims to address through the Nash equilibrium framework.
3. Methodology
3.1. Research Design
This study adopts a quantitative research design with a focus on economic game theory to analyze the interaction between fiscal and monetary policy in Hungary. The central approach is to employ the Nash equilibrium model as a framework for understanding how fiscal and monetary authorities interact in a non-cooperative setting. In this context, each policy authority is modeled as an independent player whose strategy is aimed at optimizing a payoff function specific to its policy objectives. Conceptually, fiscal policy objectives often involve managing government spending, fiscal deficits, and public debt to influence aggregate demand and ensure long-term sustainability. Monetary policy typically focuses on variables like interest rates, inflation, and sometimes output gaps to maintain price stability and support economic activity. The empirical specification used later in this study will focus on specific measurable proxies for policy stances and objectives, recognizing that this remains a simplification of the complex decision-making environment. The Nash equilibrium framework is particularly well suited for this analysis because it facilitates an understanding of how each authority’s decisions may lead to a stable, yet suboptimal, equilibrium if coordination is not achieved [4,11].
However, it is important to acknowledge that this modeling approach simplifies the complex reality of policymaking by assuming independent actions between the fiscal and monetary authorities. In practice, there may have been instances of coordination between the Hungarian government and the central bank during the period under study (2013–2023). This assumption is made to facilitate the application of the Nash equilibrium framework but may not fully capture the nuances of policy interactions in Hungary. Moreover, the model deliberately simplifies reality and does not account for several key factors known to influence policy decisions and economic outcomes in Hungary. These omissions represent important limitations of the current study’s scope: the openness of the economy (Hungary’s high degree of openness means external factors (trade, FDI, and exchange rates) significantly impact the effectiveness and choices of domestic policies, which are not modeled here), external economic influences (global conditions, EU policies, and capital flows are not explicitly included), other economic and social indicators (important variables like unemployment rates, income distribution, demographic trends, and specific social welfare goals) [29], which undoubtedly influence policymakers, are not incorporated into the simplified payoff functions or the subsequent empirical model. Additionally, the model operates within a neo-classical framework that assumes normal economic conditions and rational behavior by policy authorities. It does not explicitly account for major external shocks that have significantly impacted Hungary’s economy during the study period, such as the global financial crisis effects, the COVID-19 pandemic, and the war in Ukraine. Including these factors would require a significantly more complex modeling framework (e.g., a large-scale DSGE model), which is beyond the scope of this analysis focused on illustrating strategic interactions via a tractable Nash equilibrium approach. To implement the Nash equilibrium framework effectively within these limitations, this study requires a comprehensive dataset that captures key economic indicators for Hungary, focusing on the selected variables. Specifically, the following variables will be collected: interest rates: benchmark rates and short-term rates set by the Hungarian National Bank to observe monetary policy adjustments; government spending: detailed data on public expenditure that affects aggregate demand; inflation rates: consumer price index data to measure price stability over time; output gaps: estimates derived from the differences between potential and actual output to reflect economic slack or overheating; fiscal deficits: annual fiscal deficit or surplus figures, which are critical in understanding the sustainability of fiscal policies; and public debt: data on the total public debt to examine the long-term fiscal position of the country.
The timeframe chosen for data collection extends from 2013 to 2023. This decade-long period provides a sufficient historical context for capturing both cyclical fluctuations and structural changes in Hungary’s economic environment. The period is also representative of the post-crisis adjustments and the evolving impact of monetary and fiscal policies in response to both domestic challenges and external pressures associated with European economic integration.
The datasets for this study covering the period 2013–2023 are gathered from reputable and credible sources to ensure reliability. Data related to policy interest rates, detailed government spending, and public debt figures were primarily obtained from the official publications and statistical databases of the Hungarian National Bank (Magyar Nemzeti Bank, MNB) and relevant Hungarian governmental statistical agencies. Complementary macroeconomic indicators, including consumer price index inflation rates and estimates of the output gap, were sourced from Eurostat, the statistical office of the European Union, and the International Monetary Fund (IMF) World Economic Outlook database [13,30]. This multi-source approach allows for cross-checking and ensures the use of standardized, comparable data commonly employed in macroeconomic analysis for Hungary. This multi-source approach enhances the empirical analysis but remains within the constraints of the variables selected for the model.
The methodological design leverages econometric analyses and game theoretic simulations, allowing the study to capture the dynamic interactions between fiscal and monetary authorities within Hungary’s unique economic setting. However, the limitations regarding the exclusion of key factors, the assumption of independent actions, and the omission of external shocks must be considered when interpreting the results. This study provides a platform for evaluating policy coordination issues within the specified scope, offering insights while acknowledging the model’s constraints.
3.2. Analytical Framework
A dynamic game theoretic model based on the Nash equilibrium framework is developed to capture the strategic interactions. The fiscal authority (F) and the monetary authority (M) are modeled as players in a non-cooperative game, each choosing a policy strategy ( and , respectively) to optimize its payoff function over time. A pair of strategies constitutes a Nash equilibrium if neither player can unilaterally improve their outcome by deviating, given the other player’s strategy. Formally,
where and are the payoff functions for the fiscal and monetary authorities, respectively. The payoff functions quantify the objectives of each authority. They depend on macroeconomic outcomes influenced by both policies, potentially including costs associated with implementing strategies. While real-world objectives are complex, the model simplifies these into functions of key variables. Consistent with standard literature [8], the fiscal authority’s payoff is assumed to primarily depend on the output gap (, the difference between actual and potential output) and the level of public debt (). The monetary authority’s payoff is assumed to depend on the deviation of inflation () from its target () and possibly the level or volatility of the nominal interest rate (). Specifically, we operationalize these dependencies as
where represents the fiscal authority’s valuation of output and debt levels, and represents the monetary authority’s valuation of inflation and interest rate outcomes. and represent potential costs of policy implementation, often assumed quadratic [8]. For empirical tractability in this study, specific functional forms relating policy actions to these outcomes are estimated via reaction functions, implicitly defining the preferences revealed through policy choices. A key element is deriving the best response (BR) function for each authority, which identifies the optimal strategy for one player given the other’s strategy.
The intersection of these best response functions yields the Nash equilibrium [19]. The model incorporates dynamics by assuming that current economic outcomes depend on past outcomes and policy actions. For instance, the evolution of the output gap can be represented by a simple autoregressive process influenced by the policy mix:
where is the output gap at time t, and represent the stance of fiscal and monetary policy at time t (e.g., fiscal impulse, the deviation of interest rate from neutral), α captures the persistence of the output gap (0 ≤ α < 1), and measure the impact multipliers of fiscal and monetary policy on the next period’s output gap, and is a stochastic shock term. Similar dynamics can be specified for inflation. Such equations are common reduced-form representations in macroeconomic modeling [31]. This study uses empirically estimated relationships to capture these dynamics implicitly.
The connection between the policy actions and the macroeconomic outcomes (, , , and ) is governed by the economy’s underlying structure and transmission mechanisms [32]. Specifying and estimating a full structural model representing these mechanisms (e.g., a detailed DSGE model for Hungary) is beyond the scope of this study, which focuses specifically on analyzing the strategic interaction through the lens of estimated policy reaction functions and the Nash equilibrium concept. This approach assumes standard transmission channels (e.g., fiscal policy impacts aggregate demand, monetary policy influences inflation and output via interest rates) without explicitly modeling their microfoundations. The framework highlights the endogenous link between policy choices and outcomes, forming the basis for the game theoretic analysis, but relies on reduced-form estimations for empirical implementation [19].
3.3. Estimation Strategy
To operationalize the model, we estimate reaction functions that approximate the authorities’ behavior and implicitly reveal their preferences and perceived constraints. These estimated functions are then used to derive the best response curves. The fiscal authority’s stance, represented by the fiscal deficit as a percentage of GDP , is modeled as a function of the output gap (, the percentage deviation of actual GDP from potential GDP) and the public debt as a percentage of GDP . This specification aims to capture systematic responses to cyclical conditions and debt levels:
where is a constant term, is expected to be negative if fiscal policy is counter-cyclical (reducing deficits/increasing surpluses when output is above potential), reflects the response to debt levels (a negative would indicate consolidation efforts when the debt is high), and is the regression residual. The selection of and follows the standard fiscal rule literature [33]. The monetary authority’s policy instrument, the benchmark policy interest rate , is modeled using a specification similar to a Taylor rule [33], responding to the inflation gap and the output gap:
where represents the intercept (related to the neutral interest rate i and target inflation ), is the annual inflation rate, is the central bank’s inflation target (assumed to be 3% for the period, consistent with MNB communications), measures the responsiveness to the inflation gap (expected > 1 for active inflation stabilization, according to the Taylor principle), measures the response to the output gap (expected δ > 0 if stabilizing output is also an objective), and is the residual. The parameters , , , , , and are estimated using Ordinary Least Squares (OLS) regression [34] based on annual data from 2013 to 2023. The justification for variable selection rests on their centrality in macroeconomic policy objectives and standard policy rule formulations [10,33]. These estimates are then used to construct the best response functions needed for computing the Nash equilibrium in Section 4.
4. Results and Discussion
In this section, we present the empirical findings from the analysis of Hungary’s fiscal and monetary policy interactions over the period 2013 to 2023. Using the Nash equilibrium framework outlined in the methodology, we aim to evaluate the extent of coordination (or non-coordination) between fiscal and monetary authorities and its impact on key macroeconomic variables. The analysis is conducted using Python (version 3.10) to handle data processing, estimation, and simulations.
4.1. Descriptive Analysis
As shown in Table 1, we observe significant fluctuations in Hungary’s fiscal and monetary variables between 2013 and 2023. The average interest rate over this period was approximately 3.46%, with a notable decline to a minimum of 0.6% from 2016 to 2021, reflecting an accommodative monetary policy stance. However, there was a sharp increase to 13% in 2022 and 2023, coinciding with a surge in inflation rates, which peaked at 17.1% in 2023. The inflation rate exhibited substantial volatility, with periods of deflation in 2014 and 2015 (inflation rates of −0.2% and −0.1%, respectively) and a dramatic rise beginning in 2021. These shifts can be linked to significant economic events such as the global COVID-19 pandemic in 2020, which prompted economic downturns and expansive fiscal policies, and the economic repercussions of the Ukraine war starting in 2022, which disrupted supply chains and increased energy prices, leading to higher inflation.

Table 1.
Variable statistical summary.
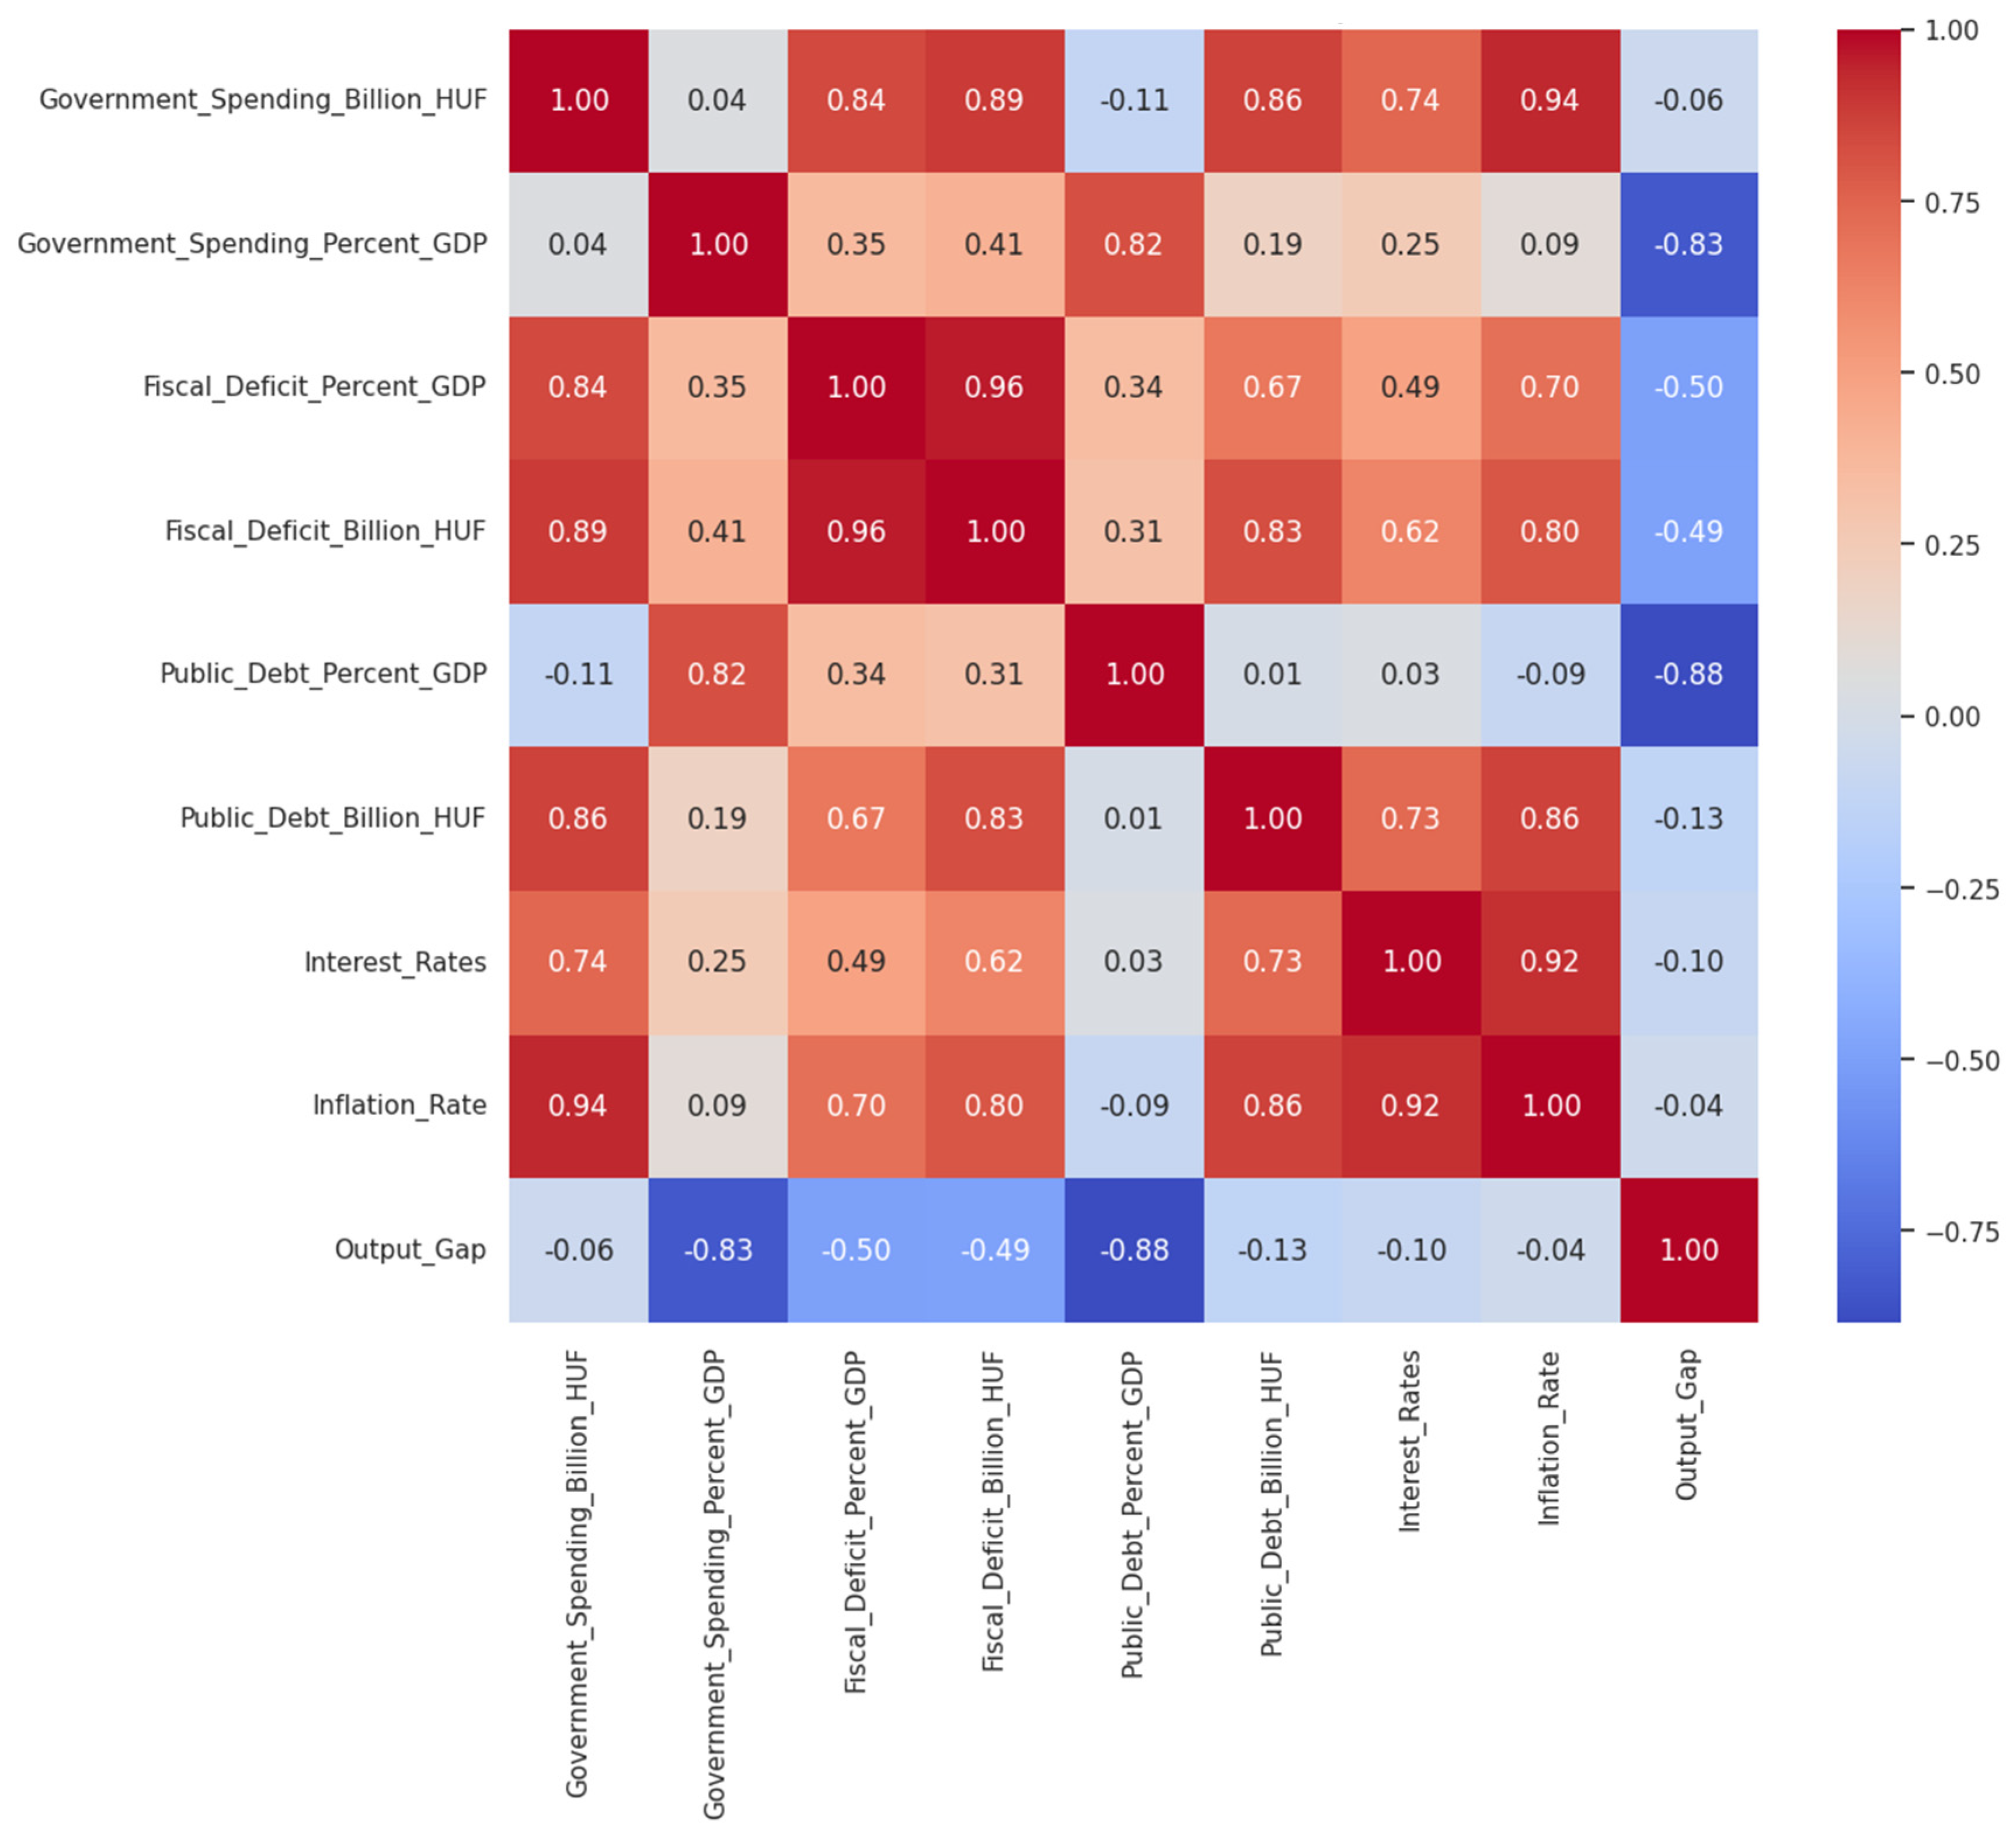
Figure 1 provides insights into the relationships between fiscal and monetary variables. There is a strong positive correlation (0.94) between government spending (in HUF billion) and the inflation rate, suggesting that increased government spending was associated with higher inflation during this period. Similarly, the high positive correlation between interest rates and inflation rate (0.92) indicates that the central bank adjusted interest rates in response to inflationary pressures. The strong positive correlations between government spending and fiscal deficits (both in percent of GDP and in HUF billion) highlight how increased spending contributed to higher deficits. Moreover, the negative correlations between the output gap and both government spending as a percentage of GDP (−0.83) and public debt as a percentage of GDP (−0.88) suggest that higher relative government spending and debt levels were associated with lower economic output, possibly due to crowding out private investment or inefficiencies in public expenditures. These findings underscore the complex interplay between fiscal expansion, monetary policy adjustments, and macroeconomic stability in the face of significant events like the pandemic and geopolitical tensions.

Figure 1.
Correlation matrix of fiscal and monetary variables.
4.2. Estimation of Model Parameters
The parameters of the fiscal and monetary reaction functions were estimated using OLS regression on annual data from 2013 to 2023. The results are presented in Table 2.
Table 2.
Estimated parameters of fiscal and monetary authorities’ payoff functions.
The results for the fiscal authority’s regression show a negative coefficient for the output gap (α = −1.6451) and a positive coefficient for public debt (β = 0.5438). The negative α suggests a tendency towards counter-cyclical policy (reducing deficits when the output gap is positive/economy is booming), although the effect is estimated imprecisely. The positive β surprisingly suggests that higher debt levels were associated with larger deficits, contrary to consolidation expectations. However, neither coefficient is statistically significant at conventional levels (p-values of 0.187 and 0.482, respectively). Furthermore, the low R-squared value (0.297) indicates that this simple linear model explains only a small portion of the variation in Hungary’s fiscal deficit during this period. This lack of significance and explanatory power suggests that fiscal policy decisions were likely driven by factors not captured in this parsimonious specification, such as political considerations, specific spending programs, responses to external events (like the pandemic, whose effects might not be linearly captured), or perhaps policy objectives other than simple stabilization around output and debt targets.
In contrast, the monetary authority’s regression yields results more consistent with standard monetary policy rules. The coefficient on the inflation gap (γ = 0.7548) is positive, large, and highly statistically significant (p-value < 0.001). This indicates a strong reaction to deviations of inflation from the 3% target, aligning with the central bank’s price stability mandate. While the coefficient is slightly below 1, suggesting the Taylor principle might not have been strictly adhered to on average over the entire period (which included very low inflation years), the response is clearly systematic. The coefficient on the output gap (δ = −0.1034) is small, negative, and statistically insignificant (p-value = 0.702), suggesting that stabilizing output fluctuations was not a primary driver of interest rate decisions compared to inflation control, according to this specification. The high R-squared value (0.844) indicates that this simple Taylor-rule-inspired model explains a large majority of the variance in the policy interest rate [33,34].
These estimation results imply that, based on this empirical model, Hungary’s monetary authority exhibited a relatively predictable, inflation-focused reaction pattern during 2013–2023. The fiscal authority’s behavior, however, appears less systematic or predictable based on the output gap and debt level alone, highlighting the potential complexity and multi-faceted nature of fiscal policy decisions in the Hungarian context during this turbulent decade. The lack of strong, statistically significant drivers in the estimated fiscal reaction function introduces uncertainty into the subsequent Nash equilibrium calculations, which rely on these estimates, a point we must bear in mind when interpreting the results.
4.3. Derivation and Simulation of Best Response Functions
Using the estimated parameters from Table 2, we derived the best response functions for both the fiscal and monetary authorities. These functions represent the optimal policy choice of one authority, given the policy of the other. By simulating these best response strategies over time, we can analyze the strategic interactions between the fiscal and monetary authorities in Hungary from 2013 to 2023.
- Derivation of best response functions:
The fiscal authority’s best response function: the fiscal authority’s estimated reaction function is
From the regression of the output gap on the fiscal deficit and interest rates, we obtained:
Substituting the expression for into the fiscal reaction function and rearranging, we derived the fiscal authority’s best response function as a function of the interest rate and public debt:
The monetary authority’s best response function: the monetary authority’s estimated reaction function is
From the regression of the inflation gap on the fiscal deficit and interest rates, we obtained
Substituting the expressions for and into the monetary reaction function and rearranging, we derived the monetary authority’s best response function as a function of the fiscal deficit :
The derived best response functions are linear due to the use of linear estimated reaction functions and linear auxiliary regressions. This linearity assumption significantly simplifies the analysis and the computation of the Nash equilibrium. However, real-world economic relationships and policy responses can exhibit non-linearities, especially during periods of crisis (e.g., zero lower bound for interest rates, non-linear effects of fiscal stimulus at high debt levels, state-dependent Phillips curve). Such non-linearities could alter the shape of the true best response functions and potentially lead to multiple equilibria or different interaction dynamics to those captured by this linear approximation. This represents a limitation of the current analysis [35].
- 2.
- Simulation of best response strategies
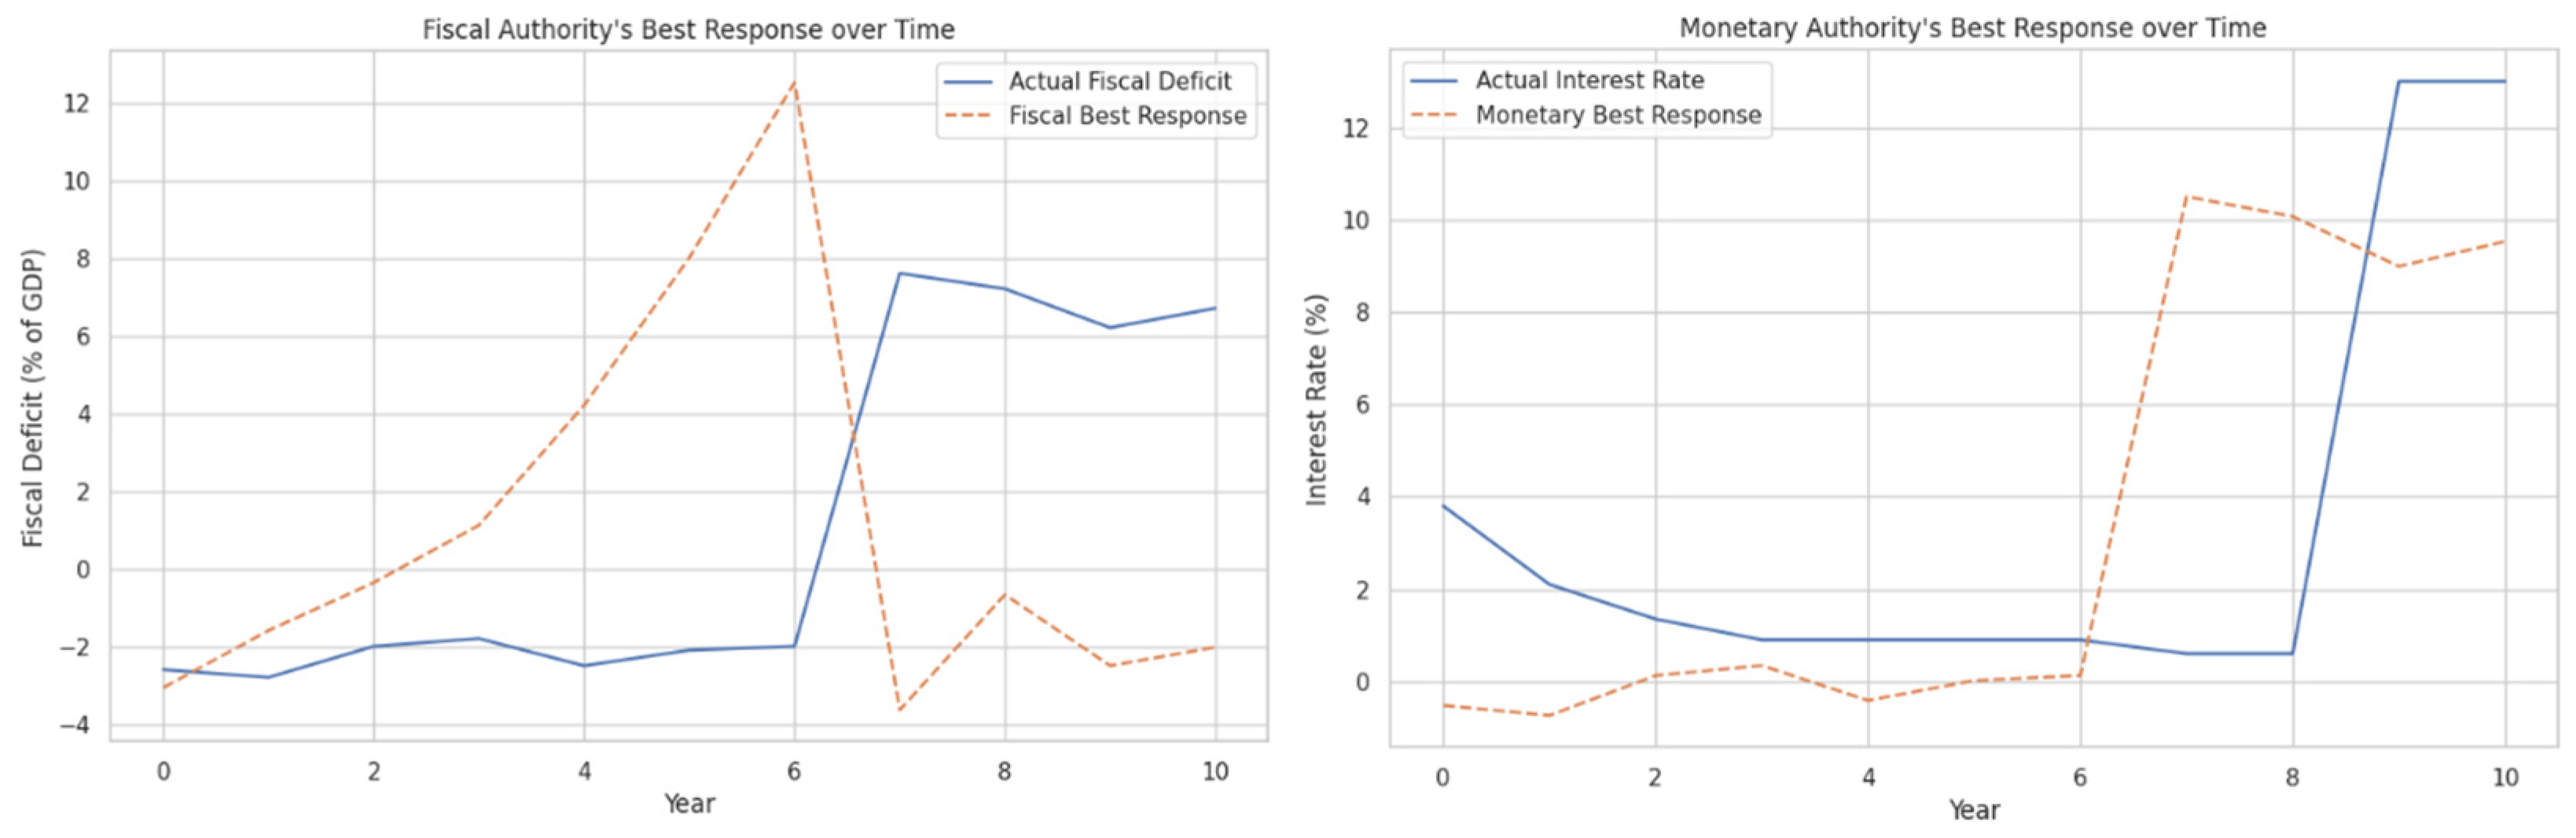
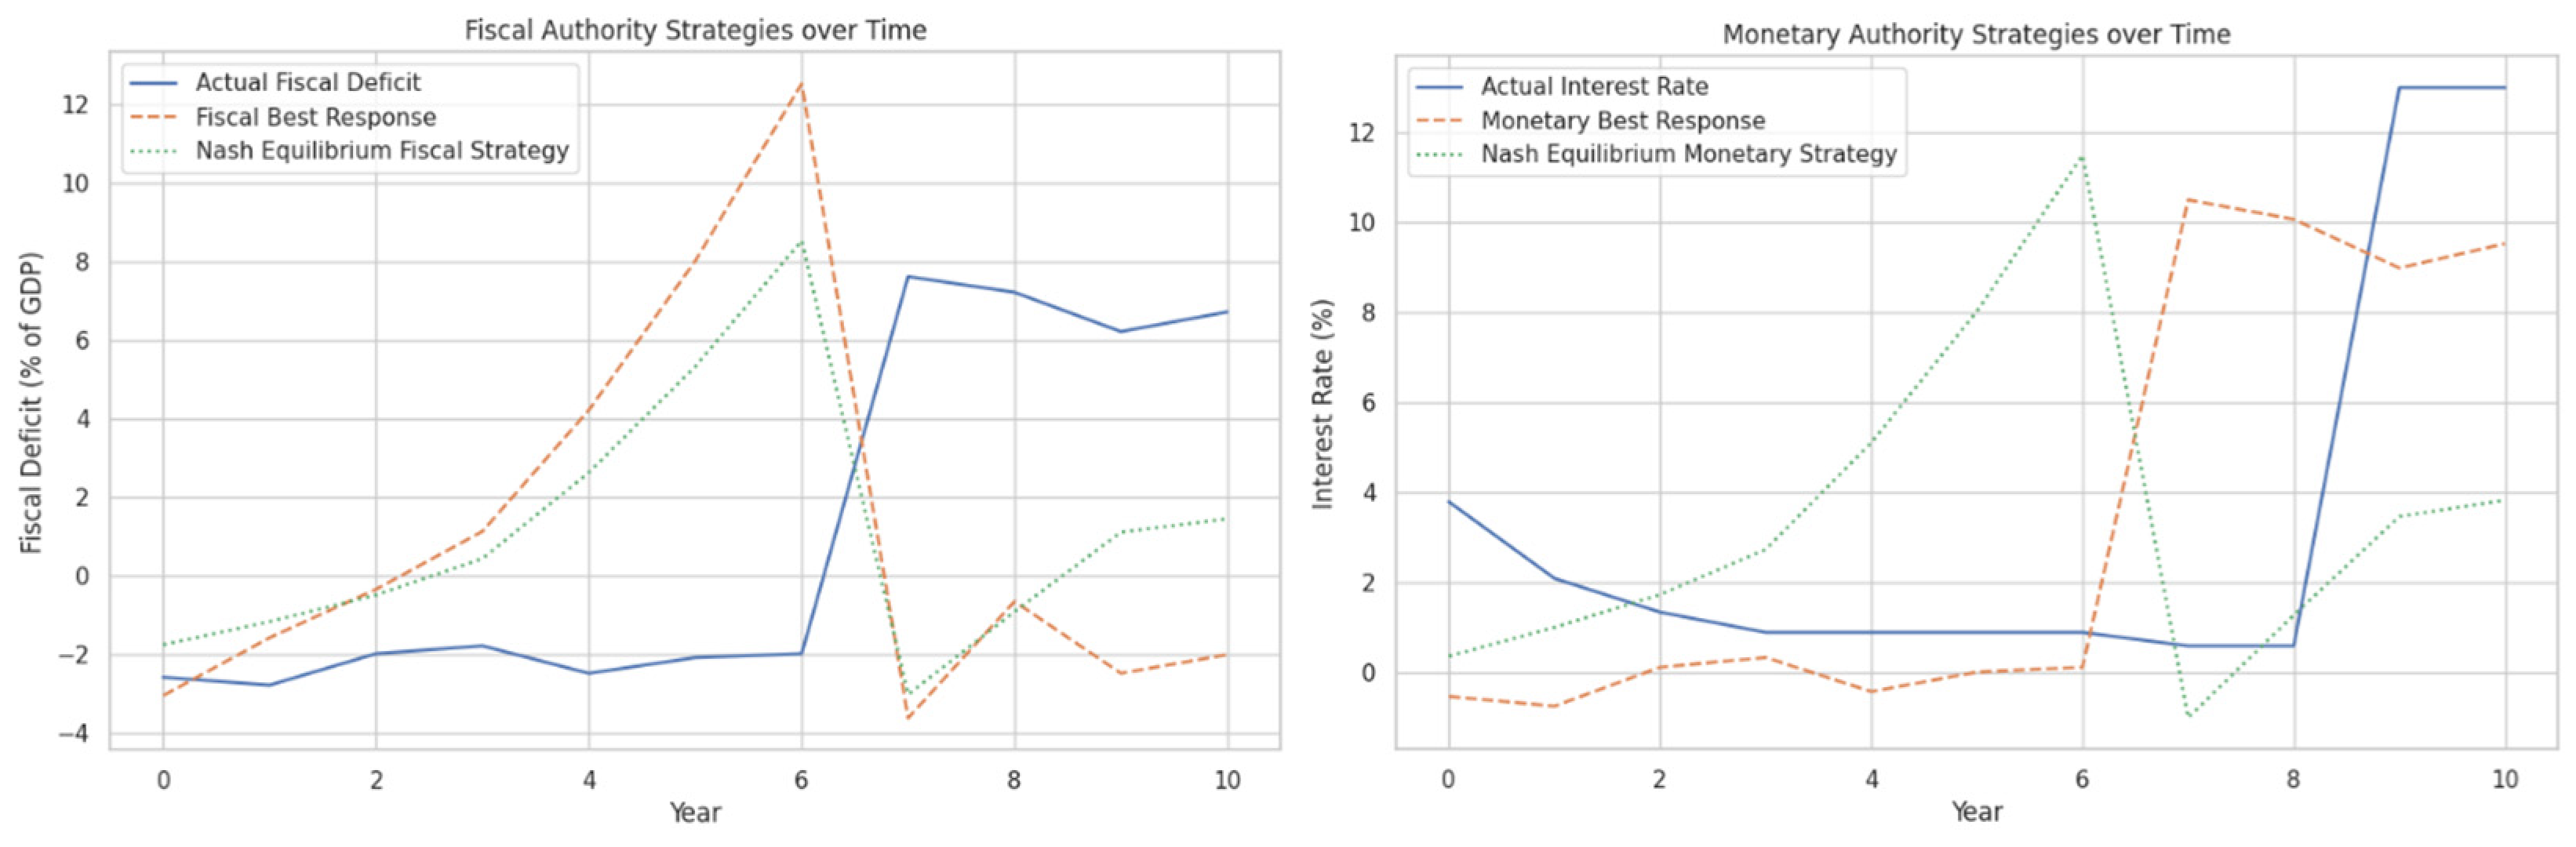
Using the above functions, we calculated the best response strategies for each authority over the period. The results are presented in Table 3 (see Figure 2 for a similar visual representation). The simulated best response strategies reveal important insights into the strategic interactions between Hungary’s fiscal and monetary authorities. During the early period (2013–2015), the fiscal best response deficits were close to the actual deficits, indicating alignment with the optimal response given the monetary policy stance. However, in the middle period (2016–2019), the fiscal best response suggested moving towards surpluses, contrary to the actual continued deficits, implying that more expansionary policies could have been adopted. During the COVID-19 pandemic (2020–2021), the fiscal best response turned negative, suggesting tighter fiscal policy than the actual large deficits aimed at mitigating the pandemic’s economic impact. For the monetary authority, during the early period (2013–2015), the best response interest rates were negative or very low, indicating a need for more accommodative policies. During the pandemic and its aftermath (2020–2023), the best response interest rates were significantly higher (around 9–10%) compared to the actual low rates, suggesting that earlier rate increases would have been optimal in response to large fiscal deficits and rising inflationary pressures. The discrepancies between actual policies and best response strategies highlight a lack of coordination between the fiscal and monetary authorities. During the pandemic, expansive fiscal policies (large deficits) were adopted to counteract the economic downturn, while low interest rates were maintained. This combination may have exacerbated inflationary pressures. The sharp increase in interest rates in 2022 and 2023 to 13% reflects a delayed response by the monetary authority to rising inflation, aligning more closely with the best response during these years.
Table 3.
Fiscal and monetary authorities’ best response strategies.
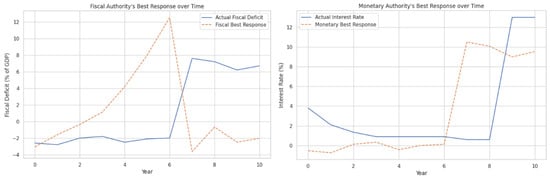
Figure 2.
Comparison between actual policies and best response strategies: fiscal authority’s actual deficit vs. best response (left), monetary authority’s actual interest rate vs. best response (right).
The analysis suggests that greater coordination between fiscal and monetary authorities could have led to more optimal policy outcomes. For instance, a proactive monetary policy with an earlier increase in interest rates might have curtailed inflation pressures sooner. Similarly, balancing fiscal deficits in line with the best response could have reduced the burden on monetary policy and mitigated the need for sharp interest rate hikes. By aligning policies more closely with the best response strategies derived from the Nash equilibrium framework, authorities could enhance macroeconomic stability and achieve better economic outcomes.
4.4. Computation of Nash Equilibrium Strategies
The Nash equilibrium is found by simultaneously solving the derived best response functions for each year using the iterative method described in Methodology. This yields the mutually consistent strategies, where neither authority has a unilateral incentive to deviate within the model’s framework. The results are shown in Table 4 and Figure 3.
Table 4.
Nash equilibrium strategies and iterations (2013–2023).
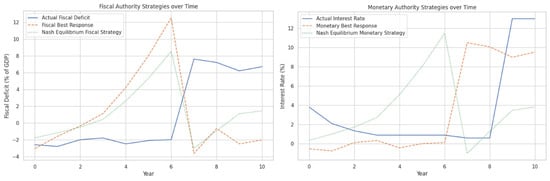
Figure 3.
Nash equilibrium strategies and iterations (2013–2023), comparison between fiscal authority strategies (left), monetary authority strategies (right).
The interpretation of Nash equilibrium trends reveals considerable variation in recommended strategies over the decade, reflecting the model’s perception of changing economic conditions. From 2013 to 2015, the equilibrium suggested a path of gradual fiscal consolidation, involving deficit reduction, alongside cautious monetary tightening characterized by rising interest rates from a low base. A dramatic shift occurred between 2016 and 2019, with the equilibrium moving towards significant fiscal surpluses and substantially higher interest rates; this reflected the model’s interpretation that the prevailing conditions (moderate growth, low initial rates, and existing debt) necessitated strong joint tightening to meet implicit objectives like debt reduction for fiscal policy and inflation control or normalization for monetary policy. During the pandemic years of 2020–2021, the equilibrium adjusted to recommend moderate fiscal deficits and very low, even slightly negative, interest rates as a countermeasure to the severe economic downturn. Subsequently, in the post-pandemic/inflation surge period of 2022–2023, the equilibrium shifted back towards recommending fiscal surpluses, albeit modest ones, coupled with moderately positive interest rates around 3.5–4%, suggesting a need for coordinated tightening, though less extreme than the actual monetary policy that was implemented.
Some computed Nash strategies, like the large recommended fiscal surpluses (e.g., 8.52% in 2019) or the negative interest rate (−0.99% in 2020), might appear unrealistic compared to actual policy possibilities. These outcomes arise from the model’s structure and estimated parameters. They represent the logical endpoint of non-cooperative optimization within the simplified framework, potentially amplified by the linear specifications. They highlight the direction and magnitude of the adjustments the model deems optimal based purely on the estimated reactions to inflation, output gap, and debt, without incorporating political feasibility constraints, implementation lags, or the full range of objectives policymakers consider. They serve to starkly illustrate the potential divergence between a game theoretic optimum and practical policy.
The computation of a Nash equilibrium underscores the inherent interdependence of fiscal and monetary policy, even under non-cooperation. The fact that a stable equilibrium exists (computationally) where both authorities are simultaneously playing their best response highlights that policy choices are inevitably linked. However, this non-cooperative equilibrium is often suboptimal compared to a coordinated solution. This suggests that institutional designs promoting communication, the shared understanding of objectives and constraints, and mechanisms to internalize the cross-policy effects (e.g., formal coordination committees, independent fiscal institutions providing common forecasts) could potentially guide policies towards more mutually beneficial outcomes.
4.5. Comparison with Actual Policy Decisions and Discussion of Findings
With the Nash equilibrium strategies established, we proceed to compare these theoretical optimal strategies with the actual policy decisions made by Hungary’s fiscal and monetary authorities from 2013 to 2023. This comparison aims to understand the extent of alignment or divergence between the authorities’ actions and the Nash equilibrium outcomes, revealing the effectiveness of policy coordination and its implications for macroeconomic stability. Table 5 presents the actual fiscal deficits and interest rates alongside the Nash equilibrium strategies, highlighting the differences between them.
Table 5.
Comparison of actual policies and Nash equilibrium strategies (2013–2023).
The comparison reveals significant deviations between the actual policies and the Nash equilibrium strategies. In the early years (2013–2015), while the Nash equilibrium recommended a gradual move towards smaller deficits, with a shift from −1.77% to −0.51% of GDP, the actual fiscal deficits remained larger, around −2.6% to −2.0% of GDP. This indicates a more expansionary fiscal stance than what would be considered optimal in the Nash framework. Concurrently, the monetary authority maintained higher interest rates than the equilibrium strategies, with actual rates decreasing from 3.80% to 1.35% compared to the Nash equilibrium’s 0.37% to 1.74%. This suggests a tighter monetary policy despite the fiscal authority’s expansionary approach. This observation aligns with the findings of [18] that analyzed the interaction between fiscal and monetary policy in Hungary over a similar period. It was noted that inconsistent policy measures and the lack of coordination between authorities contributed to suboptimal macroeconomic outcomes and hindered the effectiveness of individual policies.
From 2016 to 2019, there is a notable shift in the equilibrium strategies. The fiscal authority’s optimal strategy moves towards generating surpluses, reaching as high as 8.52% of GDP by 2019. This suggests a significant tightening of fiscal policy aimed at reducing public debt and creating fiscal space. Simultaneously, the monetary authority’s optimal strategy involves increasing interest rates substantially, up to 11.50% in 2019. This aggressive monetary tightening likely reflects the need to counteract potential inflationary pressures arising from robust economic growth and expansive fiscal surpluses. The pronounced divergence during this growth period warrants closer examination. Potential causes for the persistent fiscal expansion despite equilibrium calls for surpluses could include political incentives favoring spending, pro-cyclical fiscal tendencies, or institutional weaknesses in enforcing fiscal discipline. On the monetary side, the reluctance to raise rates significantly below the Nash suggestion might reflect concerns about exchange rate stability, the impact on borrowers, or an underestimation of inflationary pressures building up, contrasting with the model’s strong inflation-focused reaction. This discrepancy echoes studies finding misalignments leading to inefficiencies in Hungary [36].
During the COVID-19 pandemic (2020–2021), the Nash equilibrium strategies adjusted to the economic downturn, recommending fiscal deficits of −3.04% and −0.93% of GDP to support the economy. The actual fiscal deficits were significantly larger, at 7.6% and 7.2% of GDP, indicating a more aggressive fiscal response to the crisis. While expansive fiscal policy was necessary to mitigate the pandemic’s impact, the magnitude of the deficits exceeded the equilibrium suggestions, potentially exacerbating public debt concerns. In terms of monetary policy, the Nash equilibrium recommended maintaining low or even negative interest rates during the pandemic, with rates at −0.99% in 2020 and 1.29% in 2021. The actual interest rates were slightly higher at 0.60%, aligning relatively closely with the equilibrium strategies, suggesting that the monetary authority’s actions during the pandemic were more in line with the theoretical optimal strategies. In the post-pandemic period (2022–2023), the Nash equilibrium strategies indicated a return to modest fiscal surpluses and gradual monetary tightening, with equilibrium interest rates rising to 3.47% and 3.84%. However, the actual fiscal deficits remained high at 6.2% and 6.7% of GDP, deviating from the equilibrium’s recommendation for surpluses. The monetary authority implemented sharp interest rate increases to 13.00% in both years, significantly exceeding the Nash equilibrium suggestions. This aggressive monetary tightening likely reflects attempts to combat rising inflation and stabilize the currency in the face of external pressures, such as the economic repercussions of the Ukraine war and global supply chain disruptions.
These deviations between actual policies and Nash equilibrium strategies highlight challenges in policy coordination and the complexities of responding to dynamic economic conditions. The fiscal authority’s persistence with deficits, despite equilibrium recommendations for surpluses, could be attributed to political considerations, social welfare objectives, or the prioritization of short-term economic growth over long-term debt sustainability. The monetary authority’s initial reluctance to raise interest rates aggressively may stem from concerns about hindering economic recovery or the impact on financial markets.
The significant hike in interest rates in 2022 and 2023 indicates a reactive monetary policy in response to mounting inflationary pressures, suggesting that earlier alignment with Nash equilibrium strategies might have mitigated the need for such drastic measures.
Implications for Coordination and Stability: These deviations highlight challenges in policy coordination. The fiscal authority’s consistent expansionary bias (relative to Nash) and the monetary authority’s sometimes delayed or divergent responses suggest a lack of strategic alignment. Closer alignment with Nash equilibrium strategies, while theoretically derived and subject to model limitations, could potentially enhance macroeconomic stability. For instance, adhering to fiscal consolidation during growth periods (as suggested by the 2016–2019 Nash path) could build buffers and reduce debt, lessening the burden on monetary policy. Proactive monetary responses aligned with equilibrium suggestions might manage inflation more smoothly. Achieving such an alignment in practice is challenging due to the factors mentioned (politics, external shocks, and differing priorities). However, the analysis suggests potential benefits from improved coordination mechanisms. Practical steps could include establishing more formal dialogues between the Ministry of Finance and the MNB, utilizing shared macroeconomic forecasts, developing clearer contingency plans for policy mix adjustments during shocks, or enhancing the role of independent fiscal institutions in promoting debt sustainability.
5. Conclusions
Achieving macroeconomic stability relies heavily on the effective interplay between fiscal and monetary policies. However, independent mandates can lead to strategic conflicts and suboptimal outcomes. This study evaluated the strategic interaction between fiscal and monetary authorities in Hungary from 2013 to 2023. A non-cooperative game theoretic approach based on the Nash equilibrium concept was employed. Policy reaction functions for fiscal (fiscal deficit) and monetary (interest rate) authorities were estimated using OLS regression based on responses to key macroeconomic variables (output gap, public debt, and inflation gap). Best response functions were derived, and the Nash equilibrium strategies were computed numerically for each year. The analysis revealed significant and quantifiable divergences between actual policy decisions and the computed Nash equilibrium strategies. The key findings include the following: (i) Fiscal policy was consistently more expansionary than the Nash equilibrium suggested, particularly during the 2016–2019 expansion where equilibrium called for large surpluses while actual deficits persisted. (ii) Monetary policy also deviated, maintaining lower interest rates than the equilibrium during 2016–2019 but implementing much sharper rate increases post 2021 than the equilibrium suggested. (iii) Estimated fiscal reaction functions lacked statistical significance for key variables, suggesting fiscal policy was less systematically driven by output gap and debt considerations compared to monetary policy’s significant response to inflation. This study contributes to the literature by providing a quantitative application of the Nash equilibrium framework to evaluate recent fiscal–monetary interactions in Hungary. Its novelty lies in quantifying the specific deviations between actual policies and a theoretical non-cooperative benchmark, thereby highlighting potential inefficiencies (e.g., contributing to debt accumulation and inflation) arising from strategic misalignments within the model’s context. The analysis offers a specific lens through which to view the challenges of policy coordination in a volatile decade.
Regarding policy implications and limitations, the findings suggest that a greater awareness of strategic interactions and potentially enhanced coordination mechanisms could improve macroeconomic outcomes. However, these implications must be heavily qualified by the study’s limitations. The core assumptions of purely non-cooperative behavior and rational optimization based on limited variables are strong simplifications. The model excludes crucial factors like external shocks (the pandemic and war), openness, financial stability concerns, political constraints, and other policy objectives, which significantly influence real-world decisions. Furthermore, the statistical weakness of the estimated fiscal reaction function limits the reliability of the fiscal equilibrium calculations. Therefore, the results should be interpreted as indicative insights into potential non-cooperative dynamics rather than definitive policy prescriptions. Policymakers should consider these findings as one input, alongside broader analyses incorporating the acknowledged complexities.
Future research could enhance this analysis by carrying out the following: (i) incorporating external shocks and stochastic elements within a dynamic framework (e.g., DSGE with game theory); (ii) modeling potential non-linearities in policy responses; (iii) including a richer set of variables and objectives (e.g., financial stability, unemployment); (iv) performing sensitivity analysis to assess robustness to parameter uncertainty; (v) exploring alternative game structures (e.g., Stackelberg, cooperative games) or estimating models that allow for regime switches between cooperation and non-cooperation; and (vi) applying similar methodologies to other Central and Eastern European economies for comparative insights.
Author Contributions
Methodology, S.S.; Software, M.A.; Validation, T.T.; Investigation, S.S.; Writing—original draft, S.S.; Writing—review & editing, E.K. and T.T. All authors have read and agreed to the published version of the manuscript.
Funding
This research received no external funding.
Data Availability Statement
The data presented in this study are openly available in Eurostat and International Monetary Fund (Eurostat and International Monetary Fund, respective publications and datasets, https://data.imf.org/?sk=388DFA60-1D26-4ADE-B505-A05A558D9A42&sId=1479329132316, 1 February 2025), respective publications and datasets.
Conflicts of Interest
The authors declare no conflict of interest.
References
- Blinder, A.S. Issues in the Coordination of Monetary and Fiscal Policy; National Bureau of Economic Research: Cambridge, MA, USA, 1982. [CrossRef]
- Afonso, A.; Alves, J.; Balhote, R. Interactions between monetary and fiscal policies. J. Appl. Econ. 2019, 22, 132–151. [Google Scholar] [CrossRef]
- Bucacos, E. The interdependence of Fiscal and Monetary Policies in an Emerging economy: The case of Uruguay. Int. J. Financ. Bank. Stud. 2022, 11, 19–33. [Google Scholar] [CrossRef]
- Di Bartolomeo, G.; Di Gioacchino, D. Fiscal-monetary policy coordination and debt management: A two-stage analysis. Empirica 2008, 35, 433–448. [Google Scholar] [CrossRef]
- Yu, Y.; Xu, H.; Chen, H. Learning correlated stackelberg equilibrium in general-sum multi-leader-single-follower games. arXiv 2022, arXiv:2210.12470. [Google Scholar] [CrossRef]
- Ferrari, M.M.; Pagliari, M.S. DSGE Nash: Solving Nash Games in Macro Models; ECB Working Paper; European Central Bank: Frankfurt am Main, Germany, 2022. [Google Scholar] [CrossRef]
- Stawska, J.; Malaczewski, M.; Szymańska, A. Combined monetary and fiscal policy: The Nash Equilibrium for the case of non-cooperative game. Econ. Res.-Ekon. Istraživanja 2019, 32, 3554–3569. [Google Scholar] [CrossRef]
- Saulo, H.; Rêgo, L.C.; Divino, J.A. Fiscal and monetary policy interactions: A game theory approach. Ann. Oper. Res. 2013, 206, 341–366. [Google Scholar] [CrossRef]
- Bennett, H.; Loayza, N. Policy Biases When the Monetary and Fiscal Authorities Have Different Objectives; Banco Central de Chile: Santiago, Chile, 2002.
- Leeper, E.M. Equilibria under ‘active’ and ‘passive’ monetary and fiscal policies. J. Monet. Econ. 1991, 27, 129–147. [Google Scholar] [CrossRef]
- Sargent, T.J.; Wallace, N. Some unpleasant monetarist arithmetic. Fed. Reserve Bank Minneap. Q. Rev. 1981, 5, 1–7. [Google Scholar] [CrossRef]
- Blanchard, O.J.; Summers, L.H. Rethinking Stabilization Policy: Evolution or Revolution? National Bureau of Economic Research: Cambridge, MA, USA, 2018. [Google Scholar] [CrossRef]
- Hungarian National Bank. Economic and Financial Statistics. Available online: https://www.mnb.hu (accessed on 1 February 2025).
- Chortareas, G.; Mavrodimitrakis, C. Strategic fiscal policies and leadership in a monetary union. Eur. J. Political Econ. 2017, 47, 133–147. [Google Scholar] [CrossRef]
- Kreps David, M. Nash equilibrium. In Game Theory; Palgrave Macmillan: London, UK, 1989; pp. 167–177. [Google Scholar]
- Holt, C.A.; Roth, A.E. The Nash equilibrium: A perspective. Proc. Natl. Acad. Sci. USA 2004, 101, 3999–4002. [Google Scholar] [CrossRef]
- Alderborn, J. The Impact of Coordination and Targets on Monetary and Fiscal Policy. Master’s Thesis, Universitat de Barcelona, Barcelona, Spain, 2018. [Google Scholar]
- Shannon, B.N.; McGee, Z.A.; Jones, B.D. Bounded rationality and cognitive limits in political decision making. Oxf. Res. Encycl. Politics 2019. [Google Scholar] [CrossRef]
- Blueschke, D.; Neck, R.; Behrens, D.A. OPTGAME3: A dynamic game solver and an economic example. In Advances in Dynamic Games: Theory, Applications, and Numerical Methods; Springer: Cham, Switzerland, 2013; pp. 29–51. [Google Scholar]
- Yeboah, S. A Systematic Review of the Association between Fiscal Policy and Monetary Policy: Interactions, Challenges, and Implications. Munich Pers. RePEc Arch. 2022, 17530. Available online: https://mpra.ub.uni-muenchen.de/id/eprint/117530 (accessed on 15 March 2025).
- Chibi, A.; Chekouri, S.M.; Benbouziane, M. Interaction between monetary and fiscal policy in Algeria: An application of a model with Markovian regime switching. Les Cah. Cread 2021, 37, 173–210. [Google Scholar]
- Reinhart, C.M.; Rogoff, K.S. Growth in a Time of Debt. Am. Econ. Rev. 2010, 100, 573–578. [Google Scholar] [CrossRef]
- Engwerda, J.; van Aarle, B.; Anevlavis, T. Debt stabilization games in a monetary union: What are the effects of introducing eurobonds. J. Macroecon. 2019, 59, 78–102. [Google Scholar] [CrossRef]
- Ortega-Argilés, R. The evolution of regional entrepreneurship policies: “no one size fits all”. Ann. Reg. Sci. 2022, 69, 585–610. [Google Scholar] [CrossRef]
- Echeverri, A.; Furumo, P.R.; Moss, S.; Figot Kuthy, A.G.; García Aguirre, D.; Mandle, L.; Valencia, I.D.; Ruckelshaus, M.; Daily, G.C.; Lambin, E.F. Colombian biodiversity is governed by a rich and diverse policy mix. Nat. Ecol. Evol. 2023, 7, 382–392. [Google Scholar] [CrossRef]
- Andor, L. Hungary in the financial crisis: A (basket) case study. Debatte J. Contemp. Cent. East. Eur. 2009, 17, 285–296. [Google Scholar] [CrossRef]
- Palotai, G.M. The interaction between fiscal and monetary policy in Hungary over the past decade and a half. Financ. Econ. Rev. 2016, 15, 5–32. [Google Scholar]
- Polackova, H.; Papp, A.; Schick, A. Fiscal Risks and the Quality of Fiscal Adjustment in Hungary; Elsevier: Amsterdam, The Netherlands, 1999. [Google Scholar]
- Banai, Á.; Lang, P.; Nagy, G.; Stancsics, M. Waste of money or growth opportunity: The causal effect of EU subsidies on Hungarian SMEs. Econ. Syst. 2020, 44, 100742. [Google Scholar] [CrossRef]
- Eurostat and International Monetary Fund, Respective Publications and Datasets. 2013–2023. Available online: https://dsbb.imf.org/sdds/eurostat-note (accessed on 15 March 2025).
- Smets, F.; Wouters, R. An estimated dynamic stochastic general equilibrium model of the euro area. J. Eur. Econ. Assoc. 2003, 1, 1123–1175. [Google Scholar] [CrossRef]
- Reiss, P.C.; Wolak, F.A. Structural econometric modeling: Rationales and examples from industrial organization. In Handbook of Econometrics; Elsevier: Amsterdam, The Netherlands, 2007; Volume 6, pp. 4277–4415. [Google Scholar] [CrossRef]
- Asso, P.F.; Kahn, G.A.; Leeson, R. The Taylor Rule and the Transformation of Monetary Policy; Hoover Institute Press Publication: Stanford, CA, USA, 2007. [Google Scholar]
- Dismuke, C.; Lindrooth, R. Ordinary least squares. Methods Des. Outcomes Res. 2006, 93, 93–104. [Google Scholar]
- Ferdinandusse, M.; Palaiodimos, G.; Politsidis, P.N. Non-Linearities in Fiscal Policy: Evidence from the Eurozone; Elsevier: Amsterdam, The Netherlands, 2023. [Google Scholar]
- Stawska, J.; Malaczewski, M.; Malaczewska, P.; Stawasz-Grabowska, E. The Nash equilibrium in the policy mix model for Czechia, Hungary, and Romania. Cogent Econ. Financ. 2021, 9, 1869380. [Google Scholar] [CrossRef]
Disclaimer/Publisher’s Note: The statements, opinions and data contained in all publications are solely those of the individual author(s) and contributor(s) and not of MDPI and/or the editor(s). MDPI and/or the editor(s) disclaim responsibility for any injury to people or property resulting from any ideas, methods, instructions or products referred to in the content. |
© 2025 by the authors. Licensee MDPI, Basel, Switzerland. This article is an open access article distributed under the terms and conditions of the Creative Commons Attribution (CC BY) license (https://creativecommons.org/licenses/by/4.0/).