3.1. Motivating Example
Let us now illustrate with an example some of the problems associated with using interaction terms obtained as the product of (univariate) WOE variables. These motivate the proposal of an alternative methodology based on bivariate WOE variables; the basic idea of which shall also be presented with this example.
Thus, let us consider Equation (
12), associated to a logistic regression model with an interaction term given by the product of variables
and
:
where
and
are standard normal deviates.
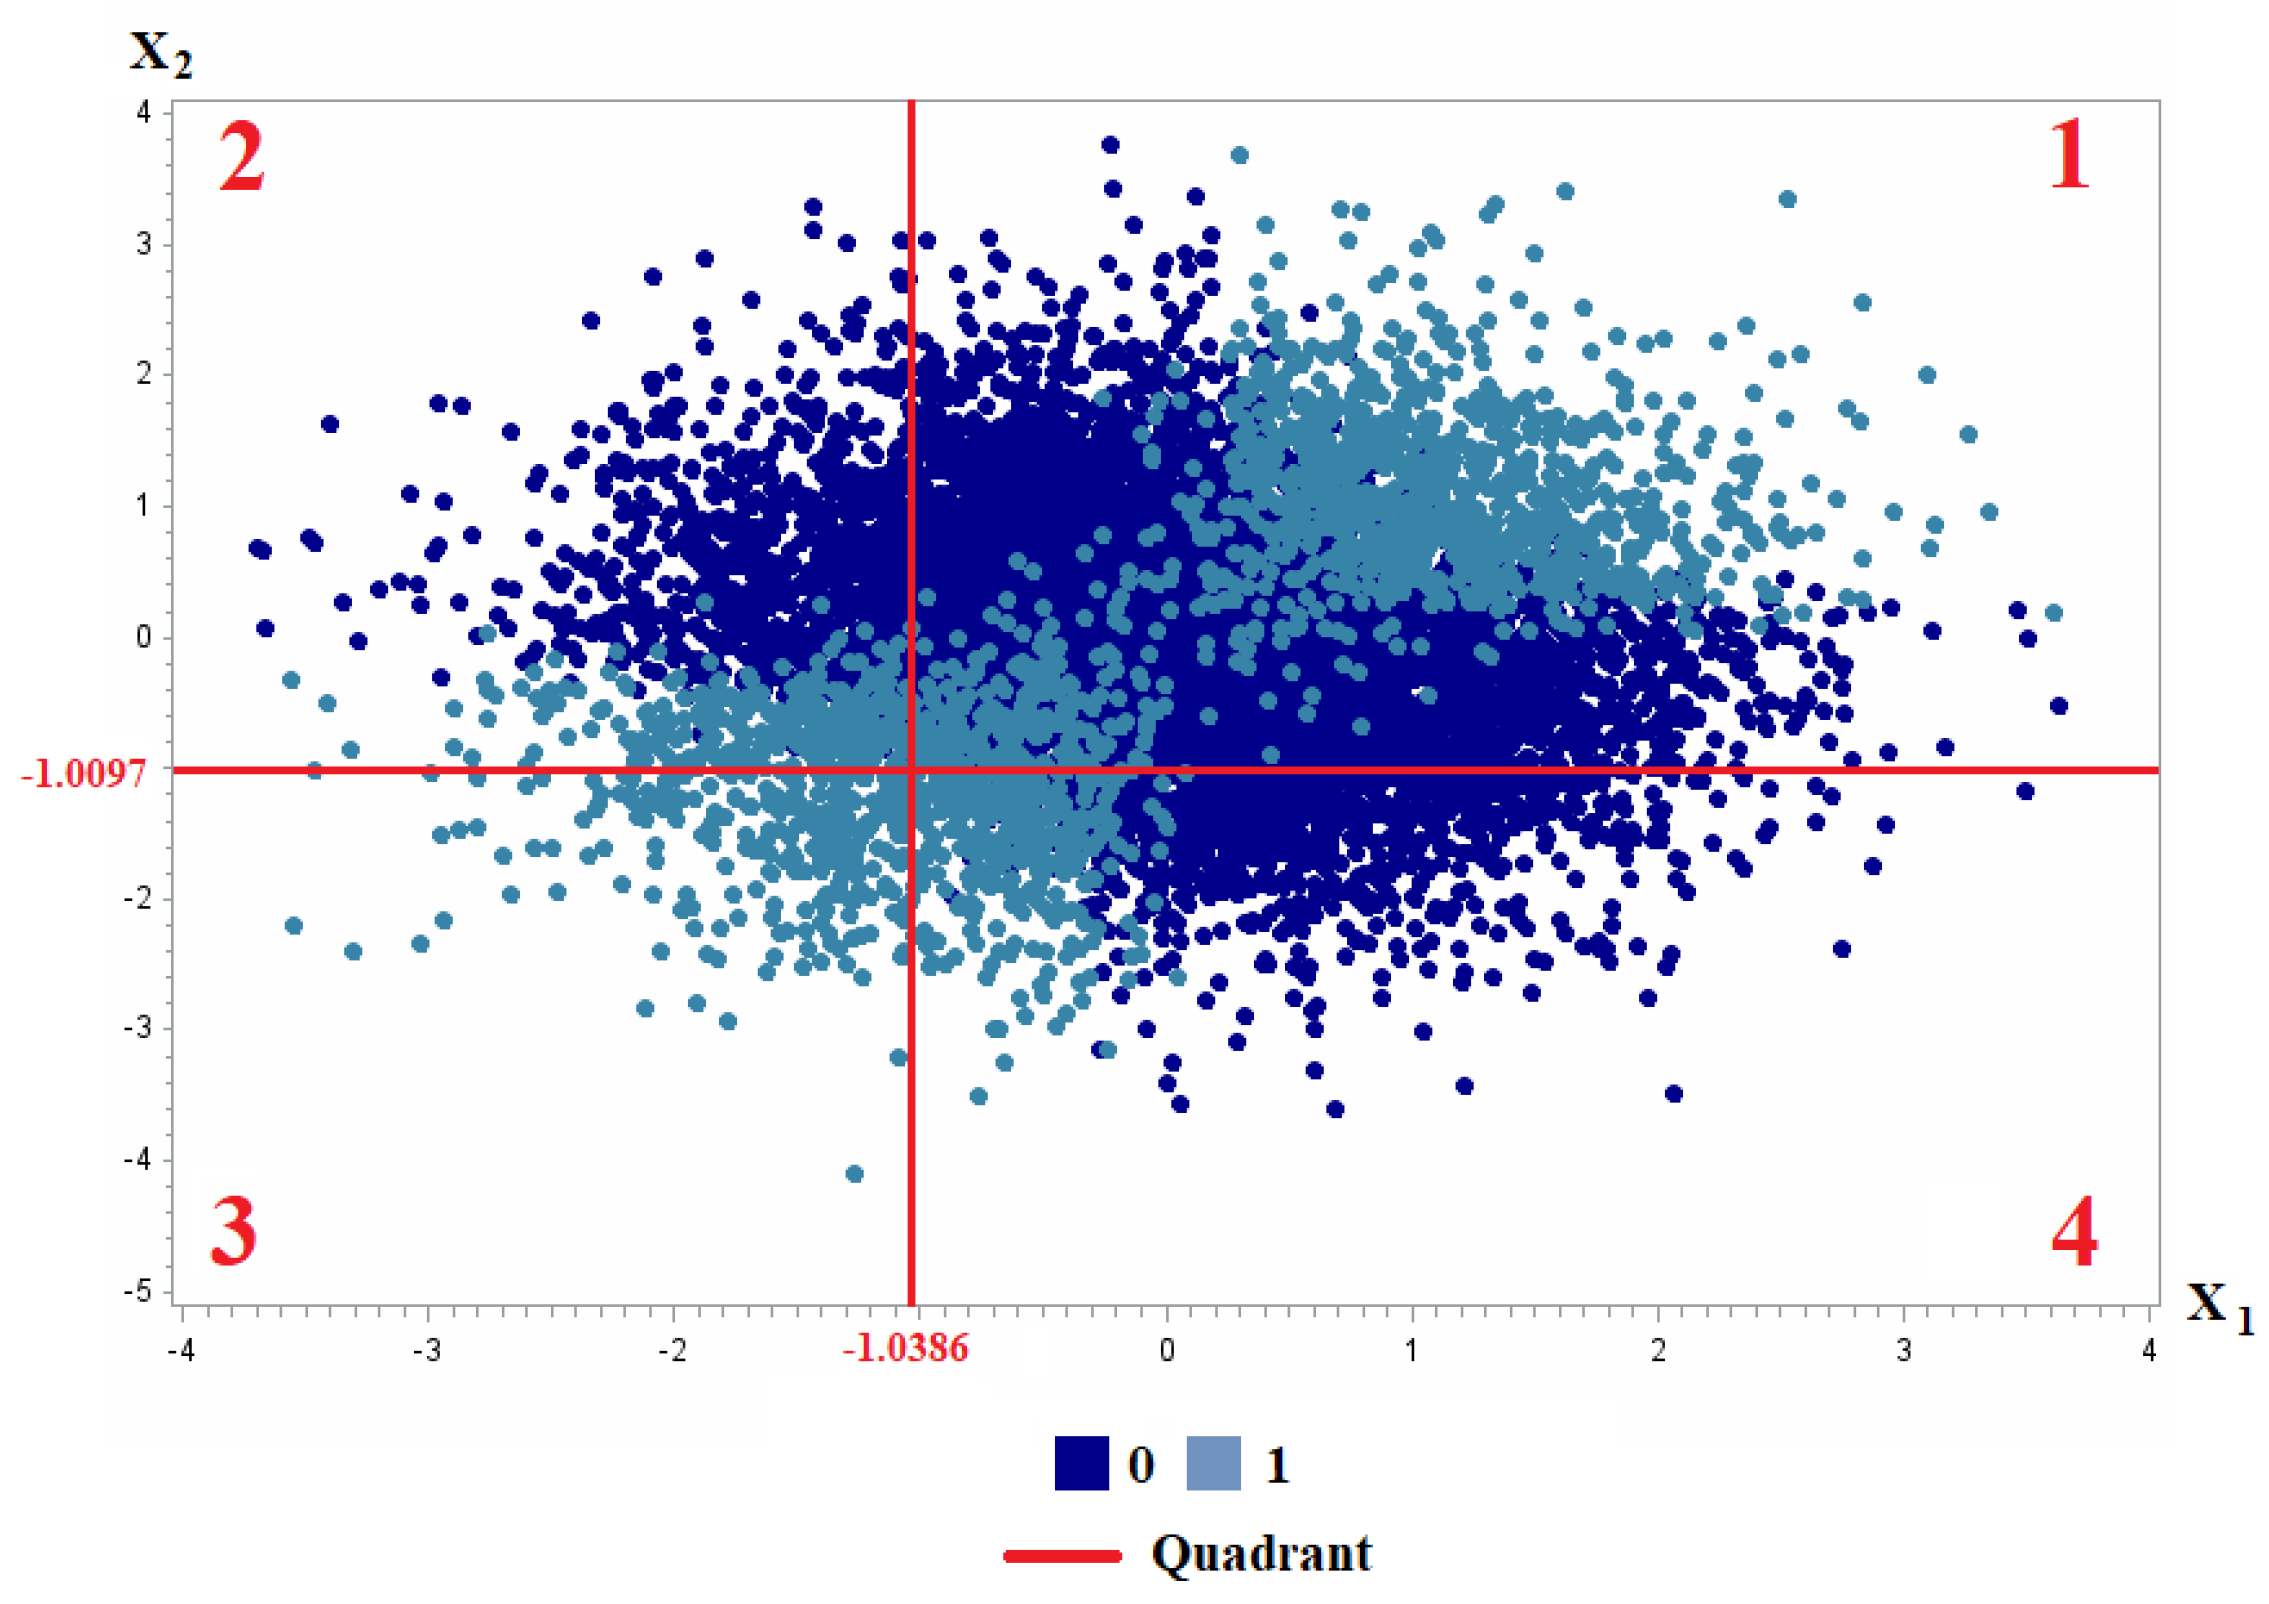
By generating values from such distribution, it is possible to obtain probabilities
. Simulated points
are assigned to classes 1 or 0 depending on whether the corresponding probability lies above or below 0.5, respectively.
Figure 1 shows the distribution of classes after 10000 simulations.
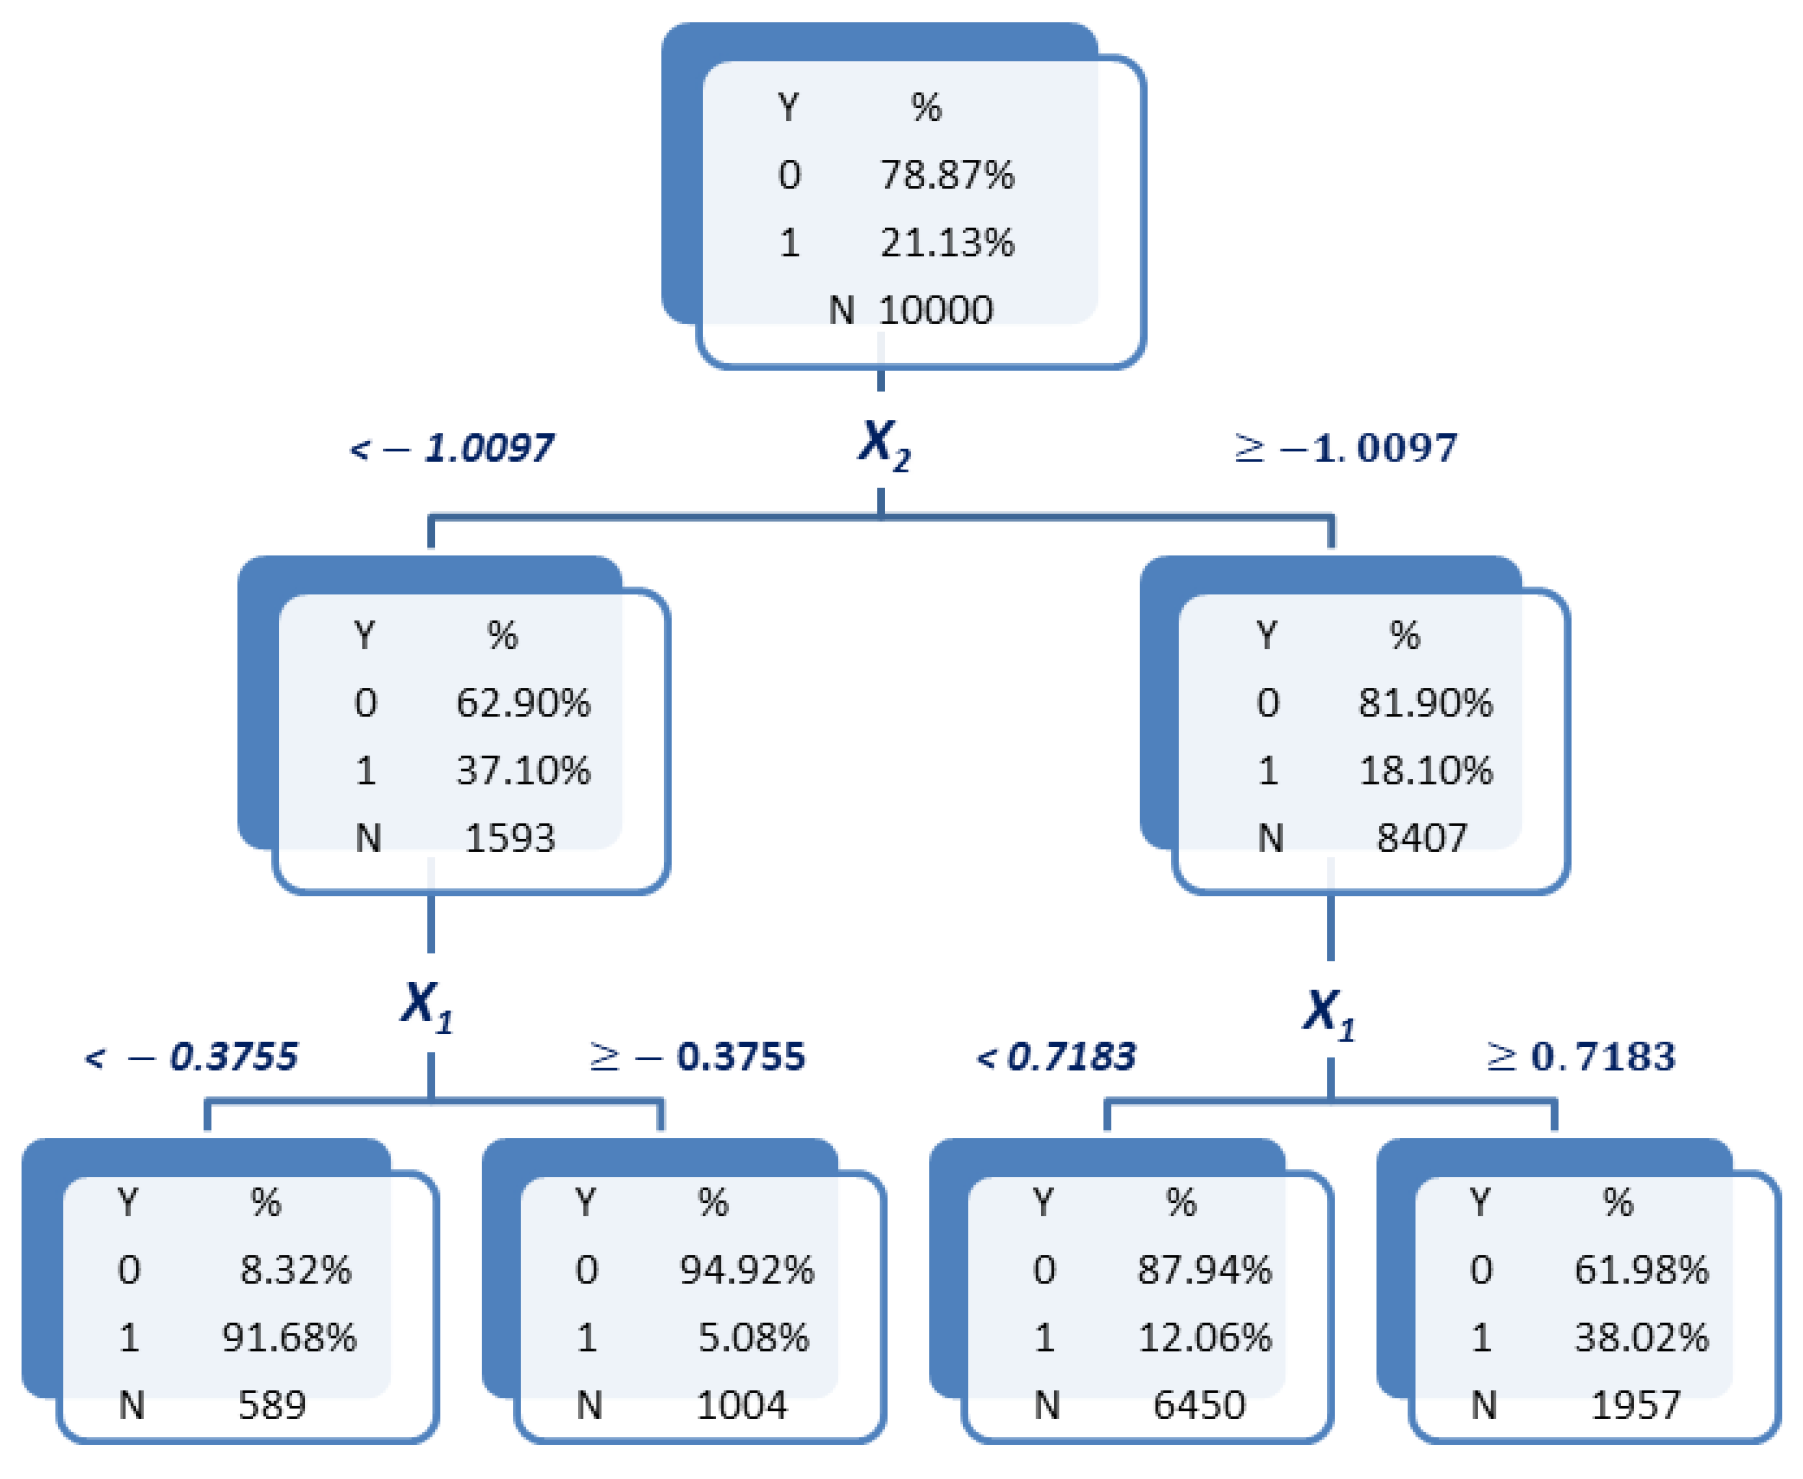
Let us now try to capture the observed interaction behaviour by means of (univariate) WOE variables. To this aim, WOE variables
and
are generated by discretizing variables
and
through classification trees based on the CHAID algorithm [
22]. The result of this discretization process is shown in
Figure 2. The values taken by the corresponding WOE variables, obtained by Equation (
8), are presented below each tree leaf.
Then, the product variable
is computed in order to provide the interaction term between variables
and
.
Table 1 presents the frequency distribution of this product variable on the quadrants depicted in
Figure 1, combining the cut-off points of the trees shown in
Figure 2.
It is easily observed that the product takes a similar value in quadrants 2 and 4, but quite different values in quadrants 1 and 3. This is not adequate, since lower values should be associated to one of the classes and higher ones to the other. However, quadrants 1 and 3 are both mainly associated to class 1 and obtain the highest and lowest values for , respectively. Consequently, the product does not seem to provide an adequate solution, at least in this case, for capturing the interaction between and .
Alternately, fitting a single classification tree by using both variables
and
is considered. The obtained tree is shown in
Figure 3. By looking at this tree, it is now observed that class 1 rates are higher in leaves 1 and 4 (counted from left to right), which by attending to the cut-off values imposed on both
and
can be observed to be associated with the previous quadrants 1 and 3. Conversely, class 1 rates are lower in leaves 2 and 3, associated with quadrants 2 and 4. Moreover, the cut-off values of
indicate that the effect of this variable on class 1 rates varies depend on the values of
. When
lower values of
are associated with a greater class 1 rate. However, when
, the effect is the inverse: Greater values of
are, in this case, associated with greater class 1 rates. Thus, this tree seems to capture the interaction behaviour between variables
and
. Consequently, it would be sound to construct a (bivariate) WOE variable according to the leaves of this tree. Indeed, by applying Equation (
13) in
Section 3.2, the values of that WOE variable shown below the leaves of the tree in
Figure 3 are obtained. Leaves 1 and 4 now receive lower values than leaves 2 and 3, and therefore this new WOE variable allows the reflection of the desired interaction effect. This is the intuition underlying the proposed bivariate WOE variables. The formal definition will be presented in
Section 3.2.
Finally, let us remark that, regarding this example, another possibility would consist in first generating the product variable
and then constructing a WOE variable by discretization of
Z through a (again univariate) classification tree. This approach, which is valid when
and
are continuous variables, is similarly adaptable to the case in which both variables are categorical. In this latter case, it would be enough to construct a categorical variable
Z by crossing the categories of
and
and then to construct a (univariate) WOE variable after fitting the corresponding classification tree. However, when one of the variables, say
, is continuous and the other,
, is categorical, the discretization of
would necessarily imply generating as many dummy variables as categories of
. This would make obtaining a unique WOE variable through Equation (
8) impossible. The proposed methodology based on fitting classification trees to pairs of variables avoids this difficulty, since trees permits combining variables of any nature.
3.2. Generation of Bivariate WOE Variables
As illustrated in the motivating example of previous section, when the main effects in a logistic regression model are represented through univariate WOE variables
, the usual product interaction terms
can fail to adequately capture the interaction behaviour between the corresponding original variables
and
. This occurs mainly because univariate WOE transformations are carried out independently for each variable without taking into account the others. That is, the cut-off values obtained by each tree when generating each WOE variable are obtained by taking into account its direct relationship with the target variable
Y. However, when another variable intervenes in this relationship, univariate trees cannot adapt and produces different cut-off points depending on the values of the other variable. Indeed, as explained in [
18] in a statistical learning context, the depth of the decision trees assembled in a boosting model conditions the complexity of the model. When trees are at depth 1, the assembled models possess an additive nature with a single term that implies a single variable. However, greater levels of depth permit reflecting interactions between different variables if they alternate at these levels. This motivates our proposal of complementing univariate WOE-based logistic models with two-dimensional or bivariate WOE variables, obtained through fitting a classification tree to each pair of variables
and
. Thus, the objective is to provide a general and widely applicable methodology enabling WOE-based logistic models to capture interactions effects.
Let us now focus on formally defining the construction of bivariate WOE variables. Given a pair of original input variables
and
, a classification tree is fitted to explain the response
Y in terms of both
and
. Let
denote the categorical variable for which its values
identify each of the
leaves of the adjusted tree. From these categories, a WOE transformation can be applied to obtain what shall be called a
bivariate WOE variable, which is to be denoted as
. In this manner, in each leaf
k of the tree (category
), the transformed variable
is defined to take the value given by Equation (
13).
Let us point out some remarks that are important to be taken into account:
The fact that two variables are considered in the tree segmentation process does not guarantee that both will end up participating in it. For example, if and are two input variables, then it could be possible that only one of them appeared along the splitting process. Thus, in this case, the variable reflecting the corresponding interaction effect is not considered to be defined, precisely because such interaction is not reflected in the tree.
The subscript of variable
does not represent the order in which the variables participate in the segmentation process, but simply responds to a lexicographic order. This case is due to the fact that although the entry of
could be forced in the first depth level and that of
in the next, this would only reduce the predictive capability of the transformed variables included in the regression model. This circumstance is not adequate since, as mentioned in
Section 2.1, the objective of using decision trees to perform the discretization of variables seeks to enhance the predictive capability of the obtained categories.
Related to the previous point, at most only one interaction term is generated for each pair of variables. Thus, the maximum potential number of bivariate WOE variables to be included in the regression model is . In fact, the effective number will be lower if the tree generated for a pair does not include one of these variables.
Therefore, a distinction is made between two types of WOE variables:
Univariate WOE variables with notation
and generated through Equation (
8).
Let denote the vector of univariate WOE variables obtained from the original variables;
Bivariate WOE variables denoted
and generated through Equation (
13).
Let denote the vector of bivariate WOE variables obtained from pairs of original variables.
Thus, in principle, the fit of a full logistic regression model using the univariate WOE variables
associated with all available inputs, as well as the bivariate WOE transforms
corresponding to all possible pairs of such inputs can be considered. This would result in the model given by Equation (
14).
Similarly to what was discussed at the end of
Section 2.3, neither the coefficient
of the bivariate WOE variable
nor its odds ratio allow an interpretation of the interaction effect between the original variables
and
on the response. Rather, this interpretation is provided by the classification tree model associated with the definition of
, from which it is possible to assess the different cut-off values obtained for a variable, say
, given the previous cut-off points for
, as well as to compare them with the cut-off values produced in the corresponding univariate trees fitted in the construction of both
and
. Furthermore, it is possible to easily adapt the score points transformation in Equation (
11) in order to provide an explanation of the relative effect of variable
on the loan decision regarding a given client, as shown in Equation (
15):
where
is the regression coefficient associated to variable ;
is the intercept or constant term of the regression model;
m is the total number of variables effectively included in the regression model in Equation (
14);
and are scale parameters that allow the analyst to control the range of the score function as well as the needed variation in the odds ratio for a given increase in points.
Let us now discuss some practical aspects regarding the configuration of the growing process of the classification trees to be employed in the construction of both univariate and bivariate WOE variables:
It is important to notice the interdependence between the number of obtained tree leaves, on the one hand, and the interpretability and predictive capability of the resulting tree models, on the other hand. Typically, allowing more tree leaves will result in an enhanced predictive capability of the resulting WOE variables, at least until overfitting issues appear. However, a tree with many leaves will usually also be more difficult to interpret.
The interpretability of univariate WOE variables used is to be associated with a certain monotonicity of the default rates in relation to the categories obtained for the original input variable. Such monotonicity is more difficult to achieve as the number of categories increases. Obviously, monotonicity of the default rates is not a problem when only two tree leaves or categories are considered. However, this quantity used is too small for adequately representing the variability of the input and tends to provide a poor predictive capability. In this sense, it has been considered that a maximum of four leaves may provide a good trade-off between interpretability and predictive capability of the resulting univariate WOE variables. In future works, this issue will be analyzed.
In the case of bivariate WOE variables, interpretability is not as dependent on monotonicity since they are devised to capture interaction behaviours that manifest through variations in the trends of the univariate WOE variables. However, in this case, two is the minimum depth required in binary branching trees in order to allow reflecting an interaction between two variables, although the associated predictive capability may be rather poor. On the other extreme, allowing more than 16 categories (those that would result from crossing two variables with four categories each) can result in model that is too complex to interpret.
How can the number of obtained leaves be controlled in order to remain between the discussed ranges? In the case of univariate WOE variables, the only two options would be using either a depth-2 tree with binary branching or a depth-1 tree with up to four branches. Although binary branching is most well-known and extended, depth-1 trees with 4-ary branching provide a more convenient option in this case since they tend to provide more leaves than depth-2 trees with binary branching. Precisely for this reason, in the case of bivariate WOE variables, binary-branching trees with a depth-level between two and four are instead preferred, as a slightly lower number of leaves may favour interpretability of the interaction behaviour.
CHAID-like classification trees [
22] can be used to establish significance levels and test for the statistical significance of each tree leaf. This may provide more robust categories with an enhanced predictive behaviour in comparison to other methodologies, such as CART-like classification trees [
23]. However, precisely because of their more demanding branching process, CHAID trees tend to provide less leaves than CART trees, and they can even avoid the discretization of some inputs. In this sense, when a variable selection procedure (e.g., stepwise variable selection) is applied after the construction of WOE variables, CART-like trees may be preferable to CHAID ones. This happens since the former guarantees the discretization of the original inputs, and although the predictive capability of some resulting WOE variables may be comparatively lower, the variable selection procedure would discard them during the model building process.
Both in the case of univariate and bivariate WOE variables and independently of using either CHAID or CART trees, pruning the resulting trees by using a validation sample before actually computing the WOE transformation may allow the improvement of the actual predictive capability of the resulting WOE variables, as well as the enhancement of its interpretability.
As just mentioned, once WOE variables have been constructed it may be worth applying a variable selection procedure in order to enhance interpretability and avoid overfitting by obtaining a model with lower complexity to that of the full model in Equation (
14). In particular, some variants of the stepwise procedure can further enhance interpretability when working with WOE variables (see [
24]). Moreover, when a validation sample is available in addition to a training one, the sequence of models provided by the application of the variable selection procedure on the training sample can be ranked in terms of a performance criteria obtained on the validation sample. In this manner, the model finally selected would be the model in the sequence with best performance on the validation sample.
Finally, let us summarize the main ideas supporting the use of the proposed bivariate WOE variables methodology:
In the definition of , the interaction between the variables and from which it is generated is implicit. Therefore, bivariate WOE variables allow addressing the main criticism regarding the use of (univariate) WOE variables that refers to their incapability to reflect interaction effects, as univariate classification trees are unable to produce different cut-off points depending on the values of other variables.
WOE variables, as explained in
Section 2.3, allow retaining most of the advantages associated with the discretization of input variables in the context of logistic regression (outliers and missing values and non-monotonous effects) while avoiding its main drawbacks (the potentially huge number of dummy variables to be considered and the associated dilemma regarding the inclusion of non-significant effects). This also applies to bivariate WOE variables since bivariate trees behave similarly to univariate ones in this respect (let us remark that the term
bivariate tree is used to emphasize the presence of two explanatory variables instead of a single one). Moreover, bivariate WOE variables contribute to a potentially greater reduction than univariate ones in the number of variables to be considered since they allow concentrating the information of up to
crosses of dummy variables for interaction terms into just
bivariate WOE variables (see also
Section 2.2).
The construction steps of bivariate WOE variables do not depend on the nature or typology of the two original input variables being combined. A bivariate classification tree provides the basis for applying Equation (
13) independently of whether the original variables are both continuous, both categorical or one continuous and the other categorical. This fact does not hold when trying to model interactions through univariate WOE transforms of the product or combination of the original variables since there is no way to produce a single interaction term in case one of the original variables is continuous and the other is categorical. In this sense, bivariate WOE variables provide a more general methodology to deal with interactions than univariate WOE transforms of usual interaction terms.
Bivariate WOE variables are constructed in such a way that only existing interactions are reflected. In this sense, notice that a cross between univariate WOE variables may not be significant or possess insufficient case support in order to be generalizable. However, each value of the variable is supported by a leaf of a classification tree for which its minimum support can be prespecified in order to guarantee some level of generalizability. Furthermore, CHAID-like classification trees can be used whenever statistical significance of the discretized categories is required.
Let us remark that variables
arise from making
and
interact, but they are not the result of the interaction of
and
. This observation is important since, as
, the fulfillment of the hierarchical principle (see
Section 2.2) does not apply to a stepwise variable selection process in the context of the model in Equation (
14). This circumstance provides more flexibility to the proposed methodology.
The interaction behaviour associated to variables can be interpreted through the bivariate trees associated to their construction, and their effect on loan decisions can be explained through score points transformations.
3.3. Illustrative Example
The objective of this section is to briefly illustrate how bivariate WOE variables allow capturing interaction patterns between variables, as well as the potential ease they provide for the interpretation of such interaction effects. To this aim, the
dataset, for which its description can be observed in
Appendix A, will be used. In this manner, this section complements the motivating example in
Section 3.1, showing that the alleged features of bivariate WOE variables can indeed be useful on real data. Particularly in the first part of this example, the focus will be on variables
(age in years of a client asking for credit) and
(number of children of a client) of the
dataset. As it is well-known for credit scoring analysts, both variables usually present a meaningful interaction, namely the effect of having children on loan default probability is dependent on the age of the clients.
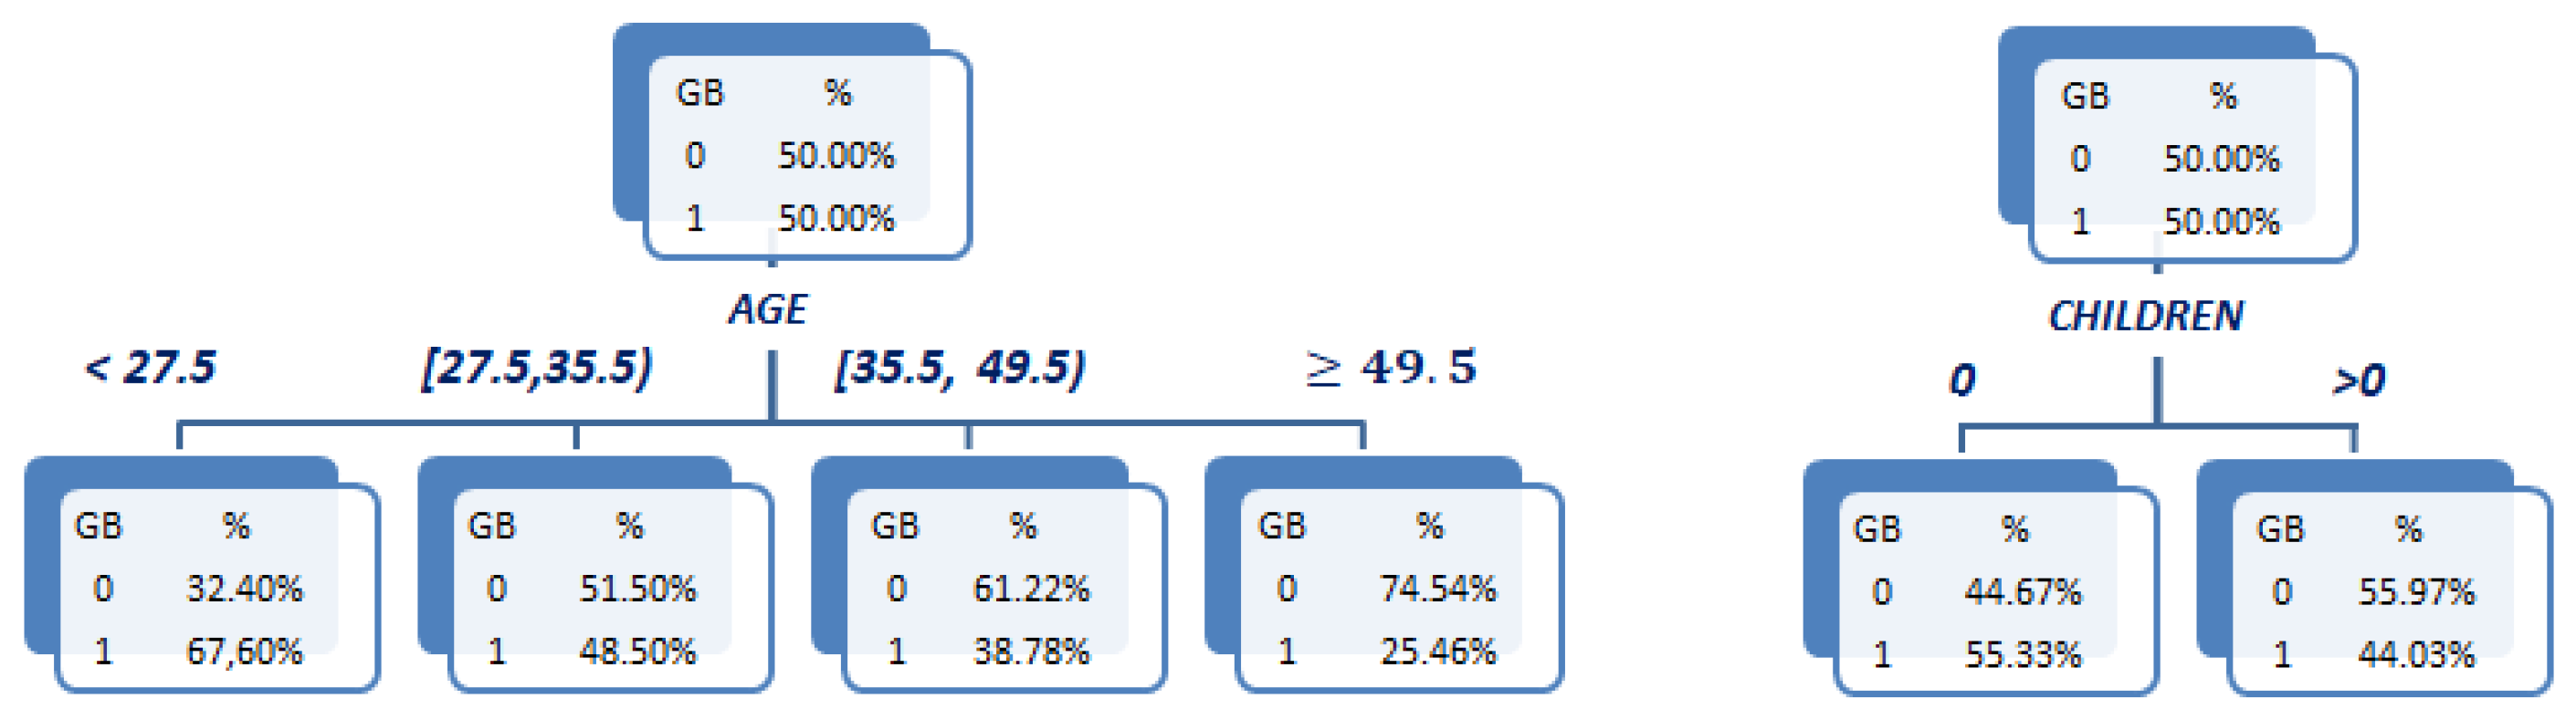
To begin, a pair of CART classification trees are fitted to explain the target variable GB (=1 (), = 0 ()) according to and , respectively, in order to obtain the univariate WOE variables and .
As recommended in the last section, a depth-1, 4-ary branching configuration is used in the case of
. The resulting tree is shown in
Figure 4 (left). Notice the (decreasing) monotonicity of the default rates as
increases that allows a clear interpretation of the effect of this variable on the default probability: The higher the age of a client, the lower the probability of defaulting. The values of the corresponding
variable are given in
Table 2, showing also the mentioned monotone behaviour. For illustrative purposes, a depth-1 tree with just binary branching is used for
. This allows a simple monotone pattern to also arise in this case: Clients with children have a lower default probability, as can be observed in the tree at
Figure 4 (right). The obtained values of
are provided in
Table 3.
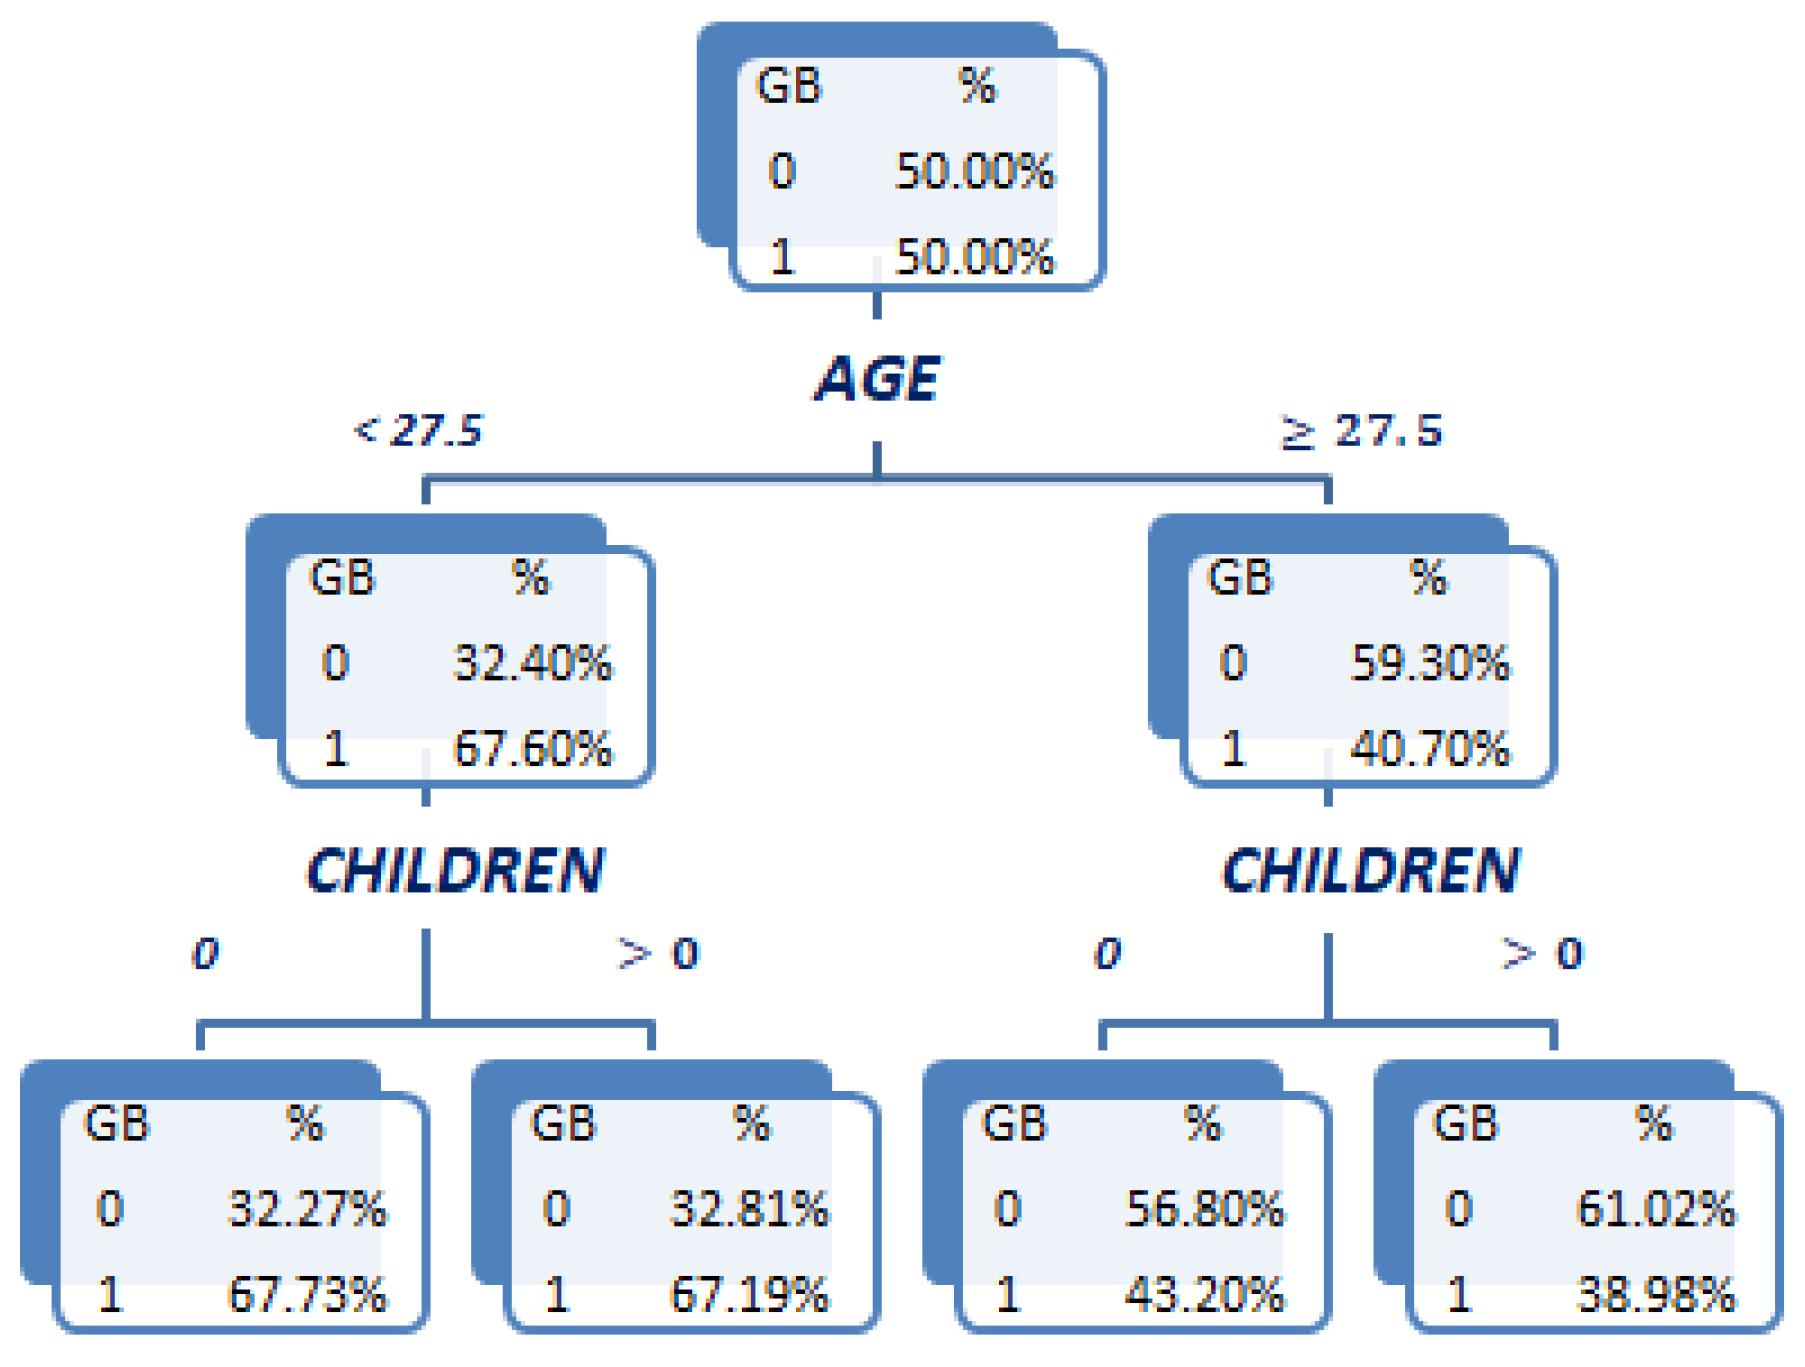
Now, a third tree in which both
and
simultaneously participate is fitted to generate the bivariate WOE variable
. This binary branching depth-2 tree is shown in
Figure 5. The cut-off values in this tree have been introduced manually in order to reproduce the analyst intuition that the main difference in the effect of having children is between young (i.e.,
) and not-young (
) clients. The resulting tree captures this interaction pattern: the effect of having children on default probability is almost nonexistent in the case of young clients (67.73% for clients without children vs. 67.19% for clients with children), while it is quite more significant for not-young clients (43.20% vs. 38.98%; a 4% reduction in absolute terms). The bivariate WOE variable
for which its values are provided in
Table 4 adequately reflects this interaction effect, taking quite similar values in the first two leaves associated to young clients, while being noticeably different in the last two leaves associated with not-young clients. Notice that the tree in
Figure 5 could be prunned by the branch associated with the younger clients. However, it has been left unprunned for the illustrative purposes of this example.
Let us now introduce a second example focusing on variables (type of credit card owned by a client) and (loan requested cash in US$) of the same dataset. Notice that is a nominal variable, while is a continuous one. This example will then allow the illustration of the mentioned capability of the proposed bivariate WOE variables methodology in order to deal with this casuistic, which is otherwise difficult to deal with without introducing as many dummy variables as categories of the nominal variable (minus one).
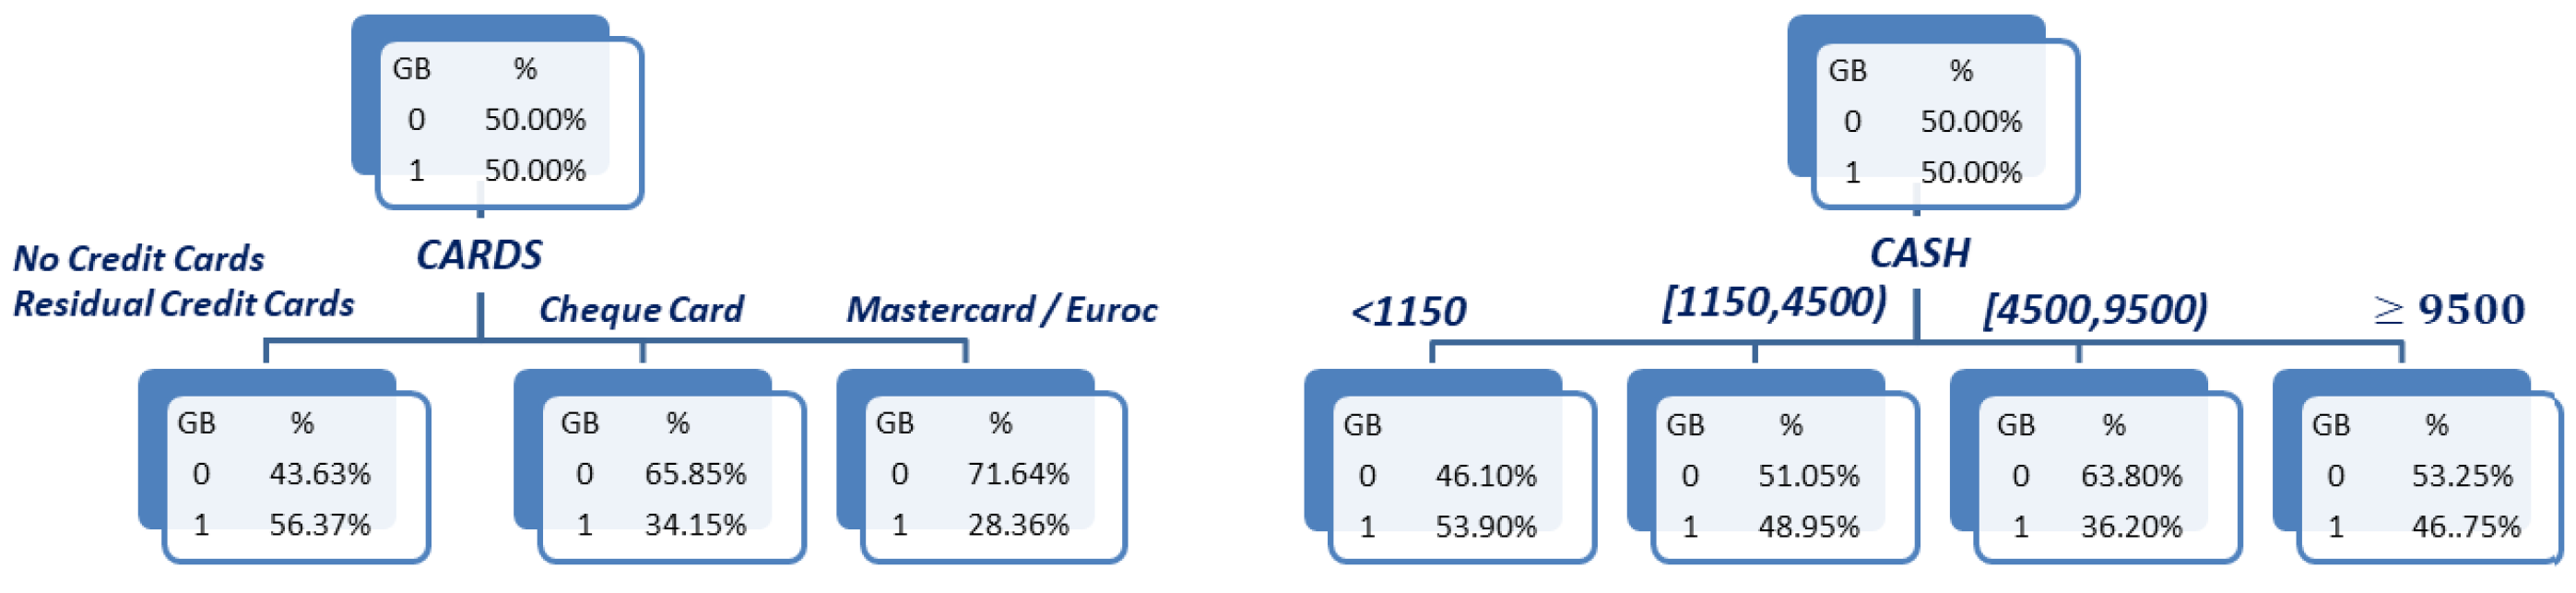
As before, the first step consists of fitting a pair of depth-1, 4-ary branching CART trees explains the response
in terms of
and
, respectively. The resulting trees are shown in
Figure 6. Notice that, although a 4-ary branching tree was requested, the tree for
only has three leaves. This is due to the very reduced support of the
Residual Credit Cards category (which includes Visa and American Express, among others) that holds for just 10 observations or clients in the
dataset. Since a 1% support threshold was required to create a leaf, this category was merged in the tree with
No Credit Cards. Regarding the tree for
, the first 3 categories present a (decreasing) monotone behaviour of the default rates, which is broken at the last category containing the highest loans (
). Although this pattern may seem counter-intuitive at first sight, it actually is not so: Lowest loans (
) are typically asked only by low-income clients, which explains the relatively high default rate at this category. Higher loans (
or
) tend to be only granted to relatively middle-to-high-income clients, thus explaining the decreasing pattern of default rates. However, the highest loan category contains considerably high loans (
), which may be defaulted even by high-income clients. This explains why the default rate rises at this category. The values obtained for the corresponding WOE variables
and
are provided in
Table 5 and
Table 6, respectively.
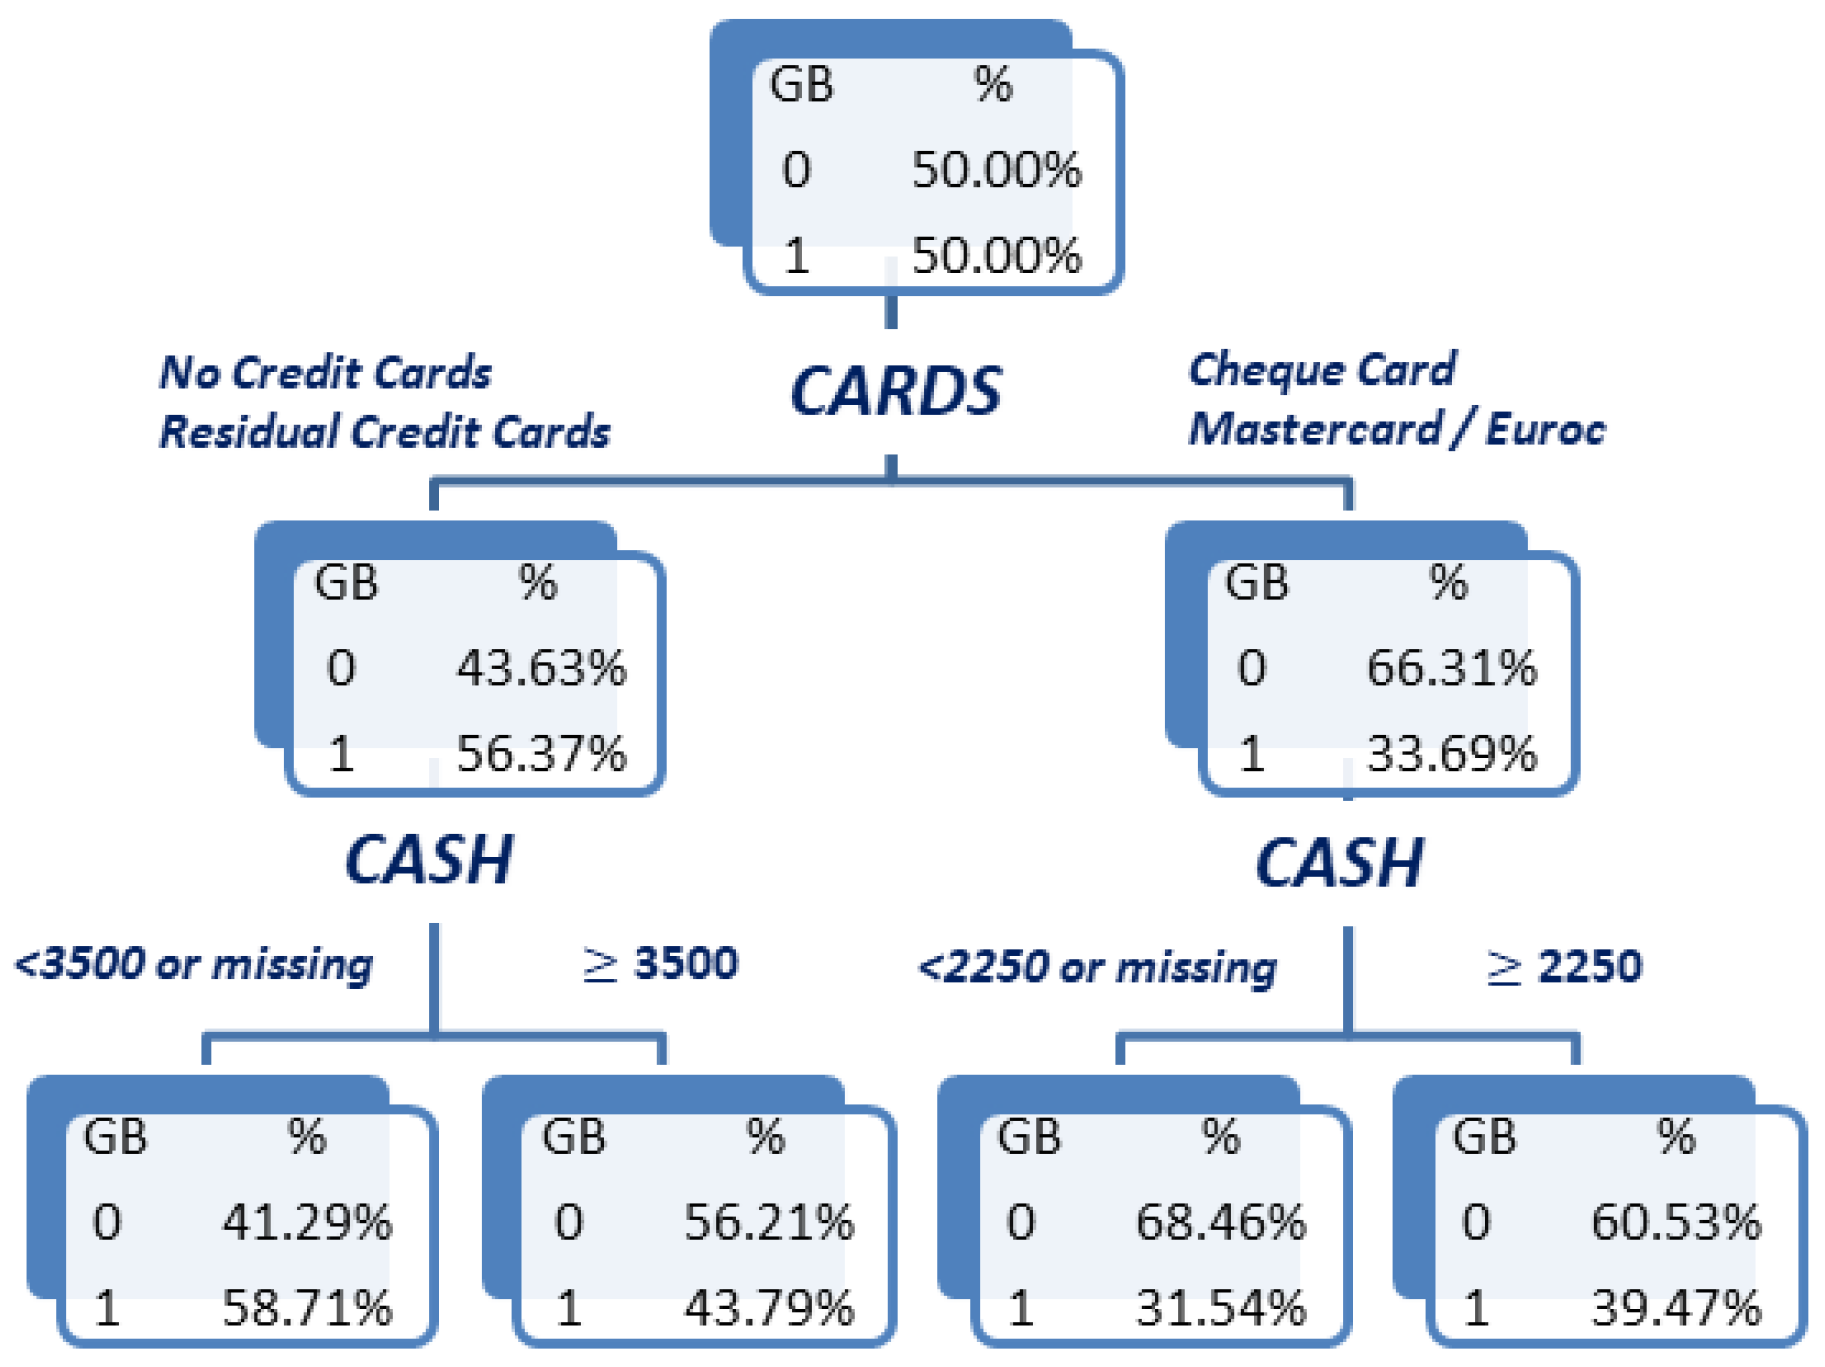
Now, a binary branching, depth-2 CART tree is fitted using both
and
to obtain the bivariate WOE
variable (see
Figure 7). By looking at the leaves of this tree, a variation in the effect of
on default probability depending on the credit cards owned by clients can be observed: When the client possesses either no credit card or a residual card, higher loans (
) are associated with a lower default rate than lower loans. However, when the client possesses either a Cheque Card or a Mastercard/Eurocard, higher loans (now
) are instead associated with a higher default probability than lower loans. The bivariate WOE variable
for which its values are provided in
Table 7 reflect this interaction pattern, taking a lower value in leaf one than in leaf two, while instead taking a greater value in leaf four than in leaf three.
In addition to this variation in the effect of
for different credit cards, another fact to emphasise is that, in the tree in
Figure 7, the cut-off value for
also varies depending on
: In the left branch for
, the cut-off for
is 3500, while in the right branch it is 2250. Therefore, the interaction between a pair of variables may not only be reflected through changes in the trend of the default probability as the second variable to enter the tree varies but also through variations in the cut-off values obtained for the second variable that separates the categories in which such variations in trend may occur. Obviously, this kind of interaction effect cannot be reflected through products of univariate WOE variables, since the cut-off values obtained in the univariate trees will determine the joint categories obtained from crossing the univariate variables. In this sense, notice also that the cut-off values for
obtained in the bivariate tree in
Figure 7 do not coincide with those obtained for the same variable in the univariate tree in
Figure 6 (right). These observations further illustrate the flexibility provided by bivariate WOE variables to capture different aspects of the interaction between a pair of variables.


 ,
, 


