Evaluation on the Efficiency of LED Energy Enterprises in China by Employing the DEA Model
Abstract
1. Introduction
2. Literature Review
2.1. LED-Related Issues
- Technology research and development
- Industry development status
- Policy
- Patent
2.2. Efficiency Measurement
3. Basic Theory of Technical Efficiency and DEA Method
3.1. Technical Efficiency
3.2. DEA Method
4. Variables Selection and Data Sources
4.1. The Input and Output Variables of DEA Method Based on CCR and BCC Model
4.2. Data Resources
5. Empirical Analysis
5.1. Analysis of Technical Efficiency, Pure Technical Efficiency, and Scale Efficiency of China’s LED Energy Enterprises in 2017
5.2. Analysis of Technical Efficiency, Pure Technical Efficiency, and Scale Efficiency of China’s LED Energy Enterprises in 2018
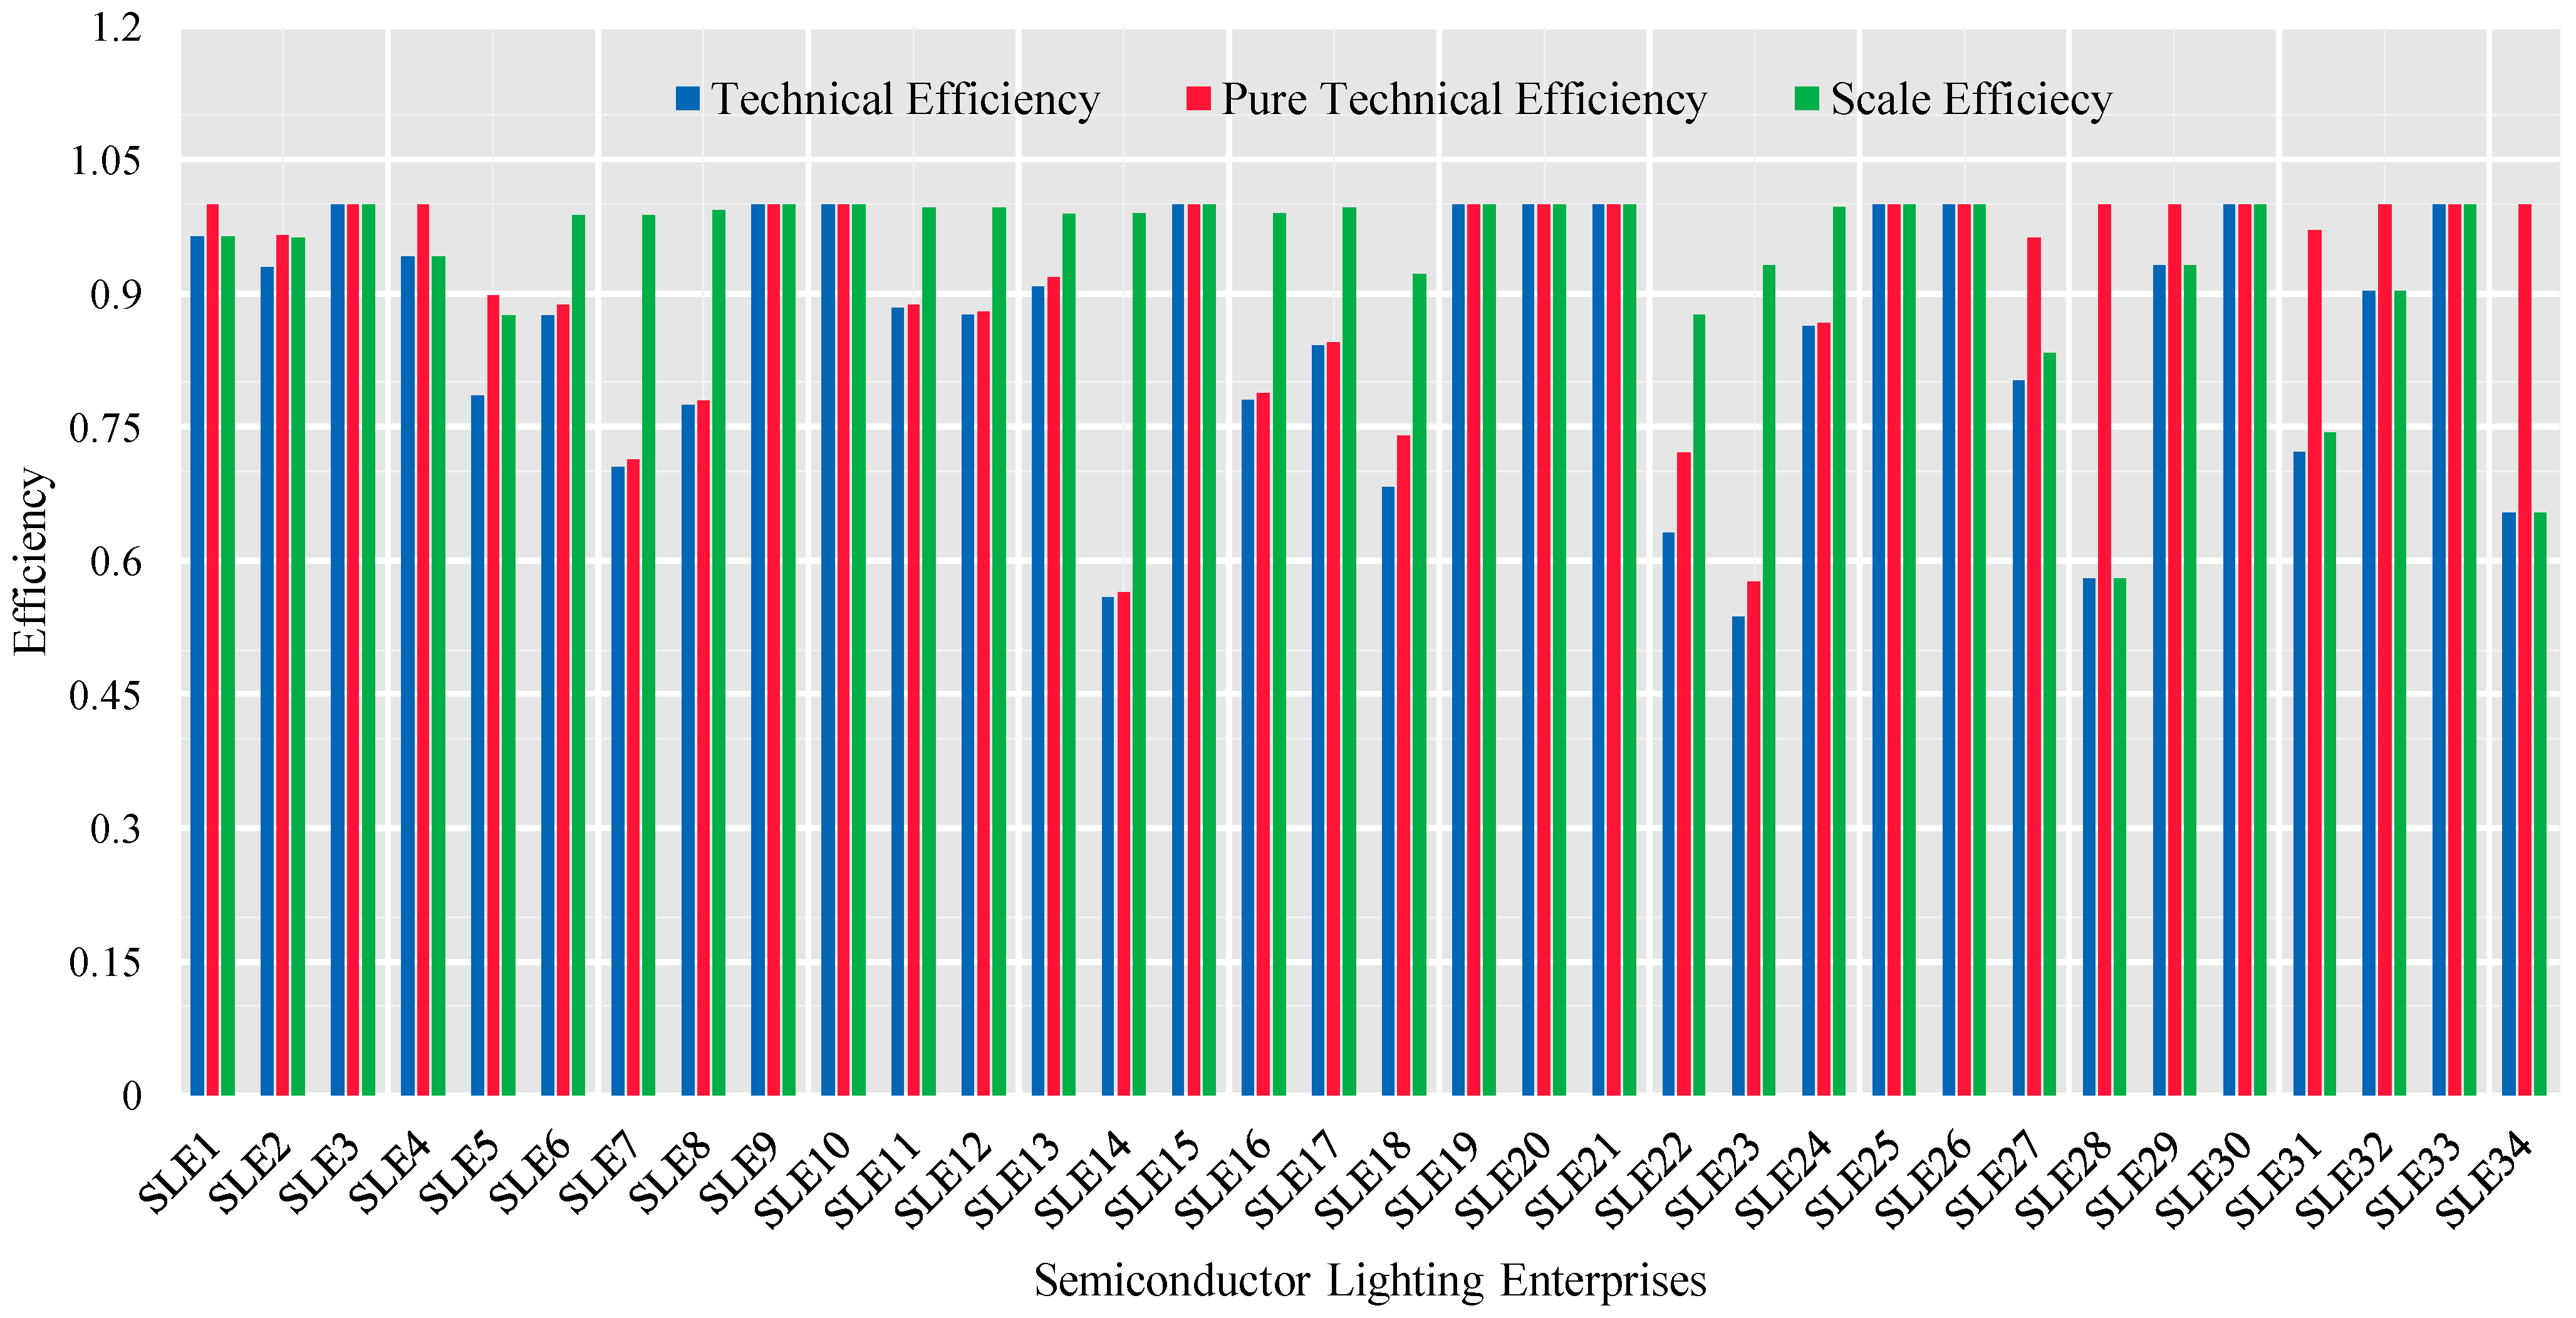
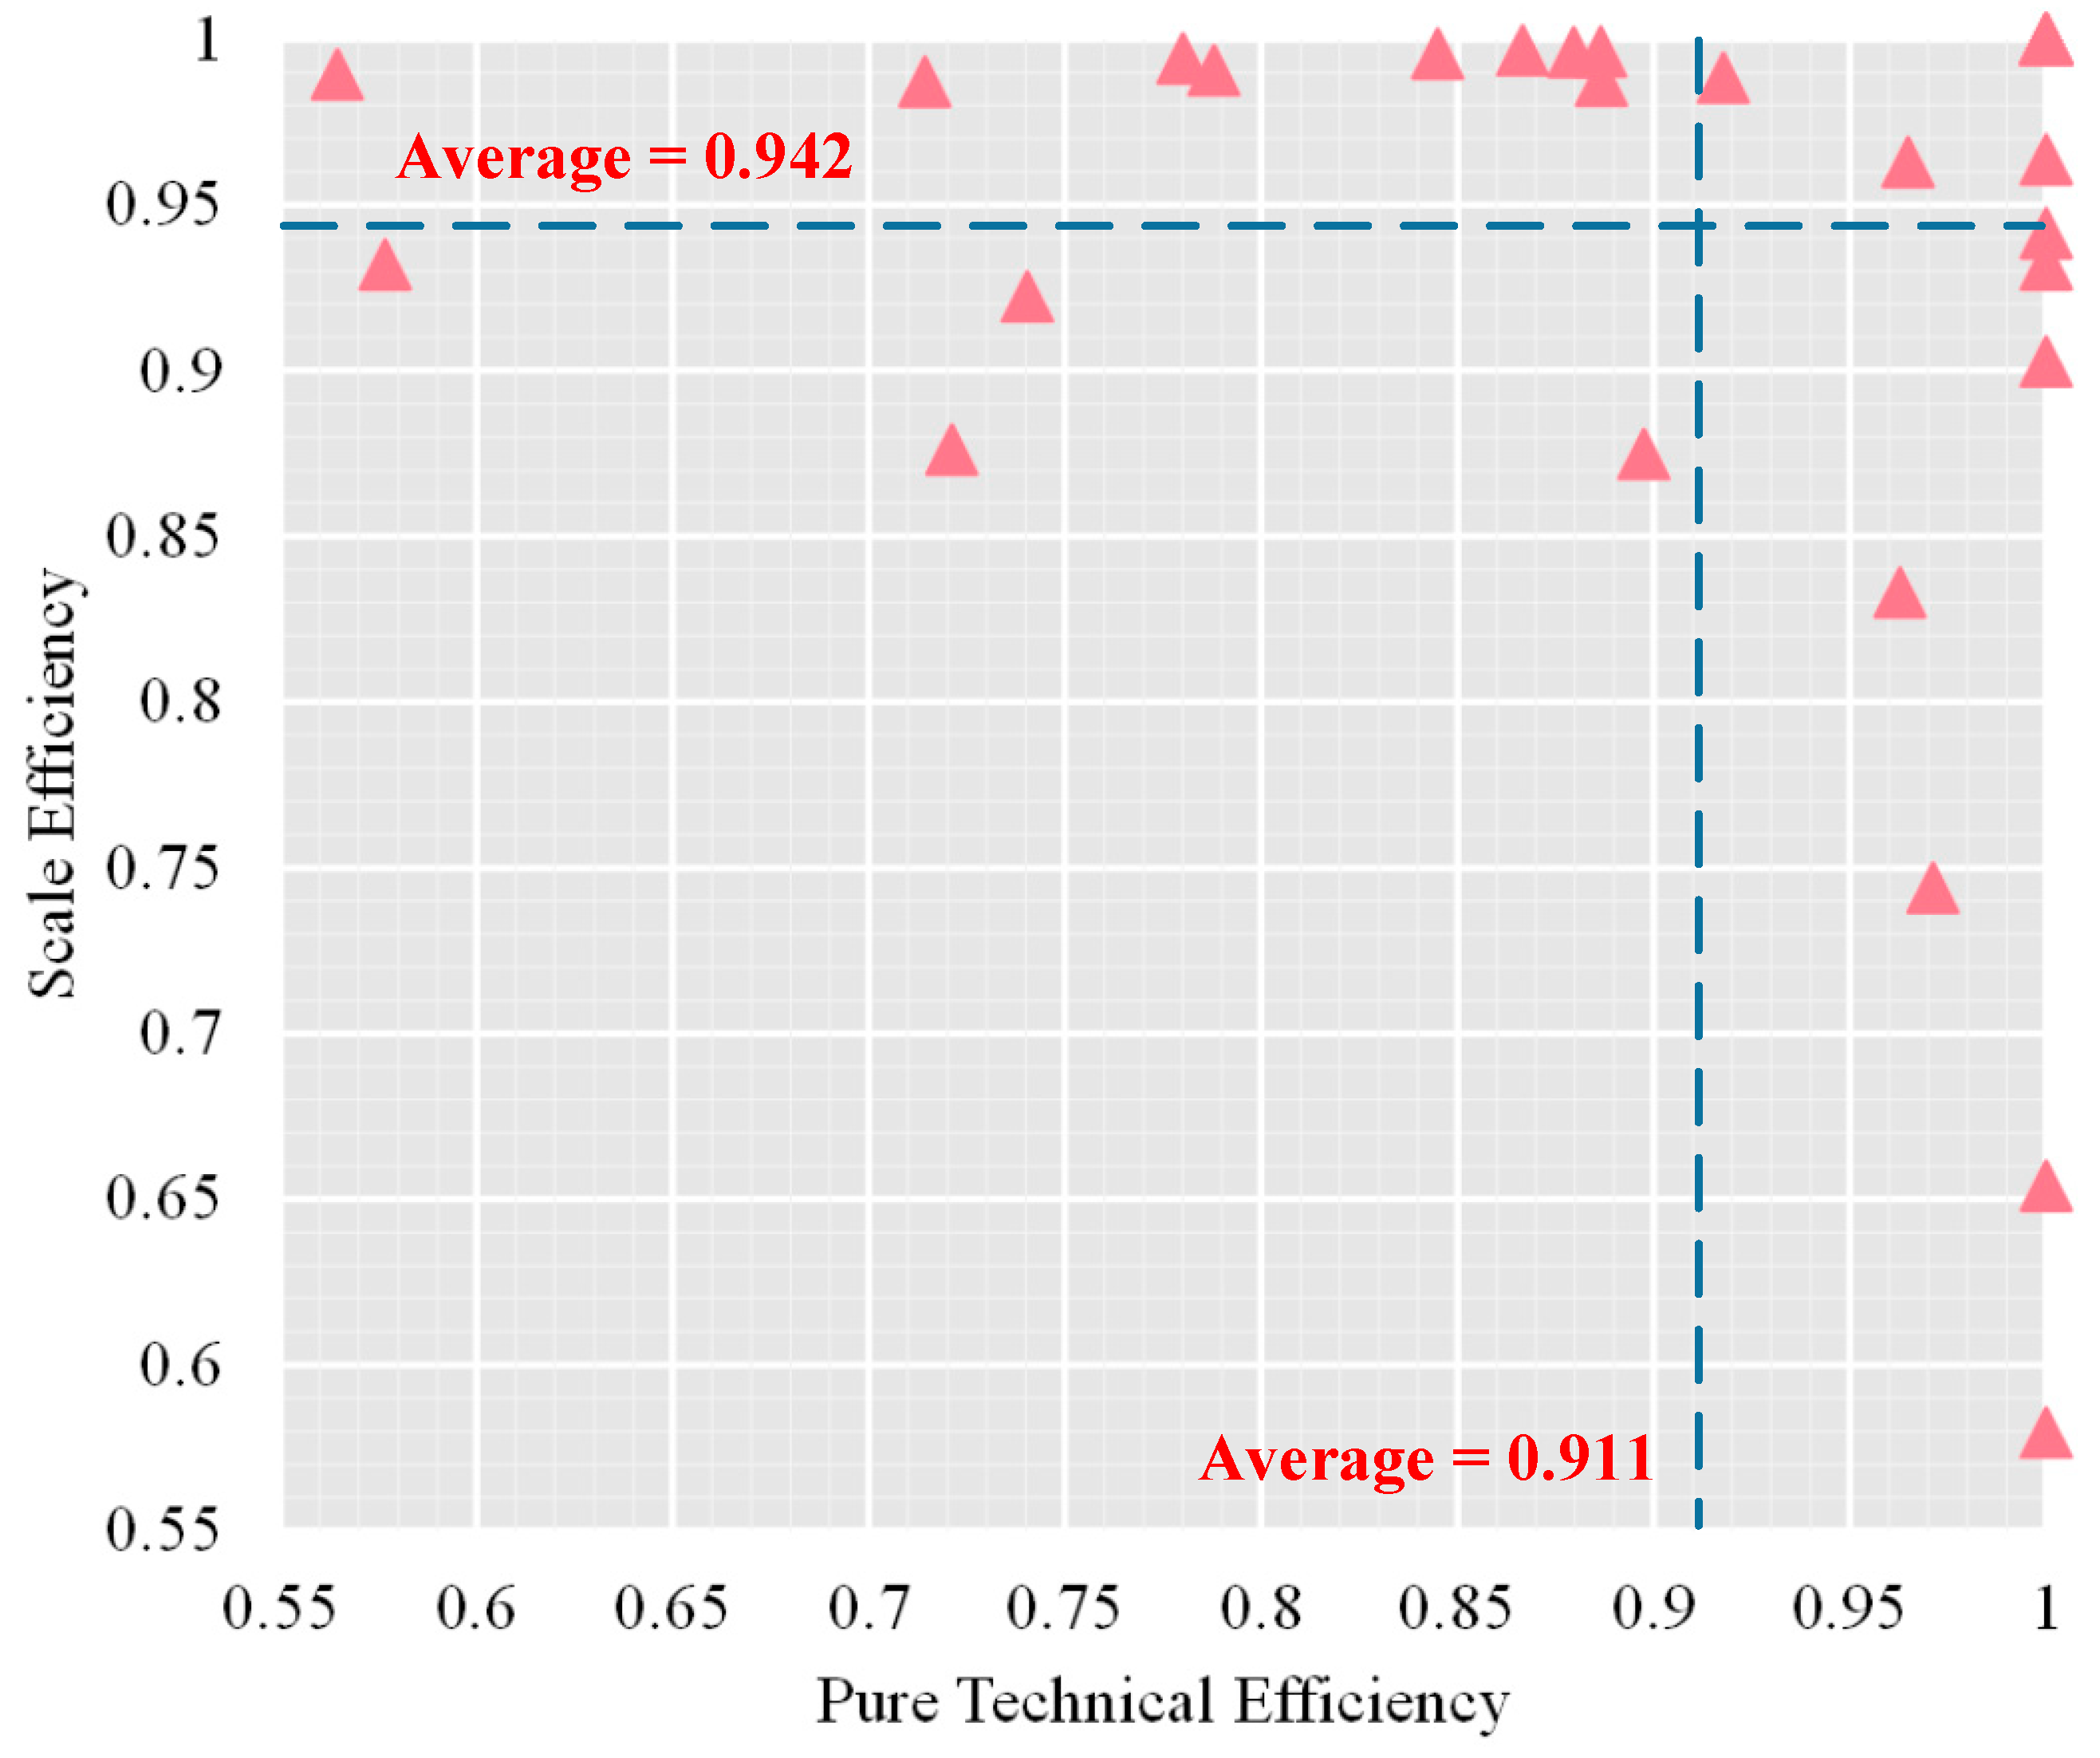
5.3. Analysis of Technical Efficiency, Pure Technical Efficiency, and Scale Efficiency of China’s LED Energy Enterprises in 2019
6. Conclusions and Suggestions
Author Contributions
Funding
Institutional Review Board Statement
Informed Consent Statement
Data Availability Statement
Acknowledgments
Conflicts of Interest
Abbreviations
| Abbreviation | Full name |
| LED | light-emitting diode |
| DEA | data envelopment analysis |
| CSA | China Solid State Lighting Alliance |
| MLG | multi-layer graphene |
| MCDA | multi-criteria decision analysis |
| BWM | best-worst method |
| SLE | semiconductor lighting enterprise |
| MEEM | matter-element extension |
| FCPT | fuzzy-cumulative prospect theory |
| DMU | decision-making unit |
| AHP | analytic hierarchy process |
| TOPSIS | Technique for Order Preference by Similarity to an Ideal Solution |
Appendix A
| DMUs | Operating Costs (Million CNY) | Research & Development Expense (Million CNY) | General & Administrative Expense (Million CNY) | Net Value of Fixed Assets (Million CNY) | Revenue (Million CNY) | Return on Total Assets Ratio (%) |
|---|---|---|---|---|---|---|
| SLE1 | 6452.00 | 305.80 | 312.90 | 5647.27 | 8169.00 | 6.38 |
| SLE2 | 4298.00 | 126.60 | 396.30 | 8218.60 | 8394.00 | 15.86 |
| SLE3 | 4133.00 | 220.70 | 186.50 | 1095.43 | 6957.00 | 13.99 |
| SLE4 | 3851.00 | 275.40 | 342.80 | 809.11 | 6471.00 | 12.30 |
| SLE5 | 3792.00 | 196.80 | 260.30 | 1184.36 | 5038.00 | 7.72 |
| SLE6 | 2120.00 | 109.20 | 113.00 | 758.58 | 3031.00 | 8.57 |
| SLE7 | 2944.00 | 175.80 | 120.90 | 1078.93 | 3699.00 | 10.06 |
| SLE8 | 3579.00 | 120.20 | 647.50 | 3542.76 | 4203.00 | −5.04 |
| SLE9 | 3444.00 | 93.38 | 113.70 | 281.40 | 4031.00 | 8.03 |
| SLE10 | 2940.00 | 34.58 | 179.00 | 483.52 | 3800.00 | 15.01 |
| SLE11 | 2651.00 | 160.40 | 107.50 | 2105.01 | 3473.00 | 7.17 |
| SLE12 | 2580.00 | 121.40 | 122.10 | 517.57 | 3009.00 | 6.68 |
| SLE13 | 3877.00 | 175.60 | 496.70 | 1317.56 | 5445.00 | 3.30 |
| SLE14 | 1756.00 | 87.16 | 177.90 | 4686.05 | 2630.00 | 8.30 |
| SLE15 | 1502.00 | 42.67 | 168.20 | 294.58 | 2266.00 | 14.17 |
| SLE16 | 1609.00 | 87.63 | 109.40 | 522.54 | 2055.00 | 1.66 |
| SLE17 | 985.80 | 80.24 | 109.80 | 345.75 | 1547.00 | 7.07 |
| SLE18 | 1279.00 | 87.42 | 100.40 | 1224.00 | 1750.00 | 4.49 |
| SLE19 | 627.20 | 67.49 | 61.61 | 164.00 | 1041.00 | 9.26 |
| SLE20 | 1287.00 | 57.97 | 71.42 | 509.20 | 1584.00 | 7.38 |
| SLE21 | 321.80 | 15.57 | 57.41 | 45.47 | 682.00 | 16.88 |
| SLE22 | 864.60 | 44.31 | 99.49 | 1121.00 | 1184.00 | 0.79 |
| SLE23 | 713.20 | 72.64 | 94.98 | 1402.00 | 1130.00 | 5.94 |
| SLE24 | 516.70 | 71.62 | 56.70 | 518.30 | 763.30 | 2.20 |
| SLE25 | 566.60 | 30.84 | 21.32 | 151.70 | 776.80 | 18.14 |
| SLE26 | 352.90 | 27.11 | 23.64 | 197.00 | 495.40 | 10.25 |
| SLE27 | 452.20 | 34.59 | 48.06 | 179.30 | 644.50 | 1.98 |
| SLE28 | 736.50 | 44.66 | 69.28 | 274.40 | 1026.00 | 3.99 |
| SLE29 | 421.70 | 24.13 | 29.47 | 353.70 | 620.90 | 10.78 |
| SLE30 | 317.50 | 8.80 | 30.38 | 56.99 | 480.30 | 11.26 |
| SLE31 | 281.80 | 24.63 | 32.52 | 312.20 | 411.10 | 6.12 |
| SLE32 | 209.50 | 15.73 | 19.90 | 74.97 | 337.80 | 12.81 |
| SLE33 | 544.40 | 68.48 | 59.20 | 274.70 | 557.60 | 6.74 |
| SLE34 | 90.50 | 38.44 | 25.64 | 220.60 | 177.20 | 3.01 |
| DMUs | Operating Costs (Million CNY) | Research & Development Expense (Million CNY) | General & Administrative Expense (Million CNY) | Net Value of Fixed Assets (Million CNY) | Revenue (Million CNY) | Return on Total Assets Ratio (%) |
|---|---|---|---|---|---|---|
| SLE1 | 13,280.00 | 692.10 | 730.10 | 7051.26 | 17,950.00 | 4.80 |
| SLE2 | 4625.00 | 144.40 | 501.10 | 8911.94 | 8364.00 | 11.81 |
| SLE3 | 5086.00 | 316.70 | 210.30 | 1049.97 | 8004.00 | 15.30 |
| SLE4 | 4717.00 | 316.70 | 402.50 | 935.67 | 7701.00 | 11.50 |
| SLE5 | 4253.00 | 216.30 | 371.80 | 1229.92 | 5616.00 | 6.81 |
| SLE6 | 3100.00 | 206.60 | 199.90 | 838.72 | 4524.00 | 9.26 |
| SLE7 | 3079.00 | 178.80 | 158.20 | 1114.64 | 4003.00 | 5.68 |
| SLE8 | 3479.00 | 167.00 | 488.00 | 1878.67 | 4001.00 | −36.21 |
| SLE9 | 3371.00 | 99.77 | 120.20 | 315.24 | 3995.00 | 7.77 |
| SLE10 | 2923.00 | 52.73 | 173.90 | 512.11 | 3802.00 | 7.81 |
| SLE11 | 3170.00 | 164.90 | 115.50 | 2248.65 | 4066.00 | 8.43 |
| SLE12 | 3015.00 | 126.10 | 130.80 | 555.84 | 3446.00 | 6.28 |
| SLE13 | 2398.00 | 127.60 | 574.40 | 1176.60 | 3302.00 | -21.70 |
| SLE14 | 1940.00 | 103.60 | 233.80 | 5059.52 | 2732.00 | 3.09 |
| SLE15 | 1663.00 | 48.61 | 168.00 | 316.03 | 2433.00 | 7.14 |
| SLE16 | 1832.00 | 95.98 | 117.50 | 845.76 | 23,445.00 | 5.46 |
| SLE17 | 1229.00 | 89.20 | 118.20 | 396.69 | 1987.00 | 13.89 |
| SLE18 | 1172.00 | 100.40 | 82.93 | 1046.00 | 1574.00 | 6.90 |
| SLE19 | 1046.00 | 90.03 | 71.26 | 161.80 | 1573.00 | 10.33 |
| SLE20 | 1254.00 | 91.27 | 62.48 | 474.50 | 1562.00 | 4.40 |
| SLE21 | 616.30 | 45.31 | 93.38 | 62.53 | 1307.00 | 17.22 |
| SLE22 | 920.50 | 65.64 | 118.90 | 1031.00 | 1120.00 | −26.47 |
| SLE23 | 729.20 | 61.33 | 145.70 | 1641.00 | 1030.00 | 3.97 |
| SLE24 | 641.60 | 64.55 | 69.68 | 500.40 | 965.30 | 6.08 |
| SLE25 | 676.00 | 39.13 | 23.73 | 272.80 | 877.10 | 10.33 |
| SLE26 | 520.40 | 34.71 | 27.36 | 194.90 | 774.50 | 14.63 |
| SLE27 | 561.80 | 39.69 | 66.87 | 213.40 | 733.50 | −2.88 |
| SLE28 | 435.20 | 41.24 | 71.06 | 256.30 | 566.10 | −42.23 |
| SLE29 | 517.20 | 46.72 | 47.27 | 763.30 | 558.70 | 2.09 |
| SLE30 | 339.60 | 16.67 | 37.84 | 62.68 | 526.50 | 10.10 |
| SLE31 | 352.80 | 30.27 | 66.21 | 322.60 | 513.50 | 3.55 |
| SLE32 | 324.70 | 22.28 | 25.88 | 122.50 | 486.90 | 9.92 |
| SLE33 | 373.40 | 74.45 | 57.55 | 250.50 | 421.70 | −24.31 |
| SLE34 | 109.00 | 37.36 | 35.85 | 224.00 | 228.20 | 4.02 |
| Dmus | Operating Costs (Million CNY) | Research & Development Expense (Million CNY) | General & Administrative Expense (Million CNY) | Net Value of Fixed Assets (Million CNY) | Revenue (Million CNY) | Return on Total Assets Ratio (%) |
|---|---|---|---|---|---|---|
| SLE1 | 13,210.00 | 481.00 | 936.30 | 6755.00 | 18,970.00 | 3.81 |
| SLE2 | 5269.00 | 197.00 | 504.00 | 9265.00 | 7460.00 | 5.64 |
| SLE3 | 5301.00 | 321.20 | 252.00 | 1037.00 | 8355.00 | 13.48 |
| SLE4 | 5962.00 | 370.20 | 466.70 | 976.50 | 9047.00 | 6.63 |
| SLE5 | 3601.00 | 216.70 | 419.00 | 1315.00 | 5316.00 | 9.14 |
| SLE6 | 3906.00 | 234.70 | 230.70 | 874.10 | 5604.00 | 9.59 |
| SLE7 | 2919.00 | 173.30 | 207.10 | 1002.00 | 3594.00 | −21.50 |
| SLE8 | 2557.00 | 94.06 | 357.40 | 1422.00 | 2980.00 | 5.10 |
| SLE9 | 3447.00 | 131.30 | 124.10 | 326.10 | 4244.00 | 8.41 |
| SLE10 | 2561.00 | 79.44 | 145.10 | 629.80 | 3338.00 | 5.57 |
| SLE11 | 3579.00 | 146.40 | 138.80 | 2377.00 | 4069.00 | 7.39 |
| SLE12 | 3832.00 | 152.70 | 156.80 | 547.70 | 4355.00 | 5.39 |
| SLE13 | 2014.00 | 84.89 | 422.20 | 1086.00 | 2928.00 | −14.08 |
| SLE14 | 2871.00 | 138.00 | 235.10 | 4609.00 | 2716.00 | −8.20 |
| SLE15 | 1632.00 | 61.50 | 110.20 | 360.80 | 2504.00 | 10.01 |
| SLE16 | 1807.00 | 120.80 | 132.30 | 997.10 | 2507.00 | 9.53 |
| SLE17 | 1488.00 | 95.61 | 129.30 | 347.70 | 2181.00 | 5.58 |
| SLE18 | 1208.00 | 108.00 | 85.05 | 998.30 | 1617.00 | -12.34 |
| SLE19 | 691.90 | 85.72 | 73.50 | 154.50 | 1245.00 | 8.83 |
| SLE20 | 111.70 | 82.22 | 76.49 | 482.20 | 1372.00 | −5.91 |
| SLE21 | 663.80 | 57.08 | 123.10 | 48.40 | 1252.00 | 6.33 |
| SLE22 | 596.80 | 38.36 | 136.80 | 912.10 | 729.80 | 2.47 |
| SLE23 | 959.90 | 66.13 | 176.60 | 3404.00 | 1039.00 | −4.13 |
| SLE24 | 630.50 | 71.43 | 60.85 | 477.00 | 1069.00 | 8.14 |
| SLE25 | 850.30 | 50.20 | 41.75 | 328.50 | 1117.00 | 10.02 |
| SLE26 | 619.40 | 46.47 | 71.28 | 183.60 | 982.80 | 16.77 |
| SLE27 | 708.80 | 44.39 | 46.95 | 202.50 | 966.90 | 3.32 |
| SLE28 | 245.20 | 27.50 | 76.67 | 109.10 | 353.50 | −49.56 |
| SLE29 | 995.70 | 45.65 | 35.87 | 955.00 | 1143.00 | 1.47 |
| SLE30 | 452.40 | 25.02 | 43.79 | 90.21 | 711.90 | 11.04 |
| SLE31 | 324.40 | 30.13 | 85.57 | 328.80 | 535.50 | 3.17 |
| SLE32 | 370.40 | 30.07 | 37.01 | 145.30 | 560.40 | 7.75 |
| SLE33 | 161.60 | 69.88 | 50.58 | 164.90 | 417.90 | 8.11 |
| SLE34 | 180.40 | 39.01 | 45.91 | 517.00 | 321.40 | 3.58 |
Appendix B
| DMUs | Technical Efficiency | Ranking | Pure Technical Efficiency | Ranking | Scale Efficiency | Ranking |
|---|---|---|---|---|---|---|
| SLE1 | 0.77 | 20 | 1.00 | 1 | 0.77 | 34 |
| SLE2 | 1.00 | 1 | 1.00 | 1 | 1.00 | 1 |
| SLE3 | 1.00 | 1 | 1.00 | 1 | 1.00 | 1 |
| SLE4 | 0.94 | 9 | 1.00 | 1 | 0.94 | 27 |
| SLE5 | 0.75 | 25 | 0.78 | 25 | 0.96 | 21 |
| SLE6 | 0.83 | 16 | 0.84 | 19 | 0.99 | 15 |
| SLE7 | 0.82 | 18 | 0.82 | 21 | 1.00 | 9 |
| SLE8 | 0.61 | 33 | 0.67 | 33 | 0.92 | 30 |
| SLE9 | 1.00 | 1 | 1.00 | 1 | 1.00 | 1 |
| SLE10 | 1.00 | 1 | 1.00 | 1 | 1.00 | 1 |
| SLE11 | 0.87 | 15 | 0.87 | 16 | 1.00 | 10 |
| SLE12 | 0.76 | 23 | 0.77 | 29 | 0.99 | 14 |
| SLE13 | 0.73 | 30 | 0.86 | 17 | 0.85 | 33 |
| SLE14 | 0.76 | 21 | 0.77 | 28 | 0.99 | 13 |
| SLE15 | 0.90 | 11 | 1.00 | 12 | 0.91 | 32 |
| SLE16 | 0.72 | 31 | 0.73 | 31 | 0.99 | 11 |
| SLE17 | 0.82 | 17 | 0.85 | 18 | 0.97 | 20 |
| SLE18 | 0.74 | 29 | 0.76 | 30 | 0.98 | 17 |
| SLE19 | 0.89 | 12 | 0.91 | 15 | 0.99 | 16 |
| SLE20 | 0.75 | 28 | 0.78 | 26 | 0.96 | 22 |
| SLE21 | 1.00 | 1 | 1.00 | 1 | 1.00 | 1 |
| SLE22 | 0.69 | 32 | 0.70 | 32 | 0.98 | 18 |
| SLE23 | 0.78 | 19 | 0.79 | 24 | 0.99 | 12 |
| SLE24 | 0.76 | 24 | 0.79 | 22 | 0.95 | 24 |
| SLE25 | 1.00 | 1 | 1.00 | 1 | 1.00 | 1 |
| SLE26 | 0.87 | 14 | 0.92 | 14 | 0.95 | 26 |
| SLE27 | 0.75 | 26 | 0.79 | 23 | 0.95 | 25 |
| SLE28 | 0.75 | 27 | 0.77 | 27 | 0.98 | 19 |
| SLE29 | 0.89 | 13 | 0.93 | 13 | 0.96 | 23 |
| SLE30 | 1.00 | 1 | 1.00 | 1 | 1.00 | 1 |
| SLE31 | 0.76 | 22 | 0.84 | 20 | 0.91 | 31 |
| SLE32 | 1.00 | 1 | 1.00 | 1 | 1.00 | 1 |
| SLE33 | 0.54 | 34 | 0.57 | 34 | 0.94 | 28 |
| SLE34 | 0.92 | 10 | 1.00 | 1 | 0.92 | 29 |
| DMUs | Technical Efficiency | Ranking | Pure Technical Efficiency | Ranking | Scale Efficiency | Ranking |
|---|---|---|---|---|---|---|
| SLE1 | 0.85 | 17 | 1.00 | 1 | 0.85 | 32 |
| SLE2 | 1.00 | 1 | 1.00 | 1 | 1.00 | 1 |
| SLE3 | 1.00 | 1 | 1.00 | 1 | 1.00 | 1 |
| SLE4 | 0.91 | 14 | 1.00 | 1 | 0.91 | 27 |
| SLE5 | 0.78 | 22 | 0.85 | 18 | 0.92 | 25 |
| SLE6 | 0.86 | 16 | 0.88 | 16 | 0.98 | 18 |
| SLE7 | 0.81 | 19 | 0.82 | 22 | 0.99 | 15 |
| SLE8 | 0.63 | 30 | 0.70 | 30 | 0.90 | 28 |
| SLE9 | 1.00 | 1 | 1.00 | 1 | 1.00 | 1 |
| SLE10 | 1.00 | 1 | 1.00 | 1 | 1.00 | 1 |
| SLE11 | 0.94 | 13 | 0.94 | 15 | 0.99 | 13 |
| SLE12 | 0.83 | 18 | 0.84 | 20 | 0.99 | 16 |
| SLE13 | 0.73 | 26 | 0.81 | 23 | 0.90 | 29 |
| SLE14 | 0.73 | 25 | 0.74 | 27 | 0.99 | 14 |
| SLE15 | 0.99 | 11 | 1.00 | 1 | 1.00 | 1 |
| SLE16 | 0.79 | 20 | 0.81 | 24 | 0.98 | 20 |
| SLE17 | 0.88 | 15 | 0.88 | 17 | 1.00 | 1 |
| SLE18 | 0.78 | 23 | 0.80 | 26 | 0.97 | 21 |
| SLE19 | 0.95 | 12 | 0.99 | 14 | 0.96 | 24 |
| SLE20 | 0.77 | 24 | 0.80 | 25 | 0.96 | 22 |
| SLE21 | 1.00 | 1 | 1.00 | 1 | 1.00 | 1 |
| SLE22 | 0.61 | 32 | 0.62 | 34 | 0.98 | 19 |
| SLE23 | 0.67 | 29 | 0.68 | 31 | 0.98 | 17 |
| SLE24 | 0.79 | 21 | 0.82 | 21 | 0.96 | 23 |
| SLE25 | 1.00 | 1 | 1.00 | 1 | 1.00 | 1 |
| SLE26 | 1.00 | 1 | 1.00 | 1 | 1.00 | 1 |
| SLE27 | 0.67 | 28 | 0.73 | 28 | 0.92 | 26 |
| SLE28 | 0.61 | 31 | 0.71 | 29 | 0.86 | 31 |
| SLE29 | 0.59 | 33 | 0.68 | 32 | 0.88 | 30 |
| SLE30 | 1.00 | 1 | 1.00 | 1 | 1.00 | 1 |
| SLE31 | 0.69 | 27 | 0.84 | 19 | 0.81 | 34 |
| SLE32 | 1.00 | 1 | 1.00 | 1 | 1.00 | 1 |
| SLE33 | 0.53 | 34 | 0.64 | 33 | 0.83 | 33 |
| SLE34 | 1.00 | 1 | 1.00 | 1 | 1.00 | 1 |
| Technical Efficiency | Ranking | Pure Technical Efficiency | Ranking | DMUs | Scale Efficiency | Ranking |
|---|---|---|---|---|---|---|
| 0.96 | 12 | 1.00 | 1 | SLE1 | 0.96 | 22 |
| 0.93 | 15 | 0.96 | 19 | SLE2 | 0.96 | 23 |
| 1.00 | 1 | 1.00 | 1 | SLE3 | 1.00 | 1 |
| 0.94 | 13 | 1.00 | 1 | SLE4 | 0.94 | 24 |
| 0.79 | 24 | 0.90 | 22 | SLE5 | 0.87 | 30 |
| 0.88 | 20 | 0.89 | 23 | SLE6 | 0.99 | 20 |
| 0.70 | 28 | 0.71 | 32 | SLE7 | 0.99 | 21 |
| 0.78 | 26 | 0.78 | 29 | SLE8 | 0.99 | 16 |
| 1.00 | 1 | 1.00 | 1 | SLE9 | 1.00 | 1 |
| 1.00 | 1 | 1.00 | 1 | SLE10 | 1.00 | 1 |
| 0.88 | 18 | 0.89 | 24 | SLE11 | 1.00 | 1 |
| 0.88 | 19 | 0.88 | 25 | SLE12 | 1.00 | 1 |
| 0.91 | 16 | 0.92 | 21 | SLE13 | 0.99 | 19 |
| 0.56 | 33 | 0.56 | 34 | SLE14 | 0.99 | 18 |
| 1.00 | 1 | 1.00 | 1 | SLE15 | 1.00 | 1 |
| 0.78 | 25 | 0.79 | 28 | SLE16 | 0.99 | 17 |
| 0.84 | 22 | 0.84 | 27 | SLE17 | 1.00 | 1 |
| 0.68 | 29 | 0.74 | 30 | SLE18 | 0.92 | 27 |
| 1.00 | 1 | 1.00 | 1 | SLE19 | 1.00 | 1 |
| 1.00 | 1 | 1.00 | 1 | SLE20 | 1.00 | 1 |
| 1.00 | 1 | 1.00 | 1 | SLE21 | 1.00 | 1 |
| 0.63 | 31 | 0.72 | 31 | SLE22 | 0.88 | 29 |
| 0.54 | 34 | 0.58 | 33 | SLE23 | 0.93 | 26 |
| 0.86 | 21 | 0.87 | 26 | SLE24 | 1.00 | 1 |
| 1.00 | 1 | 1.00 | 1 | SLE25 | 1.00 | 1 |
| 1.00 | 1 | 1.00 | 1 | SLE26 | 1.00 | 1 |
| 0.80 | 23 | 0.96 | 20 | SLE27 | 0.83 | 31 |
| 0.58 | 32 | 1.00 | 1 | SLE28 | 0.58 | 34 |
| 0.93 | 14 | 1.00 | 1 | SLE29 | 0.93 | 25 |
| 1.00 | 1 | 1.00 | 1 | SLE30 | 1.00 | 1 |
| 0.72 | 27 | 0.97 | 18 | SLE31 | 0.74 | 32 |
| 0.90 | 17 | 1.00 | 1 | SLE32 | 0.90 | 28 |
| 1.00 | 1 | 1.00 | 1 | SLE33 | 1.00 | 1 |
| 0.65 | 30 | 1.00 | 1 | SLE34 | 0.65 | 33 |
References
- Saidur, R.; Abdelaziz, E.; Demirbas, A.; Hossain, M.; Mekhilef, S. A review on biomass as a fuel for boilers. Renew. Sustain. Energy Rev. 2011, 15, 2262–2289. [Google Scholar] [CrossRef]
- National Bureau of Statistics. Available online: http://www.stats.gov.cn/ (accessed on 22 August 2020).
- Wang, C.; Patino-Echeverri, D.; Regan, L. Decoupling analysis on Chinese economic growth and energy consumption. China J. Popul. Resour. Environ. 2010, 20, 35–37. [Google Scholar]
- Zhang, Z.T.; Cheng, Y.; Yin, L. Research on the Evolution and Operation Mode of Strategic Emerging Industries’ Innovation System Network—Based on the Analysis of Shenzhen LED Industry. RD Manag. 2014, 26, 114–121. [Google Scholar]
- China Soled State Lighting Alliance. Available online: http://csa.china-led.net/ (accessed on 22 August 2020).
- Zhang, Y.; Wang, L.; Li, X.; Yi, X.; Zhang, N.; Li, J.; Zhu, H.; Wang, G. Annealed InGaN green light-emitting diodes with graphene transparent conductive electrodes. J. Appl. Phys. 2012, 111, 114501. [Google Scholar] [CrossRef]
- Zhang, S.G.; Zhang, X.W.; Si, F.T.; Dong, J.J.; Wang, J.X.; Liu, X.; Yin, Z.G.; Gao, H.L. Ordered ZnO nanorods-based heterojunction light-emitting diodes with graphene current spreading layer. Appl. Phys. Lett. 2012, 101, 121104. [Google Scholar] [CrossRef]
- Li, X.; Liang, R.; Tao, J.; Peng, Z.; Xu, Q.; Han, X.; Wang, X.; Wang, C.; Zhu, J.; Pan, C.; et al. Flexible Light Emission Diode Arrays Made of Transferred Si-Microwires-ZnO-Nanofilm with Piezo-Phototronic Effect Enhanced Lighting. ACS Nano 2017, 11, 3883. [Google Scholar] [CrossRef]
- Abramov, A.V.; Bogdanov, A.A.; Danilko, A.V.; Dmitriev, P.B.; Karev, A.V.; Stepanov, A.V. Inrush Current Measurement Methodology of Led Lighting Fixtures. Light Eng. 2021, 29, 39–47. [Google Scholar] [CrossRef]
- Cheng, C.; Chung, T.; Yang, F. A single-stage LED driver for street-lighting applications with high PFC. In Proceedings of the 2013 IEEE International Symposium on Industrial Electronics, Kaohsiung, Taiwan, 25–26 February 2013; pp. 1–4. [Google Scholar]
- Ye, X.T.; Zhang, J.; Su, J.; Huang, C. Comparative Advantage and Development Countermeasure of China’s Light Emitting Diode Industry in Background of Anti-dumping and Anti-subsidy. Technol. Econ. 2014, 33, 59–62. [Google Scholar]
- Guo, F.; Pachauri, S. China’s Green Lights Program: A review and assessment. Energy Policy 2017, 110, 31–39. [Google Scholar] [CrossRef]
- Wu, K.; Wang, M.Y. Research on Innovation Approaches of LED Enterprise Business Model. Sci. Technol. Manag. Res. 2013, 33, 28. [Google Scholar]
- Wang, F.; Mao, J. A study on technological chain, industy technological chain and industy upgrading—A case study on semiconductor illuminance industry in China. RD Manag. 2010, 22, 19–28. [Google Scholar]
- Li, S.H.; Huang, H.M.; Wang, H. Analysis and policy measures of China’s LED industry development status. Macroeconomics 2011, 31, 25–32. [Google Scholar]
- Ye, X.T.; Li, M.H. Study on the Difference of China’s Industrial Policy Based on the Quantitative Analysis of Policy Documents—A Case Study on the Light Emitting Diode Industry. J. Public Manag. 2015, 12, 145–152, 159–160. [Google Scholar]
- Wan, Y.; Feng, R.H.; Huang, J. Domestic and foreign LED lighting industry policies. High. Technol. Commer. 2011, 18, 35–39. [Google Scholar]
- Luo, K.; Yuan, X. Research on the tendency of patent fragmentation in Chinese LED industry and policy implication. J. Intell. 2016, 35, 89–94. [Google Scholar]
- Chen, Y.; Chen, B. Utilizing patent analysis to explore the cooperative competition relationship of the two LED companies: Nichia and Osram. Technol. Forecast. Soc. Chang. 2011, 78, 294–302. [Google Scholar] [CrossRef]
- Jia, Z.; Dong, J. Study on the patent strategy of semiconductor lighting industry in Shanxi province. J. Libr. Inf. Sci. 2011, 21, 132–135. [Google Scholar]
- Farrell, M.J. The Measurement of Productive Efficiency. J. R. Stat. Soc. Ser. A 1957, 120, 253–281. [Google Scholar] [CrossRef]
- Neves, L.P.; Dias, L.C.; Antunes, C.H.; Martins, A.G. Structuring an MCDA model using SSM: A case study in energy efficiency. Eur. J. Oper. Res. 2009, 199, 834–845. [Google Scholar] [CrossRef][Green Version]
- Li, X.; Liu, Y.; Wang, Y.; Gao, Z. Evaluating transit operator efficiency: An enhanced DEA model with constrained fuzzy-AHP cones. J. Traffic Transp. Eng. 2016, 3, 215–225. [Google Scholar] [CrossRef]
- Narendra, N.D.; Jignesh, M.J. Estimating technical efficiency of petroleum refineries using DEA and tobit model: An India perspective. Comput. Chem. Eng. 2021, 142, 107047. [Google Scholar]
- Wanke, P.; Azad, M.A.K.; Barros, C.P.; Hassan, M.K. Predicting efficiency in Islamic banks: An integrated multicriteria decision making (MCDM) approach. J. Int. Financ. Mark. Inst. Money 2016, 45, 126–141. [Google Scholar] [CrossRef]
- Su, W.; Wang, D.; Xu, L.; Zeng, S.; Zhang, C. A Nonradial Super Efficiency DEA Framework Using a MCDM to Measure the Research Efficiency of Disciplines at Chinese Universities. IEEE Access 2020, 8, 86388–86399. [Google Scholar] [CrossRef]
- Neykov, N.; Krišťáková, S.; Hajdúchová, I.; Sedliačiková, M.; Antov, P.; Giertliová, B. Economic Efficiency of Forest Enterprises—Empirical Study Based on Data Envelopment Analysis. Forests 2021, 12, 462. [Google Scholar] [CrossRef]
- Faizi, S.; Sałabun, W.; Nawaz, S.; Rehman, A.U.; Atróbski, J.W. Best-Worst method and Hamacher aggregation operations for intuitionistic 2-tuple linguistic sets. Expert Syst. Appl. 2021, 181, 115088. [Google Scholar] [CrossRef]
- Zhao, H.; Li, N. A Novel Hybrid Evaluation Model for the Performance of ERP Project Based on ANP and Improved Matter-Element Extension Model. Math. Probl. Eng. 2013, 2013 Pt 3, 237–245. [Google Scholar]
- Zhao, H.; Guo, S.; Zhao, H. Comprehensive assessment for battery energy storage systems based on fuzzy-MCDM considering risk preferences. Energy 2019, 168, 450–461. [Google Scholar] [CrossRef]
- Saabun, W.; Wtróbski, J.; Shekhovtsov, A. Are MCDA Methods Benchmarkable? A Comparative Study of Topsis, Vikor, Copras, and Promethee II Methods. Symmetry 2020, 12, 1549. [Google Scholar] [CrossRef]
- Shekhovtsov, A.; Kozlov, V.; Nosov, V.; Sałabun, W. Efficiency of Methods for Determining the Relevance of Criteria in Sustainable Transport Problems: A Comparative Case Study. Sustainability 2020, 12, 7915. [Google Scholar] [CrossRef]
- Athanassopoulos, A.; Gounaris, C. Assessing the technical and allocative efficiency of hospital operations in Greece and its resource allocation implications. Eur. J. Oper. Res. 2001, 133, 416–431. [Google Scholar] [CrossRef]
- Liu, M.; Li, S. Innovation efficiency evaluation of hi-tech development zones based on the three-stage DEA model. Manag. Rev. 2016, 28, 42–52, 155. [Google Scholar]
- Rezapour, A.; Azar, F.E.; Zadeh, N.Y.; Roumiani, Y.; Faradonbeh, S.B. Technical efficiency and resources allocation in university hospitals in Tehran, 2009–2012. Med J. Islamic Repub. Iran 2015, 29, 266. [Google Scholar]
- Nassiril, S.M.; Singh, S.; Ahuja, S. Assessing the technical efficiency and Returns-to-scale of wheat growers: Data development analysis application. J. Res. 2008, 45, 177–182. [Google Scholar]
- De Sousa, M.D.; Cribarineto, F.; Stosic, B. Explaining DEA Technical Efficiency Scores in an Outlier Corrected Environment: The case of Public Services in Brazilian Municipalities. Braz. Rev. Econom. 2005, 25, 287–313. [Google Scholar] [CrossRef]
- Xingang, Z.; Zhen, W. The technical efficiency of China’s wind power list enterprises: An estimation based on DEA method and micro-data. Renew. Energy 2019, 133, 470–479. [Google Scholar] [CrossRef]
- Badunenko, O.; Mozharovskyi, P. Statistical inference for the Russell measure of technical efficiency. J. Oper. Res. Soc. 2019, 71, 517–527. [Google Scholar] [CrossRef]
- Cook, W.D.; Seiford, L.M. Data envelopment analysis (DEA)—Thirty years on. Eur. J. Oper. Res. 2009, 192, 1–17. [Google Scholar] [CrossRef]
- Lotfi, F.H.; Jahanshahloo, G.R.; Soltanifar, M.; Ebrahimnejad, A.; Mansourzadeh, S.M. Relationship between MOLP and DEA based on output-orientated CCR dual model. Expert Syst. Appl. 2010, 37, 4331–4336. [Google Scholar] [CrossRef]
- Hatami-Marbini, A.; Tavana, M.; Saati, S.; Agrell, P.J. Positive and normative use of fuzzy DEA-BCC models: A critical view on NATO enlargement. Int. Trans. Oper. Res. 2012, 20, 411–433. [Google Scholar] [CrossRef]
- Wei, C.K.; Chen, L.C.; Li, R.K.; Tsai, C.H. Exploration of efficiency underestimation of CCR model: Based on medical sectors with DEA-R model. Expert Syst. Appl. 2011, 38, 3155–3160. [Google Scholar] [CrossRef]
- Lee, L.T.S. On efficiency of integrative strategies among companies in US high-tech industry. Int. J. Manag. Enterp. Dev. 2010, 9, 311. [Google Scholar] [CrossRef]
- Bhat, V.N. Productivity in the retail industry: Does insider ownership of shares matter? Appl. Financ. Econ. Lett. 2008, 4, 121–125. [Google Scholar] [CrossRef]
- He, Y.; Chiu, Y.H.; Zhang, B. The impact of corporate governance on state-owned and non-state-owned firms efficiency in China. N. Am. J. Econ. Financ. 2015, 33, 252–277. [Google Scholar] [CrossRef]
- Chen, Y.; Zhu, J. DEA Models for Identifying Critical Performance Measures. Ann. Oper. Res. 2003, 124, 225–244. [Google Scholar] [CrossRef]
- Jing, Q. Research on Financial Performance Evaluation of Media Industry Listed Companies Based on AHP-DEA. Stat. Inf. Forum 2017, 32, 92–100. [Google Scholar]

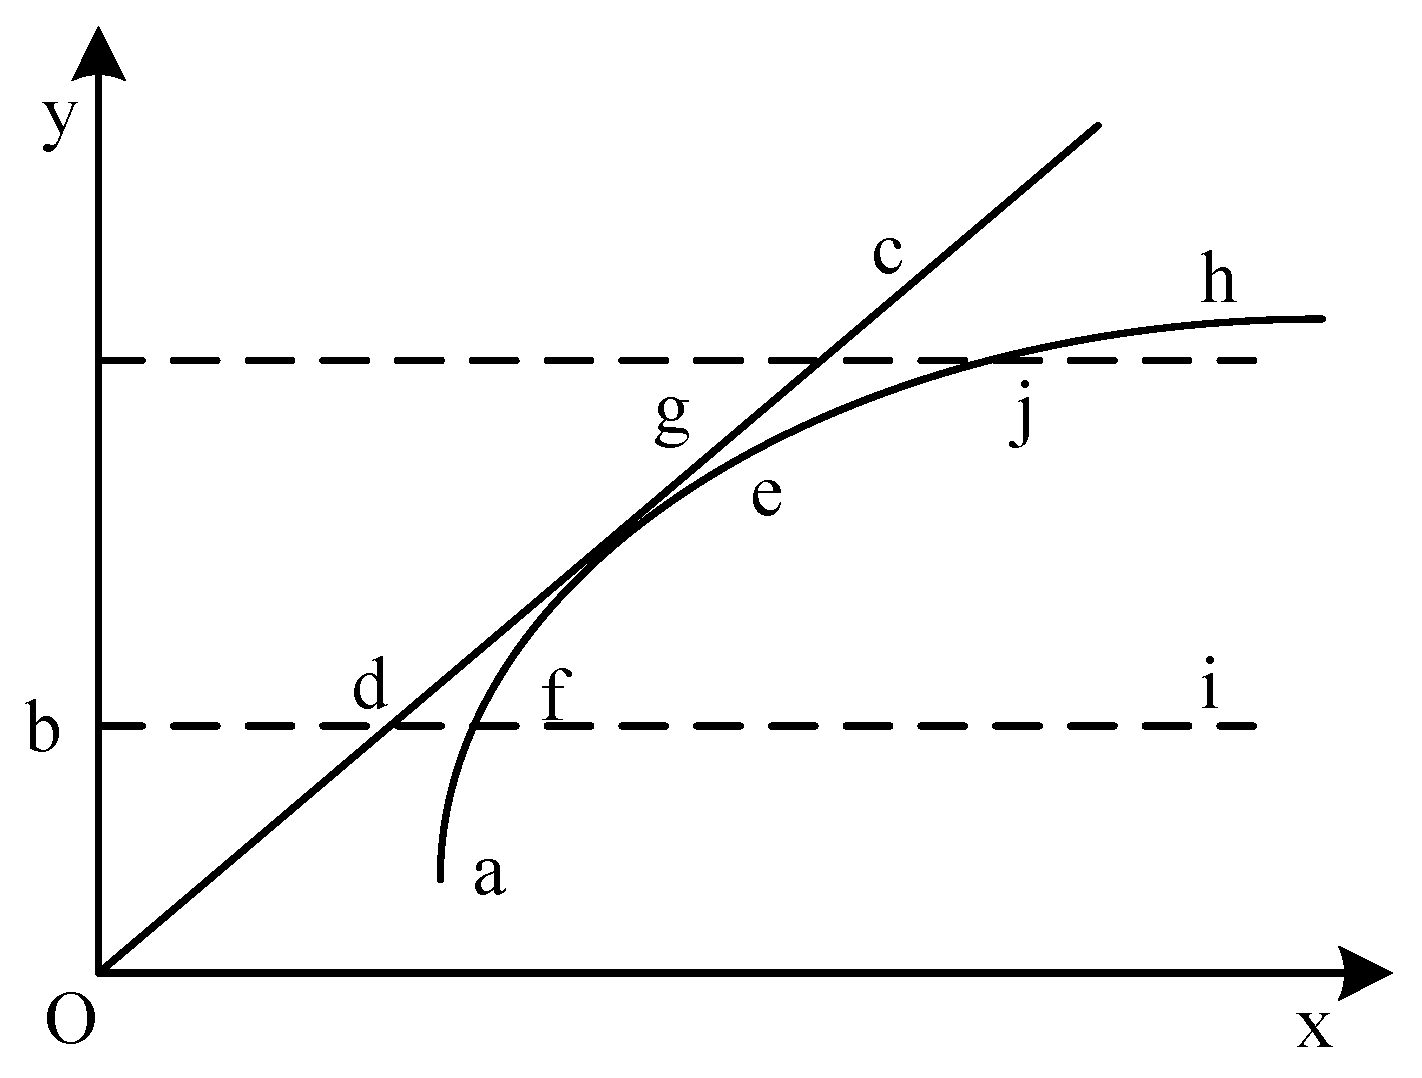


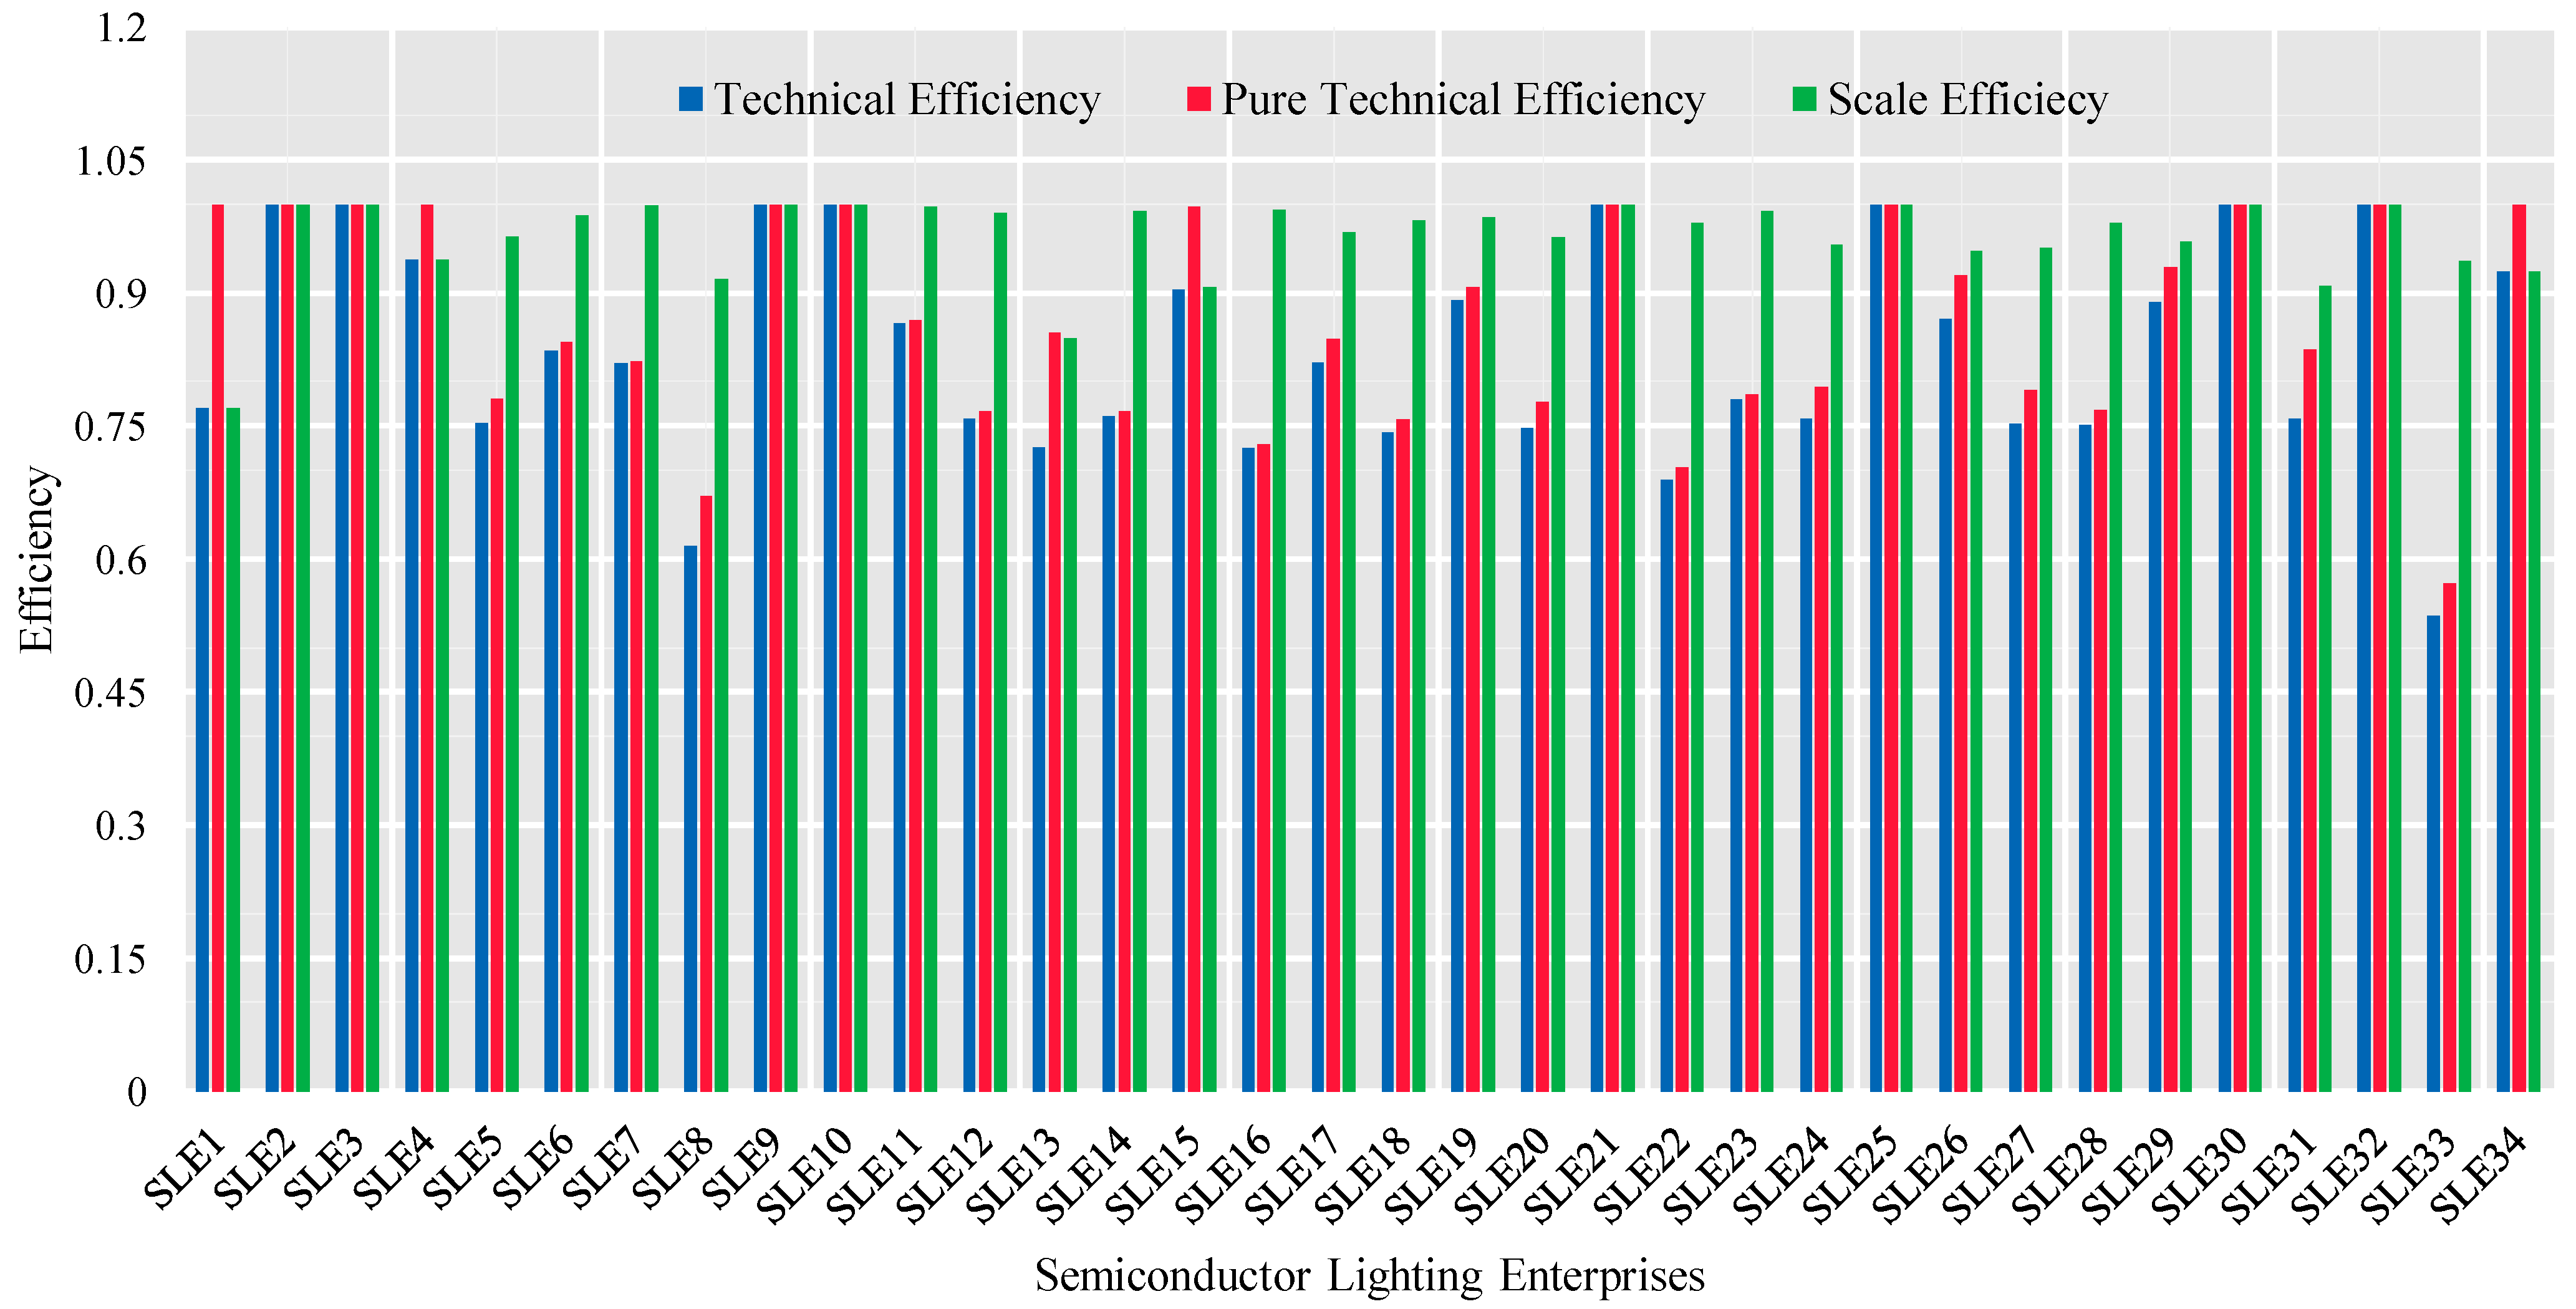

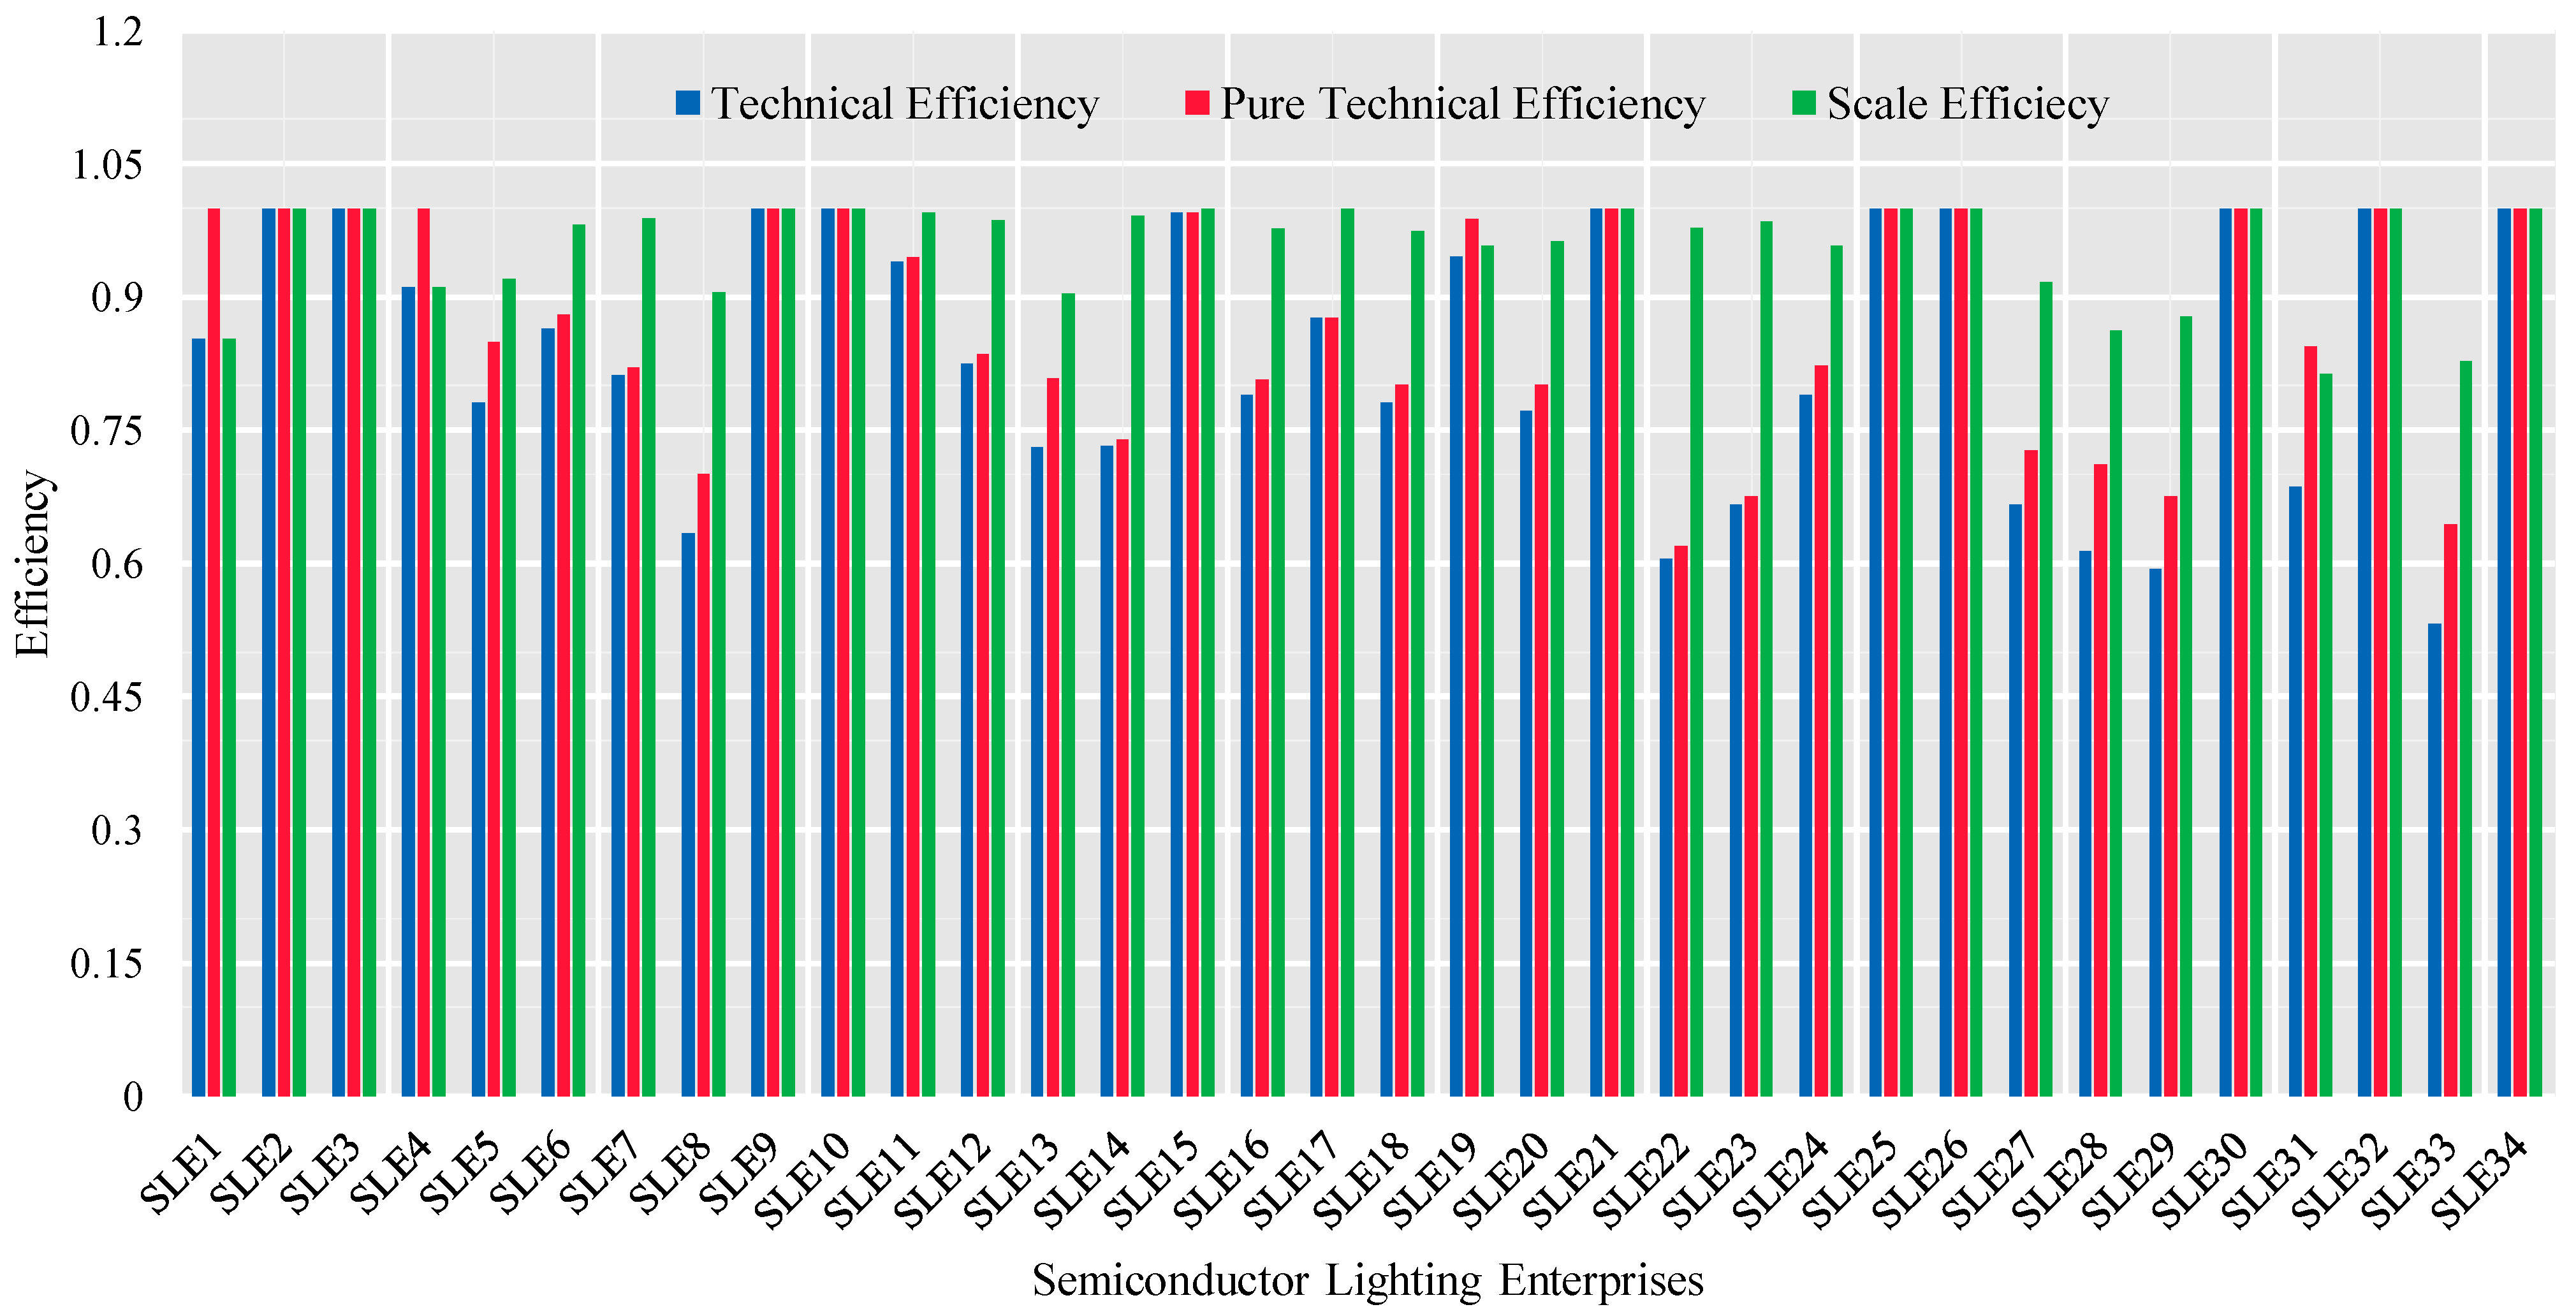
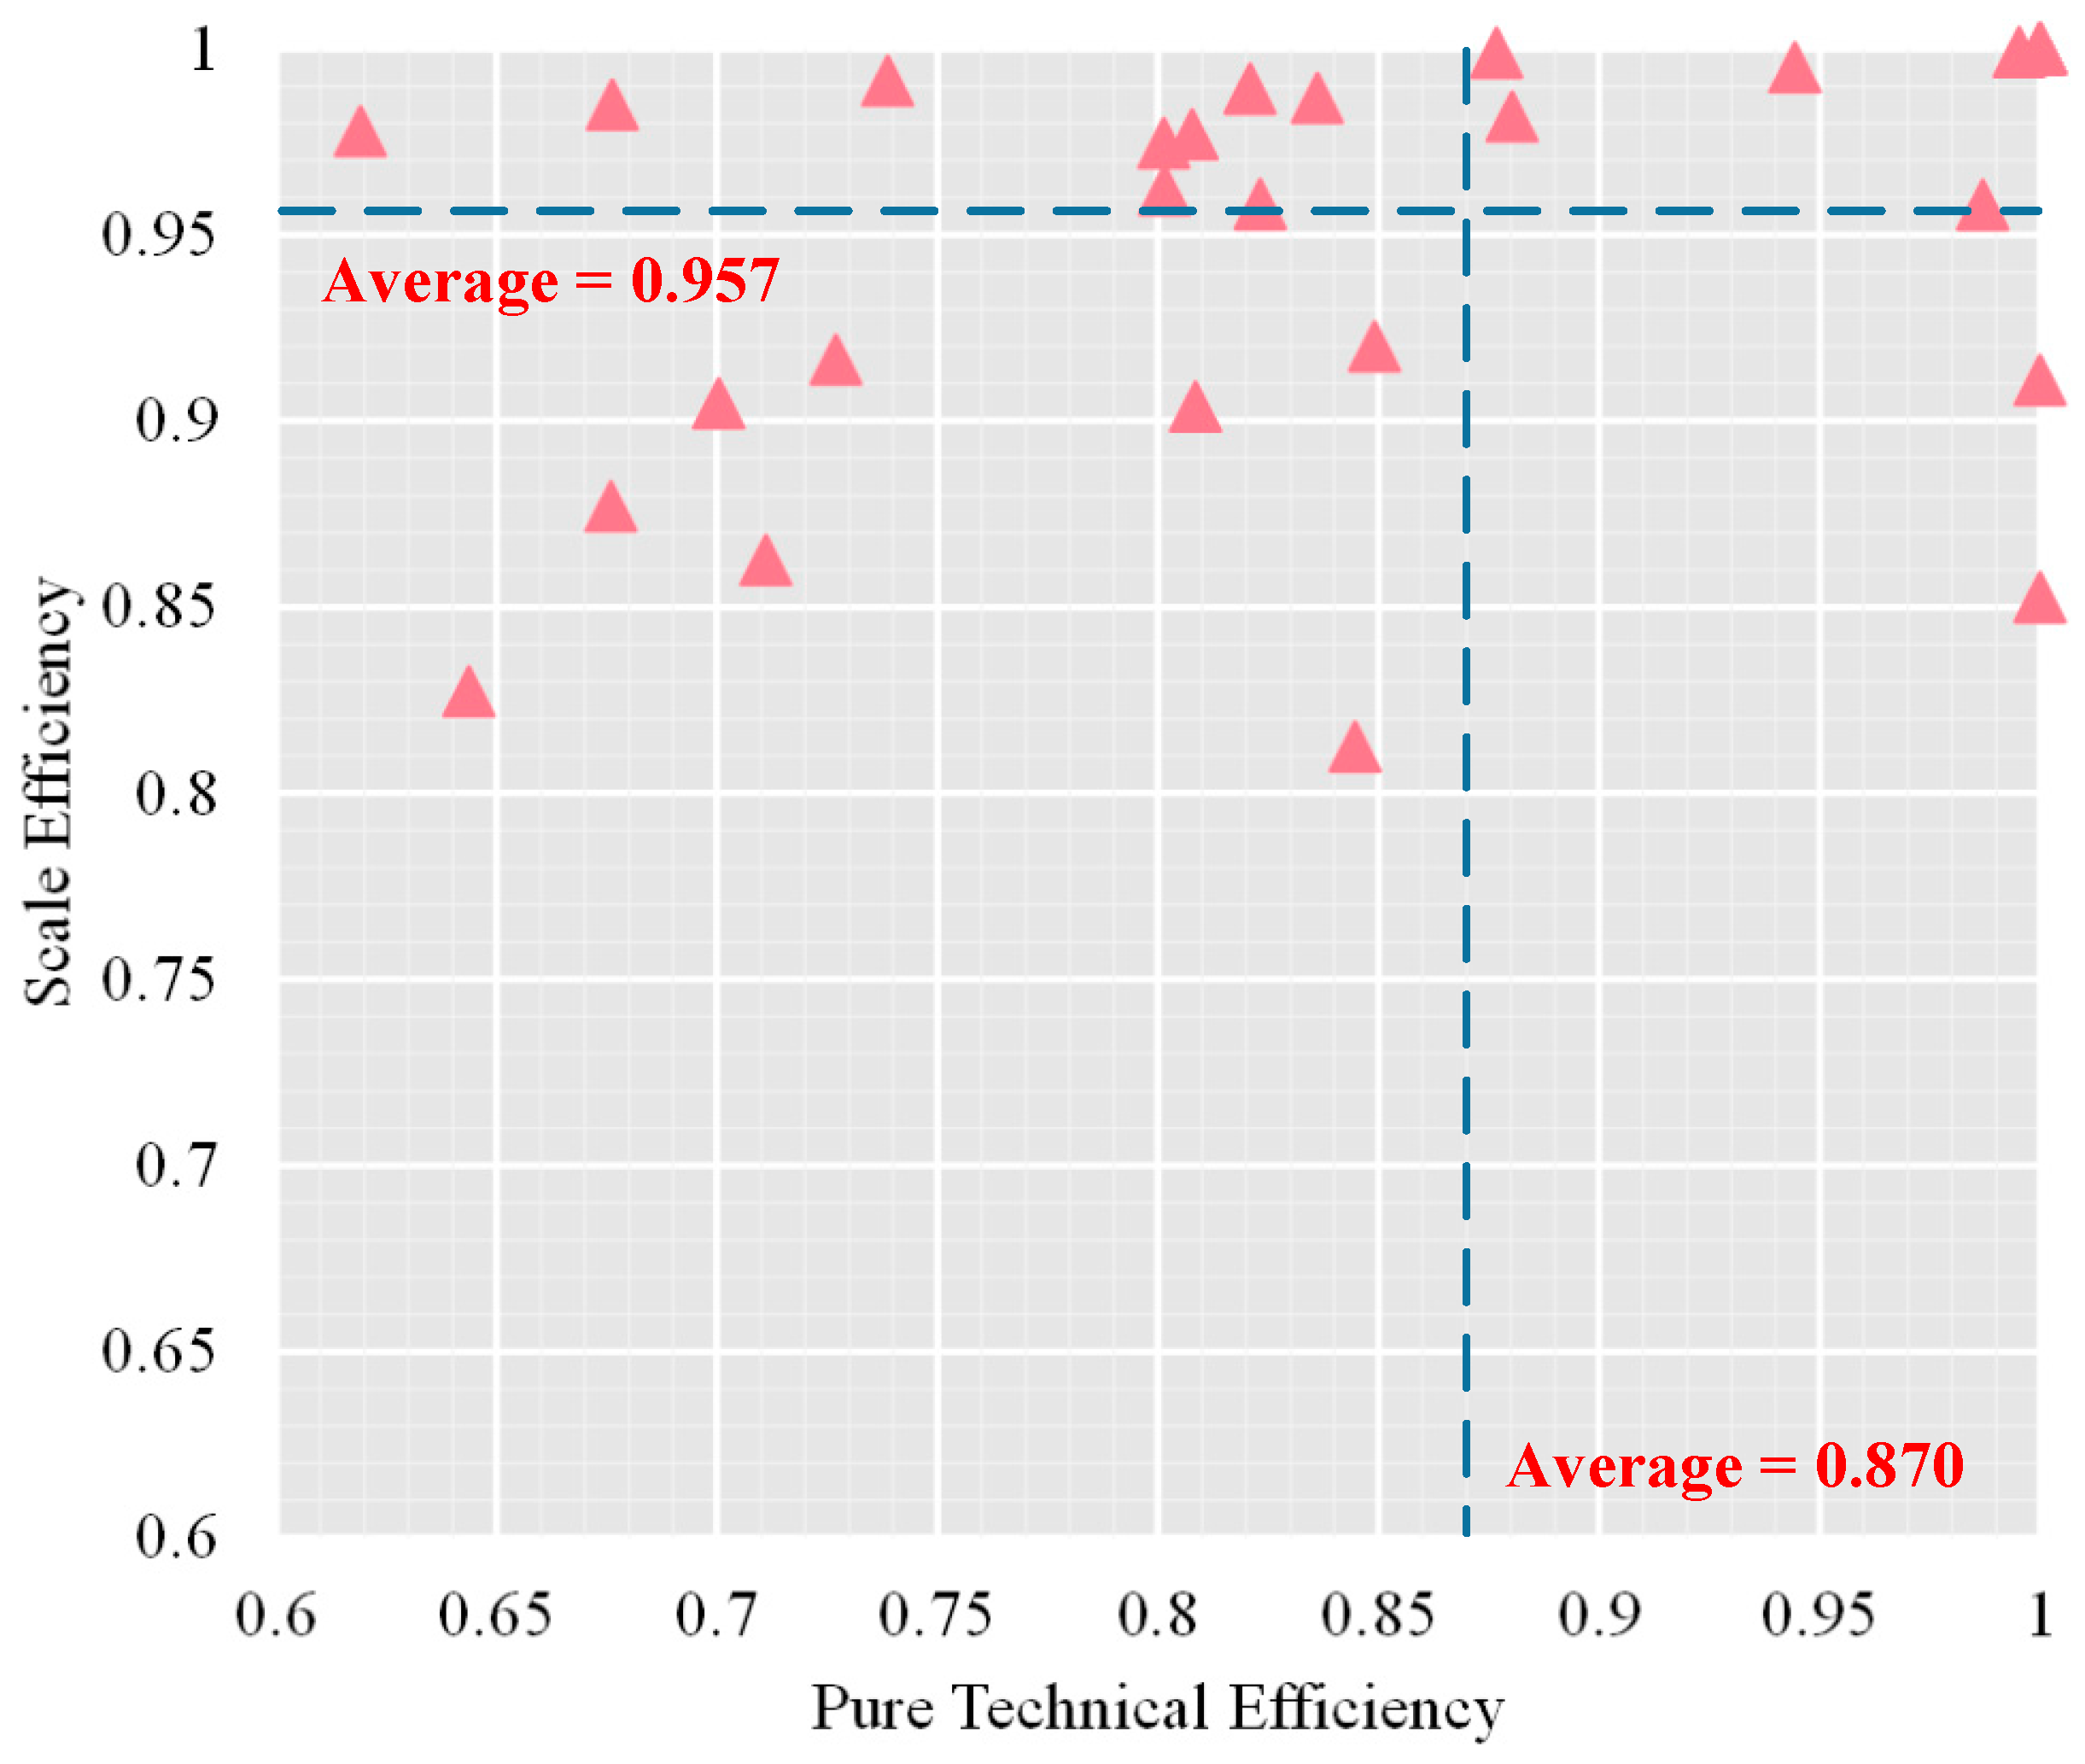
| Reference | Application Scenario | Model | Contributions and Conclusions |
|---|---|---|---|
| Neves et al. [22] | Energy efficiency | Soft Systems methodology | Helps clearly define the decision problem context and the main actors involved. |
| Li et al. [23] | Transit operator efficiency | Fuzzy-AHP; DEA model | Better captures inherent preferences information over input and output indicators. |
| Narendra and Jignesh [24] | Technical efficiency of Indian refineries | DEA model; Tobit regression | Reveals the efficiency of four refineries and suggests four significant factors as explaining variations in refinery efficiency. |
| Peter et al. [25] | Efficiency of Islamic banks | TOPSIS; neural networks | Variables related to both country origin and cost structure have a prominent impact on efficiency. |
| Su et al. [26] | Efficiency of scientific research | Nonradial Super Efficiency Data Envelopment Analysis model | Manages nonsolution problems and integer decision variable constraints. |
| Neykov et al. [27] | Economic efficiency of forest enterprises | DEA method | Outlines the major factors affecting the differences in efficiency scores. |
| Variables | Expansion |
|---|---|
| The inputs of the -th DMU | |
| The outputs of the -th DMU | |
| The remaining variable | |
| The slack variable |
| Parameters | Expansion |
|---|---|
| The number of DMUs in the market | |
| The number of inputs | |
| The number of outputs | |
| The weight coefficient vector of the inputs | |
| The weight coefficient vector of the outputs | |
| The optimal weight ratio of the -th DMU | |
| The technical efficiency of the -th DMU |
| Variables. | Minimum | Maximum | Mean | Standard Deviation |
|---|---|---|---|---|
| Operating costs (million CNY) | 90.50 | 6452.00 | 1826.38 | 1574.45 |
| Research & Development expense (million CNY) | 8.80 | 305.80 | 92.59 | 73.59 |
| General & Administrative expense (million CNY) | 19.90 | 647.50 | 143.12 | 142.18 |
| Net value of fixed assets (million CNY) | 45.47 | 8218.60 | 1175.55 | 1757.24 |
| Revenue (million CNY) | 177.20 | 8394.00 | 2584.70 | 2302.81 |
| Return on total assets ratio (%) | −5.04 | 18.14 | 8.04 | 5.03 |
| Variables | Minimum | Maximum | Mean | Standard Deviation |
|---|---|---|---|---|
| Operating costs (million CNY) | 109.00 | 13,280.00 | 2169.11 | 2422.79 |
| Research & Development expense (million CNY) | 16.67 | 692.10 | 119.06 | 124.59 |
| General & Administrative expense (million CNY) | 23.73 | 730.10 | 174.06 | 172.04 |
| Net value of fixed assets (million CNY) | 62.53 | 8911.94 | 1236.39 | 1926.70 |
| Revenue (million CNY) | 228.20 | 23,445.00 | 3652.62 | 4846.38 |
| Return on total assets ratio (%) | −42.23 | 17.22 | 2.20 | 14.33 |
| Variables. | Minimum | Maximum | Mean | Standard Deviation |
|---|---|---|---|---|
| Operating costs (million CNY) | 111.70 | 13,210.00 | 2227.27 | 2509.62 |
| Research & Development expense (million CNY) | 25.02 | 481.00 | 118.12 | 102.51 |
| General & Administrative expense (million CNY) | 35.87 | 936.30 | 183.38 | 183.67 |
| Net value of fixed assets (million CNY) | 48.40 | 9265.00 | 1277.33 | 1948.65 |
| Revenue (million CNY) | 321.40 | 18,970.00 | 3105.94 | 3576.51 |
| Return on total assets ratio (%) | −49.56 | 16.77 | 2.37 | 12.05 |
Publisher’s Note: MDPI stays neutral with regard to jurisdictional claims in published maps and institutional affiliations. |
© 2021 by the authors. Licensee MDPI, Basel, Switzerland. This article is an open access article distributed under the terms and conditions of the Creative Commons Attribution (CC BY) license (https://creativecommons.org/licenses/by/4.0/).
Share and Cite
Wang, K.; Zhang, Y.; Lei, L.; Qiu, S. Evaluation on the Efficiency of LED Energy Enterprises in China by Employing the DEA Model. Mathematics 2021, 9, 2356. https://doi.org/10.3390/math9192356
Wang K, Zhang Y, Lei L, Qiu S. Evaluation on the Efficiency of LED Energy Enterprises in China by Employing the DEA Model. Mathematics. 2021; 9(19):2356. https://doi.org/10.3390/math9192356
Chicago/Turabian StyleWang, Kan, Yunpeng Zhang, Li Lei, and Shuai Qiu. 2021. "Evaluation on the Efficiency of LED Energy Enterprises in China by Employing the DEA Model" Mathematics 9, no. 19: 2356. https://doi.org/10.3390/math9192356
APA StyleWang, K., Zhang, Y., Lei, L., & Qiu, S. (2021). Evaluation on the Efficiency of LED Energy Enterprises in China by Employing the DEA Model. Mathematics, 9(19), 2356. https://doi.org/10.3390/math9192356


