Article

Evaluation on the Efficiency of LED Energy Enterprises in China by Employing the DEA Model

1
School of Management and Economics, Beijing Institute of Technology, Beijing 100081, China
2
Center for Energy and Environmental Policy Research, Beijing Institute of Technology, Beijing 100081, China
3
Beijing Key Lab of Energy Economics and Environmental Management, Beijing 100081, China
4
National Energy Conservation Center, Beijing 100045, China
5
China Solid State Lighting Alliance, Beijing 100083, China
*
Author to whom correspondence should be addressed.
Mathematics 2021, 9(19), 2356; https://doi.org/10.3390/math9192356
Submission received: 4 August 2021 / Revised: 28 August 2021 / Accepted: 2 September 2021 / Published: 23 September 2021

Abstract

:
As an essential part of strategic emerging industry, the light emitting diode (LED) industry plays an important role in the development of a national economy as well as being a technology that is pivotal to energy saving and environmental protection. Due to the late start of China’s LED energy industry, there are few related studies, especially on the efficiency of China’s LED energy enterprises. The data envelopment analysis (DEA) method is widely used in efficiency measurement for its significant advantages in simplifying calculations and processing multiple input–output indicators. This study selected 34 Chinese LED energy enterprises, sorted out the various input and output indicators of each enterprise from 2017 to 2019, and calculated the technical efficiency, pure technical efficiency, and scale efficiency of each enterprise based on the CCR and BCC models of the DEA method. The result shows that, from 2017 to 2019, the overall technical efficiency of China’s LED energy enterprises continued to improve and that this was due to the LED energy enterprises’ emphasis on technology development. However, in terms of production scale, there is still a big gap between each enterprise and the optimal scale. On the one hand, studying the technical efficiency of China’s LED energy enterprises can measure whether an enterprise has reached the optimal input–output ratio; on the other hand, it can provide references for related stakeholders such as investment entities, regulatory agencies, and policy-making departments.

1. Introduction

Natural resources are important factors of production in the process of global modernization. Due to the non-renewability of fossil energy, mankind’s excessive exploitation methods, and unreasonable utilization methods, traditional fossil energy sources such as oil and coal are currently being exhausted [1]. According to data from the National Bureau of Statistics, since the early 1990s, China has become a net importer of oil, and China’s share in world oil consumption and world oil trade has increased significantly. In terms of total energy consumption, China’s total energy consumption increased from 1.47 billion tons of standard coal in 2000 to 4.86 billion tons of standard coal in 2019, with an average compound annual growth rate of 6.5%, which is a relatively fast growth rate [2]. The high-consumption energy development mode has brought serious resource scarcity and deterioration of the ecology and environment [3]. To deal with such problems, many countries have adjusted their energy development strategies and vigorously developed renewable energy. Energy saving, emission reduction, low carbon use, and environmental protection have become the theme of today’s economic and social activities. The LED industry is one of the strategic emerging industries that best meets China’s developmental needs and is one of the best prospects for developing capacity in the high-tech world of the 21st century, which is also one of the important paths that China must follow to achieve green and low-carbon development [4]. According to the China Solid State Lighting Alliance (CSA) report, China’s domestic LED lighting products saved 279 billion kWh of electricity and reduced carbon emissions by 220 million tons in 2018. Compared with 2017, the scale of electricity savings and carbon emissions reduction increased by 40.7% and 23.6%, respectively [5]. It is not difficult to see that the development of the LED industry has made important contributions to China’s energy conservation and emissions reduction.
Based on the above analysis, this paper selected 34 listed LED energy enterprises in China. By collecting various input and output data of 34 semiconductor lighting enterprises (SLEs), a DEA theory-based technical efficiency measurement model of China’s LED energy enterprises was constructed. The input–output efficiency of each enterprise was analyzed from a micro level, and corresponding policy recommendations from the perspective of the enterprise itself and the government are put forward in this paper. The relevant empirical results and conclusions can provide reference for the healthy and sustainable development of China’s LED industry, which can also guide strategy formulation by relevant decision-makers.
The subsequent sections of this investigation are structured as below. A literature review is presented in Section 2. Section 3 introduces the basic theory of technical efficiency and the DEA method. Section 4 elaborates the input and output variables for the DEA model and identifies the data resources of the 34 listed LED energy enterprises in China during 2017–2019. The results of an efficiency evaluation of China’s LED energy enterprises based on the CCR and BCC model are presented in Section 5. Section 6 concludes the empirical analysis and provides related suggestions.

2. Literature Review

2.1. LED-Related Issues

To date, some scholars have already carried out related research on LED-related issues. The research directions mainly include the following aspects:
  • Technology research and development
Zhang et al. [6] transferred multi-layer graphene (MLG) films onto a p-GaN layer as transparent conductive electrodes in InGaN green light-emitting diodes (MLG-GLEDs) and investigated their optoelectronic properties. Zhang et al. [7] fabricated ordered ZnO nanorods-based heterojunction light-emitting diodes (LEDs) by adopting few-layer graphene as a current-spreading layer, which was proved feasible and superior. Li et al. [8] fabricated a flexible LED array device made of Si-Microwires-ZnO-Nanofilm with the advantages of flexibility, stability, light weight, and energy savings. Abramov et al. [9] proposed a method for measuring the transient characteristics at the switching-on moment. The method and standardized definition of the concept filled the gap in this field. Cheng et al. [10] proposed a novel single-stage, high-power-factor LED driver for street-lighting applications. The device can significantly increase the circuit efficiency, high power factor, and low levels of input current harmonics.
  • Industry development status
Ye et al. [11] analyzed the advantages of the LED industry in terms of industrial structure, market layout, and policy-driving by comparing China’s LED industry and photovoltaic industry. Based on this, they put forward the problems and shortcomings of China’s LED industry under the background of “double reverse”, which provides direction and ideas for the future development of China’s LED industry. Guo et al. [12] combed the research on the development of China’s lighting industry over the past two decades and evaluated the implementation effects of the “Green Lighting Plan” through a comprehensive evaluation method. Wu and Wang [13] put forward an innovation path and LED energy enterprise business mode covering five aspects: value chain, consumer needs-targeting, products and services, marketing strategy, and strategic direction. Wang and Mao [14] analyzed the spatial distribution, spatial characteristics, and governance structure of the global semiconductor lighting industry technology chain and proposed an upgrade in the direction and requirements of China’s semiconductor lighting industry.
  • Policy
Li et al. [15] used the SWOT method to conduct an in-depth analysis of the development trend of China’s LED industry in recent years and found that there is still a large gap between China’s LED industry and the LED industries in developed countries. Based on this, they proposed a series of policies and measurements that the government could adopt. Ye and Li [16] analyzed the differences in LED industry policies between central and local governments and explored the relationship between policy differences and industrial development practices by policy measurement and content analysis methods. Wan et al. [17] introduced the development strategies of the LED industry in the United States, Japan, the European Union, South Korea, and Taiwan. The analysis concluded that the emission reduction in pollutants and the service life of lighting products should be strengthened under the guidance of the revitalization plan, which can achieve a win–win situation for social and economic benefits.
  • Patent
Luo and Yuan [18] constructed an analytical framework for measuring patent dispersion based on the dispersion index, primacy rule, and fractal dimension. The trend of patent decentralization and the policy implications of patent decentralization were also put forward. Chen et al. [19] proposed a patent analysis method for R&D management. The effectiveness of the method was proved by analyzing the cooperative behavior of semiconductor lighting companies, and their method can provide a valuable reference with which corporate decision-makers can formulate patent portfolios. Jia and Dong [20] conducted research on the status quo of patented technology in the semiconductor lighting industry. The research analyzed the problems in the patented technology of the semiconductor lighting industry in Shanxi Province and pointed out how to promote the sustainable development of the semiconductor lighting industry.
It can be seen that the current research on LED-related issues is mainly carried out from the perspectives of technology research and development, industry development status, policy, and patents. Since China’s LED industry started late, the depth and breadth of research on China’s LED industry are weaker than other traditional industries and strategic emerging industries. To our best knowledge, there has not been any research measuring the efficiency of China’s LED energy enterprises. The investigation to evaluate and rank the efficiency of LED energy enterprises in China can both fill the research gap and discover a pathway for the development of China’s LED energy enterprises.

2.2. Efficiency Measurement

Farrell first conducted a systematic study of efficiency theory in 1957 [21]. From the perspective of management and economics, efficiency is always expressed as the ratio of an organization’s outputs to inputs at a specific time. Table 1 shows the related research on efficiency measurement in different fields.
According to the existing references, the essence of efficiency evaluation is a multi-criteria decision analysis (MCDA) problem. The MCDA methods mainly include the best-worst method (BWM) [28], matter-element extension model (MEEM) [29], fuzzy-cumulative prospect theory (FCPT) [30], and DEA model. Sałabun et al. [31] compared the pros and cons of TOPSIS, VIKOR, COPRAS, and PROMETHEE II methods. Shekhovtsov et al. [32] compared the efficiency of TOPSIS, VIKOR, and COMET methods, along with their similarity coefficients.
Since the DEA method does not need to determine the weights and parameters of the indicators and can ignore the dimensions of the indicators, it has significant advantages in simplifying calculations and processing multiple input–output indicators. It is much more applicable to the efficiency measurement of semiconductor lighting enterprises proposed in this paper.

3. Basic Theory of Technical Efficiency and DEA Method

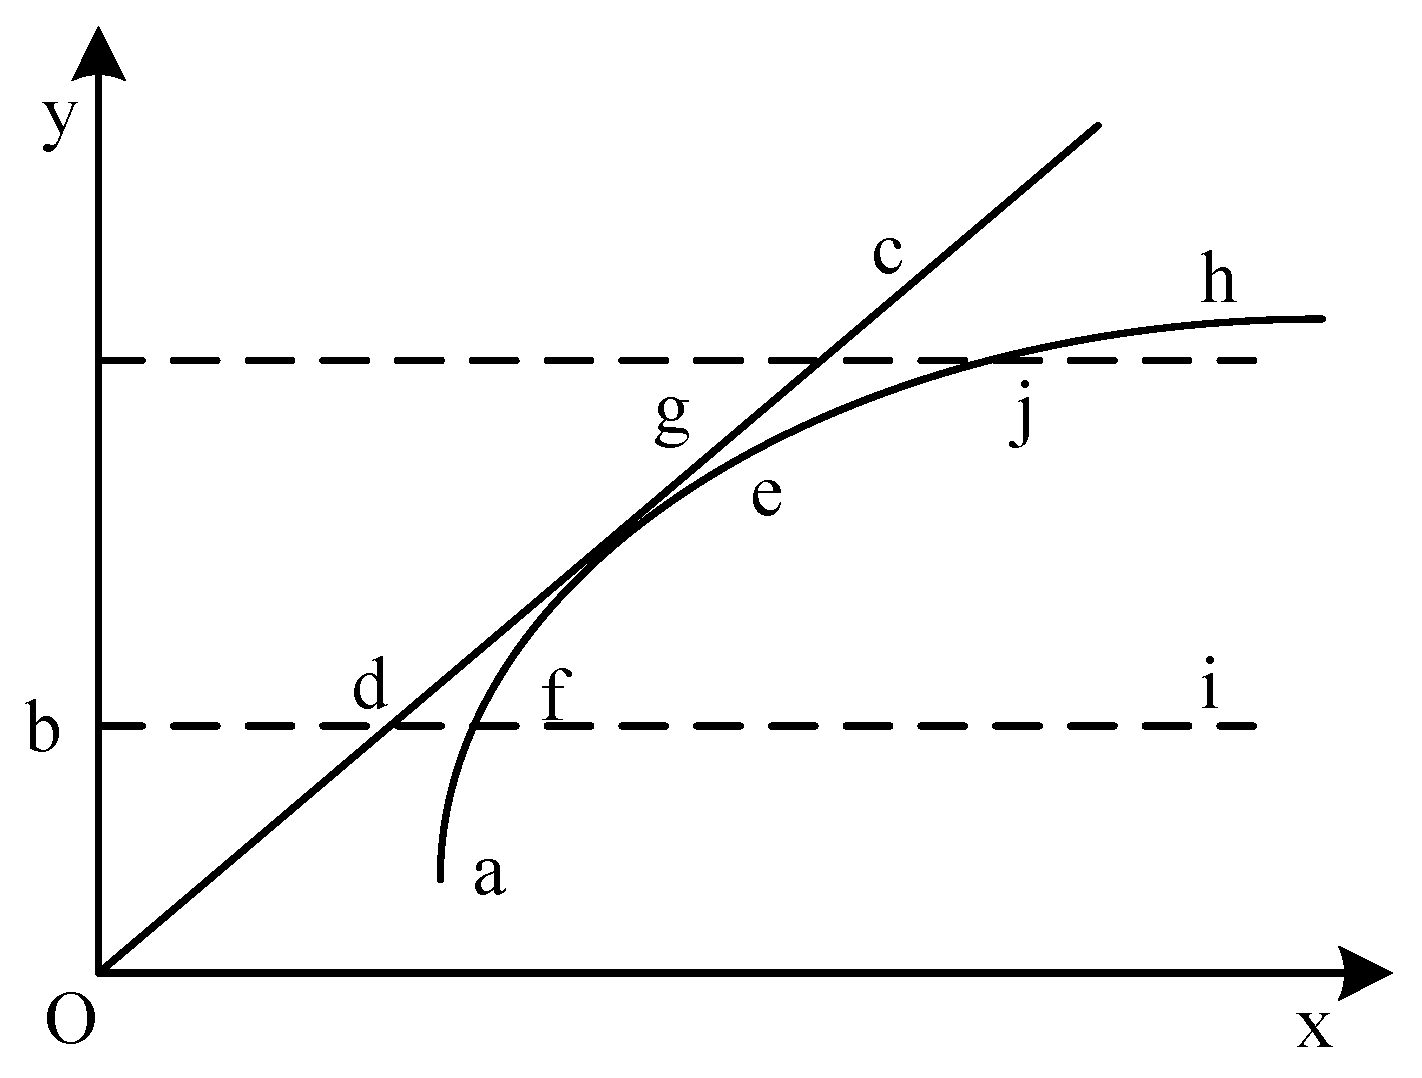
3.1. Technical Efficiency

Efficiency can be divided into technical efficiency and allocative efficiency [33]. The former is used to measure how to obtain the maximum outputs under certain inputs and is mainly used to characterize the input–output efficiency of the enterprise. The latter is used to measure how to optimize the enterprise’s inputs when the price of input factors is constant, and it mainly represents the efficiency of enterprise resource allocation [34].
As shown in Figure 1, the technical efficiency of an enterprise can usually be expressed as
T E = O Q / O P
The value of T E is usually between 0 and 1. When T E = 1 , it proves that the enterprise is fully and technically efficient.
Additionally, the allocative efficiency of an enterprise can also be expressed as
A E = O R / O Q
Therefore, the economic efficiency of an enterprise can be expressed as
E E = T E × A E = O Q O P × O R O Q = O R / O P
In other words, if you want to improve the technical efficiency of an enterprise, the input should be reduced to Q when the output is the same. Currently, the enterprise is technically effective, but the resource allocation of the enterprise is invalid. Only when moving to Q can it simultaneously meet the maximum technical efficiency and allocative efficiency of the enterprise.
This research was more inclined to study the enterprise’s input–output efficiency rather than the efficiency of resource allocation. Therefore, this section mainly introduces the relevant theories of technical efficiency. According to References [35,36], technical efficiency can be decomposed into pure technical efficiency and scale efficiency—of which, pure technical efficiency represents the distance between the enterprise and the production frontier when the returns-to-scale are variable, while the efficiency of scale measures the distance between the production frontier with constant returns-to-scale and the production frontier with variable returns-to-scale.
Assuming that the enterprise has only one input and one output and that the values are respectively x and y , when the returns-to-scale are constant, the production frontier is a straight line, which is expressed as O c in Figure 2. When the returns-to-scale are variable, the production frontier is a curve, which is expressed as a f e g h in Figure 2.
When the actual production of an enterprise is at i on the right side of the curve, the line segment d i represents the technically invalid part of the enterprise, so the technical efficiency can be expressed as
T E = b d / d i
According to the definition of pure technical efficiency, the line segment f i represents the technically invalid part of the enterprise under the condition of variable returns-to-scale, so pure technical efficiency can be expressed as
P T E = b f / b i
Similarly, scale efficiency can also be expressed as
S E = b d / b f
It is not difficult to find that T E = P T E × S E . In other words, the technical efficiency of an enterprise can be expressed as the product of pure technical efficiency and scale efficiency. This conclusion is not only applied to the technical efficiency research of enterprises with a single input and single output but also to the technical efficiency of enterprises with multiple inputs and outputs.
From the perspective of technical economy, the technical efficiency in the DEA model reflects whether the input–output efficiency of the enterprise has reached the optimal level. The pure technical efficiency is the efficiency brought by the technology and management, and it can reflect the management status and R&D capabilities of the enterprise. The scale efficiency refers to the difference between the existing scale and the optimal scale under the premise of a certain system and management level, and it is mainly influenced by the enterprise’s production scale.

3.2. DEA Method

Currently, there has been much research on the technical efficiency of enterprises, and many scholars use the DEA method to evaluate and analyze it [37,38,39]. The DEA method was first proposed by Charnes, Copper, and Rhodes in 1978 [40]. This method is based on the concept of relative efficiency and uses linear programming to systematically evaluate and analyze enterprises, sectors, or industries with multiple inputs and outputs. Each evaluation object is also called a decision-making unit (DMU).
The evaluation principle of DEA is shown in Figure 3. U 1 , U 2 , U 3 , U 4 respectively represent four DMUs; the inputs of each DMU are respectively X1 and X2, and the output of each DMU is Y . Connecting U 2 , U 3 , U 1 in sequence results in a vertical ray U 2 M from U 2 upwards and a horizontal ray U 1 N from U 1 to the right. The envelope M U 2 U 3 U 1 N is called the production frontier. When the position of a DMU is above the production frontier, the DEA of the DMU is said to be effective. On the contrary, being in other areas means that the DMU is non-DEA valid, or called DEA invalid.
From Figure 3, it is not difficult to find that U 1 , U 2 , U 3 are DEA valid, and the DMU at the upper right of the envelope U 4 is called non-DEA valid. This also means that for U 1 , U 2 , U 3 , when the existing two resource inputs are maintained, the corresponding output is Y . However, when the input of any one resource is reduced, to ensure that the total output remains unchanged, another resource expenditure needs to be increased. As shown in Figure 3, B and U 4 are on the same line, which means that when the input is B , it can reach the same output as U 4 . It also means that the DEA of U 4 is invalid. The DMU U 4 uses too many resources but cannot match the output effect. If we want to convert the DEA of U 4 to be effective, the input of the two resources X 1 , X 2 needs to be reduced under the condition of the same output.
The classic model of DEA mainly includes the CCR model and the BCC model [41,42]. The former was proposed by Charnes, Cooper, and Rhodes in 1978, which analyzes the inputs and outputs of each DMU on the basis of unchanged returns-to-scale. The latter was proposed by Banker, Charnes, and Cooper in 1984, which considers the change of returns-to-scale based on the CCR model. Each DMU can be comprehensively analyzed to obtain technical efficiency according to the CCR model, while the BCC model can further decompose the technical efficiency into pure technical efficiency and scale efficiency, so as to have a clearer understanding of DMUs.
(1) CCR model
Assuming that there are n DMUs in the market, each DMU has m inputs and s outputs. Thus, the inputs X j and outputs Y j of the j -th DMU can be expressed as
X j = ( x 1 j , x 2 j , , x m j ) T
Y j = ( y 1 j , y 2 j , , y s j ) T
Then the optimal weight ratio of the j -th DMU can be expressed as
h j = u T Y j v T X j
where u and v respectively represent the weight coefficient vector of the inputs and outputs.
Therefore, the optimal weight ratio can be calculated by Equation (10) under the condition of unchanged returns-to-scale:
m a x h 0 = u T Y 0 v T X 0 s . t . { h j = u T Y j v T X j 1 , j = 1 , 2 , , n u 0 , v 0
This equation is a fractional programming problem, and its objective function is the maximum input–output weighted ratio of the j 0 -th DMU. The Charnes–Cooper transformation method can be used to convert the nonlinear programming problem into a linear programming problem, which greatly shortens the calculation time and makes it more convenient.
Supposing t = 1 v T X 0 , ω = t v , μ = t u , Equation (10) can be converted into Equation (11):
m a x h 0 = u T Y 0 s . t . { ω T X j u T Y j 0 , j = 1 , 2 , , n ω T X 0 = 1 ω 0 , μ 0
When solving linear programming problems, dual theory is often used to transform the linear programming problem into an equivalent envelope form of the problem. The dual formula is shown in Equation (12):
m i n θ s . t . { j = 1 n X j λ j + s = θ X 0 j = 1 n Y j λ j s + = Y 0 λ j 0 , j = 1 , 2 , , n ; s + 0 , s 0
where s+ and s respectively stand for the remaining variable and slack variable, and θ represents the technical efficiency of the j 0 -th DMU. θ = 1 , s + = s = 0 means that the DMU is DEA valid and that the DMU is at the production frontier. θ = 1 , s + 0 or s 0 means that the DMU is DEA weakly valid, while θ < 1 means that the DMU is DEA invalid.
(2) BCC model
Different from the CCR model, the BCC model is utilized to evaluate technical effectiveness considering the changed returns-to-scale. The main improvement lies in the addition of constraint j = 1 n λ j = 1 . The model is transformed into
m i n θ s . t . { j = 1 n X j λ j θ X 0 j = 1 n Y j λ j Y 0 λ j 0 , j = 1 , 2 , , n j = 1 n λ j = 1
Expansions of the model’s decision variables and parameters are listed in Table 2 and Table 3, respectively.

4. Variables Selection and Data Sources

4.1. The Input and Output Variables of DEA Method Based on CCR and BCC Model

Due to the late start of China’s LED industry, there are few research studies on the efficiency of Chinese LED energy enterprises. Therefore, the selection of efficiency evaluation indicators in this paper mainly refers to the indicators adopted from other industries, which are listed in Figure 4 [43,44,45,46,47,48].
(1) Operating costs
Operating costs mainly include the actual costs incurred by the enterprise’s main business activities and other business activities. The former includes the cost of the enterprise’s external sales of goods and labor. The latter mainly includes the depreciation of leased fixed assets, amortization of leased intangible assets, and cost of leased packaging.
(2) Research & Development expense
Research & Development expense includes the salary of R&D personnel and the cost of technological innovation, which can reflect the enterprise’s emphasis on the quality of products. As part of strategic emerging industries, the LED industry should pay more attention to investment and expense in technology research and development.
(3) General & Administrative expense
General & Administrative expenses refer to the various expenses incurred by the administrative department of an enterprise to organize and manage production and operation activities. It mainly includes enterprise budget, labor union budget, unemployed insurance premiums, labor insurance premiums, board fees, hiring intermediary agency fees, consulting fees, litigation fees, office expenses, travel expenses, postal and telecommunications expenses, greening expenses, management staff salaries, and welfare expenses, etc.
(4) Net value of fixed assets
The net value of fixed assets refers to the net value of the original value of fixed assets minus depreciation, which can reflect the amount of funds occupied by the enterprise on fixed assets.
(5) Revenue
Revenue refers to the total inflow of economic benefits formed by an enterprise in its daily business operations, such as selling commodities, providing labor services, and transferring asset use rights. It is mainly divided into main business income and other business income.
(6) Return on total assets ratio
Return on total assets ratio is based on the return on investment to analyze the profitability of an enterprise. It is the ratio between the return on investment and the total investment. The return on investment of an enterprise refers to the sum of the profit before the payment of interest and income tax.

4.2. Data Resources

To better characterize the overall technical efficiency level of the LED industry, this research selected the corresponding variables of China’s listed LED energy enterprises from 2017 to 2019 for technical efficiency analysis.
(1) To date, there are more than 4000 LED energy enterprises in China, but most of them are small in scale and possess a low market share. It is difficult to collect the corresponding input and output variables for unlisted LED energy enterprises. Therefore, only 34 listed LED energy enterprises were selected for analysis.
(2) The input and output variables were collected according to the annual reports and financial reports of listed companies. The descriptive statistics of the selected variables for 34 listed LED energy enterprises in 2017, 2018, and 2019 are indicated in Table 4, Table 5 and Table 6. The elaborated variables are shown in Table A1, Table A2 and Table A3 in Appendix A.

5. Empirical Analysis

According to the basic theory of the CCR and BCC model, Max DEA 8 software was used to calculate technical efficiency, pure technical efficiency, and scale efficiency.

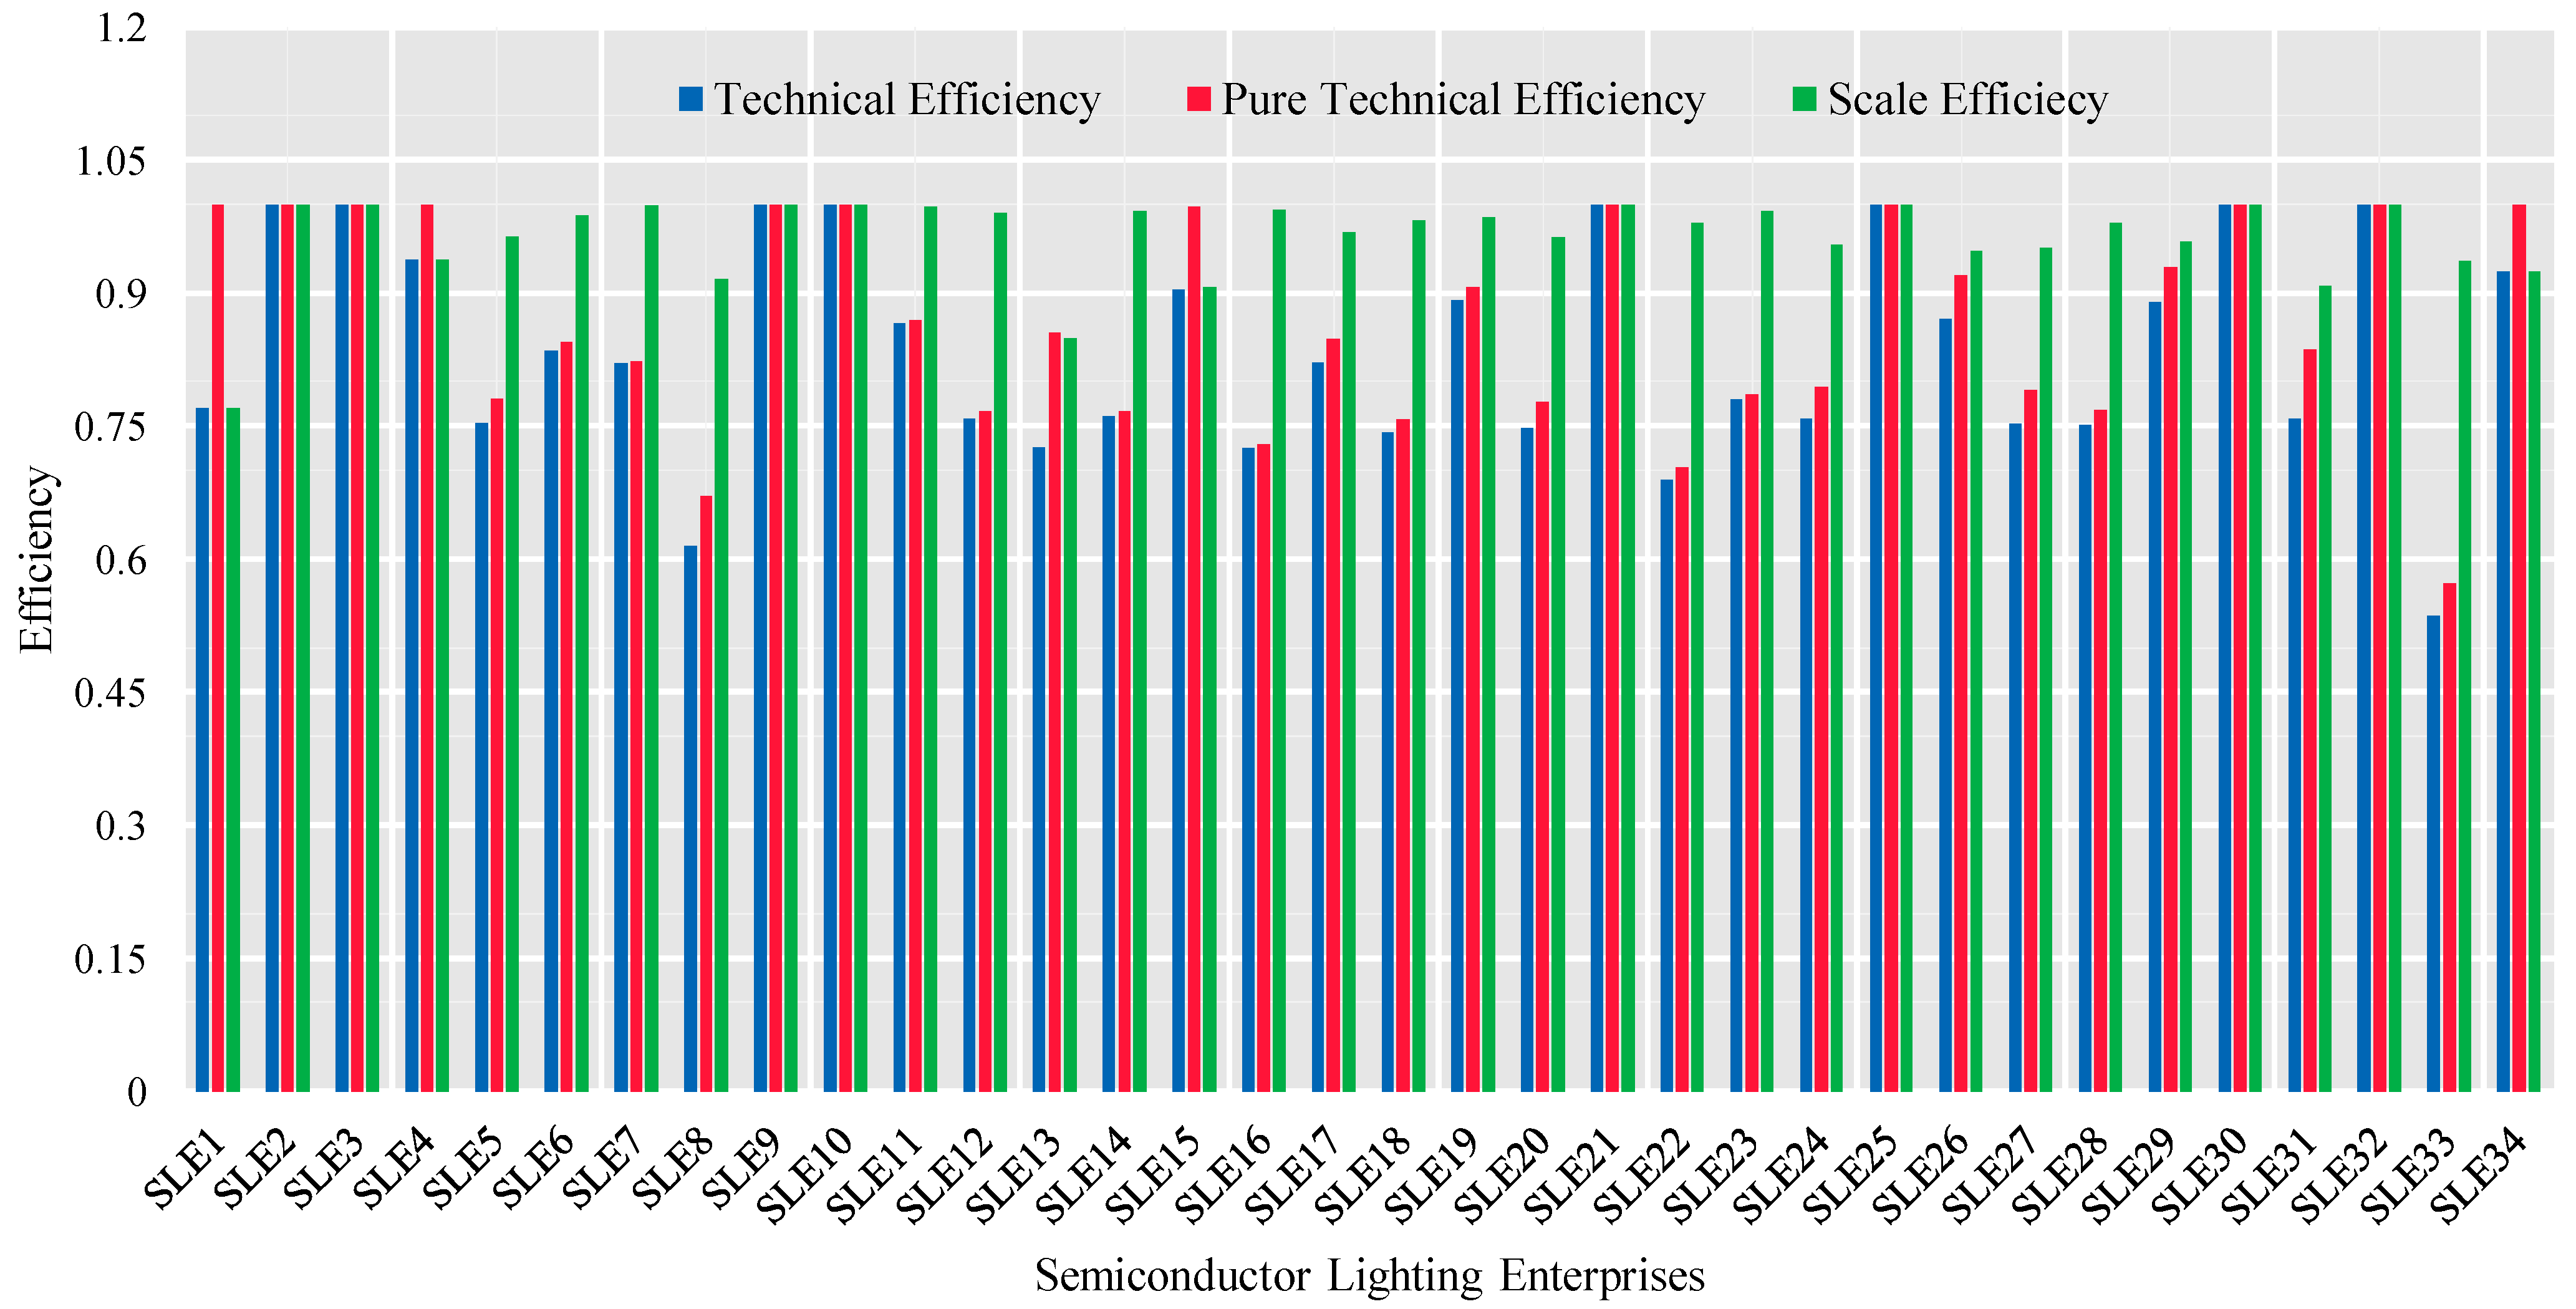
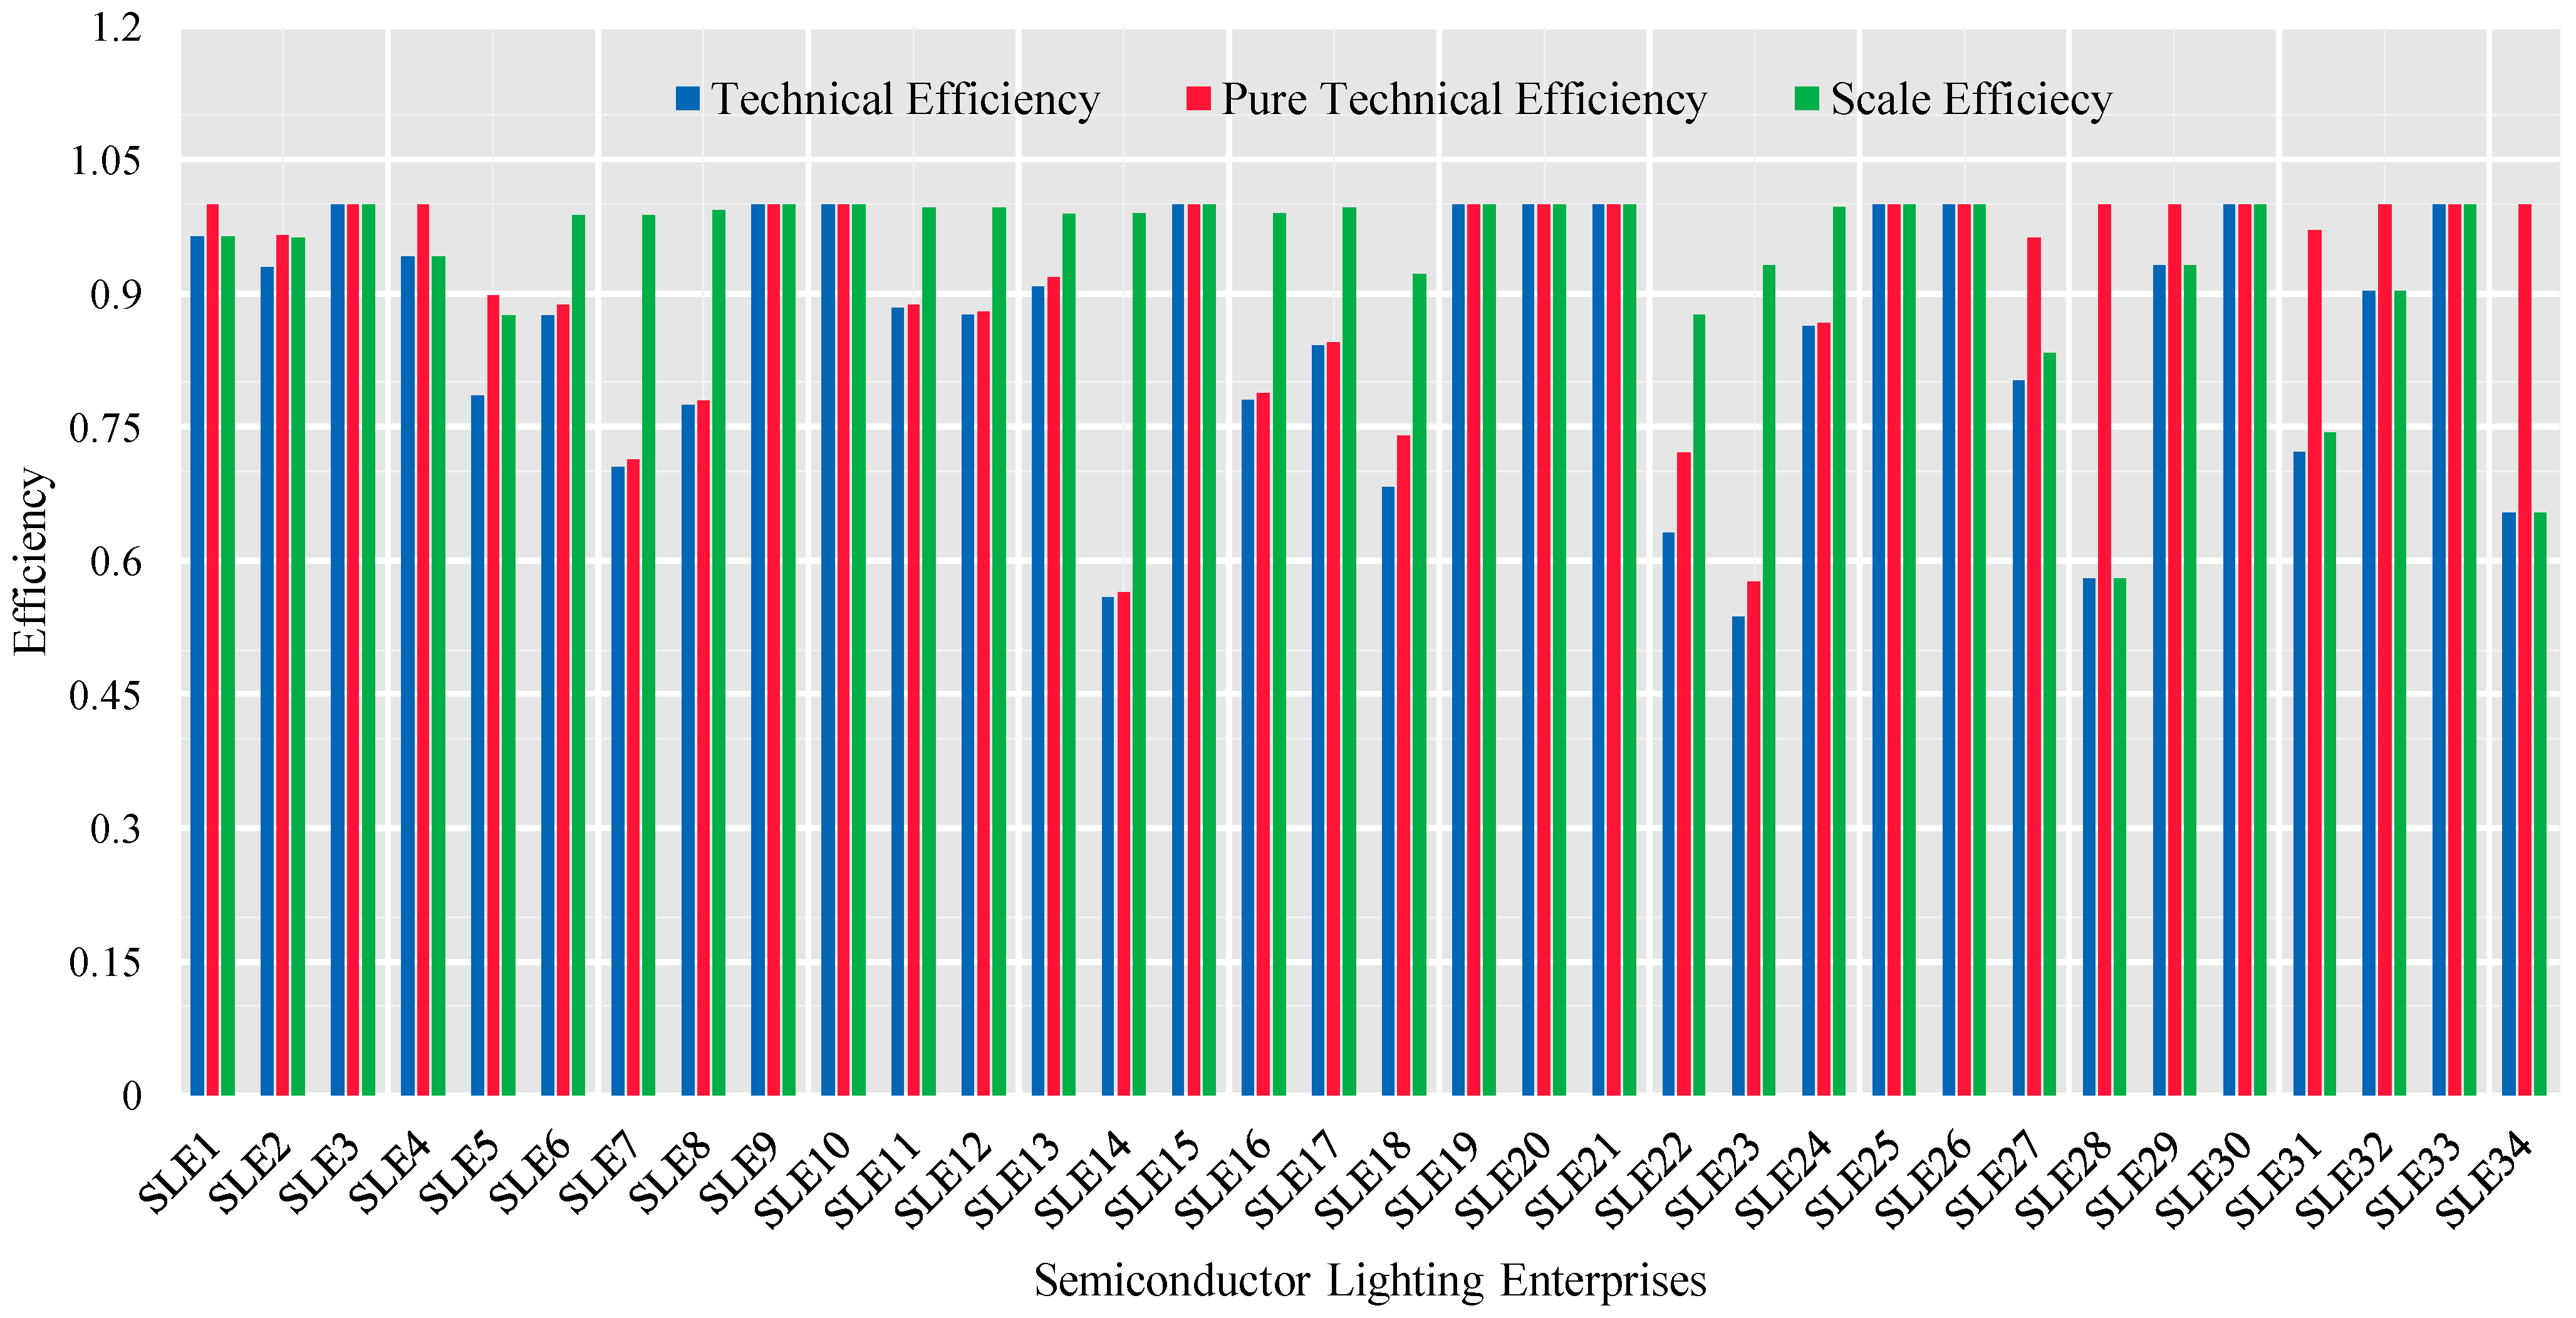
5.1. Analysis of Technical Efficiency, Pure Technical Efficiency, and Scale Efficiency of China’s LED Energy Enterprises in 2017

The comprehensive technical efficiency evaluation results of 34 Chinese LED energy enterprises in 2017 are shown in Figure 5 and Table A4 in Appendix B. As shown in Figure 5, the technical efficiency value of eight LED energy enterprises was 1 in 2017, which means that the eight LED energy enterprises reached optimal input–output under the condition of constant production factors. The remaining 26 companies failed to achieve the optimal input–output, and SLE33’s input–output was the lowest, only 0.536. According to the calculated results, the average technical efficiency value of these 34 LED energy enterprises was 0.835, and 19 enterprises including SLE1, SLE7, and SLE8 did not reach the average level.
Specifically, in terms of the pure technical efficiency as showed in Figure 6, the value for 11 enterprises was 1, such as SLE1, SLE2, and SLE5, which also shows that these 11 enterprises reached the best level of management systems and technological capabilities, while the management level and technological innovation of the remaining 23 companies still need to be strengthened. R&D efforts and R&D investment in these enterprises need to be increased. According to the calculated results, the average scale efficiency value of 34 LED energy enterprises was 0.867, and 14 companies, such as SLE6, SLE7, and SLE8, did not reach the average level.
In addition, in terms of scale efficiency as showed in Figure 6, the value for 8 companies, such as SLE2, SLE3, SLE10, was 1, which also shows that these 8 companies reached the optimal production scale, while the remaining 26 companies failed to achieve the optimal production scale, which means that the production scale of the enterprises should be increased or decreased according to the actual production and operation. According to the calculated results, the average scale efficiency value of 34 LED energy enterprises was 0.963, and 13 companies, such as SLE1, SLE4, and SLE9, did not reach the average level.

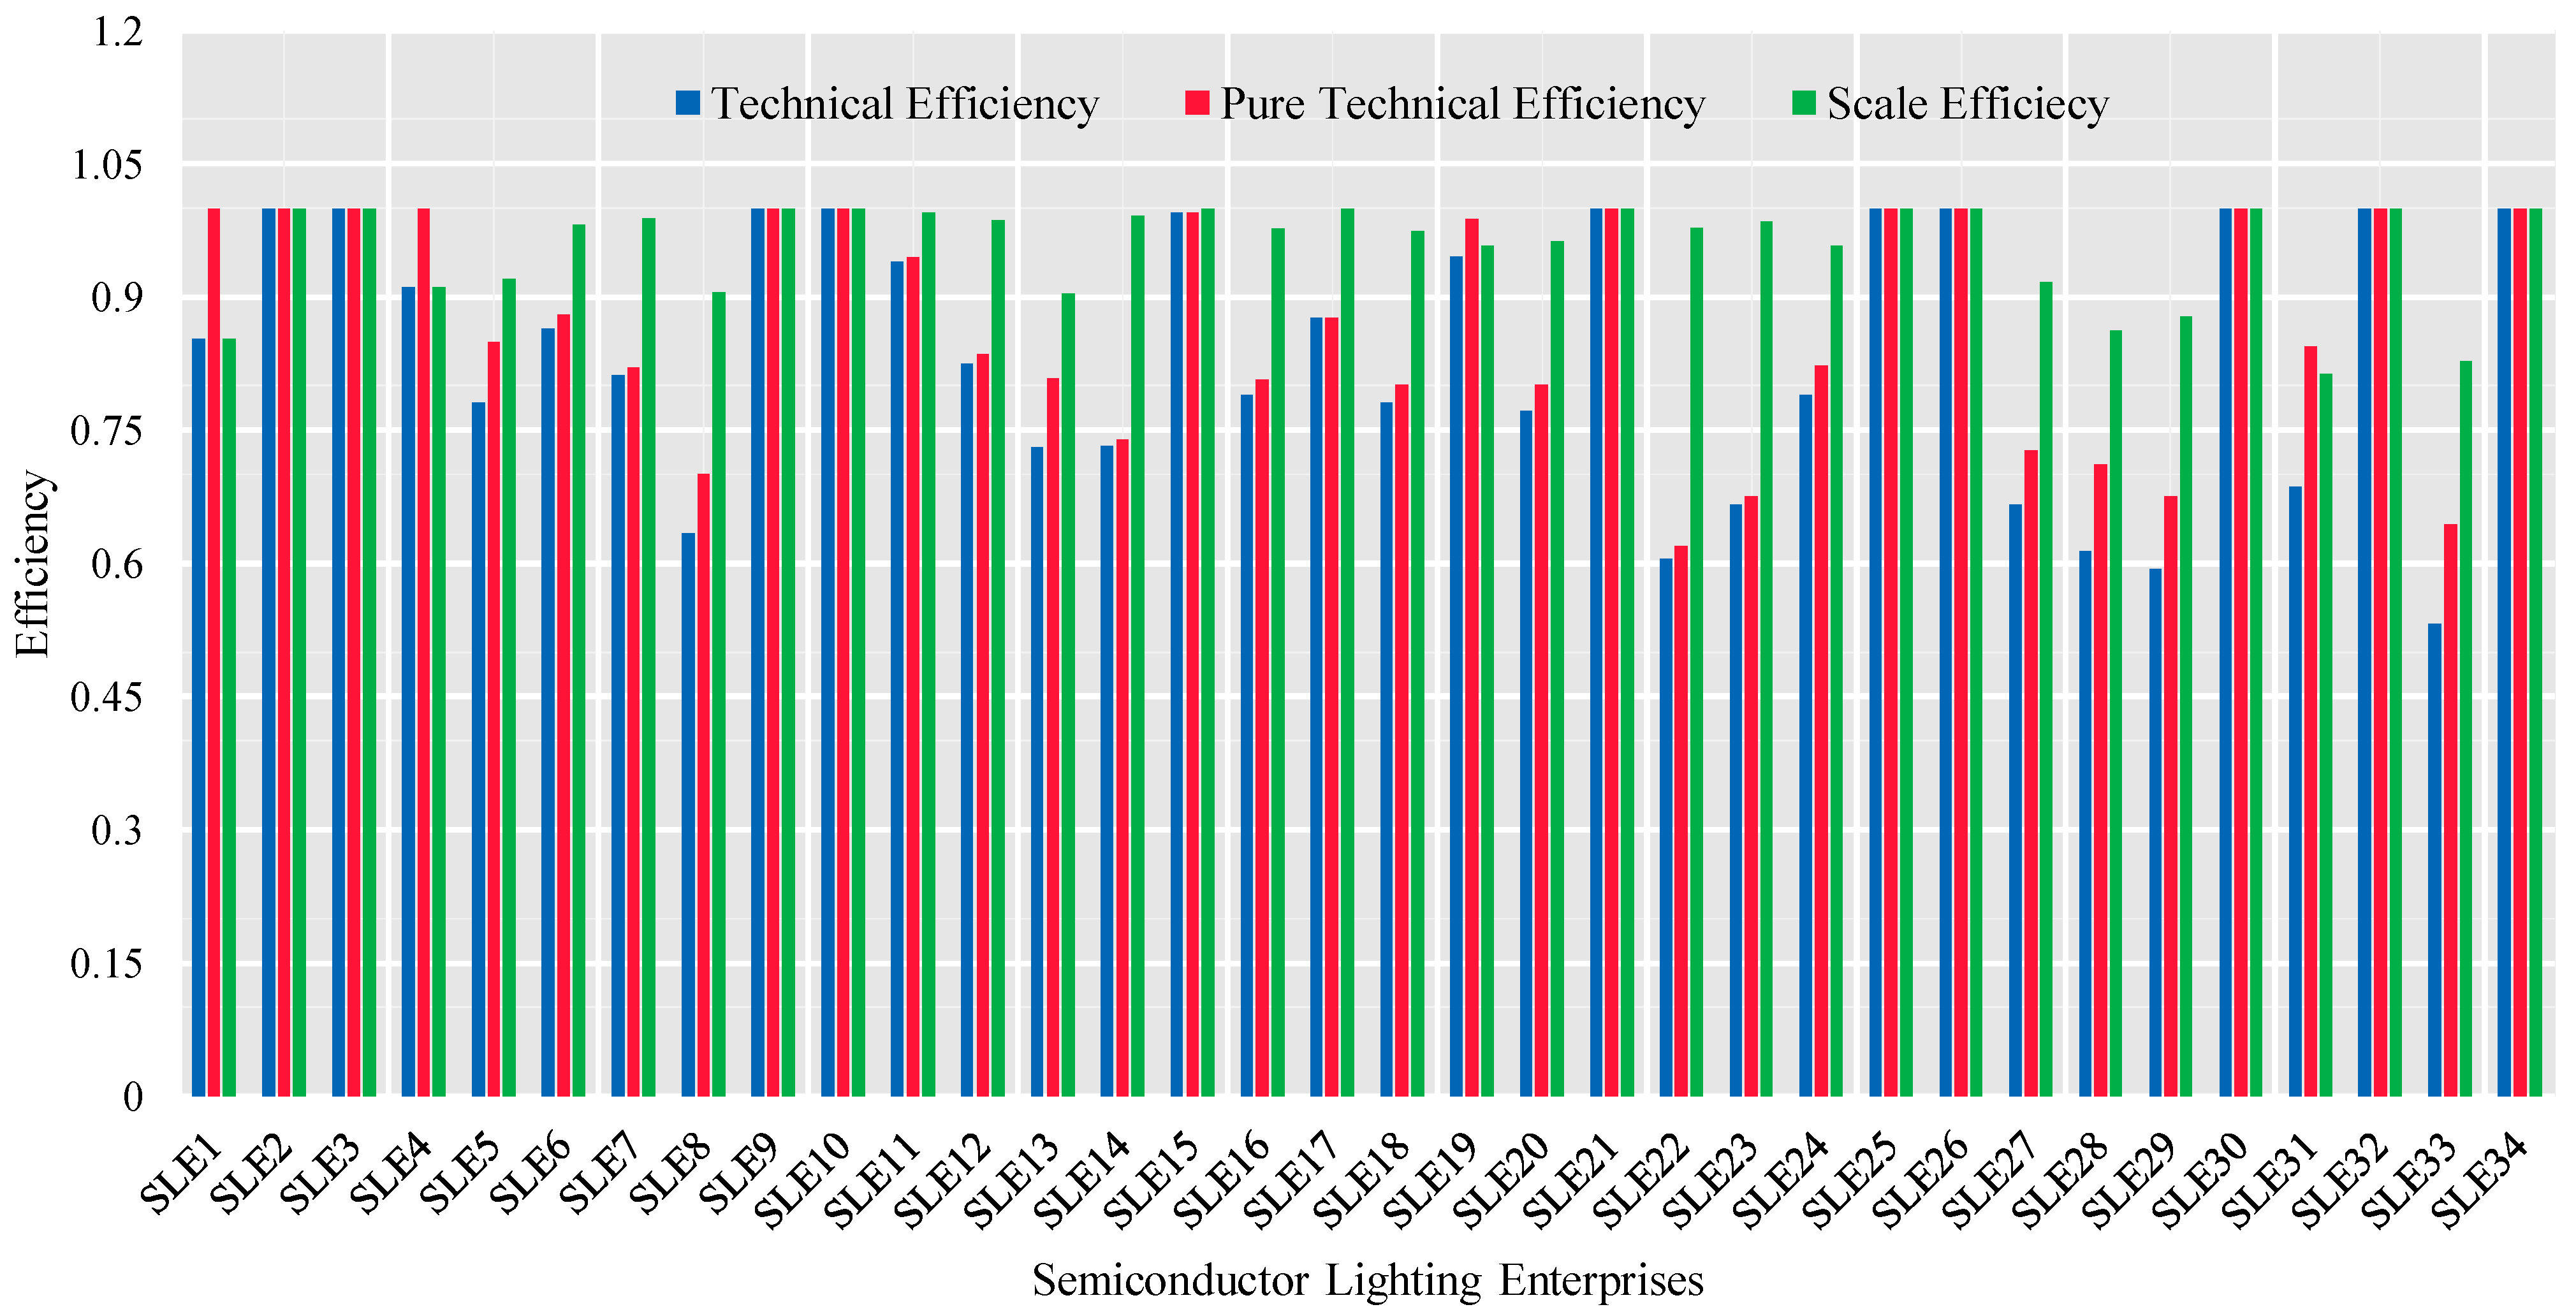
5.2. Analysis of Technical Efficiency, Pure Technical Efficiency, and Scale Efficiency of China’s LED Energy Enterprises in 2018

The comprehensive technical efficiency evaluation results of 34 Chinese LED energy enterprises in 2018 are shown in Figure 7 and Table A5 in Appendix A. As shown in Figure 7, the technical efficiency value of 10 LED energy enterprises was 1 in 2018, which means that the 10 LED energy enterprises reached the optimal input–output under the condition of constant production factors. The remaining 24 companies failed to achieve the optimal input–output, and SLE33’s input–output was the lowest, only 0.533. According to the calculated results, the average technical efficiency value of these 34 LED energy enterprises was 0.835, and 17 enterprises, including SLE5, SLE7, and SLE8, did not reach the average level.
Specifically, in terms of the pure technical efficiency as showed in Figure 8, the value for 12 enterprises was 1, such as SLE1, SLE2, SLE4, which also shows that these 12 enterprises reached the best management system level and technological capabilities. Meanwhile, the management level and technological innovation of the remaining 22 companies still need to be strengthened. R&D efforts and R&D investment of these enterprises need to be increased. According to the calculated results, the average pure technical efficiency value of 34 LED energy enterprises was 0.870, and 17 companies, such as SLE5, SLE7, and SLE8, did not reach the average level.
In addition, in terms of scale efficiency as showed in Figure 8, the value for 10 companies, such as SLE2, SLE3, SLE9 was 1, which also shows that these 10 companies reached the optimal production scale, while the remaining 24 companies failed to achieve the optimal production scale, which means that the production scale of the enterprises should be increased or decreased according to the actual production and operation. According to the calculated results, the average scale efficiency value of 34 LED energy enterprises was 0.957, and 10 companies, such as SLE1, SLE4, and SLE5, did not reach the average level.

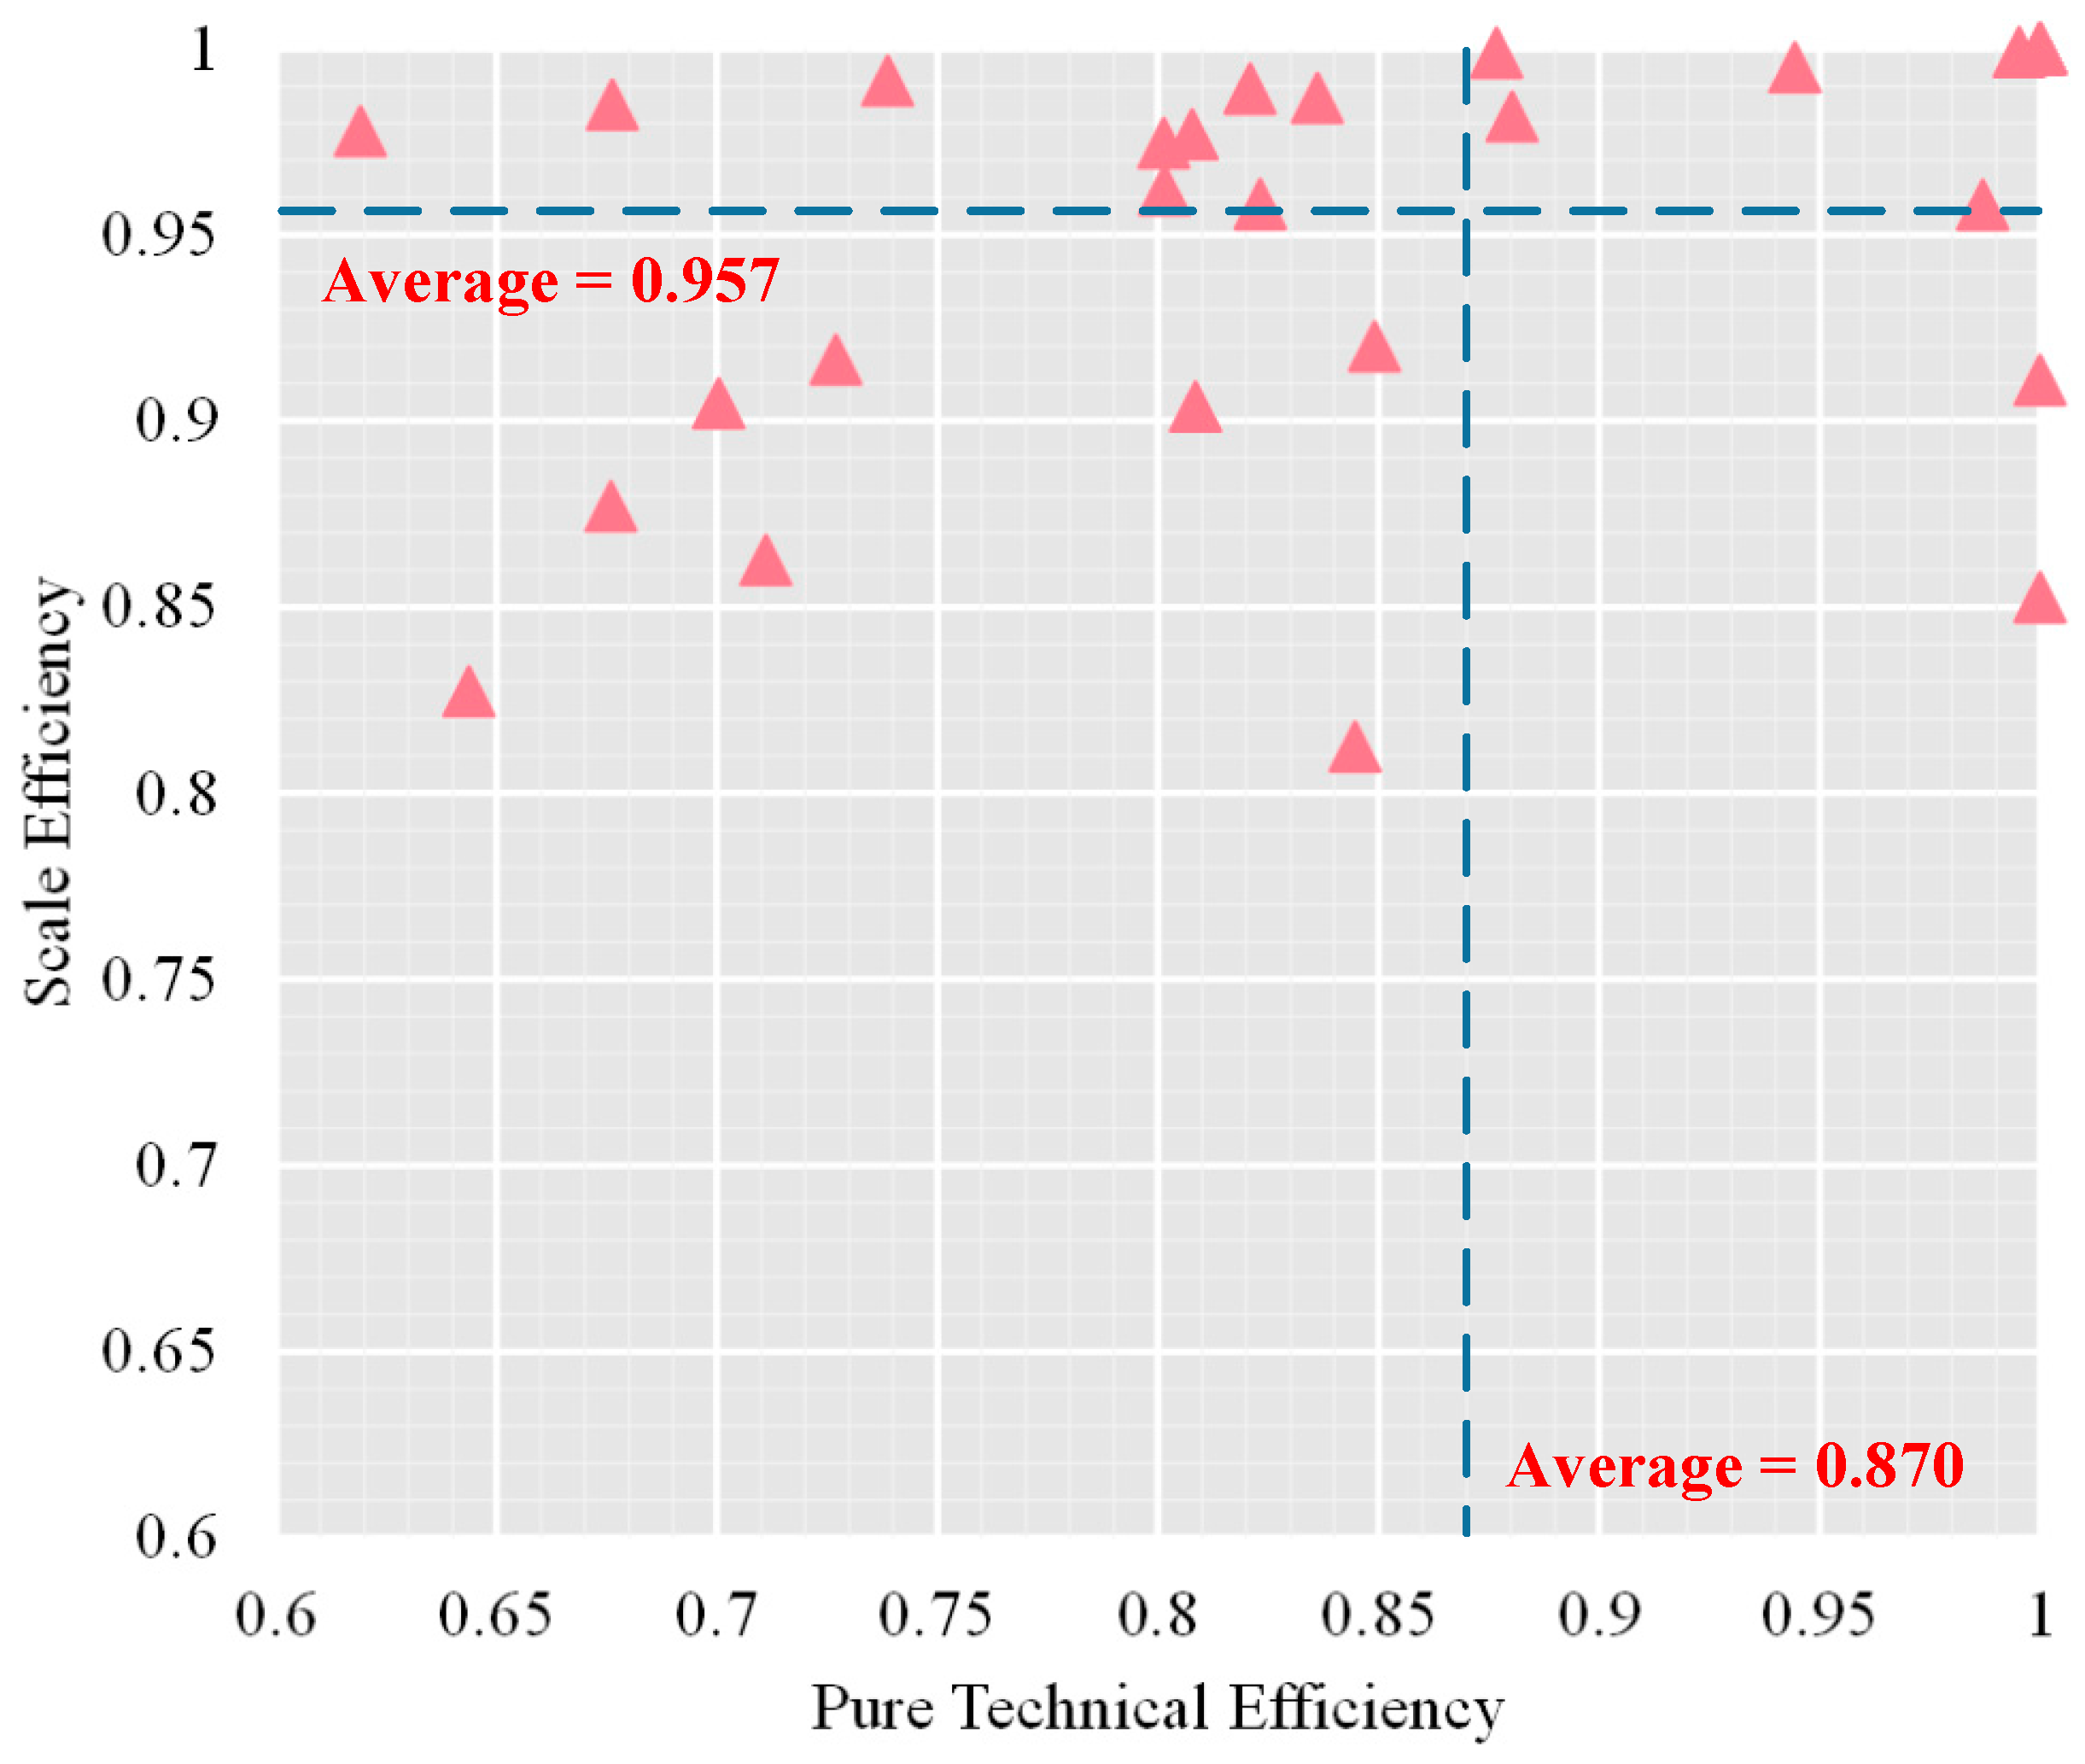
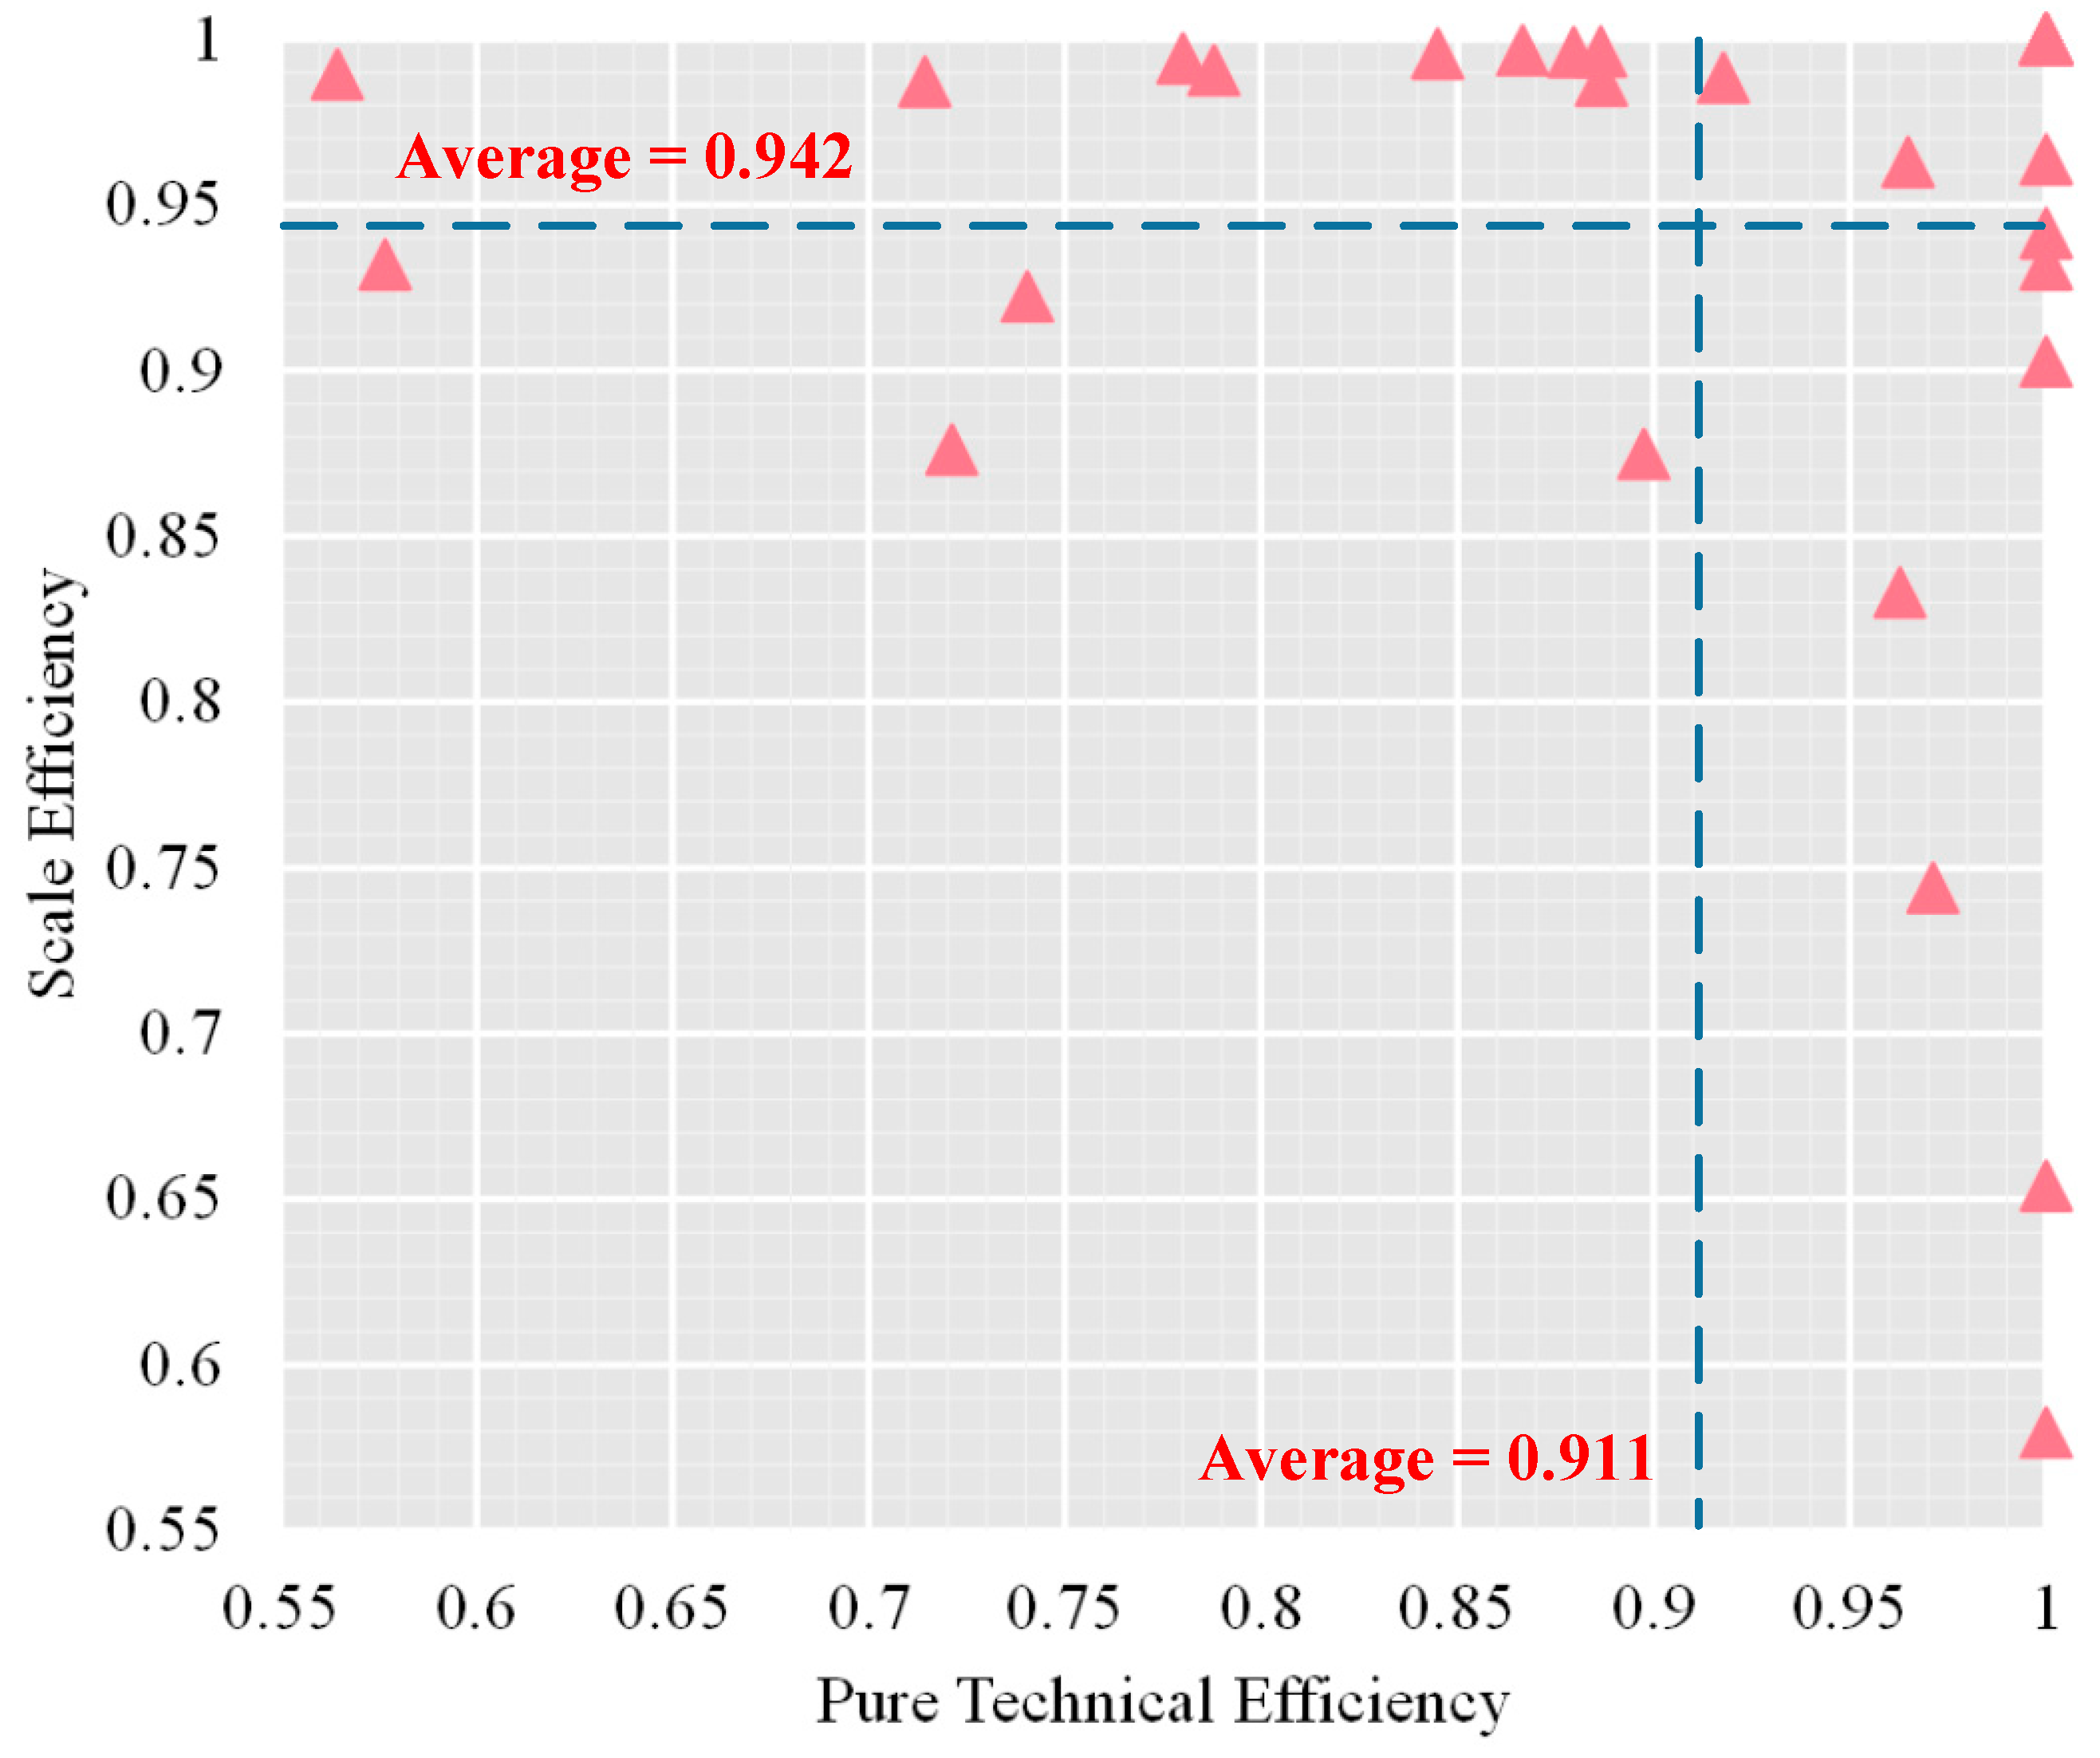
5.3. Analysis of Technical Efficiency, Pure Technical Efficiency, and Scale Efficiency of China’s LED Energy Enterprises in 2019

The comprehensive technical efficiency evaluation results of 34 Chinese LED energy enterprises in 2019 are shown in Figure 9 and Table A6 in Appendix A. As shown in Figure 9, the technical efficiency value of 11 LED energy enterprises was 1 in 2019, which means that the 11 LED energy enterprises reached the optimal input–output under the condition of constant production factors. The remaining 23 companies failed to achieve the optimal input–output, and SLE23’s input–output was the lowest, only 0.537. According to the calculated results, the average technical efficiency value of these 34 LED energy enterprises was 0.857, and 13 enterprises, including SLE5, SLE7, and SLE8, did not reach the average level.
Specifically, in terms of the pure technical efficiency as showed in Figure 10, the value for 17 enterprises was 1, such as SLE1, SLE3, and SLE4, which also shows that these 17 enterprises reached the best management system level and technological capabilities. Meanwhile, the management level and technological innovation of the remaining 17 companies still need to be strengthened. R&D efforts and R&D investment of these enterprises need to be increased. According to the calculated results, the average pure technical efficiency value of 34 LED enterprises was 0.911, and 12 companies, such as SLE5, SLE6, and SLE7, did not reach the average level.
In addition, in terms of scale efficiency as showed in Figure 10, the value for 11 companies, such as SLE3, SLE9, and SLE10 was 1, which also shows that these 11 companies reached the optimal production scale, while the remaining 23 companies failed to achieve the optimal production scale, which means that the production scale of the enterprises should be increased or decreased according to the actual production and operation. According to the calculated results, the average scale efficiency value of 34 LED energy enterprises was 0.942, and 11 companies, such as SLE4, SLE5, and SLE18, did not reach the average level.

6. Conclusions and Suggestions

By selecting input and output variables of 34 listed LED energy enterprises in China, the technical efficiency, pure technical efficiency, and scale efficiency of each enterprise from 2017 to 2019 were calculated by using the DEA method. The primary conclusions are summarized as below.
From 2017 to 2019, the overall input–output efficiency level of listed LED energy enterprises in China continued to increase, which means that under the condition of certain inputs, the corresponding output returns also increased simultaneously. The overall management measures and technological innovation level of China’s LED energy enterprises have the same development trends. In recent years, China’s LED energy enterprises have paid more attention to investments in technology research and technological innovation. In contrast, the scale efficiency of China’s LED energy enterprises has continued to decline in recent years, and the gap between production scale and optimal scale has increased.
Based on the conclusions mentioned above, several suggestions are listed below.
(1) The LED energy enterprises should vigorously promote the development of intelligent manufacturing equipment and intelligent production lines and should accelerate the upgrading and transformation of intelligent production equipment. Meanwhile, they need to improve automation levels and promote the pilot construction of smart factories and digital workshops.
(2) The government should encourage local LED energy enterprises to optimize their layout and should guide the industrial transformation, which can promote the flow of industrial resources and realize the coordinated development of eastern, central, and western regions. In addition, the government should build a group of LED energy industry clusters with distinctive characteristics, which can accelerate the development of regional industrial clusters and promote the development of system integration.
(3) The LED energy enterprises should promote the development and industrialization of smart lighting products and should support the construction of smart cities, communities, and homes. Meanwhile, they need to strengthen the development and application of products in emerging fields such as agricultural lighting, medical lighting, and visible light communications, which can accelerate the upgrading of the lighting industry to high-end applications.
In future studies, more input–output indicators and a broader time dimension should be considered, which could help obtain more comprehensive and accurate efficiency evaluation results. In addition, further improvements are needed in research methods.

Author Contributions

Conceptualization, K.W.; data curation, K.W. and Y.Z.; investigation, Y.Z. and S.Q.; methodology, K.W., L.L. and S.Q.; project administration, L.L.; resources, Y.Z. and L.L.; software, K.W. and Y.Z.; visualization, Y.Z.; writing—original draft, K.W. and L.L.; writing—review and editing, S.Q. All authors have read and agreed to the published version of the manuscript.

Funding

This research received no external funding.

Institutional Review Board Statement

Not applicable.

Informed Consent Statement

Not applicable.

Data Availability Statement

Not applicable.

Acknowledgments

The authors are grateful to the editor and anonymous reviewers for their work.

Conflicts of Interest

The authors declare no conflict of interest.

Abbreviations

AbbreviationFull name
LEDlight-emitting diode
DEAdata envelopment analysis
CSAChina Solid State Lighting Alliance
MLGmulti-layer graphene
MCDAmulti-criteria decision analysis
BWMbest-worst method
SLEsemiconductor lighting enterprise
MEEMmatter-element extension
FCPTfuzzy-cumulative prospect theory
DMUdecision-making unit
AHPanalytic hierarchy process
TOPSISTechnique for Order Preference by Similarity to an Ideal Solution

Appendix A

Input and output variables.
Table A1. Input and output variables for 34 listed LED energy enterprises in 2017.
DMUsOperating Costs (Million CNY)Research & Development Expense (Million CNY)General & Administrative Expense (Million CNY)Net Value of Fixed Assets (Million CNY)Revenue (Million CNY)Return on Total Assets Ratio (%)
SLE16452.00305.80312.905647.278169.006.38
SLE24298.00126.60396.308218.608394.0015.86
SLE34133.00220.70186.501095.436957.0013.99
SLE43851.00275.40342.80809.116471.0012.30
SLE53792.00196.80260.301184.365038.007.72
SLE62120.00109.20113.00758.583031.008.57
SLE72944.00175.80120.901078.933699.0010.06
SLE83579.00120.20647.503542.764203.00−5.04
SLE93444.0093.38113.70281.404031.008.03
SLE102940.0034.58179.00483.523800.0015.01
SLE112651.00160.40107.502105.013473.007.17
SLE122580.00121.40122.10517.573009.006.68
SLE133877.00175.60496.701317.565445.003.30
SLE141756.0087.16177.904686.052630.008.30
SLE151502.0042.67168.20294.582266.0014.17
SLE161609.0087.63109.40522.542055.001.66
SLE17985.8080.24109.80345.751547.007.07
SLE181279.0087.42100.401224.001750.004.49
SLE19627.2067.4961.61164.001041.009.26
SLE201287.0057.9771.42509.201584.007.38
SLE21321.8015.5757.4145.47682.0016.88
SLE22864.6044.3199.491121.001184.000.79
SLE23713.2072.6494.981402.001130.005.94
SLE24516.7071.6256.70518.30763.302.20
SLE25566.6030.8421.32151.70776.8018.14
SLE26352.9027.1123.64197.00495.4010.25
SLE27452.2034.5948.06179.30644.501.98
SLE28736.5044.6669.28274.401026.003.99
SLE29421.7024.1329.47353.70620.9010.78
SLE30317.508.8030.3856.99480.3011.26
SLE31281.8024.6332.52312.20411.106.12
SLE32209.5015.7319.9074.97337.8012.81
SLE33544.4068.4859.20274.70557.606.74
SLE3490.5038.4425.64220.60177.203.01
Table A2. Input and output variables for 34 listed LED energy enterprises in 2018.
DMUsOperating Costs (Million CNY)Research & Development Expense (Million CNY)General & Administrative Expense (Million CNY)Net Value of Fixed Assets (Million CNY)Revenue (Million CNY)Return on Total Assets Ratio (%)
SLE113,280.00692.10730.107051.2617,950.004.80
SLE24625.00144.40501.108911.948364.0011.81
SLE35086.00316.70210.301049.978004.0015.30
SLE44717.00316.70402.50935.677701.0011.50
SLE54253.00216.30371.801229.925616.006.81
SLE63100.00206.60199.90838.724524.009.26
SLE73079.00178.80158.201114.644003.005.68
SLE83479.00167.00488.001878.674001.00−36.21
SLE93371.0099.77120.20315.243995.007.77
SLE102923.0052.73173.90512.113802.007.81
SLE113170.00164.90115.502248.654066.008.43
SLE123015.00126.10130.80555.843446.006.28
SLE132398.00127.60574.401176.603302.00-21.70
SLE141940.00103.60233.805059.522732.003.09
SLE151663.0048.61168.00316.032433.007.14
SLE161832.0095.98117.50845.7623,445.005.46
SLE171229.0089.20118.20396.691987.0013.89
SLE181172.00100.4082.931046.001574.006.90
SLE191046.0090.0371.26161.801573.0010.33
SLE201254.0091.2762.48474.501562.004.40
SLE21616.3045.3193.3862.531307.0017.22
SLE22920.5065.64118.901031.001120.00−26.47
SLE23729.2061.33145.701641.001030.003.97
SLE24641.6064.5569.68500.40965.306.08
SLE25676.0039.1323.73272.80877.1010.33
SLE26520.4034.7127.36194.90774.5014.63
SLE27561.8039.6966.87213.40733.50−2.88
SLE28435.2041.2471.06256.30566.10−42.23
SLE29517.2046.7247.27763.30558.702.09
SLE30339.6016.6737.8462.68526.5010.10
SLE31352.8030.2766.21322.60513.503.55
SLE32324.7022.2825.88122.50486.909.92
SLE33373.4074.4557.55250.50421.70−24.31
SLE34109.0037.3635.85224.00228.204.02
Table A3. Input and output variables for 34 listed LED energy enterprises in 2019.
DmusOperating Costs (Million CNY)Research & Development Expense (Million CNY)General & Administrative Expense (Million CNY)Net Value of Fixed Assets (Million CNY)Revenue (Million CNY)Return on Total Assets Ratio (%)
SLE113,210.00481.00936.306755.0018,970.003.81
SLE25269.00197.00504.009265.007460.005.64
SLE35301.00321.20252.001037.008355.0013.48
SLE45962.00370.20466.70976.509047.006.63
SLE53601.00216.70419.001315.005316.009.14
SLE63906.00234.70230.70874.105604.009.59
SLE72919.00173.30207.101002.003594.00−21.50
SLE82557.0094.06357.401422.002980.005.10
SLE93447.00131.30124.10326.104244.008.41
SLE102561.0079.44145.10629.803338.005.57
SLE113579.00146.40138.802377.004069.007.39
SLE123832.00152.70156.80547.704355.005.39
SLE132014.0084.89422.201086.002928.00−14.08
SLE142871.00138.00235.104609.002716.00−8.20
SLE151632.0061.50110.20360.802504.0010.01
SLE161807.00120.80132.30997.102507.009.53
SLE171488.0095.61129.30347.702181.005.58
SLE181208.00108.0085.05998.301617.00-12.34
SLE19691.9085.7273.50154.501245.008.83
SLE20111.7082.2276.49482.201372.00−5.91
SLE21663.8057.08123.1048.401252.006.33
SLE22596.8038.36136.80912.10729.802.47
SLE23959.9066.13176.603404.001039.00−4.13
SLE24630.5071.4360.85477.001069.008.14
SLE25850.3050.2041.75328.501117.0010.02
SLE26619.4046.4771.28183.60982.8016.77
SLE27708.8044.3946.95202.50966.903.32
SLE28245.2027.5076.67109.10353.50−49.56
SLE29995.7045.6535.87955.001143.001.47
SLE30452.4025.0243.7990.21711.9011.04
SLE31324.4030.1385.57328.80535.503.17
SLE32370.4030.0737.01145.30560.407.75
SLE33161.6069.8850.58164.90417.908.11
SLE34180.4039.0145.91517.00321.403.58

Appendix B

Technical efficiency, pure technical efficiency, and scale efficiency.
Table A4. Technical efficiency, pure technical efficiency, and scale efficiency for 34 listed LED energy enterprises in 2017.
DMUsTechnical EfficiencyRankingPure Technical EfficiencyRankingScale EfficiencyRanking
SLE10.77201.0010.7734
SLE21.0011.0011.001
SLE31.0011.0011.001
SLE40.9491.0010.9427
SLE50.75250.78250.9621
SLE60.83160.84190.9915
SLE70.82180.82211.009
SLE80.61330.67330.9230
SLE91.0011.0011.001
SLE101.0011.0011.001
SLE110.87150.87161.0010
SLE120.76230.77290.9914
SLE130.73300.86170.8533
SLE140.76210.77280.9913
SLE150.90111.00120.9132
SLE160.72310.73310.9911
SLE170.82170.85180.9720
SLE180.74290.76300.9817
SLE190.89120.91150.9916
SLE200.75280.78260.9622
SLE211.0011.0011.001
SLE220.69320.70320.9818
SLE230.78190.79240.9912
SLE240.76240.79220.9524
SLE251.0011.0011.001
SLE260.87140.92140.9526
SLE270.75260.79230.9525
SLE280.75270.77270.9819
SLE290.89130.93130.9623
SLE301.0011.0011.001
SLE310.76220.84200.9131
SLE321.0011.0011.001
SLE330.54340.57340.9428
SLE340.92101.0010.9229
Table A5. Technical efficiency, pure technical efficiency, and scale efficiency for 34 listed LED energy enterprises in 2018.
DMUsTechnical EfficiencyRankingPure Technical EfficiencyRankingScale EfficiencyRanking
SLE10.85171.0010.8532
SLE21.0011.0011.001
SLE31.0011.0011.001
SLE40.91141.0010.9127
SLE50.78220.85180.9225
SLE60.86160.88160.9818
SLE70.81190.82220.9915
SLE80.63300.70300.9028
SLE91.0011.0011.001
SLE101.0011.0011.001
SLE110.94130.94150.9913
SLE120.83180.84200.9916
SLE130.73260.81230.9029
SLE140.73250.74270.9914
SLE150.99111.0011.001
SLE160.79200.81240.9820
SLE170.88150.88171.001
SLE180.78230.80260.9721
SLE190.95120.99140.9624
SLE200.77240.80250.9622
SLE211.0011.0011.001
SLE220.61320.62340.9819
SLE230.67290.68310.9817
SLE240.79210.82210.9623
SLE251.0011.0011.001
SLE261.0011.0011.001
SLE270.67280.73280.9226
SLE280.61310.71290.8631
SLE290.59330.68320.8830
SLE301.0011.0011.001
SLE310.69270.84190.8134
SLE321.0011.0011.001
SLE330.53340.64330.8333
SLE341.0011.0011.001
Table A6. Technical efficiency, pure technical efficiency, and scale efficiency for 34 listed LED energy enterprises in 2019.
Technical EfficiencyRankingPure Technical EfficiencyRankingDMUsScale EfficiencyRanking
0.96121.001SLE10.9622
0.93150.9619SLE20.9623
1.0011.001SLE31.001
0.94131.001SLE40.9424
0.79240.9022SLE50.8730
0.88200.8923SLE60.9920
0.70280.7132SLE70.9921
0.78260.7829SLE80.9916
1.0011.001SLE91.001
1.0011.001SLE101.001
0.88180.8924SLE111.001
0.88190.8825SLE121.001
0.91160.9221SLE130.9919
0.56330.5634SLE140.9918
1.0011.001SLE151.001
0.78250.7928SLE160.9917
0.84220.8427SLE171.001
0.68290.7430SLE180.9227
1.0011.001SLE191.001
1.0011.001SLE201.001
1.0011.001SLE211.001
0.63310.7231SLE220.8829
0.54340.5833SLE230.9326
0.86210.8726SLE241.001
1.0011.001SLE251.001
1.0011.001SLE261.001
0.80230.9620SLE270.8331
0.58321.001SLE280.5834
0.93141.001SLE290.9325
1.0011.001SLE301.001
0.72270.9718SLE310.7432
0.90171.001SLE320.9028
1.0011.001SLE331.001
0.65301.001SLE340.6533

References

  1. Saidur, R.; Abdelaziz, E.; Demirbas, A.; Hossain, M.; Mekhilef, S. A review on biomass as a fuel for boilers. Renew. Sustain. Energy Rev. 2011, 15, 2262–2289. [Google Scholar] [CrossRef]
  2. National Bureau of Statistics. Available online: http://www.stats.gov.cn/ (accessed on 22 August 2020).
  3. Wang, C.; Patino-Echeverri, D.; Regan, L. Decoupling analysis on Chinese economic growth and energy consumption. China J. Popul. Resour. Environ. 2010, 20, 35–37. [Google Scholar]
  4. Zhang, Z.T.; Cheng, Y.; Yin, L. Research on the Evolution and Operation Mode of Strategic Emerging Industries’ Innovation System Network—Based on the Analysis of Shenzhen LED Industry. RD Manag. 2014, 26, 114–121. [Google Scholar]
  5. China Soled State Lighting Alliance. Available online: http://csa.china-led.net/ (accessed on 22 August 2020).
  6. Zhang, Y.; Wang, L.; Li, X.; Yi, X.; Zhang, N.; Li, J.; Zhu, H.; Wang, G. Annealed InGaN green light-emitting diodes with graphene transparent conductive electrodes. J. Appl. Phys. 2012, 111, 114501. [Google Scholar] [CrossRef]
  7. Zhang, S.G.; Zhang, X.W.; Si, F.T.; Dong, J.J.; Wang, J.X.; Liu, X.; Yin, Z.G.; Gao, H.L. Ordered ZnO nanorods-based heterojunction light-emitting diodes with graphene current spreading layer. Appl. Phys. Lett. 2012, 101, 121104. [Google Scholar] [CrossRef]
  8. Li, X.; Liang, R.; Tao, J.; Peng, Z.; Xu, Q.; Han, X.; Wang, X.; Wang, C.; Zhu, J.; Pan, C.; et al. Flexible Light Emission Diode Arrays Made of Transferred Si-Microwires-ZnO-Nanofilm with Piezo-Phototronic Effect Enhanced Lighting. ACS Nano 2017, 11, 3883. [Google Scholar] [CrossRef]
  9. Abramov, A.V.; Bogdanov, A.A.; Danilko, A.V.; Dmitriev, P.B.; Karev, A.V.; Stepanov, A.V. Inrush Current Measurement Methodology of Led Lighting Fixtures. Light Eng. 2021, 29, 39–47. [Google Scholar] [CrossRef]
  10. Cheng, C.; Chung, T.; Yang, F. A single-stage LED driver for street-lighting applications with high PFC. In Proceedings of the 2013 IEEE International Symposium on Industrial Electronics, Kaohsiung, Taiwan, 25–26 February 2013; pp. 1–4. [Google Scholar]
  11. Ye, X.T.; Zhang, J.; Su, J.; Huang, C. Comparative Advantage and Development Countermeasure of China’s Light Emitting Diode Industry in Background of Anti-dumping and Anti-subsidy. Technol. Econ. 2014, 33, 59–62. [Google Scholar]
  12. Guo, F.; Pachauri, S. China’s Green Lights Program: A review and assessment. Energy Policy 2017, 110, 31–39. [Google Scholar] [CrossRef]
  13. Wu, K.; Wang, M.Y. Research on Innovation Approaches of LED Enterprise Business Model. Sci. Technol. Manag. Res. 2013, 33, 28. [Google Scholar]
  14. Wang, F.; Mao, J. A study on technological chain, industy technological chain and industy upgrading—A case study on semiconductor illuminance industry in China. RD Manag. 2010, 22, 19–28. [Google Scholar]
  15. Li, S.H.; Huang, H.M.; Wang, H. Analysis and policy measures of China’s LED industry development status. Macroeconomics 2011, 31, 25–32. [Google Scholar]
  16. Ye, X.T.; Li, M.H. Study on the Difference of China’s Industrial Policy Based on the Quantitative Analysis of Policy Documents—A Case Study on the Light Emitting Diode Industry. J. Public Manag. 2015, 12, 145–152, 159–160. [Google Scholar]
  17. Wan, Y.; Feng, R.H.; Huang, J. Domestic and foreign LED lighting industry policies. High. Technol. Commer. 2011, 18, 35–39. [Google Scholar]
  18. Luo, K.; Yuan, X. Research on the tendency of patent fragmentation in Chinese LED industry and policy implication. J. Intell. 2016, 35, 89–94. [Google Scholar]
  19. Chen, Y.; Chen, B. Utilizing patent analysis to explore the cooperative competition relationship of the two LED companies: Nichia and Osram. Technol. Forecast. Soc. Chang. 2011, 78, 294–302. [Google Scholar] [CrossRef]
  20. Jia, Z.; Dong, J. Study on the patent strategy of semiconductor lighting industry in Shanxi province. J. Libr. Inf. Sci. 2011, 21, 132–135. [Google Scholar]
  21. Farrell, M.J. The Measurement of Productive Efficiency. J. R. Stat. Soc. Ser. A 1957, 120, 253–281. [Google Scholar] [CrossRef]
  22. Neves, L.P.; Dias, L.C.; Antunes, C.H.; Martins, A.G. Structuring an MCDA model using SSM: A case study in energy efficiency. Eur. J. Oper. Res. 2009, 199, 834–845. [Google Scholar] [CrossRef] [Green Version]
  23. Li, X.; Liu, Y.; Wang, Y.; Gao, Z. Evaluating transit operator efficiency: An enhanced DEA model with constrained fuzzy-AHP cones. J. Traffic Transp. Eng. 2016, 3, 215–225. [Google Scholar] [CrossRef] [Green Version]
  24. Narendra, N.D.; Jignesh, M.J. Estimating technical efficiency of petroleum refineries using DEA and tobit model: An India perspective. Comput. Chem. Eng. 2021, 142, 107047. [Google Scholar]
  25. Wanke, P.; Azad, M.A.K.; Barros, C.P.; Hassan, M.K. Predicting efficiency in Islamic banks: An integrated multicriteria decision making (MCDM) approach. J. Int. Financ. Mark. Inst. Money 2016, 45, 126–141. [Google Scholar] [CrossRef]
  26. Su, W.; Wang, D.; Xu, L.; Zeng, S.; Zhang, C. A Nonradial Super Efficiency DEA Framework Using a MCDM to Measure the Research Efficiency of Disciplines at Chinese Universities. IEEE Access 2020, 8, 86388–86399. [Google Scholar] [CrossRef]
  27. Neykov, N.; Krišťáková, S.; Hajdúchová, I.; Sedliačiková, M.; Antov, P.; Giertliová, B. Economic Efficiency of Forest Enterprises—Empirical Study Based on Data Envelopment Analysis. Forests 2021, 12, 462. [Google Scholar] [CrossRef]
  28. Faizi, S.; Sałabun, W.; Nawaz, S.; Rehman, A.U.; Atróbski, J.W. Best-Worst method and Hamacher aggregation operations for intuitionistic 2-tuple linguistic sets. Expert Syst. Appl. 2021, 181, 115088. [Google Scholar] [CrossRef]
  29. Zhao, H.; Li, N. A Novel Hybrid Evaluation Model for the Performance of ERP Project Based on ANP and Improved Matter-Element Extension Model. Math. Probl. Eng. 2013, 2013 Pt 3, 237–245. [Google Scholar]
  30. Zhao, H.; Guo, S.; Zhao, H. Comprehensive assessment for battery energy storage systems based on fuzzy-MCDM considering risk preferences. Energy 2019, 168, 450–461. [Google Scholar] [CrossRef]
  31. Saabun, W.; Wtróbski, J.; Shekhovtsov, A. Are MCDA Methods Benchmarkable? A Comparative Study of Topsis, Vikor, Copras, and Promethee II Methods. Symmetry 2020, 12, 1549. [Google Scholar] [CrossRef]
  32. Shekhovtsov, A.; Kozlov, V.; Nosov, V.; Sałabun, W. Efficiency of Methods for Determining the Relevance of Criteria in Sustainable Transport Problems: A Comparative Case Study. Sustainability 2020, 12, 7915. [Google Scholar] [CrossRef]
  33. Athanassopoulos, A.; Gounaris, C. Assessing the technical and allocative efficiency of hospital operations in Greece and its resource allocation implications. Eur. J. Oper. Res. 2001, 133, 416–431. [Google Scholar] [CrossRef]
  34. Liu, M.; Li, S. Innovation efficiency evaluation of hi-tech development zones based on the three-stage DEA model. Manag. Rev. 2016, 28, 42–52, 155. [Google Scholar]
  35. Rezapour, A.; Azar, F.E.; Zadeh, N.Y.; Roumiani, Y.; Faradonbeh, S.B. Technical efficiency and resources allocation in university hospitals in Tehran, 2009–2012. Med J. Islamic Repub. Iran 2015, 29, 266. [Google Scholar]
  36. Nassiril, S.M.; Singh, S.; Ahuja, S. Assessing the technical efficiency and Returns-to-scale of wheat growers: Data development analysis application. J. Res. 2008, 45, 177–182. [Google Scholar]
  37. De Sousa, M.D.; Cribarineto, F.; Stosic, B. Explaining DEA Technical Efficiency Scores in an Outlier Corrected Environment: The case of Public Services in Brazilian Municipalities. Braz. Rev. Econom. 2005, 25, 287–313. [Google Scholar] [CrossRef] [Green Version]
  38. Xingang, Z.; Zhen, W. The technical efficiency of China’s wind power list enterprises: An estimation based on DEA method and micro-data. Renew. Energy 2019, 133, 470–479. [Google Scholar] [CrossRef]
  39. Badunenko, O.; Mozharovskyi, P. Statistical inference for the Russell measure of technical efficiency. J. Oper. Res. Soc. 2019, 71, 517–527. [Google Scholar] [CrossRef]
  40. Cook, W.D.; Seiford, L.M. Data envelopment analysis (DEA)—Thirty years on. Eur. J. Oper. Res. 2009, 192, 1–17. [Google Scholar] [CrossRef]
  41. Lotfi, F.H.; Jahanshahloo, G.R.; Soltanifar, M.; Ebrahimnejad, A.; Mansourzadeh, S.M. Relationship between MOLP and DEA based on output-orientated CCR dual model. Expert Syst. Appl. 2010, 37, 4331–4336. [Google Scholar] [CrossRef]
  42. Hatami-Marbini, A.; Tavana, M.; Saati, S.; Agrell, P.J. Positive and normative use of fuzzy DEA-BCC models: A critical view on NATO enlargement. Int. Trans. Oper. Res. 2012, 20, 411–433. [Google Scholar] [CrossRef]
  43. Wei, C.K.; Chen, L.C.; Li, R.K.; Tsai, C.H. Exploration of efficiency underestimation of CCR model: Based on medical sectors with DEA-R model. Expert Syst. Appl. 2011, 38, 3155–3160. [Google Scholar] [CrossRef]
  44. Lee, L.T.S. On efficiency of integrative strategies among companies in US high-tech industry. Int. J. Manag. Enterp. Dev. 2010, 9, 311. [Google Scholar] [CrossRef]
  45. Bhat, V.N. Productivity in the retail industry: Does insider ownership of shares matter? Appl. Financ. Econ. Lett. 2008, 4, 121–125. [Google Scholar] [CrossRef]
  46. He, Y.; Chiu, Y.H.; Zhang, B. The impact of corporate governance on state-owned and non-state-owned firms efficiency in China. N. Am. J. Econ. Financ. 2015, 33, 252–277. [Google Scholar] [CrossRef]
  47. Chen, Y.; Zhu, J. DEA Models for Identifying Critical Performance Measures. Ann. Oper. Res. 2003, 124, 225–244. [Google Scholar] [CrossRef]
  48. Jing, Q. Research on Financial Performance Evaluation of Media Industry Listed Companies Based on AHP-DEA. Stat. Inf. Forum 2017, 32, 92–100. [Google Scholar]
Figure 1. Technical efficiency and allocative efficiency of enterprises.
Mathematics 09 02356 g001
Figure 2. Pure technical efficiency and scale efficiency of enterprises.
Mathematics 09 02356 g002
Figure 3. DEA efficiency evaluation principle.
Mathematics 09 02356 g003
Figure 4. The index system for efficiency evaluation of Chinese LED energy enterprises.
Mathematics 09 02356 g004
Figure 5. Comprehensive technical efficiency evaluation results of 34 Chinese LED energy enterprises in 2017.
Mathematics 09 02356 g005
Figure 6. The pure technical efficiency and scale efficiency of 34 Chinese LED energy enterprises in 2017.
Mathematics 09 02356 g006
Figure 7. Comprehensive technical efficiency evaluation results of 34 Chinese LED energy enterprises in 2018.
Mathematics 09 02356 g007
Figure 8. The pure technical efficiency and scale efficiency of 34 Chinese LED energy enterprises in 2018.
Mathematics 09 02356 g008
Figure 9. Comprehensive technical efficiency evaluation results of 34 Chinese LED energy enterprises in 2019.
Mathematics 09 02356 g009
Figure 10. The pure technical efficiency and scale efficiency of 34 Chinese LED energy enterprises in 2019.
Mathematics 09 02356 g010
Table 1. The research about efficiency measurement in different fields.
ReferenceApplication ScenarioModelContributions and Conclusions
Neves et al. [22]Energy efficiencySoft Systems methodologyHelps clearly define the decision problem context and the main actors involved.
Li et al. [23]Transit operator efficiencyFuzzy-AHP; DEA modelBetter captures inherent preferences information over input and output indicators.
Narendra and Jignesh [24]Technical efficiency of Indian refineriesDEA model; Tobit regressionReveals the efficiency of four refineries and suggests four significant factors as explaining variations in refinery efficiency.
Peter et al. [25]Efficiency of Islamic banksTOPSIS; neural networksVariables related to both country origin and cost structure have a prominent impact on efficiency.
Su et al. [26]Efficiency of scientific researchNonradial Super Efficiency Data Envelopment Analysis modelManages nonsolution problems and integer decision variable constraints.
Neykov et al. [27]Economic efficiency of forest enterprisesDEA methodOutlines the major factors affecting the differences in efficiency scores.
Table 2. The expansion of the model’s decision variables.
VariablesExpansion
X j The inputs of the j -th DMU
Y j The outputs of the j -th DMU
s + The remaining variable
s The slack variable
Table 3. The expansion of the model’s decision parameters.
ParametersExpansion
n The number of DMUs in the market
m The number of inputs
s The number of outputs
u The weight coefficient vector of the inputs
v The weight coefficient vector of the outputs
h j The optimal weight ratio of the j -th DMU
θ The technical efficiency of the j 0 -th DMU
Table 4. Descriptive statistics of selected variables for 34 listed LED energy enterprises in 2017.
Variables.MinimumMaximumMeanStandard Deviation
Operating costs (million CNY)90.506452.001826.381574.45
Research & Development expense (million CNY)8.80305.8092.5973.59
General & Administrative expense (million CNY)19.90647.50143.12142.18
Net value of fixed assets (million CNY)45.478218.601175.551757.24
Revenue (million CNY)177.208394.002584.702302.81
Return on total assets ratio (%)−5.0418.148.045.03
Table 5. Descriptive statistics of selected variables for 34 listed LED energy enterprises in 2018.
VariablesMinimumMaximumMeanStandard Deviation
Operating costs (million CNY)109.0013,280.002169.112422.79
Research & Development expense (million CNY)16.67692.10119.06124.59
General & Administrative expense (million CNY)23.73730.10174.06172.04
Net value of fixed assets (million CNY)62.538911.941236.391926.70
Revenue (million CNY)228.2023,445.003652.624846.38
Return on total assets ratio (%)−42.2317.222.2014.33
Table 6. Descriptive statistics of selected variables for 34 listed LED energy enterprises in 2019.
Variables.MinimumMaximumMeanStandard Deviation
Operating costs (million CNY)111.7013,210.002227.272509.62
Research & Development expense (million CNY)25.02481.00118.12102.51
General & Administrative expense (million CNY)35.87936.30183.38183.67
Net value of fixed assets (million CNY)48.409265.001277.331948.65
Revenue (million CNY)321.4018,970.003105.943576.51
Return on total assets ratio (%)−49.5616.772.3712.05
Publisher’s Note: MDPI stays neutral with regard to jurisdictional claims in published maps and institutional affiliations.

