Article

RFID: A Fuzzy Linguistic Model to Manage Customers from the Perspective of Their Interactions with the Contact Center

by
Gabriel Marín Díaz
1,*,
Ramón Alberto Carrasco
2 and
Daniel Gómez
1,3
1
Faculty of Statistics, Complutense University, Puerta de Hierro, 28040 Madrid, Spain
2
Department of Management and Marketing, Faculty of Commerce and Tourism Complutense, University of Madrid, 28223 Madrid, Spain
3
Instituto de Evaluación Sanitaria, Complutense University, 28040 Madrid, Spain
*
Author to whom correspondence should be addressed.
Mathematics 2021, 9(19), 2362; https://doi.org/10.3390/math9192362
Submission received: 30 August 2021 / Revised: 16 September 2021 / Accepted: 18 September 2021 / Published: 23 September 2021
(This article belongs to the Section Engineering Mathematics)

Abstract

:
In an increasingly globalized market, the relationship between the customer and the brand goes beyond the purchasing process. It is very important to understand the customer, to know their needs and to propose actions to increase the value of the brand for them. In the literature, there are several models capable of determining and segmenting customers according to variables dependent on the purchasing process. However, we have not found any study that applies to the business case of classifying customers according to their relationship with the contact centre. In this paper, we establish a working model that allows us to define the value of the customer in the process of interaction with the contact centre, so that we can propose actions both in the sales phase and during the post-sales service, so that the value and perception of the brand is increased. In this model, we propose using the value of recency, frequency, importance and duration of customer interactions with the post-sales service, thus obtaining a ranking, and grouping of customers to help establish personalized communication strategies. We have verified this model by presenting a business case applied to the telecom sector.

1. Introduction

The last decade has witnessed what is known as the Fourth Industrial Revolution. Factors that have contributed to this change include information storage and processing capacity, as well as speed of communication [1]. We live in a hyper-connected society, with more than half of the world’s population connected to the Internet. Almost 52% of web traffic originates from a mobile device. The total number of active users on social networks is 3725 million. In one minute more than 87,500 people use Twitter, there are 2.1 million snaps on Snapchat, 46,200 photos on Instagram, and 4.5 million plays on YouTube. In addition, Google exceeds 3.8 million requests, and App Store and Google Play generate 390,000 app downloads [2].
From a consumer perspective, this digital disruption is transforming the way in which users relate to brands [3]. Further, in this sense, each population segment, each customer defines their own customer journey of their relationship with the brand [4], thus creating a greater understanding of the customer experience and their journey through their different interactions through any channel. On the other hand, attracting customers is important, but even more important is being able to retain them—thus, marketing strategies are focused on this process of retaining the most profitable customers [5].
There are various models that try to make the customer management process profitable from a marketing and sales point of view, trying to build customer loyalty. In this sense, one of the most widely used models based on the following sales parameters—recency, frequency and monetary (RFM). This model was introduced by Hughes in 1994, Strategic database marketing [6]. This model has been used to categorize the customer in such a way that marketing actions can be focused on them (cross-selling, upselling, etc.) according to the category to which they belong [7].
Another important use of the RFM model is to measure customer lifetime value (CLV) [8,9]. This value will also determine the strategy and the et of marketing actions that should be carried out with that customer. An extension of the RFM model to improve its linguistic interpretability and accuracy is based on using the fuzzy two-tuple linguistic model [10,11].
A crucial aspect of the customer centric philosophy is to consider that communications between the company and the customer are bidirectional, and that the customer wants to be served consistently and through any channel. The importance of technology in addition to strategy is fundamental and customer relationship management (CRM) based systems allow for multi-channel integration and therefore have, a deeper knowledge of the customer [12,13,14], for better customer management. Therefore, a crucial aspect for any Customer Centric strategy is the proper implementation of customer support processes integrated in the CRM and carried out by the contact centre.
Despite the proven and validated utility of the RFM model, it does not consider the interactions that occur between the company and the customer after the sale process and which, in many cases, are as or more important than the sale itself, to establish a true customer centric strategy. Everyday examples in relation to these post-sales interactions could be, a delay in the delivery of an order, a defective delivery, a deficient quality in the support service, etc.
After a detailed review of the literature related to customer service measurement, the focus in these reviews is set on the evaluation of customer satisfaction in one direction only, the customer’s opinion of the service provided by the contact centre, using a set of metrics linked to the customer satisfaction score (CSAT). The aim of this paper is to evaluate and establish a customer centric strategy in the processes of customer relations with the after-sales service, for which we propose a new model, which we have called RFID, based on RFM, and extended with the two-tuple model for the reasons mentioned above, so that it allows customer service experts to establish customer relationship strategies based on their interaction with the contact centre. This provides a 360° view of the relationship between the customer and the brand.
The proposed model is based on four parameters that have a direct impact on quality of service [15,16] and are present in the data model of any CRM, see Figures 4 and 6, which are crucial in case management during customer support processes: R = R e c e n c y , when the client last opened a case; F = F r e c u e n c y , how often the customer interacts with the contact centre; I = I m p o r t a n c e , what is the importance of customer interactions; and D = D u r a t i o n , how long it has taken to resolve issues. A crucial aspect such as establishing the importance of each of the variables in the model will be solved by using the analytical hierarchy process (AHP).
The RFID model developed in this article has been applied to the telecommunications sector, mainly because the contact centre is a vital element in the management process of the relationship between customer and brand. Although with the RFM model, the contact centre staff has adequate metrics for the personalisation of the interaction with the customer, we believe that the data provided is incomplete, as this model only considers the evaluation of the customer based on their purchases. Therefore, we consider that the RFID model complements and provides additional value to customer-brand loyalty processes.
In the remainder of this paper we will develop and apply the RFID model, according to the following structure: in Section 2, we will review the current state of the customer service metrics, and the use of the RFM methodology and its application scenarios, contrasting the existing GAP between the models developed and the one proposed in this article; in Section 3, we will address the model we will use in the definition of the RFID model; in Section 4, we will detail the proposed model; in Section 5, we will apply the RFID model using the CRM applied to a company in the telecom sector as a technological base; and finally in Section 6 and Section 7, we will set out the conclusions and future work.

2. Related Work

The studies reviewed in relation to after-sales service are based on the customer’s assessment of the brand or service provided through satisfaction surveys. For this reason, we believe it is of interest to have a 360° evaluation of the customer service process, as is performed with the RFM model in which the customer is evaluated on the basis of their purchases, in this case we propose to evaluate the customer through the history of their relationship with the after-sales service. We, therefore, believe that the RFM model, which has been so successful in obtaining customer value CLV in purchasing processes, can be applied intuitively to obtain customer value in customer service processes.
Next, in Section 2.1, we will review the literature related to studies on the valuation of after-sales service; in Section 2.2, we will review the studies and uses of the RFM model; and in Section 2.3, we will summarise the methodologies used and the need for the use of the proposed RFID model.

2.1. Customer Service Metrics

Customer satisfaction is an important metric in marketing science, and there are countless studies that refer to the need to properly manage the relationship between customer and brand. The following study covers the five key dimensions of service quality measurement: reliability, assurance, tangibility, empathy and responsiveness [17]. An extension of the previous study adapted to the particularities of contact centre [15] identifies the following dimensions as fundamental in the customer–brand relationship process: reliability, empathy, customer knowledge, customer focus, waiting time, user-friendliness and accessibility.
Based on the quality and customer satisfaction model, we can highlight the following metric as one of the most widely used, net promoter score (NPS) proposed by F. Reichheld [18] which uses the value of the customer’s recommendation of the brand as a measure of loyalty. Similar studies to this one includes the customer effort score (CES) [19] which is based on the idea of reinforcing the value of customer interaction in a simple way, prioritising solutions over speed. In the following study [4], the authors highlight that although these metrics have some intuitive power, they lack solid theoretical development, they focus on a specific CES domain or they focus on ad-hoc NPS transactions, underlining that multiple customer feedback metrics predict customer behaviour better than a single metric. Table 1 lists the main studies based on customer experience rating metrics:

2.2. Studies and Uses of the RFM Model

In a customer-oriented RFM process, the objective is to classify customers according to their purchasing behavior. In this way, we can segment the group of customers and initiate marketing actions according to their profile (buyer persona) using CRM as a technological tool and customer journey as a design tool [4]. Therefore, we can discover, for example, the most valuable customers, those we have to incentivize, those who are in danger of abandoning the relationship with the brand, etc. [5].
In recent years, data mining techniques have been used to carry out customer segmentation processes, such as Chi-squared automatic interaction detection (CHAID), logistic regression, and neural networks, etc. However, the trend in marketing environments is to use the RFM model in combination with other models, mainly because of the easy interpretability of the model and the possibility of making explainable decisions [30].
Down below, a review of the different uses and applications of the RFM model in different business settings and other types of organisations will be displayed.
The traditional use of the RFM model helps us to classify customers, either by obtaining the CLV or by acting as a predictor for future customer behaviour. The main studies in this direction can be found in Table 2.
Next, we elaborate on the literature related to the RFM model considering the sector and business case.
The following study [47] proposes an integrated model for the management of bank credit card customers. A neural network was used to segment customers based on repayment behaviour and the RFM model, thus classifying customers into groups from most to least profitable.
In this other study [8], the RFM model was used to segment the customers of a bank so that the CLV of each customer could be calculated by applying k-means clustering.
Outside the business environment, [48] suggested as a key element in the relationship between citizens and public administrations the main objective of getting to know the citizen, encouraging them to participate in public decisions on the services they can consume.
In the following study [49], it was proposed to distinguish customer value based on pre-purchase motivations. The results predict that frequency is the best indicator of customer value, above recency and monetary value.
In a different framework [50], a model to evaluate the power of influence of brand prescribers was exhibited, adapting the RFM model by using a neural network to identify the most active recommenders and evaluating the effectiveness of the model by contrasting it with a product review website.
In another study, [51] presented an approach for the possible detection of fraudulent credit card transactions in online transactions, using RFM to perform the analysis of the customer’s purchase history.
In the healthcare sector, [52] proposed a customer tracking methodology to obtain special clusters and trends, the aim being to detect “potentially loyal” and “potentially disposable” customers, so that loyalty campaigns could be optimised. The proposed model is based on the traditional RFM model, but incorporating an additional variable, L, which defines patient loyalty.
On the other hand, and applied to the world of mobile games, [53] suggested to work on a model for detecting customers with a high predisposition to abandon, using logistic regression analysis within the framework of the RFM model.
A model focused on extending customer loyalty via additional services to the products sold is detailed in the following publication [54], in which the RFM model extended into four specific product-support-service variants is used.
Aimed at the hotel sector, the work carried out by [11] is oriented towards the use of the RFM model, but adapting it and incorporating another criterion to replace the Monetary variable, which they have called Helpfulness (RFH), aggregating the information that users enter in social media by means of a two-tuple.
Hwang and Lee [55] have presented a model focused on the perspective of launching a new product on the market so that we could use the RFM model, but only with the recency and frequency variables of customers website access data. Thus, allowing marketers to find target customers with no purchase history.
As can be seen, the RFM model can be applied to different business and government sectors, where it is necessary to classify the customer, patient or citizen, with the ultimate goal of personalising actions on population segments, identifying customers and analysing their profitability [5].
Table 3 provides an overview of the annotated use cases classified by sectors/policy frameworks.

2.2.1. Advantages and Limitations of the RFM Model

The main advantage of the RFM model is its ease of application, as customer sales data are almost always available. From these transactions, and with the use of the quantifiable variables already mentioned, it is possible to easily explain the groupings in profiles by similar behaviour, to identify the most valuable customers, and to establish individual or group actions [10]. On the other hand, the collection of information is performed through corporate tools such as CRM [56] so that we do not have to carry out large information aggregation processes to obtain results that are understandable to decision-makers [57].
RFM-based approaches have limitations, one of which is the lack of precision. Scores are expressed by n-scales 1 , , n , where n represents the highest contributing coefficient and 1 the lowest. Typically, n = 5 , i.e., quintiles are often used. Furthermore, the importance of each RFM measure depends on the type of company [36] and even on the seasonality of the service. Furthermore, and finally, the model may have biases in the case of customers who have a short lifetime in their relationship with the brand [5].
In the literature review we have not found any study that applies to the business case of classifying customers according to their relationship with the contact centre. As we have seen in Section 2.1, the studies collect customer feedback through satisfaction surveys (CSAT, NPS, CES). That is why we consider RFID modelling to be a fundamental complement to the customer segmentation and evaluation process.

2.2.2. An Extension of the RFM Model

Given the limitations of RFM models, some authors have considered including extensions to the model using the fuzzy two-tuple linguistic model to solve the aforementioned lack of precision [10]. A frequent problem in the application of the model is to determine the weight of each of the variables, which obviously depends on business criteria. Some authors solve this problem by using AHP [32] which allows this type of decision to be made easily by means of pairwise comparisons and consistency checks. Frequently, authors propose the use of clustering algorithms such as k-means after the application of the RFM model [10], k-means is one of the most widely used algorithms in clustering processes [56] providing in our model a segmentation and classification of customers so that a strategy can be defined for each grouping. In the model proposed in this article, these improvements to the original model will be used.

2.3. Summary

As we have seen in the previous sections, the RFM model is applied in several studies to obtain the CLV in sales processes, see Table 2 and Table 3. However, if we want to know the degree of customer satisfaction, we will use survey-based metrics such as NPS and CES, see Table 1. Models based on customer satisfaction are simple to implement but lack a solid theoretical development and focus on a specific area CES or ad-hoc transactions NPS [4], they are based on collecting the customer’s opinion after the service has been provided.
The novelty of the RFID model lies in analysing customer value from the point of view of the contact centre, thus providing a 360° view between customer and brand. In this way, traditional service evaluation models (NPS, CES) can be complemented with the customer value provided by the RFID model through the history of customer interactions with the contact centre, in the same way that the RFM model obtains customer value from the purchases they make.

3. Methodology

The proposed model is based on three important models that will be explained in this section: the two-tuple fuzzy linguistic model, the RFM model and the AHP.

3.1. The Two-Tuple Fuzzy Linguistic Model

The two-tuple model proposed by [58], has the objective of improving the problems of information loss present in the computational processes with linguistic labels. The following is a brief review of the linguistic model of two-tuple representation and its computational model. This model has as its basis of representation a pair of values ( s i , α i ) , where s i   S and α i   0.5 , 0.5 .
Definition 1.
Let S = s 0 , , s g a set of linguistic terms, and β 0 , g a value in the granularity interval of S. The symbolic translation of a linguistic term if its values are a number valued in the interval 0.5 , 0.5 which expresses the difference in information between a quantity of information expressed by the value β 0 , g obtained in a symbolic operation and the nearest integer value, i 0 , , g , which indicates the index of the nearest linguistic label ( s i ) nearest in S.
This representation model defines a pair of functions to perform transformations between numerical values defined in the granularity interval and two-tuple linguistic values to perform the computational processes on two-tuple linguistic values.
Definition 2.
Let S = s 0 , , s g a set of linguistic terms, S = S × 0.5 , 0.5 and β 0 , g a value representing the result of a symbolic operation then the linguistic two-tuple expressing information equivalent to β is obtained using the following function:
Δ S : 0 , g S Δ S β = s i , α i , w i t h i = r o u n d β α = β i , α ϵ 0.5 , 0.5 ,  
where r o u n d · is the visual rounding operator, s i is the label with index closest to β and α is the value of the symbolic translation.
Thus, a value in the interval 0 ,   g is always identified with a two-tuple linguistic value in S .
Definition 3.
Let S = s 0 , , s g a set of linguistic terms and s i , α i ϵ S = S × 0.5 , 0.5 the numerical value in the granularity interval 0 , g representing the linguistic value two-tuple s i , α i is obtained using the function:
Δ S 1   : S     0 ,   g Δ S 1 s i , α i = i + α = β  
Along with the representation model seen above, we can analyse the associated computational model, for which the following operators are defined:
Two-tuple linguistic value comparison operator. Given two two-tuple linguistic values s k , α 1 and s l , α 2 representing quantities of information:
  • If k < l , then s k , α 1 is less than s l , α 2 .
  • If k = l , then
    (a)
    If α 1 = α 2 , then s k , α 1 and s l , α 2 represent the same information.
    (b)
    If α 1 < α 2 , then s k , α 1 is less than s l , α 2 .
    (c)
    If α 1 > α 2 , then s k , α 1 is greater than s l , α 2 .
Negation operator of a two-tuple linguistic value. It is defined as:
n e g s i ,   α = Δ S   g ( Δ S 1 s i , α i )
where g +1 is the cardinality of the set of linguistic labels S.
Aggregation operators for two-tuple linguistic values. Information aggregation consists of obtaining a two-tuple linguistic value that summarises a set of two-tuple values. We describe the aggregation operators that we will use in our model:
Definition 4.
Let ( s 1 , α 1 , ,   s m , α m ) a vector two-tuple linguistic values in S , the linguistic value two-tuple symbolising the arithmetic mean, x ¯ e , is given by the function x ¯ e :   S m     S defined as:
x ¯ e ( s 1 , α 1 , ,   s m , α m ) = Δ S   ( 1 m 1 m Δ S 1 s i , α i ) = Δ S   1 m 1 m β i
Definition 5.
Let ( s 1 , α 1 , ,   s m , α m ) a vector two-tuple linguistic values in S , and ω = ω 1 ,   ,   ω m where ω i 0 , 1 a vector of weights such that 1 m ω i   = 1 , then the linguistic value two-tuple symbolising the weighted mean associated with omega is given by the function F ω S m   :     S defined as:
F ω ( s 1 , α 1 , ,   s m , α m ) = Δ S   ( 1 m ω i   Δ S 1 s i , α i ) .  

3.2. Two-Tuple RFM Model
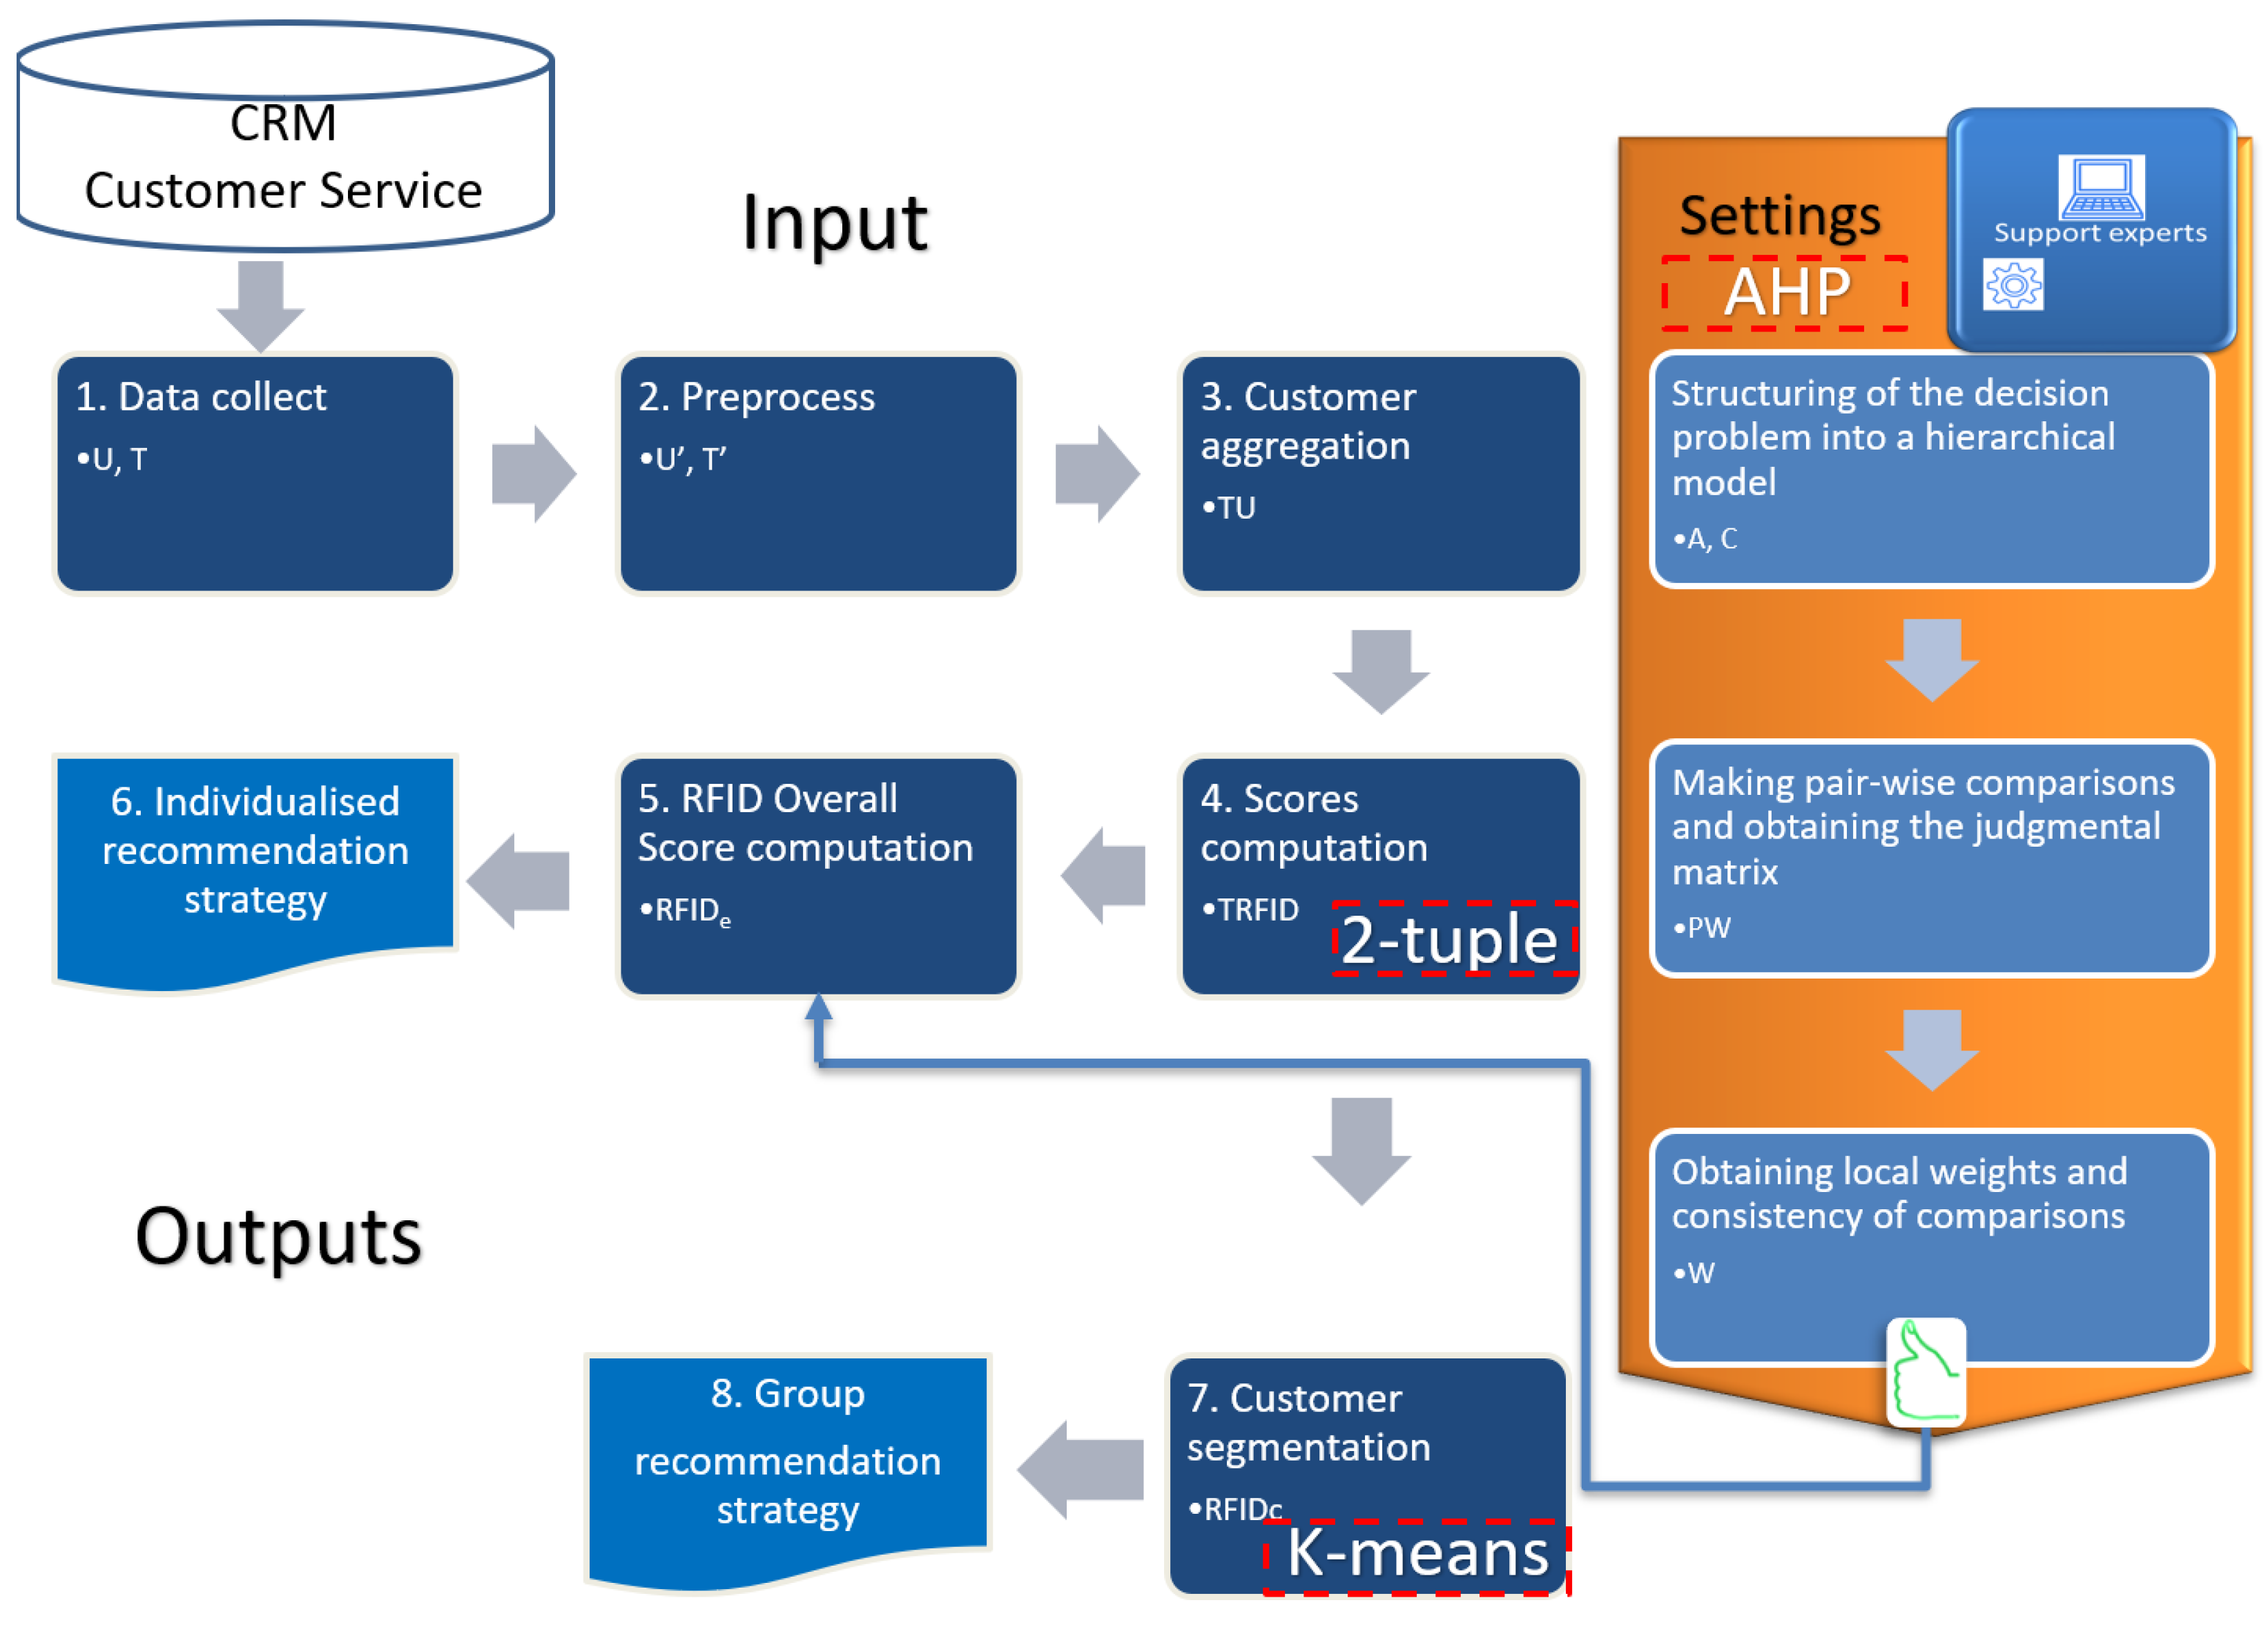
The RFM model follows a methodology that allows us to segment customers according to similar characteristics. It is used to measure recency, frequency and monetary value in customer transactions with the brand.
The idea, therefore, is to categorise each customer by scores based on these three variables [10], typically using quintiles (5 represents the top 20% of customers on that variable and 1 represents the bottom 20%), from which a single score is calculated representing the customer’s value. However, these scores are not very accurate, so in the work by [10] an improvement of the RFM is proposed, which consists of representing these scores using the two-tuple model. The stages of this proposal are explained below:
  • Data collect. Let U = u 1 , , u # U be the set of customers who have made at least one purchase over a pre-established analysis period. Let T = u 1 , d 1 ,   a 1 , , u # T , d # T ,   a # T bet the details of transactions or purchases made by such customers in that period, where the u j U, identifies the customer of such a purchase on the date di for the amount of ai.
  • Customer aggregation. In this phase, T is aggregated, at customer level, obtaining the set T U = u 1 , r 1 ,   f 1 , m 1 , , u # U , r # U ,   f # U , m # U , where re would be the days since the last purchase of such customer ue (using a later fixed reference date for all customer purchases), re is the number of times the customer has purchased, and me contains the total amount of those purchases.
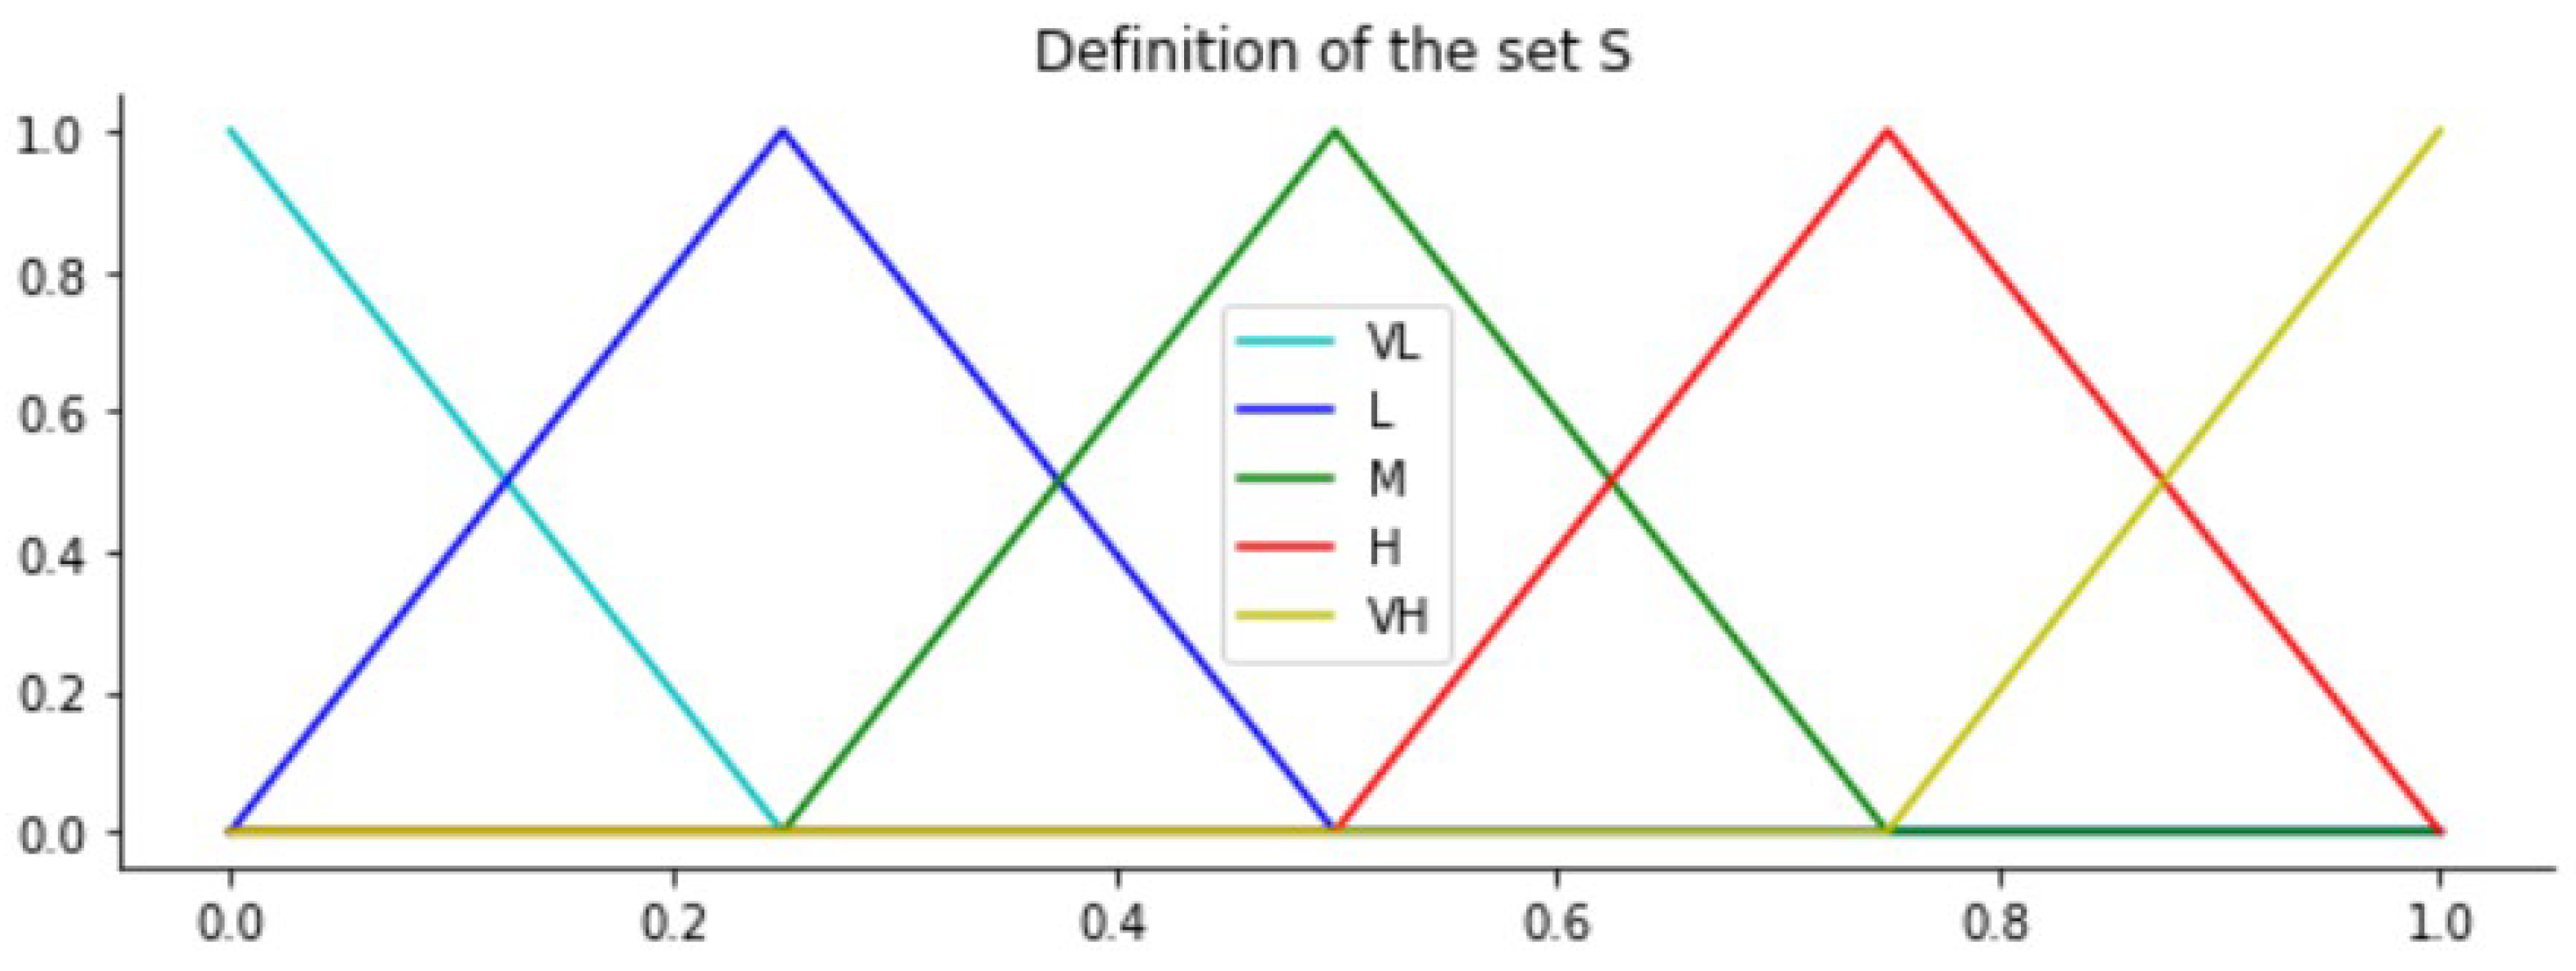
  • Score’s computation. Set R F M = ( u 1 ,   R 1 ,   F 1 , M 1 ,   R F M 1 ) ,     , ( u # U ,   R # U ,   F # U , M # U , R F M # U ) with the two-tuple RFM scores is obtained. First, a symmetric and uniformly distributed domain S using five linguistic labels is defined. These labels have a semantic meaning for the variables of the RFM model referred:
Let be S = s 0 ,   , s T with T = 4 :   s o = V e r y   L o w = V L ,   s 1 = L o w = L ,   s 2 = M o d e r a t e = M , s 3 = H i g h = H , s 4 = V e r y   H i g h = V H , with the definition showed in Figure 1.
Therefore, we have the variables to calculate: R e , F e , M e , R F M e S x 0.5 ,   0.5 . For each customer u e ,   e = 1 , , # U , we obtain A e = A e 1 , A e 2 , A e 3 with A e 1 = R e , A e 2 = F e , A e 3 = M e . Firstly, customers are sorted in ascending order according to each of the individual components B e = B e 1 , B e 2 , B e 3 with B e 1 = r e ,   B e 2 = f e , B e 3 = m e , contained in TU. Now, we define r a n k   1 , , # U as the ranking of each client respect to each of these variables:
p e r c e n t _ r a n k e B e i = r a n k B e i 1 # U 1
with p e r c e n t _ r a n k 0 , 1 ,   e = 1 , , # U and i = 1 , , 3 . The final two-tuple score A e i is obtained as following:
A e i = Δ p e r c e n t _ r a n k B e i , i f   i 1   n e g ( Δ ( p e r c e n t _ r a n k B e i , i f   i = 1
where Δ · and n e g · have been defined in Section 3.1 (Equations (1) and (3)). We use the negation function on recency because the larger scores represent the most recent buyers.
  • RFM Overall Score computation. In this step, the two-tuple  R F M e , which characterizes together the Re, Fe and Me scores, is calculated for each customer using the Equation (5) as R F M e = F ω A e i , with the user-defined weights W = w R , w F , w M previously defined by the marketing experts.

3.3. Analytical Hierarchical Process (AHP)

Among the multi-criteria decision marking models (MCDM) is the method called analytical hierarchical process, AHP [59]. Based on mathematics and psychology, it is designed to solve complex multi-criteria problems.
The main characteristic of the AHP is that the decision problem is modelled by means of a hierarchy in whose upper vertex is the main objective of the problem, the goal to be achieved, and at the base are the possible alternatives to be evaluated. The intermediate levels represent the criteria (which in turn can also be structured in hierarchies) since which the decision is made. The second feature of the method is that, at each level of the hierarchy, comparisons are made between pairs of elements at that level, based on the importance or contribution of each to the higher-level element to which they are linked. Finally, once the contribution of each element to the elements at the next higher level of the hierarchy has been assessed, the overall contribution of each alternative to the main objective or goal is calculated by means of an additive aggregation [59,60].
In our model, we will use the AHP method to establish the weights of each of the criteria that will determine the total score of each customer, after the aggregation and ranking process using the RFM two-tuple model.
A review of the AHP method and its applications can be found in the following references [61,62]. This whole process is detailed in the following sub-sections.

3.3.1. Structuring of the Decision Problem into a Hierarchical Model

The first step of the AHP method is to model the decision problem to be solved as a hierarchy. This fact is one of the main characteristics of the method, hence the term “hierarchical” appears in its name.
It consists of the decomposition of the decision problem into elements, according to their common characteristics, constructing in a visual way a hierarchical model of different interrelated criteria, facilitating their understanding and evaluation. The first level always contains the goal of the problem, G, the second level is constituted by the criteria, this level can be subdivided into sub-criteria, and the last level contains the different alternatives. Thus, in this step we define de alternatives set A = a 1 , , a 1 # A and the hierarchical criteria for assessing them C. C 1 = c 11 , , c 1 # C 1 } , each of these criteria c 1 i   can, in turn, be subdivided into sub-criteria, in several levels, c 1 i j = c 1 i 1 , , c 1 # C i j and so recursively, Figure 2.

3.3.2. Making Pair-Wise Comparisons and Obtaining the Judgmental Matrix

In this step, the opinion of the decision makers is used to compare in pairs, the elements of a particular level with respect to a specific element in the immediate superior level, let P W = p w i j n × n be a pairwise comparison matrix where elements p w i j represent the importance of criterion i over criterion j evaluated by the decision makers, where judgments about the relative importance of one criterion over another with respect to the goal, as well as about the relative importance of one sub-criterion over another with respect to the main dimension, which are represented from the predefined rating scale of numbers of Table 4. Each entry a i j of the judgmental matrix are governed by the three rules: p w i j   > 0; p w i j = 1 p w i j   reciprocal property; and p w i j = 1 for all i.

3.3.3. Obtaining Local Weights and Consistency of Comparisons

The criteria weight vector, W, is built using the eigenvector method through the following equation:
j = 1 n p w i j ω j = λ m a x × ω i  
where λ m a x is the is the maximum eigenvalue of PW and ω is the normalized eigenvector associated to the main eigenvalue of PW [63]. This approach provides the best priority weights for each criterion or sub-criterion. The consistency of the AHP can be checked by the consistency ratio (CR) which is defined as:
C R = C I R I
that is, the division between the consistency index (CI), defined as λ m a x n n 1 and the random consistency index (RI) which represents the consistency of a randomly generated pairwise comparison matrix. If CR ≤ 0.1 the results of the individual hierarchical type are satisfied and coherence is guaranteed, otherwise it will be necessary to adjust the values of the elements of the pairwise comparison, and the judgments should be caused once again by the decision makers up to that are more consistent.

4. RFID Proposed Model
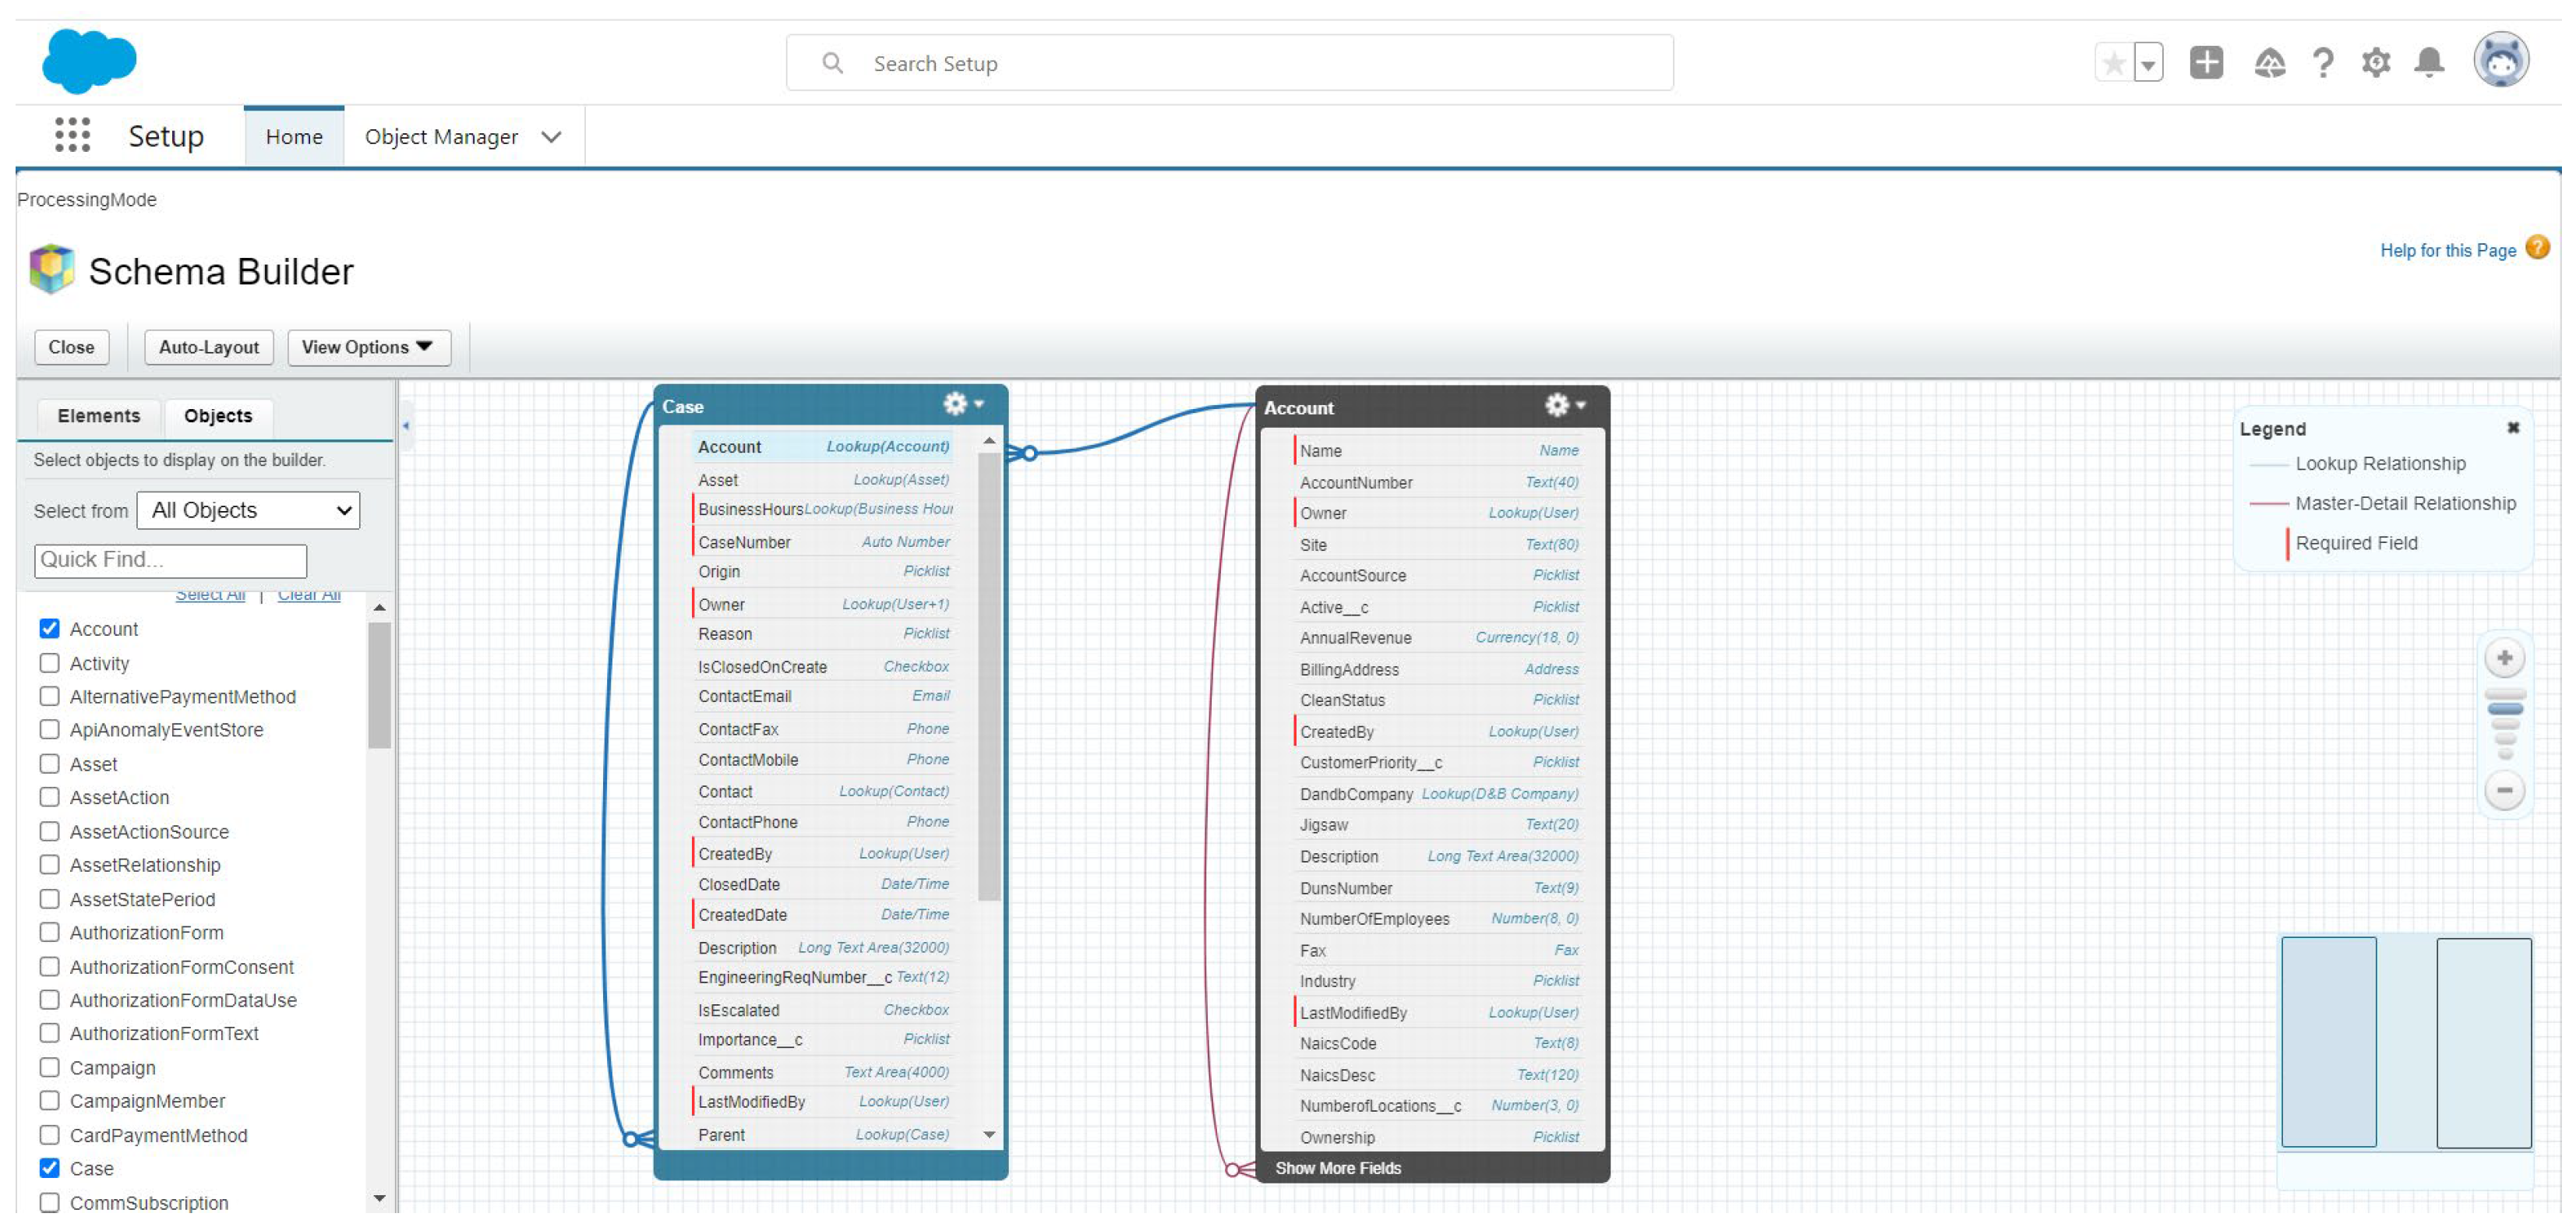
Based on the ticket information stored in a conventional operational CRM, our model obtains two types of recommendations for customers based on their customer service behaviour: individualised and group based. The model is parameterised with the information provided by the customer support experts. These same users are also in charge of determining and implementing the final treatment strategies for customers.
The process we are going is as follows: in Section 4.1, we retrieve the data from the CRM; in Section 4.2, we carry out a pre-processing of the information in which we define the period of analysis; in Section 4.3, we carry out the aggregation process by customer; in Section 4.4, we apply the two-tuple model on the data obtained in the previous step; in Section 4.5, we obtain the global valuation of each customer by applying the AHP model; in Section 4.6, we establish an individual recommendation strategy. If we want to establish a group strategy, starting from the results of Section 4.4, we group the customers according to the k-means model to finally obtain the recommendation strategy by groups.
The proposed model is showed in Figure 3 and each step is explained more detailed below:

4.1. Data Collect

In the CRM terminology, trouble tickets or cases [64] are any kind of customer service requests or complaints as they occur after sales.
Let T = { u 1 ,   t i c k e t _ i d 1 , t i c k e t _ d a t e 1 ,   s t a t u s _ i d 1 , s t a t u s _ d a t e 1 , t r o u b l e _ i d 1 , t i c k e t _ i m p o r t a n c e 1 , , u # T ,   t i c k e t _ i d # T , t i c k e t _ d a t e # T ,   s t a t u s _ i d # T , s t a t u s _ d a t e # T , t r o u b l e _ i d # T , t i c k e t _ i m p o r t a n c e # T }   be the details of these requests, where:
  • t i c k e t _ i d i : is a code that uniquely identifies each trouble ticket requested by the customer u i , with i 1 , , # T .
  • t i c k e t _ d a t e i : is the date on which the service was initially required.
  • s t a t u s _ i d i : is a code that identifies the status of the ticket with respect to its management, e.g., initiated, resolved, cancelled, etc.
  • s t a t u s _ d a t e i : the service required by the customer has a process by which the ticket goes through several states, in this variable the date corresponding to the last state in which the ticket is stored.
  • t r o u b l e _ i d i : identifies the type of request, complaint or trouble the customer has.
  • t i c k e t _ i m p o r t a n c e i : relevance of the ticket which is a standard feature of most CRMs. It is usually expressed on an ordinal and/or linguistic scale of n-values such that the higher the value, the higher the relevance of the ticket. In this article we will consider that the scale has five values very low, low, moderate, high, very high. As it is a linguistic scale, we will consider modelling it with the set S.
In Figure 4, the details of a new ticket are presented in the Salesforce CRM tool, a correspondence between fields is established, c a s e n u m b e r = t i c k e t _ i d , d a t e / t i m e o p e n e d = t i c k e t _ d a t e , s t a t u s = s t a t u s _ i d , l a s t m o d i f i e d = s t a t u s _ d a t e , t y p e = t r o u b l e _ i d , i m p o r t a n c e = t i c k e t _ i m p o r t a n c e   a n d   a c c o u n t = u i .

4.2. Preprocess

Given a time period, t, for analysis enclosed by the dates t 1   and t 2   with t 1 < t 2 , at this stage it is necessary to identify the actual service requests from customers to be analysed. Thus, we need to identify all tickets from the set T within the analysis period t, i.e., their status_datei belongs to that period t, that do not correspond to final contract cancellation requests as we consider them to be customers that can no longer be managed. This is easy because the tickets contain a field that categorizes its type, i.e., trouble_idi
We represent this set as T = { u 1 ,   t i c k e t _ i d 1 , t i c k e t _ d a t e 1 ,   s t a t u s _ i d 1 , s t a t u s _ d a t e 1 , t r o u b l e _ i d 1 , t i c k e t _ i m p o r t a n c e 1 , ,   u # T ,   t i c k e t _ i d # T , t i c k e t _ d a t e # T ,   s t a t u s _ i d # T , s t a t u s _ d a t e # T , t r o u b l e _ i d # T , t i c k e t _ i m p o r t a n c e # T }   bet the details of these requests made by such customers in that period t.

4.3. Customer Aggregation

We represent the set of customers as U = { u 1 , , u # U ] , such that each of them has made at least one service request over a pre-established analysis period t, in other words, they are the different customers contained in the set T′. In this phase, T′ is aggregated at this customer level u e , e 1 , , # U , considering the different tickets ticket_idi for that customer in such set T′. Thus, we obtain the set T U = u 1 , r 1 , f 1 , i 1 , d 1 ,   , u # U , r # U , f # U , i # U , d # U where:
  • re: it is the days since the last request for service of such customer ue (using as a reference the end date of the analysis period). Therefore r e = d i f f d a y s t 2 m a x t i c k e t _ d a t e i , where diffdays is a function that returns the difference in days between two dates, and max is a function that return the last date of the different dates of entry.
  • fe: it is the number of times the customer has made a service request, i.e., with different ticket codes ticket_idi.
  • ie: it is the average importance. As it is a linguistic variable this value is calculated for each customer using the Equation (4) as ie = x ¯ e t i c k e t _ i m p o r t a n c e i .
  • de: contains the total duration in days of all customer’s tickets. Therefore, d e = i   ( d i f f d a y s   s t a t u s _ d a t e i t i c k e t _ d a t e i .

4.4. Scores Computation

In this step, the set T R F I D = u 1 , R 1 ,   F 1 , I 1 , D 1 , , u # U , R # U ,   F # U , I # U , D # U with the two-tuple scores is obtained.
Therefore, we have the variables to calculate: R e , F e , I e , D e S × 0.5 , 0.5 . For each customer u e , we obtain A e = A e 1 , A e 2 , A e 3 , A e 4 with A e 1 = R e ,   A e 2 = F e ,   A e 3 = I e , A e 4 = D e . Firstly, customers are sorted in ascending order according to each of the individual components B e = B e 1 , B e 2 , B e 3 , B e 4 , with B e 1 = r e ,   B e 2 = f e ,   B e 3 = i e , B e 4 = d e contained in TU. With e 1 , , # U and i 1 , , 4 , the final two-tuple score A e i is obtained as following:
A e i = Δ p e r c e n _ r a n k B e i , i f   i = 2 ,   4       B e i ,   i f   i = 3                                                                                         n e g ( Δ ( p e r c e n t _ r a n k B e i , i f   i = 1
where Δ · and n e g · have been defined Equations (1) and (3) respectively and percent_rank in Equation (6). We use the negation function on recency because the larger scores represent customers with more recent requests.

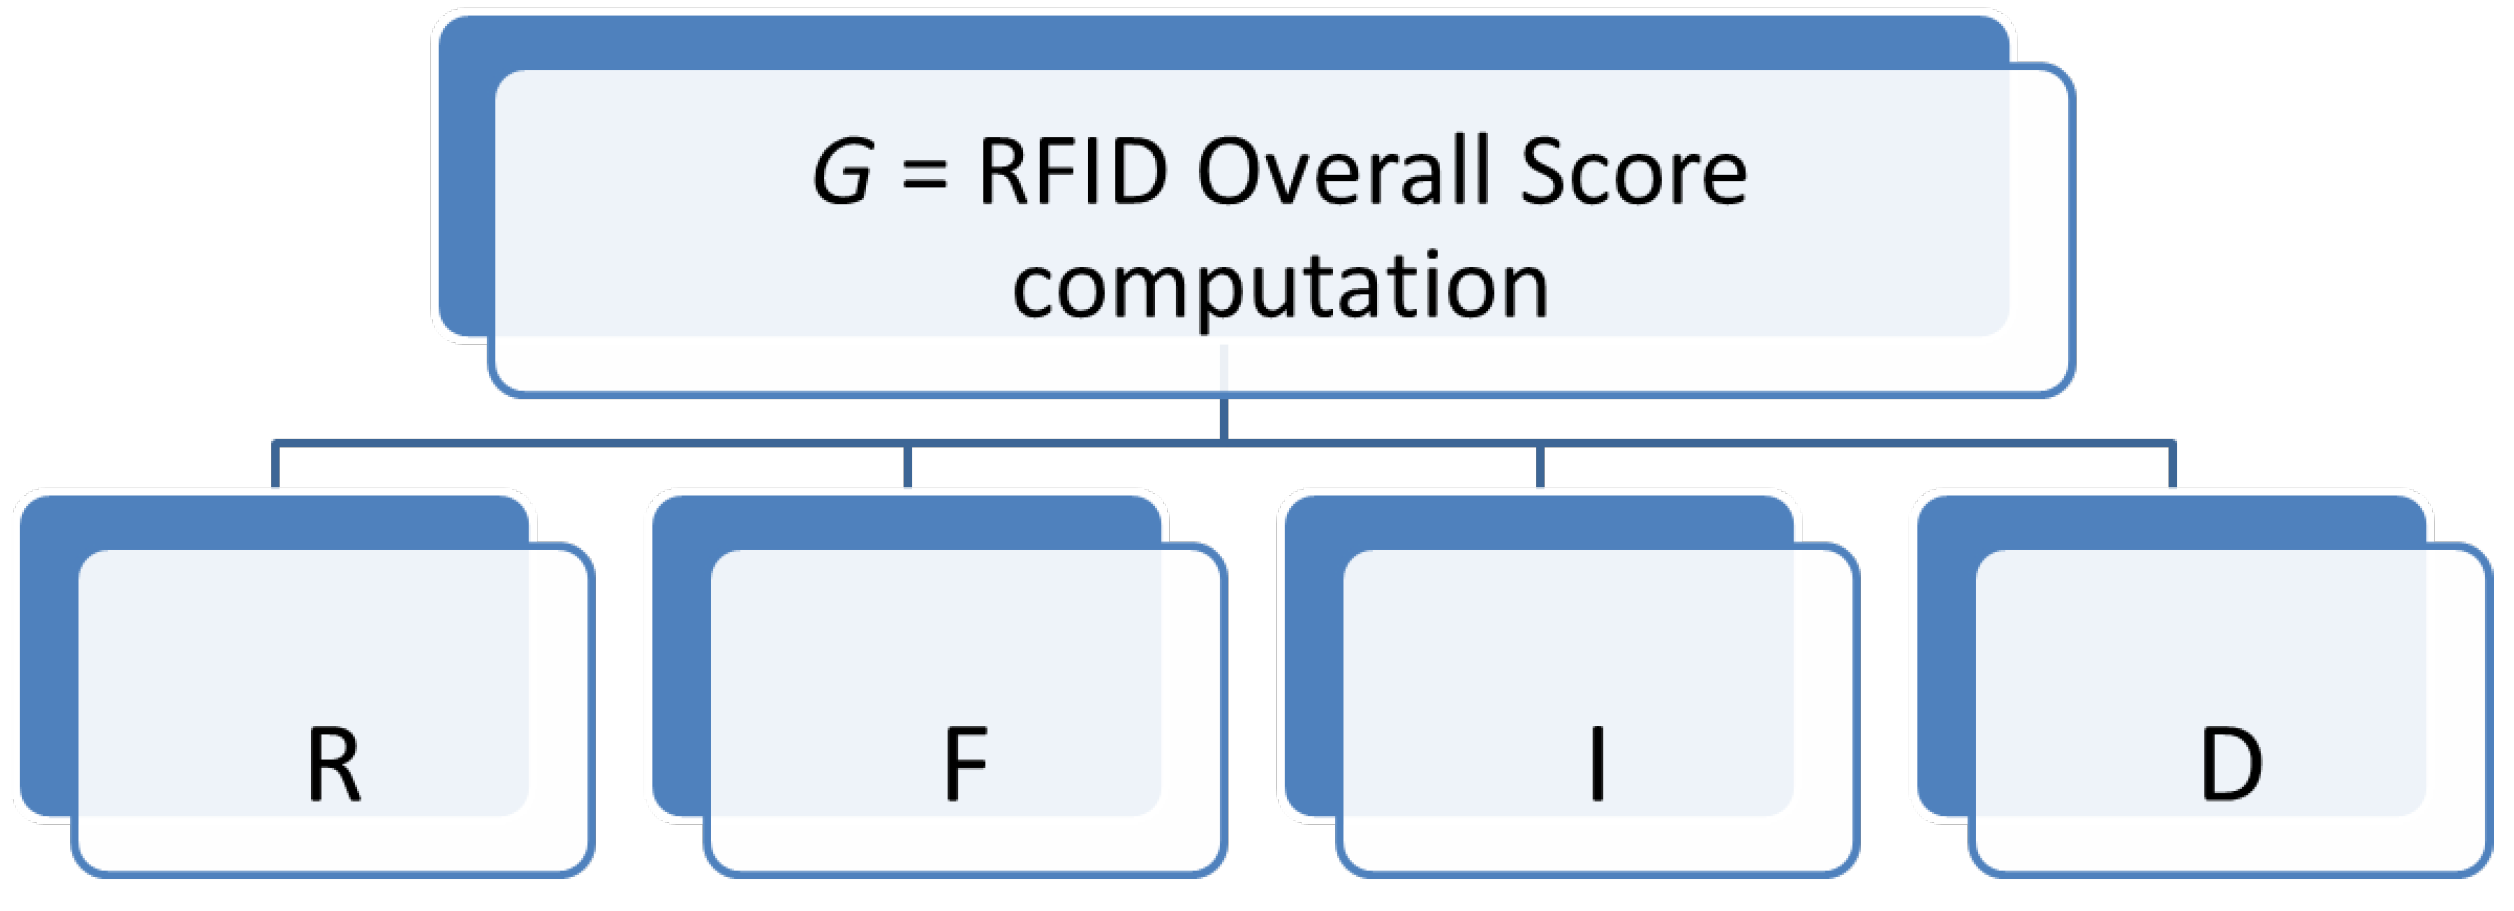
4.5. RFID Overall Score Computation

In this step, the two-tuple  R F I D e , which characterizes together the R e , F e , I e , D e scores, is calculated for each customer using the Equation (5) as R F I D e = F ω A e i , with the user-defined weights W = w R , w F , w I , w D obtained from the information provided by the customer service experts.
As other authors have suggested [11], we propose the use of the AHP model introduced in Section 3.3. We follow the typical phases of this process:

4.5.1. Structuring of the Decision Problem into a Hierarchical Model

In order to structure the MCDM it is necessary to define the available alternatives and the required criteria. The criteria (C) and alternatives (A) are the RFID score variables: A = {R, F, I, D}. Figure 5 shows the hierarchy of the proposed AHP model.

4.5.2. Making Pair-Wise Comparisons

The customer service experts fill in the pairwise matrix, PW, corresponding to the criteria of the hierarchical model—C, expressing the relative importance of each RFID variable over others in order to compute the overall score computation at customer level.

4.5.3. Obtaining Local Weights and Consistency of Comparisons

To ensure the coherence of the given matrix, their CR (Equation (8)), must be lower or equal than 0.1. If the CR is not good enough, it will be considered that the business specifications do not meet their quality criteria, that is, they may contradict each other. Once the consistency is checked, the weight of each criterion is calculated as we defined in Section 3.3.3 (Equation (7)). The weights for each of the RFID alternatives are expressed as follows: W = w R , w F , w I , w D .

4.6. Individualized Recommendation Strategy

In a customer-centric management model, it is essential to take into account the after-sales support requested by customers [65,66].
Using R F I D e S x 0.5 , 0.5 , calculated in the previous stage, it is possible to characterize and manage each customer individually, based on all the services required by them. It should be noted that it is a two-tuple value that allows for easy interpretation, while allowing for high measurement precision. This high accuracy also allows us to rank customers in such a way that we can prioritize those with the highest value for management and monitoring.

4.7. Customer Segmentation

The objective of this phase is to obtain homogeneous groups of customers based on RFID variables that allow common strategies to be established for each of them. For this purpose, we will use the most commonly used clustering algorithm in machine learning, i.e., k-means. Some of its advantages are [67]: low complexity, computationally fast and ability to handle large data sets (has even been adapted for big data problems [68]). The use of this algorithm has the additional advantage that it has been adapted for the two-tuple model [69]. Some of the main disadvantages are [67]: sensitive to outliers and to scale of the data set. In our case, this will not be a problem since the scale is always expressed in the two-tuple model and also, since it is based on ranking (see Equation (9)), it will hardly generate outliers.
In this step, the set R F I D c = c 1 , , c # U , where each c e 1 , , # c   identifies the cluster to which each customer u e belongs. The input variables to the segmentation algorithm are two-tuple values, this case has already been solved by other authors [69]. Based on this approach, the values of these centroids will be expressed using the two-tuple model, thus we get a better linguistic interpretability. In order to apply the algorithm, we use the Euclidean distance dec between a client and a cluster centroid following:
d e c = i = 1 4 ( Δ 1   A e i ( Δ 1   v c i ) 2
for each customer u e , e 1 , , # U , for each cluster with the centroid v c = v c 1 , v c 2 , v c 3 , v c 4 , c 1 , , # c . In each step of the k-mean algorithm, we recalculate the new cluster centroid using the Equation (4): v c = A ¯ v c 1 , A ¯ v c 2 , A ¯ v c 3 , A ¯ v c 4 .
A typical problem when using k-means is the selection of the optimal number of groups [67], #c. In this article we will use an eclectic approach, using several methods for this purpose, synthesized in [70].

4.8. Group Recommendation Strategy

As the different clusters obtained are easily interpretable as they are described with the two-tuple linguistic model, customer service experts can establish different treatment strategies for customers belonging to these segments.

5. Proposed Model Applied to Telecom Industry

In this section, we present an example of an application of our RFID model, explained in the above section, using the CRM information of a multinational service company with regarding to the part of its business located in Spain.

5.1. Data Collect

Ticket information is managed by the company in an operational CRM developed by the company itself. Although in-depth details about such a CRM have not been provided to us, its structure is quite conventional and analogous in its data model to other CRMs such as the one presented in Figure 6. Therefore, to obtain the set T, the following specifications are used:

5.2. Preprocess

The time period, t, for analysis is enclosed by the dates t 1 = 1   A p r i l   2019   and t 2 = 30   A p r i l   2019 . Based on information from the CRM contained in T, we obtain all the trouble tickets that have been managed during this period t, i.e., s t a t u s _ d a t e i   t 1   a n d   t 2 . As mentioned above, only tickets that do not correspond to customer cancellations are selected, using t r o u b l e _ i d i .
Under these conditions we obtain T′ with a total number of tickets of 13619, i.e., # T = 13619 . An extract from this table is shown in Table 5 with several selected clients for whom we will follow the whole process.

5.3. Customer Aggregation

We group the different customers in T′, giving a total of 6789, i.e., # U = 6789 . Thus, we obtain the set TU with the specifications mentioned above. An extract from this set is shown in Table 6.

5.4. Scores Computation

The set TU at this stage is used to obtain the TRFID set as explained in the previous section. RFID contains the basic variables of this new model. In Table 7, we present an extract from this set for the same customers as shown in Table 6.

5.5. RFID Overall Score Computation

At this stage, the importance of each of the variables in the RFID model must be obtained before calculating the RFID overall score of the customer. For this, as mentioned above, the AHP model will be used. The consulted expert has specified the following matrix using the Saaty’s scale (Table 4):
PW = R F I D R 1 7 3 5 F 1 / 7 1 1 / 5 1 / 5 I 1 / 3 5 1 3 D 1 / 5 5 1 / 3 1
Only when CR ≤ 0.10 (see Equation (8)) the results of the individual hierarchical type are satisfied, and coherence is guaranteed. In this case, CR = 0.091 therefore the results are valid for the model.
The final weights calculated are W = w R = 0.556 , w F = 0.259 , w I = 0.136 , w D = 0.049 . Therefore, the expert has attached the greatest importance to the recency of the tickets, followed by its frequency and relevance. The overall duration of its resolution is the least important.
As mentioned above, with this W we obtain the RFID overall score for each customer. In Table 8 we present the results for the same customers as shown in Table 5.

5.6. RFID Overall Score Computation

The RFID overall score allows to quantify how carefully the service to these customers should be managed. As an example, Table 9 shows the company’s most valuable RFID customers. As can be seen, those with a very high recency and frequency predominate, as these are the variables with the greatest weight in W. It should be noted that the use of the two-tuple model allows for high linguistic interpretability as well as high precision in the results.
All these customers should be given special attention in their interaction with the contact centre, for example, Customer 23420561 has an overall score R F I D = V H , 0.087 , which gives them a very high importance for the company, with very high recency and frequency values.

5.7. Customer Segmentation

As commented, the RFID variables are expressed in the two-tuple model, which allows for easy interpretation and can be computed without loss of information. However, in this phase, in order to follow the conventional segmentation process, we will work with these variables converted to a numerical scale using the Δ 1 function (Equation (2)).
Therefore, as all variables are on the same scale, no additional normalisation process is necessary. Nevertheless, a study of the correlations between variables is necessary, since a high correlation between them indicates the unsuitability of using a Euclidean distance, which is the one used by the k-means algorithm. Figure 7 shows the Pearson correlation matrix. The highest correlation is between recency and duration with 0.3, which can be considered non-significant.
As mentioned above, to solve the typical problem of obtaining the optimal number of segments, we will use the method proposed in [70]. This method offers the user the best clustering scheme (i.e., better k) among different results after using different indexes. The final number of clusters is proposed based on most indices. After application in R language (using the NbClust package to determine the optimal number of clusters between 6 and 12) the summary of the different algorithms for determining the optimal number of segments is showed in Table 10. As can be observed in Figure 8, most algorithms determine that the optimal number of clusters is 8. Therefore, in our case # c = 8 . Although we have applied an automatic method of terminating the number of clusters, it should be noted that it is common to also consider business criteria in the determination of the final clustering. In this way, we have also tried segmentation by changing the value of k and we were also satisfied with the one that obtained eight clusters.
Once the k-means algorithm has been applied, using the Euclidean distance (see Equation (10)) the results are shown in Table 11.

5.8. Group Recommendation Strategy

The clustering results, summarised in Table 11, are obtained after applying the Δ 1 function (Equation (2)) to each of the variables in the TRFID set. This has allowed for a more accurate process than is typically applied in traditional RFM models. However, to better understand clusters it is preferable to use the linguistic representation of them. This is achieved by applying the corresponding ∆ function (Equation (1)) to the centroids, see Table 12.
To support this information, Figure 9 shows the distribution of all segmented customers by each of the variables used in this segmentation.
Table 13 depicts the recommendation strategies by customer profile, each grouping responding to a profile with the segment distribution observed in Figure 9. The recommendation metrics to be used in future two-way customer-brand interactions should be based on providing the highest quality of service with the objective of obtaining maximum customer satisfaction [15,71,72,73].
Based on the previous premise, the main objective of recommendation strategies by profile will be to personalise the customer’s interaction with the brand, analysing the level of personalisation in interactions with the contact centre and thus connecting better emotionally with customers [4,74].
We try to ensure that the customer groups that need personalised attention, that is, the groups that we consider critical (strongcustom, custom) receive this personalised attention in the next interaction with the contact centre. Further, the groups that we do not consider so critical (selfcustom, self) can manage themselves autonomously or through a bot.
Table 14 shows the final segment assigned to the customers shown in Table 5, Table 6, Table 7 and Table 8.
In Table 14, eight different customers are evaluated, explaining their belonging to the cluster profiles defined in Table 13. Based on their cluster, we can consider, among other actions to be taken in the interaction between customer and brand, measuring the degree of personalisation in subsequent interactions and defining marketing actions appropriate to the profile.
Customer profile—21046586 fits Cluster 5, as it is a customer with the following individual assessment, R = M , 0.087 , F = V H , 0.035 , I = L , D = V H , 0.002 . Therefore, they are a customer with very high and frequent incidents, the recency is moderate and with a low importance value, see Table 7. The type of attention will be personalised.
The customer profile—21334657 fits Cluster 2, as it is a customer with the following individual assessment: R = H , 0.026 , F = H , 0.008 , I = M , D = V H , 0.024 . Therefore, they are a customer with very high duration and frequent incidents, the recency is very high and with a medium value of importance, see Table 7. This customer profile is considered of critical relevance for the brand and will be attended to in a personalised way.
The profile of Customer 2288774 fits Cluster 3, as it is a customer with the following individual assessment: R = V L , 0.085 , F = V L , I = M , D = V H , 0.12 . Thus, they are a customer with very infrequent incidents of very high duration, the recency is very low and with an average value of importance, see Table 7. This customer profile has not given the brand many problems, they are loyal customers who had initial problems linked to the implementation processes, in the following customer interactions with the contact centre, it is recommended to use self-help bot and in the case of requiring personalisation, they would switch to a free agent.
The customer profile 24583147 fits Cluster 6, as it is a customer with the following individual assessment: R = L , 0.086 , F = V L , I = V L , D = L , 0.12 . Therefore, they are a customer with low duration and very infrequent incidents, the recency is low and with a very low value of importance, see Table 7. This customer profile, as in the previous case, has not given the brand many problems. In the following customer interactions with the contact centre, it is recommended to use the self-help bot, and to look for a self-response in the interaction with the customer.
Customer Profile 25860618 fits Cluster 4, as it is a customer with the following individual assessment: R = M , 0.003 , F = V H , 0.065 , I = M , 0.05 , D = L , 0.009 . Hence, this is a customer with very frequent incidents of low duration, the recency is medium, as is the importance, see Table 7. With this customer profile, although the recency and importance value are medium, special care must be taken in subsequent customer interactions with the contact centre to personalise communication by means of generalist and, if necessary, specialised agents.
Customer Profile 25864456 fits Cluster 1, as it is a customer with the following individual assessment: R = V L , 0.085 , F = M , 0.01 , I = V H , D = V L , 0.098 . Therefore, they are a customer with very low duration and moderate frequency incidents, the recency is very low, and the importance very high, see Table 7. This customer profile corresponds to customers with very important incidents in the past. In subsequent customer interactions with the contact centre, it is recommended to use self-help bot, and if customisation is required because the customer demands it, it could be changed from an automatic channel to a customised and even specialised one.
The customer profile—26053204 fits Cluster 7, as it is a customer with the following individual assessment: R = V H , 0.097 , F = V L , I = V L , D = V L , 0.038 . Therefore, it is a customer with incidents of very low duration, importance and frequency, and the recency is very high, see Table 7. This customer profile corresponds to loyal customers with few, although recent, problems, which is why it is important that if the frequency value is increased, the customer is directed towards a personalised service.
The customer profile 26064419 fits with Cluster 8, as it is a customer with the following individual assessment, R = V H , 0.025 , F = H , 0.008 , I = L , D = V L . Thus, it is a customer with incidents of low duration and importance, high frequency, and recency, see Table 7. This customer profile corresponds to loyal customers with frequent and recent problems, it is, therefore, important to direct the customer towards a personalised service.

6. Discussion

The data that we have worked on in the previous sections come from a company that implements telecommunications services. As a conclusion to this study, and applied to this company, by analysing the volume of data, we can see that the opening and closing times of tickets is high and is mainly due to the implementation processes of 4G technology in rural environments, where the periods of the implementation processes and reach optimal coverage levels are high.
The working model we have used allows us to have an individual classification of customers according to the criteria defined in the relationship between the customer and the contact centre, RFID. For this we have adapted the RFM model, widely used in marketing for its simplicity of use and ease of interpretation, into an environment other than the traditional one, in this case customer service. In addition, with the aim of improving the model and based on previous work [75] in which the two-tuple model is applied to solve the problem of the RFM model’s lack of precision, we have also used the AHP methodology to give weight to each of the variables that make up the model and thus obtain an overall score for each customer. In parallel, we have provided the model with an additional argument, i.e., the possibility of classifying customers using k-means.
We have obtained two types of results, the first one helps us to establish an individual classification strategy with each customer according to the criteria defined in the RFID model, which will help us to quantify the care with which each customer’s attention must be managed individually according to their classification, see Table 9. In a typical operation, the agent in charge of managing that interaction recognises the customer and, therefore, recommendations can be established based on their history of relationship with the brand, not only by what they buy (RFM), but also by the history of the RFID service received.
Furthermore, on the other hand, we have proceeded to segment customers by applying k-means so that we are able to apply group actions by customer profile. In this case, we have focused on using these groupings to establish scenarios from lowest to highest cost in the process of customer interaction with the brand, i.e., we try to ensure that the customer groups that need personalised attention, that is, the groups that we consider critical (strongcustom, custom) receive this personalised attention in the next interaction with the contact centre. The brand image perceived by the user grows considerably with this type of interaction [71]. In addition, on the other hand, the groups that we do not consider so critical (selfcustom, self) can manage themselves autonomously or through a bot, thus, the cost of the interaction is lower, and the brand image does not suffer, see Table 13.
Finally, we have given some recommendations about the campaigns that could be more effective: considering customer segmentation, seeking loyalty between customer and brand for clusters susceptible to abandonment, rewarding the most loyal customers to contribute to generating brand image through content and, as always, using the leverage of offers and promotions.
For practical purposes, we have evaluated different customers in each cluster and analysed the actions that could be taken from a contact centre perspective, see Table 14. Basically, based on the value of the cluster, we have recommended personalisation actions and possible campaigns in an omnichannel environment.
It is at the discretion of the contact centre manager to use one model or the other, or both. With the aim of establishing strategies that help in the process of customer brand loyalty, since the evaluation that a customer makes of the brand not only depends on the product or service it provides, but also depends on additional factors such as personalisation, attention through multiple communication channels and excellence in the services provided [71].
The developed model can be applied to different industries, in business to business (B2B) or business to customer (B2C) models where the contact centre becomes a fundamental element in the relationship between customer and brand. Sectors such as tourism, professional services, manufacturers, insurance companies, banks, retailers, public entities, hospitals, and health centres have CRM tools that are integrated with the contact centre. If in an interaction between customer and brand, the agent who handles the management has an adequate assessment of the customer, the agent can understand and personalise the communication. If we also equip the system with an artificial intelligence (AI) model, the system will be able to recommend the best actions for the profile of the customer the agent is dealing with. Furthermore, and finally, we use customer aggregated value for queue management in the contact centre.

7. Conclusions and Future Work

In conclusion, it should be noted that this work has developed a completely new model of customer evaluation through their relationship with the contact centre, RFID. This model can be added to the RFM model and thus obtain aggregated results of customer evaluation through the different points of interaction between customer and brand (sales and after-sales), with the advantage that all the information processed by the model can be found in the usual customer management systems of any company, CRM, and is therefore, applicable to any industry. This will help us to have a better knowledge of the customer, and therefore, to develop and implement actions that tend to contribute to the enrichment of the brand image.
The use of the two-tuple model has allowed us to calculate the score of the RFID model with greater precision, as well as to obtain a better linguistic interpretation of each customer’s score. The use of k-means has also permitted us to perform a clustering of customers, and to establish group strategies for both personalisation and campaign development. Finally, thanks to the use of AHP, it has been possible to determine the weight of each of the variables of the RFID model in a simple way and with a consistency check according to the business information.
As an example, we have applied the implemented model to a dataset from a company in the telecom sector, verifying the advantages of adding the new model to the traditional CLV calculation model, using RFM.
As future work, we propose to extend the model to any industry, focusing on retail, insurance, banking, service provision and software manufacturers. In addition, we propose to enrich the customer engagement value (CEV) model developed by [76], incorporating RFID as another element to be taken into account. On the other hand, the model can help to elaborate user profiles (customer, patient, citizen), incorporating AI algorithms and contribute to personalise communication with the user. Further, and finally, a fundamental part is to consolidate the model with what customers think, i.e., to contrast the model with customer satisfaction, NPS.

Author Contributions

Conceptualization, G.M.D. and R.A.C.; methodology, G.M.D. and R.A.C.; software, G.M.D. and R.A.C.; validation, G.M.D., R.A.C. and D.G.; formal analysis, G.M.D. and R.A.C.; investigation, G.M.D.; resources, G.M.D., R.A.C. and D.G.; data curation, G.M.D. and R.A.C.; writing—original draft preparation, G.M.D.; writing—review and editing, G.M.D., R.A.C. and D.G.; visualization, G.M.D.; supervision, D.G. and R.A.C.; project administration, G.M.D. and R.A.C.; funding acquisition, Not applicable. All authors have read and agreed to the published version of the manuscript.

Funding

This research has been partially supported by the Government of Spain, Grant Plan Nacional de I+D+i, MTM2015-70550-P, PGC2018096509-B-I00.

Institutional Review Board Statement

Not applicable.

Informed Consent Statement

Not applicable.

Conflicts of Interest

The authors declare no conflict of interest.

References

  1. Oztemel, E.; Gursev, S. Literature review of Industry 4.0 and related technologies. J. Intell. Manuf. 2020, 31, 127–182. [Google Scholar] [CrossRef]
  2. Ali, A. Here’s What Happens Every Minute on the Internet in 2020. 2020. Available online: https://www.visualcapitalist.com/every-minute-internet-2020/ (accessed on 23 July 2021).
  3. Kumar, V.; Rajan, B.; Gupta, S.; Pozza, I.D. Customer engagement in service. J. Acad. Mark. Sci. 2019, 47, 138–160. [Google Scholar] [CrossRef]
  4. Lemon, K.N.; Verhoef, P.C. Understanding Customer Experience Throughout the Customer Journey. J. Mark. 2016, 80, 69–96. [Google Scholar] [CrossRef]
  5. Wei, J.; Lin, S.; Wu, H. A review of the application of RFM model. Afr. J. Bus. Manag. 2010, 4, 4199–4206. [Google Scholar]
  6. Hughes, A.M. Strategic Database Marketing; Probus Publishing: Chicago, IL, USA, 1994. [Google Scholar]
  7. Shih, Y.-Y.; Liu, C.-Y. A method for customer lifetime value ranking—Combining the analytic hierarchy process and clustering analysis. J. Database Mark. Cust. Strat. Manag. 2003, 11, 159–172. [Google Scholar] [CrossRef] [Green Version]
  8. Sohrabi, B.; Khanlari, A. Customer Lifetime Value (CLV) Measurement Based on RFM Model. Iran. Account. Audit. Rev. 2007, 14, 7–20. [Google Scholar]
  9. Khajvand, M.; Zolfaghar, K.; Ashoori, S.; Alizadeh, S. Estimating customer lifetime value based on RFM analysis of customer purchase behavior: Case study. Procedia Comput. Sci. 2011, 3, 57–63. [Google Scholar] [CrossRef] [Green Version]
  10. Carrasco, R.A.; Blasco, M.F.; García-Madariaga, J.; Herrera-Viedma, E. A Fuzzy Linguistic RFM Model Applied to Campaign Management. Int. J. Interact. Multimed. Artif. Intell. 2019, 5, 21. [Google Scholar] [CrossRef] [Green Version]
  11. Bueno, I.; Carrasco, R.A.; Porcel, C.; Kou, G.; Herrera-Viedma, E. A linguistic multi-criteria decision making methodology for the evaluation of tourist services considering customer opinion value. Appl. Soft Comput. 2021, 101, 107045. [Google Scholar] [CrossRef]
  12. Payne, A.; Frow, P. The role of multichannel integration in customer relationship management. Ind. Mark. Manag. 2004, 33, 527–538. [Google Scholar] [CrossRef]
  13. Kumar, V.; Reinartz, W. Customer Relationship Management: Concept, Strategy, and Tools LK, 3rd ed.; Springer: Berlin/Heidelberg, Germany, 2018; 411p, Available online: https://ucm.on.worldcat.org/oclc/1050446648 (accessed on 2 July 2021).
  14. Verhoef, P.C. Understanding the Effect of Customer Relationship Management Efforts on Customer Retention and Customer Share Development. J. Mark. 2003, 67, 30–45. [Google Scholar] [CrossRef]
  15. Van Dun, Z.; Bloemer, J.; Henseler, J. Perceived customer contact centre quality: Conceptual foundation and scale development. Serv. Ind. J. 2011, 31, 1347–1363. [Google Scholar] [CrossRef]
  16. Abdullateef, A.O.; Sanuri, S.; Mokhtar, M.; Yusoff, R.Z. The impact of CRM Dimensions on Call Center Performance. OR Spectr. 2010, 10, 184–194. Available online: http://proquest.umi.com/pqdweb?did=669649341&Fmt=7&clientId=65345&RQT=309&VName=PQD (accessed on 23 July 2021).
  17. Parasuraman, A.; Zeithaml, V.A.; Berry, L.L. A Conceptual Model of Service Quality and Its Implications for Future Research. J. Mark. 1985, 49, 41. [Google Scholar] [CrossRef]
  18. Reichheld, F.F. The one number you need to grow. Harv. Bus. Rev. 2003, 81, 46–54. Available online: www.hbr.org (accessed on 15 June 2021). [PubMed]
  19. Dixon, M.; Freeman, K.; Toman, N. Stop trying to delight your customers. Harv. Bus. Rev. 2019, 88, 7–8. [Google Scholar]
  20. Gupta, S.; Zeithaml, V. Customer Metrics and Their Impact on Financial Performance. Mark. Sci. 2006, 25, 718–739. [Google Scholar] [CrossRef] [Green Version]
  21. An Doorn, J.; Leeflang, P.S.; Tijs, M. Satisfaction as a predictor of future performance: A replication. Int. J. Res. Mark. 2013, 30, 314–318. [Google Scholar] [CrossRef]
  22. De Haan, E.; Kannan, P.K.; Verhoef, P.C.; Wiesel, T. The Role of Mobile Devices in the Online Customer Journey; Marketing Science Institute Report No. 15–124; 2015; pp. 1–56. Available online: https://www.msi.org/working-papers/the-role-of-mobile-devices-in-the-online-customer-journey/ (accessed on 16 June 2021).
  23. De Keyser, A.; Lemon, K.N.; Klaus, P.; Keiningham, T.L. A Framework for Understanding and Managing the CX. Work. Pap. Ser. 2015, 15, 1–47. [Google Scholar]
  24. Grewal, D.; Levy, M.; Kumar, V. Customer Experience Management in Retailing: An Organizing Framework. J. Retail. 2009, 85, 1–14. [Google Scholar] [CrossRef]
  25. Morgan, N.A.; Rego, L.L. The Value of Different Customer Satisfaction and Loyalty Metrics in Predicting Business Performance. Mark. Sci. 2006, 25, 426–439. [Google Scholar] [CrossRef] [Green Version]
  26. Korneta, P. Net promoter score, growth, and profitability of transportation companies. Int. J. Manag. Econ. 2018, 54, 136–148. [Google Scholar] [CrossRef] [Green Version]
  27. Rocks, B. Interval Estimation for the “Net Promoter Score”. Am. Stat. 2016, 70, 365–372. [Google Scholar] [CrossRef] [Green Version]
  28. Baehre, S.; O’Dwyer, M.; O’Malley, L.; Lee, N. The use of Net Promoter Score (NPS) to predict sales growth: Insights from an empirical investigation. J. Acad. Mark. Sci. 2021. [Google Scholar] [CrossRef]
  29. Jahnert, J.R.; Schmeiser, H. The relationship between net promoter score and insurers’ profitability: An empirical analysis at the customer level. Geneva Pap. Risk Insur. Issues Pr. 2021, 1–29. [Google Scholar] [CrossRef]
  30. Cheng, C.-H.; Chen, Y.-S. Classifying the segmentation of customer value via RFM model and RS theory. Expert Syst. Appl. 2009, 36, 4176–4184. [Google Scholar] [CrossRef]
  31. Anderson, K.M. A method for customer lifetime value ranking. Prev. Sch. Fail. 1986, 51, 49–51. Available online: https://search.proquest.com/docview/220297257?accountid=12834 (accessed on 16 June 2021).
  32. Liu, D.-R.; Shih, Y.-Y. Integrating AHP and data mining for product recommendation based on customer lifetime value. Inf. Manag. 2005, 42, 387–400. [Google Scholar] [CrossRef]
  33. Venkatesan, R.; Kumar, V. A Customer Lifetime Value Framework for Customer Selection and Resource Allocation Strategy. J. Mark. 2004, 68, 106–125. [Google Scholar] [CrossRef]
  34. Chan, C.C.H. Intelligent value-based customer segmentation method for campaign management: A case study of automobile retailer. Expert Syst. Appl. 2008, 34, 2754–2762. [Google Scholar] [CrossRef]
  35. Kumar, V.; Venkatesan, R.; Bohling, T.; Beckmann, D. Practice Prize Report—The Power of CLV: Managing Customer Lifetime Value at IBM. Mark. Sci. 2008, 27, 585–599. [Google Scholar] [CrossRef] [Green Version]
  36. Yeh, I.-C.; Yang, K.-J.; Ting, T.-M. Knowledge discovery on RFM model using Bernoulli sequence. Expert Syst. Appl. 2009, 36, 5866–5871. [Google Scholar] [CrossRef]
  37. Moro, S.; Cortez, P.; Rita, P. Using customer lifetime value and neural networks to improve the prediction of bank deposit subscription in telemarketing campaigns. Neural Comput. Appl. 2015, 26, 131–139. [Google Scholar] [CrossRef]
  38. Hamilton, M.; Kaltcheva, V.D.; Rohm, A.J. Social Media and Value Creation: The Role of Interaction Satisfaction and Interaction Immersion. J. Interact. Mark. 2016, 36, 121–133. [Google Scholar] [CrossRef]
  39. Monalisa, S.; Nadya, P.; Novita, R. Analysis for Customer Lifetime Value Categorization with RFM Model. Procedia Comput. Sci. 2019, 161, 834–840. [Google Scholar] [CrossRef]
  40. Martínez, R.G.; Carrasco, R.A.; Garcia-Madariaga, J.; Gallego, C.P.; Herrera-Viedma, E. A comparison between Fuzzy Linguistic RFM Model and traditional RFM model applied to Campaign Management. Case study of retail business. Procedia Comput. Sci. 2019, 162, 281–289. [Google Scholar] [CrossRef]
  41. Haggerty, C.M.; Damrauer, S.M.; Levin, M.G.; Birtwell, D.; Carey, D.J.; Golden, A.M.; Hartzel, D.N.; Hu, Y.; Judy, R.; Kelly, M.A.; et al. Genomics-First Evaluation of Heart Disease Associated with Titin-Truncating Variants. Circulation 2019, 140, 42–54. [Google Scholar] [CrossRef]
  42. Mahdiraji, H.A.; Zavadskas, E.K.; Kazeminia, A.; Kamardi, A.A. Marketing strategies evaluation based on big data analysis: A CLUSTERING-MCDM approach. Econ. Res. Ekon. Istraž. 2019, 32, 2882–2898. [Google Scholar] [CrossRef] [Green Version]
  43. Vilaginés, J.A. Predicting customer behavior with Activation Loyalty per Period. From RFM to RFMAP. ESIC Mark. Econ. Bus. J. 2020, 51, 609–637. [Google Scholar] [CrossRef]
  44. Heldt, R.; Silveira, C.S.; Luce, F.B. Predicting customer value per product: From RFM to RFM/P. J. Bus. Res. 2021, 127, 444–453. [Google Scholar] [CrossRef]
  45. Rahim, M.A.; Mushafiq, M.; Khan, S.; Arain, Z.A. RFM-based repurchase behavior for customer classification and segmentation. J. Retail. Consum. Serv. 2021, 61, 102566. [Google Scholar] [CrossRef]
  46. Zong, Y.; Xing, H. Customer stratification theory and value evaluation—Analysis based on improved RFM model. J. Intell. Fuzzy Syst. 2021, 40, 4155–4167. [Google Scholar] [CrossRef]
  47. Hsieh, N.-C. An integrated data mining and behavioral scoring model for analyzing bank customers. Expert Syst. Appl. 2004, 27, 623–633. [Google Scholar] [CrossRef]
  48. King, S.F. Citizens as customers: Exploring the future of CRM in UK local government. Gov. Inf. Q. 2007, 24, 47–63. [Google Scholar] [CrossRef]
  49. Lumsden, S.-A.; Beldona, S.; Morrison, A.M. Customer Value in an All-Inclusive Travel Vacation Club: An Application of the RFM Framework. J. Hosp. Leis. Mark. 2008, 16, 270–285. [Google Scholar] [CrossRef]
  50. Li, Y.-M.; Lin, C.-H.; Lai, C.-Y. Identifying influential reviewers for word-of-mouth marketing. Electron. Commer. Res. Appl. 2010, 9, 294–304. [Google Scholar] [CrossRef]
  51. Van Vlasselaer, V.; Bravo, C.; Caelen, O.; Eliassi-Rad, T.; Akoglu, L.; Snoeck, M.; Baesens, B. APATE: A novel approach for automated credit card transaction fraud detection using network-based extensions. Decis. Support Syst. 2015, 75, 38–48. [Google Scholar] [CrossRef] [Green Version]
  52. Mohammadzadeh, M.; Hoseini, Z.Z.; Derafshi, H. A data mining approach for modeling churn behavior via RFM model in specialized clinics Case study: A public sector hospital in Tehran. Procedia Comput. Sci. 2017, 120, 23–30. [Google Scholar] [CrossRef]
  53. Perisic, A.; Pahor, M. Extended RFM logit model for churn prediction in the mobile gaming market. Croat. Oper. Res. Rev. 2020, 11, 249–261. [Google Scholar] [CrossRef]
  54. Stormi, K.; Lindholm, A.; Laine, T.; Korhonen, T. RFM customer analysis for product-oriented services and service business development: An interventionist case study of two machinery manufacturers. J. Manag. Gov. 2019, 24, 623–653. [Google Scholar] [CrossRef] [Green Version]
  55. Hwang, S.; Lee, Y. Identifying customer priority for new products in target marketing: Using RFM model and TextRank. Innov. Mark. 2021, 17, 125–136. [Google Scholar] [CrossRef]
  56. Wu, J.; Shi, L.; Lin, W.-P.; Tsai, S.-B.; Li, Y.; Yang, L.; Xu, G. An Empirical Study on Customer Segmentation by Purchase Behaviors Using a RFM Model and K-Means Algorithm. Math. Probl. Eng. 2020, 2020, 1–7. [Google Scholar] [CrossRef]
  57. McCarty, J.A.; Hastak, M. Segmentation approaches in data-mining: A comparison of RFM, CHAID, and logistic regression. J. Bus. Res. 2007, 60, 656–662. [Google Scholar] [CrossRef]
  58. Herrera, F.; Martinez, L. A 2-tuple fuzzy linguistic representation model for computing with words. IEEE Trans. Fuzzy Syst. 2000, 8, 746–752. [Google Scholar] [CrossRef] [Green Version]
  59. Saaty, T.L. The Analytic Hierarchy Process: Planning, Priority Setting, Resource Allocation; McGraw-Hill International Book Co: New York, NY, USA, 1980; 287p, Available online: https://ucm.on.worldcat.org/oclc/911278091 (accessed on 15 January 2021).
  60. Saaty, T.L. The Modern Science of Multicriteria Decision Making and Its Practical Applications: The AHP/ANP Approach. Oper. Res. 2013, 61, 1101–1118. [Google Scholar] [CrossRef]
  61. Khaira, A.; Dwivedi, R.K. A State of the Art Review of Analytical Hierarchy Process. Mater. Today Proc. 2018, 5, 4029–4035. [Google Scholar] [CrossRef]
  62. Ishizaka, A.; Labib, A. Review of the main developments in the analytic hierarchy process. Expert Syst. Appl. 2011, 38, 14336–14345. [Google Scholar] [CrossRef] [Green Version]
  63. Saaty, T.L. A scaling method for priorities in hierarchical structures. J. Math. Psychol. 1977, 15, 234–281. [Google Scholar] [CrossRef]
  64. Carrasco, R.A.; Blasco, F.; García-Madariaga, J.; Pedreño-Santos, A.; Herrera-Viedma, E. A Model to Obtain a Servperf Scale Evaluation of the Crm Customer Complaints: An Application to the 4g Telecommunications Sector. Technol. Econ. Dev. Econ. 2018, 24, 1606–1629. [Google Scholar] [CrossRef]
  65. Kotler, P. Marketing Management; Pearson Education Limited: Harlow, UK, 2016; Available online: https://www.pearson.com/uk/educators/higher-education-educators/program/Kotler-Marketing-Management-3rd-edn-3rd-Edition/PGM1093412.html (accessed on 20 July 2021).
  66. Kumar, V.; Reinartz, W. Strategic Customer Relationship Management Today. In Customer Relationship Management; Springer: Berlin/Heidelberg, Germany, 2012; pp. 3–20. [Google Scholar] [CrossRef]
  67. Govender, P.; Sivakumar, V. Application of k-means and hierarchical clustering techniques for analysis of air pollution: A review (1980–2019). Atmos. Pollut. Res. 2020, 11, 40–56. [Google Scholar] [CrossRef]
  68. Lu, W. Improved K-Means Clustering Algorithm for Big Data Mining under Hadoop Parallel Framework. J. Grid Comput. 2019, 18, 239–250. [Google Scholar] [CrossRef]
  69. Carrasco, R.A.; Forero, L.N.; López, S.X.; Herrera-Viedma, E.; Porcel, C. Using the AHP model to improve the measurement of satisfaction in the ICT sector. Front. Artif. Intell. Appl. 2018, 303, 299–311. [Google Scholar] [CrossRef]
  70. Charrad, M.; Ghazzali, N.; Boiteau, V.; Niknafs, A. NbClust: An R Package for Determining the Relevant Number of Clusters in a Data Set. J. Stat. Softw. 2014, 61, 1–36. [Google Scholar] [CrossRef] [Green Version]
  71. Andrade, R.; Moazeni, S.; Ramirez-Marquez, J.E. A systems perspective on contact centers and customer service reliability modeling. Syst. Eng. 2019, 23, 221–236. [Google Scholar] [CrossRef]
  72. Zeithaml, V.A.; Berry, L.L.; Parasuraman, A. The Behavioral Consequences of Service Quality. J. Mark. 1996, 60, 31. [Google Scholar] [CrossRef]
  73. Parasuraman, A.; Zeithaml, V.A.; Berry, L.L. SERVQUAL: A multiple-item scale for measuring consumer perceptions of service quality. J. Retail. 1988, 64, 12–40. [Google Scholar]
  74. Hilken, T.; Heller, J.; Chylinski, M.; Keeling, D.I.; Mahr, D.; De Ruyter, K. Making omnichannel an augmented reality: The current and future state of the art. J. Res. Interact. Mark. 2018, 12, 509–523. [Google Scholar] [CrossRef]
  75. Carrasco, R.A.; Blasco, F.; Herrera-Viedma, E. A 2-tuple Fuzzy Linguistic RFM Model and Its Implementation. Procedia Comput. Sci. 2015, 55, 1340–1347. [Google Scholar] [CrossRef] [Green Version]
  76. Kumar, V.; Aksoy, L.; Donkers, B.; Venkatesan, R.; Wiesel, T.; Tillmanns, S. Undervalued or Overvalued Customers: Capturing Total Customer Engagement Value. J. Serv. Res. 2010, 13, 297–310. [Google Scholar] [CrossRef] [Green Version]
Figure 1. Definition of the set S.
Mathematics 09 02362 g001
Figure 2. Hierarchic System of Problem.
Mathematics 09 02362 g002
Figure 3. RFID Proposed Model.
Mathematics 09 02362 g003
Figure 4. Salesforce Case New.
Mathematics 09 02362 g004
Figure 5. AHP Hierarchy.
Mathematics 09 02362 g005
Figure 6. Salesforce CRM. Data Model for Ticket Management.
Mathematics 09 02362 g006
Figure 7. Correlation Matrix of Δ 1 R , Δ 1 F , Δ 1 I , a n d   Δ 1 F Variables.
Mathematics 09 02362 g007
Figure 8. Summary of the Different Indices for Determining the Optimal Number of Segments.
Mathematics 09 02362 g008
Figure 9. Distribution of All Customers by Segment.
Mathematics 09 02362 g009
Table 1. Customer Services Metrics.
Studies
Customer engagement in service [3];
Understanding customer experience throughout the customer journey [4];
The one number you need to grow [18];
Stop trying to delight your customers [19];
Customer metrics and their impact on financial performance [20];
Satisfaction as a predictor of future performance: a replication [21];
The role of mobile devices in the online customer journey [22];
A framework for understanding and managing the CX [23];
Customer experience management in retailing: an organizing framework [24];
The value of different customer satisfaction and loyalty metrics in predicting business performance [25];
Net promoter score, growth, and profitability of transportation companies [26];
Interval estimation for the “net promoter score” [27];
The use of net promoter score (NPS) to predict sales growth: insights from an empirical investigation [28];
The relationship between net promoter score and insurers’ profitability: an empirical analysis at the customer level [29].
Table 2. CLV-Related Studies.
Studies
A method for customer lifetime value ranking. Preventing school failure [31];
Integrating AHP and data mining for product recommendation based on customer lifetime value [32];
Framework for customer selection [33];
Customer lifetime value (CLV) measurement based on RFM model [8];
Intelligent value-based customer segmentation method for campaign management: A case study of automobile retailer [34];
The power of CLV: managing customer lifetime value at IBM [35];
Knowledge discovery on RFM model using Bernoulli sequence [36];
Estimating customer lifetime value based on RFM analysis of customer purchase behavior: case study [9];
Using customer lifetime value and neural networks to improve the prediction of bank deposit subscription in telemarketing campaigns [37];
Social media and value creation: the role of interaction satisfaction and interaction immersion [38];
Analysis for customer lifetime value categorization with RFM model, [39]
A comparison between fuzzy linguistic RFM model and traditional RFM model applied to campaign management. Case study of a retail business [40];
Genomics-first evaluation of heart disease associated with titin-truncating variants [41];
Marketing strategies evaluation based on big data analysis: a CLUSTERING-MCDM approach [42];
Predicting customer behavior with activation loyalty per period. From RFM to RFMAP [43];
A review of the application of RFM model [5];
Predicting customer value per product: From RFM to RFM/P [44];
RFM-based repurchase behavior for customer classification and segmentation [45];
Customer stratification theory and value evaluation-analysis based on improved RFM model [46].
Table 3. CLV Studies and Application to Sectors and Business Models.
IndustryStudies
FinancialAn integrated data mining and behavioural scoring model for analyzing bank customers [47];
Customer lifetime value (CLV) measurement based on RFM model [8];
APATE: A novel approach for automated credit card transaction fraud detection using network-based extensions [51];
TravelCustomer value in an all-inclusive travel vacation club: an application of the RFM framework [49];
A linguistic multi-criteria decision-making methodology for the evaluation of tourist services considering customer opinion value [11];
GovernmentCitizens as customers: exploring the future of CRM in UK local government [48];
Social MarketingIdentifying influential reviewers for word-of-mouth marketing [50];
Identifying customer priority for new products in target marketing: Using RFM model and
TextRank [55];
GamingExtended RFM logit model for churn prediction in the mobile gaming market [53];
HealthA data mining approach for modeling churn behavior via RFM model in specialized clinics case study: a public sector hospital in Tehran [52];
ManufacturingRFM customer analysis for product-oriented services and service business development: an interventionist case study of two machinery manufacturers [54].
Table 4. Saaty’s Scale [59].
Intensity of ImportanceDefinitionExplanation
1Equal importanceTwo activities contribute equally to the objective
2Weak or slight
3Moderate importanceExperience and judgement slightly favour one activity over another
4Moderate plus
5Strong importanceExperience and judgement strongly favour one activity over another
6Strong plus
7Very strong or demonstrated importanceAn activity is favoured very strongly over another; its dominance demonstrated in practice
8Very, very strong
9Extreme importanceThe evidence favouring one activity over another is of the highest possible order of affirmation
Reciprocals of above If activity i has one of the above non-zero numbers assigned to it when compared with activity j, then j has the reciprocal value when compared with i.
Table 5. Extract of T′.
uTicket_idTicket_DateStatus_idStatus_DateTicket_Importance
2104658615539558525 January 2016Closed02 April 2019M
2104658615540265925 January 2016Closed02 April 2019VL
2104658615541812025 January 2016Closed04 April 2019VL
2104658615552077625 January 2016Closed04 April 2019VL
2104658615588786125 January 2016Closed08 April 2019VL
2104658615617148425 January 2016Closed13 April 2019VH
2133465715620685012 April 2016Closed13 April 2019L
2133465715654847112 April 2016Closed19 April 2019L
2133465715675055512 April 2016Closed25 April 2019VH
228877415550845012 September 2015Closed04 April 2019M
2458314715562899118 October 2018Closed06 April 2019VL
2586061815567032028 March 2019Closed06 April 2019VL
2586061815608509328 March 2019Closed12 April 2019M
2586061815608641028 March 2019Working12 April 2019M
2586061815634557928 March 2019Closed15 April 2019VH
2586061815634568028 March 2019Working15 April 2019L
2586445615540144729 March 2019Closed02 April 2019VH
2586445615542064529 March 2019Closed04 April 2019VH
2605320415704883127 April 2019Closed28 April 2019VL
2606441915714987129 April 2019Closed29 April 2019L
2606441915721464029 April 2019Closed29 April 2019VL
2606441915721534729 April 2019Closed29 April 2019M
Table 6. Extract of TU.
urfid
21046586176L6999
2133465753M3306
2288774261M1300
24583147241VL170
25860618155(M, −0.05)75
25864456262VH10
2605320421VL1
2606441913L0
Table 7. Extract of TRFID.
uRFID
21046586(M, −0.087)(VH, −0.035)L(VH, −0.002)
21334657(H, −0.026)(H, 0.008)M(VH, −0.024)
2288774(VL, 0.085)VLM(VH, −0.12)
24583147(L, −0.086)VLVL(L, 0.12)
25860618(M, −0.003)(VH, −0.065)(M, −0.05)(L, −0.009)
25864456(VL, 0.085)(M, 0.01)VH(VL, 0.098)
26053204(VH, −0.097)VLVL(VL, 0.038)
26064419(VH, −0.025)(H, 0.008)LVL
Table 8. RFID overall score for some customers.
uRFID
21046586(M, 0.062)
21334657(H, −0.035)
2288774(L, −0.092)
24583147(VL, 0.109)
25860618(M, 0.092)
25864456(L, 0.07)
26053204(M, 0.004)
26064419(H, 0.022)
Table 9. RFID Overall Score for Some Customers.
urfidRFIDRFID
23420561010(M, −0.125)3911VH(VH, −0.005)(M, −0.125)(VH, −0.013)(VH, −0.087)
2540300107M585VH(VH, −0.018)M(H, −0.057)(VH, −0.088)
2398740717M1926(VH, −0.025)(VH, −0.018)M(VH, −0.071)(VH, −0.09)
2185835604M3442VH(VH, −0.125)M(VH, −0.021)(VH, −0.101)
2224282104M2803VH(VH, −0.125)M(VH, −0.031)(VH, −0.102)
2369438315M1689(VH, −0.025)(VH, −0.065)M(VH, −0.085)(VH, −0.103)
2388828215M1470(VH, −0.025)(VH, −0.065)M(VH, −0.1)(VH, −0.103)
2597267105(H, −0.1)45VH(VH, −0.065)(H, −0.1)(L, −0.062)(VH, −0.104)
222794815(M, −0.05)6626(VH, −0.025)(VH, −0.065)(M, −0.05)(VH, −0.003)(VH, −0.105)
2417827215M1120(VH, −0.025)(VH, −0.065)M(H, 0.087)(VH, −0.106)
2590557919(M,0.083)117(VH, −0.025)(VH, −0.007)(M, 0.083)(L, 0.048)(VH, −0.107)
219470719(L,0.056)12110(VH, −0.025)(VH, −0.007)(L, 0.056)VH(VH, −0.11)
2596236504(H, −0.062)66VH(VH, −0.125)(H, −0.062)(L, −0.026)(VH, −0.113)
2330476706L2452VH(VH, −0.035)L(VH, −0.046)(VH, −0.113)
246387916(L, 0.083)7739(VH, −0.025)(VH, −0.035)(L, 0.083)(VH, −0.002)(VH, −0.114)
2412856017(L, 0.071)1677(VH, −0.025)(VH, −0.018)(L, 0.071)(VH, −0.086)(VH, −0.115)
2640503011(L, −0.091)13764VH(VH, −0.003)(L, −0.091)VH(VH, −0.115)
23640429011(L, −0.091)3752VH(VH, −0.003)(L, −0.091)(VH, −0.016)(VH, −0.116)
2541067706(L, 0.083)517VH(VH, −0.035)(L, 0.083)(H, −0.085)(VH, −0.116)
25845359010(L, 0.1)246VH(VH, −0.005)(L, 0.1)(M, −0.041)(VH, −0.116)
Table 10. Number of Clusters Proposed by the Different Indices.
IndexNumber of ClustersValue Index
KL857.13
CH11682.26
Hartigan8272.03
CCC1274.13
Scott8876.63
Marriot81,477,204.00
TrCovW8326.29
TraceW819.57
Friedman815.09
Rubin8−2.67
Cindex100.26
DB70.92
Silhouette80.39
Duda64.10
PseudoT26−305.40
Beale6−1.82
Ratkowsky60.33
Ball74.73
PtBiserial80.58
Frey61.04
McClain61.81
Dunn110.03
SDindex84.93
SDbw110.39
Table 11. Result of the k-Means Algorithm.
Cluster
c
R
vc1
F
vc2
I
vc3
D
vc4
Number of Customers
10.34682860.0044830710.640945750.3294273682
20.8028290.7284538950.239993960.823941059
30.302594800.140334570.6893585807
40.30914540.6228376110.279081760.2508257645
50.32387620.6367442150.274050760.7974674892
60.297631700.093997730.2478526883
70.823841900.174062210.41352241093
80.79441050.6830381430.268837860.257423728
Table 12. Result of the k-Means Algorithm Expressed in the Two-Tuple Model.
Cluster
c
R
vc1
F
vc2
I
vc3
D
vc4
1(L, 0.097)(VL, 0.004)(H, −0.109)(L, 0.079)
2(H, 0.053)(H, −0.022)(L, −0.01)(H, 0.074)
3(L, 0.053)VL(L, −0.11)(H, −0.061)
4(L, 0.059)(M, 0.123)(L, 0.029)(L, 0.001)
5(L, 0.074)(H, −0.113)(L, 0.024)(H, 0.047)
6(L, 0.048)VL(VL, 0.094)(L, −0.002)
7(H, 0.074)VL(L, −0.076)(M, −0.086)
8(H, 0.044)(H, −0.067)(L, 0.019)(L, 0.007)
Table 13. Recommendation Strategy by Each Cluster.
ClusterInteractionRecommendation Strategy
1SelfCustomDescription: A priori these are not very problematic customers, they do not have recurrent or frequent incidents, but the incidents they have had are of some importance.
Future interactions: In subsequent customer interactions with the contact centre, the use of bot (faqs, chat, voice) is recommended, and if personalisation is required because the customer demands it, an automatic channel could be changed to a personalised and even specialised one.
Campaigns: It is proposed for this type of customer to reward brand loyalty with discount campaigns for permanence.
2StrongCustomDescription: Customer considered at high risk of abandonment.
Future interactions: In future customer interactions with the contact centre, it is recommended to personalise communication through specialised agents.
Campaigns: Campaigns are proposed that tend to raise the customer’s perception of the service and the brand. We recommend listening to the customer, acquiring in-depth knowledge of them, and based on this, proposing discounts, offers and promotions.
3SelfCustomDescription: A priori these are not very problematic customers, they do not have recurrent or frequent incidents, but the incidents they have had are of medium to long duration.
Future interactions: In subsequent customer interactions with the contact centre, it is recommended to use bot (faqs, chat, voice), if customisation is required because the customer demands it, it could move from an automatic channel to a customised and even specialised one.
Campaigns: It is proposed for this type of customer to reward brand loyalty with discount campaigns for permanence.
4CustomDescription: A priori, these are customers who have had frequent incidents and, in the past, possibly problems related to the implementation of the service.
Future interactions: In future customer interactions with the contact centre, it is recommended to personalise communication through generalist and, if necessary, specialised agents.
Campaigns: Campaigns aimed at strengthening and rewarding customer loyalty, discounts for permanence, etc., are proposed.
5CustomDescription: A priori, these are customers who have had frequent incidents in the past, possibly problems derived from the installation, which produced long-lasting incidents.
Future interactions: In subsequent customer interactions with the contact centre, it is recommended to personalise communication through generalist and, if necessary, specialised agents.
Campaigns: We propose campaigns aimed at strengthening and rewarding customer loyalty, as well as raising the brand image, listening to the customer, and generating valuable content.
6SelfDescription: A priori these are customers with infrequent incidents in the past, and without much relevance. Future interactions: In future customer interactions with the contact centre it is recommended to use bot (faqs, chat, voice), excessive personalisation is not required, and auto response will be sought in the interaction with the customer.
Campaigns: This type of customer could be an excellent brand ambassador, campaigns are proposed that reward their interaction and participation in social networks, in addition to strengthening customer loyalty with discounts associated with permanence.
7SelfCustomDescription: Although incidents are not frequent, there is a recency in them, however, the importance and duration are low, they are customers with a low abandonment rate.
Future interactions: In future customer interactions with the contact centre it is recommended to use bot (faqs, chat, voice), if personalisation is required because the customer demands it, it could move from an automatic channel to a personalised and even specialised one.
Campaigns: Campaigns aimed at strengthening the brand image are proposed, if the customer has been with the brand for some time, complementary strategies that reward loyalty are proposed.
8CustomDescription: Frequent and repeated incidents, but without importance. The customer typology may correspond to customers seeking excellence in the brand’s services.
Future interactions: In subsequent customer interactions with the contact centre, it is recommended to personalise communication through generalist and, if necessary, specialised agents.
Campaigns: Aimed at promoting trust among customers, creating messages of value that can help the customer and understand what the brand does for their benefit.
Table 14. Extract of R F I D c for Some Clients.
Client_IDCluster
210465865
213346572
22887743
245831476
258606184
258644561
260532047
260644198
Publisher’s Note: MDPI stays neutral with regard to jurisdictional claims in published maps and institutional affiliations.

