Article

Effects of Surface Rotation on the Phase Change Process in a 3D Complex-Shaped Cylindrical Cavity with Ventilation Ports and Installed PCM Packed Bed System during Hybrid Nanofluid Convection

1
Department of Mechanical Engineering, College of Engineering, University of Hail, Hail City 81451, Saudi Arabia
2
Laboratory of Metrology and Energy Systems, Department of Energy Engineering, University of Monastir, Monastir 5000, Tunisia
3
Department of Mechanical Engineering, Celal Bayar University, Manisa 45140, Turkey
4
Deanship of Scientific Research, King Abdulaziz University, Jeddah 21589, Saudi Arabia
*
Author to whom correspondence should be addressed.
Mathematics 2021, 9(20), 2566; https://doi.org/10.3390/math9202566
Submission received: 9 September 2021 / Revised: 8 October 2021 / Accepted: 10 October 2021 / Published: 13 October 2021
(This article belongs to the Special Issue Modeling and Numerical Analysis of Energy and Environment 2021)

Abstract

:
The combined effects of surface rotation and using binary nanoparticles on the phase change process in a 3D complex-shaped vented cavity with ventilation ports were studied during nanofluid convection. The geometry was a double T-shaped rotating vented cavity, while hybrid nanofluid contained binary Ag–MgO nano-sized particles. One of the novelties of the study was that a vented cavity was first used with the phase change–packed bed (PC–PB) system during nanofluid convection. The PC–PB system contained a spherical-shaped, encapsulated PCM paraffin wax. The Galerkin weighted residual finite element method was used as the solution method. The computations were carried out for varying values of the Reynolds numbers ( 100 Re 500 ), rotational Reynolds numbers ( 100 Rew 500 ), size of the ports ( 0.1 L 1 d i 0.5 L 1 ), length of the PC–PB system ( 0.4 L 1 L 0 L 1 ), and location of the PC–PB ( 0 y p 0.25 H ). In the heat transfer fluid, the nanoparticle solid volume fraction amount was taken between 0 and 0.02 % . When the fluid stream (Re) and surface rotational speed increased, the phase change process became fast. Effects of surface rotation became effective for lower values of Re while at Re = 100 and Re = 500; full phase transition time (tp) was reduced by about 39.8% and 24.5%. The port size and nanoparticle addition in the base fluid had positive impacts on the phase transition, while 34.8% reduction in tp was obtained at the largest port size, though this amount was only 9.5%, with the highest nanoparticle volume fraction. The length and vertical location of the PC–PB system have impacts on the phase transition dynamics. The reduction and increment amount in the value of tp with varying location and length of the PC–PB zone became 20% and 58%. As convection in cavities with ventilation ports are relevant in many thermal energy systems, the outcomes of this study will be helpful for the initial design and optimization of many PCM-embedded systems encountered in solar power, thermal management, refrigeration, and many other systems.

1. Introduction

Thermal management with phase change material (PCM) is important to consider in diverse, energy-related technologies, such as solar power, refrigeration, energy storage, electronic cooling, waste heat recovery, and many others [1,2,3,4]. This is due to the need for clean energy technologies, the cost of energy, and concerns about environmental side effects. The effectiveness of using PCMs has been improved by using metal foams and conductive fins [5,6]. Recently, nanoparticles have been used for improving the performance of PCMs and to accelerate the phase change (Ph-C) process in diverse applications [7,8,9]. PCM-packed bed (PB) systems are considered in many energy applications, such as in solar, air conditioners, and many others [10]. A review for the application of PCM–PB systems and their numerical models with correlations were presented in [11]. There are a few studies that considered the application of nanofluids in PCM–PB systems [12].
Thermo-fluid applications in vented cavities arise in different areas, including air conditioning-ventilation of buildings, food technology, electronic cooling, energy storage, and many others [13]. The fluid–thermal interaction within a vented cavity is complex, due to the occurrence of multi-recirculation zones. There are many studies that considered the convective heat transfer (HT) in 2D vented cavities of simple shapes, such as squares or rectangles [14,15]. There are a few studies that considered the convection within 3D vented cavities [16,17,18,19] or complex-shaped geometries [20,21,22,23]. The opening location, size, and number of ports are important in the HT amount [24]. Many methods have been offered to improve the HT with vented cavities, such as using fins [25,26], rotating objects [27,28], flow pulsations [29,30], magnetic fields [31], and elastic walls [32]. Nanofluids have also been considered in vented cavities and in convection studies [33,34,35,36,37,38], and their effectiveness has been shown.
In the present study, the PCM–PB system is utilized with nanofluids, and Ph-C process dynamics are numerically analyzed for a complex-shaped vented cavity having one inlet and outlet port. As the HT fluid, hybrid nanofluid, which contains Ag–MgO binary particles, was used. The vented cavity is a double T-shaped complex cylindrical reactor. The present study explored the Ph-C in such a geometry with rotational surface effects. Nanoparticle loading in the base fluid was considered where experimental data for the effective nanofluid property was used. The nanofluid behavior with PCM packed bed system was considered. Non-equilibrium heat transfer is taken into account where different temperatures for fluid and solid phases in the PCM-packed bed region were utilized in a complex geometry, by using finite element method. The external flow conditions with the PCM-packed bed system are coupled together. The rotation of the system was also considered for the vented cavity. There are a few studies that considered the convection in vented cavities in 3D, and none of them included the rotational effects. One of the novelties of the configuration is that a vented cavity was used with a PCM packed bed system for the first time during nanofluid convection. Owing to many use of vented cavities in diverse energy system technologies, and considering many energy-related products with embedded PCMs, the outcomes of this study will be helpful in the design and product development of similar systems encountered in solar power, cooling applications, heat exchanger design, and many other systems.

2. Computational Details of PCM–PB Integrated System

The phase change process (Ph-C) in a complex-shaped vented cavity was examined under the effects of surface rotations during the nanofluid convection in a PCM-packed bed (PB) system. The cavity is a double T-shaped cylindrical enclosure, while hybrid nanoparticles are used in the base fluid, as shown in Figure 1. One inlet and exit port were used in the vented cavity with port sizes of di. The cylindrical complex-shaped cavity rotated around the mid axis with rotational speed of ω . The PCM packed bed zone was included in between the double T-shaped cavities, with a height of hpc and length of L0, while it was located by a distance of ypc above the lower T-shaped cavity. Here, H and L1 denote the height and radius of the cylindrical double T-shaped enclosure.
The PCM is a spherical-shaped encapsulated paraffin wax, being 30 mm in diameter with the given thermophysical properties in [39]. The porosity of the medium for the PCM installed zone is 55. As the heat transfer (HT) fluid, water and the binary particles of Ag and MgO were considered. The solid volume fraction of the hybrid particles (NC) was taken between 0 and 0.02%. The coupled effects of surface rotation and forced convection in a vented cavity with ventilation ports were explored under the nanoparticles loading in the HT fluid. The conservation equations for the upper and lower T-shaped domains were stated as [40,41]:
. u = 0
ρ u . u = . p I + μ u + u T
ρ c p T t + ρ c p u . T = . k T .
In the PCM packed bed zone, they were as stated in the following [42,43]:
. u = 0
1 ε p ρ u . u 1 ε p = . p I + μ 1 ε p u + u T μ κ 1 + β p ρ | u | u
by using the Kozeny–Carmen permeability model, as in the following [44,45,46]
κ = d p 2 180 ε p 3 ( 1 ε p ) 2
The following properties were used in the PCM region as [42]:
k = θ k f 1 + ( 1 θ ) k f 2 , α m = 1 2 ( 1 θ ) ρ f 2 θ ρ f 1 θ ρ f 1 + ( 1 θ ) ρ f 2 , C p = 1 ρ θ ρ f 1 C p , f 1 + ( 1 θ ) ρ f 2 C p , f 2 + L α m T , θ = 1 α , ρ = θ ρ f 1 + ( 1 θ ) ρ f 2 ,
by using the function α , the energy equation was rewritten in the same way as in Equation (6). The α function value is 0 for T < T m Δ T m / 2 and 1 for T > T m + Δ T m / 2 .
Non-equilibrium HT interface was utilized between the phases. Two equations and additional source terms were described in the following [47]:
θ p ρ s C p , s T s t + . q s = q s f T f T s + θ p Q s ,
q s = θ p k s T s , q f = ( 1 θ p ) k f T f .
( 1 θ p ) ρ f C p , f T f t + ( 1 θ p ) ρ f C p , f u f . T f + + . q f = q s f ( T s T f ) + ( 1 θ p ) Q f ,
where the conductive heat fluxes of phases are represented by the terms q f and q s , while interstitial convective HT and source terms were given by the terms q s f and Q. Description of the interstitial HT coefficient is stated as [47]:
1 h s f = 2 r p k f Nu + 2 r p β k s ,
where β has a value of 10 for spherical particles. The fluid-to-solid Nu number is described as [48]:
Nu = 2 + 1.1 Pr 1 / 3 Re p 0.6 ,
with particle Prandtl (Pr) and Reynolds numbers (Re) as:
Pr = μ C p , f k f , Re p = 2 r p ρ f | u f | μ .
As the HT-fluid hybrid nanofluid (water + Ag–MgO nano-additives) is considered [49].
Effective density and specific heat of the nanofluid are given as [49]:
ρ n f = ( 1 ϕ 2 ) ( 1 ϕ 1 ) ρ f + ϕ 1 ρ s 1 + ϕ 2 ρ s 2 ,
( ρ c p ) n f = ( 1 ϕ 2 ) ( 1 ϕ 1 ) ( ρ c p ) f + ϕ 1 ( ρ c p ) s 1 + ϕ 2 ( ρ c p ) s 2
As for the thermal conductivity ( k n f ) and viscosity ( μ n f ) description of the hybrid nanofluid, experimental data were used. The correlations depend upon the solid volume fraction of nanoparticles [50]. They are defined as [50]:
k n f = 0.1747 × 10 5 + ϕ 0.1747 × 10 5 0.1498 × 10 6 ϕ + 0.1117 × 10 7 ϕ 2 + 0.1997 × 10 8 ϕ 3 k f ,
μ n f = 1 + 32.795 ϕ 7214 ϕ 2 + 714600 ϕ 3 0.1941 × 10 8 ϕ 4 μ f .
where ϕ is the sum of the solid volume fractions of binary nanoparticles in the HT-fluid as:
ϕ = ϕ 1 + ϕ 2 .
The Reynolds number (Re) and rotational Reynolds number (Rew) are the relevant non-dimensional parameter of interest. They are described as:
Re = u i H ρ μ , Rew = ω H 2 ρ μ
The inlet temperature is Ti. An axis-symmetrical model was considered with T r = 0 . At the exit port, pressure outlet boundary conditions were used, while the walls of the vented cavity were considered as adiabatic T n = 0 . The initial temperature was taken as 303 K.
As for the solution of the above described governing equations with appropriate initial and boundary conditions, Galerkin weighted residual FEM was used. Details of the method and implementation for heat transfer and fluid flow problems can be found in various references [51,52,53,54]. The field variables of interest (velocity components, pressure, fluid, and solid temperatures) are approximated by using the Lagrange shape functions of different orders. For any field variable of interest (S), the approximation is stated as in the following [55,56]:
S = j = 1 m S j Φ j
where S j and Φ j denote the nodal value and shape function. When the approximated field variable are inserted into the governing equations, residuals (R) are obtained. They were set to be zero in an average sense by using a weight function (W) as in the following [55]:
V W R d V = 0 .
The weight function was chosen from the same set of function as of trial. For the approximation of the velocity components and pressure, P2–P1 Lagrange finite elements were used, while temperature was approximated by using Lagrange quadratic finite elements. Artificial diffusion with the streamline upwind Petrov–Galerkin method (SUPG) was used in the solver to handle local numerical instabilities. Biconjugate gradient stabilized iterative method solver (BICGStab) was used for fluid flow and heat transfer modules of code. The convergence criteria was defined as in the following:
Γ i + 1 Γ i Γ i + 1 10 7
The time-dependent part was treated by using a variable-order backward differentiation formula (BDF) [57,58,59].
Tests for grid independence were performed by using grid types. Figure 2a shows the phase transition time (tp (min)) for different element numbers at two different rotations. Grid system 5, with 70,088 elements, was used. Grid distribution is shown in Figure 2b.
The numerical code is validated by using different available results in the literature for phase change and convection in a vented cavity. In the first study, the experimental values in [60] were used, where phase change process in a heated cavity was explored and fluid–solid interfaces were measured, along with the temperatures. The amount of solidified volume fraction was stated in terms of dimensionless time (te), cavity aspect ratio (AR) and Rayleigh number (Ra). Solidified volume fraction comparison results for AR = 1 at different times are shown in Figure 3, while the maximum difference of 9.3 % was observed. In another validation test, convection in a vented cavity was considered, and the numerical results available in [14] were used. Figure 4 shows the comparisons of average Nu number for different Re numbers. A maximum deviation of 3.3% was observed between the results. These results reveal that the present code was capable of capturing the effects of convective HT, with ventilation ports and phase change process dynamics, in the cavity.

3. Results and Discussion

The effects of geometric and operating parameters on the PhC dynamics in PCM–PB cylindrical complex-shaped cavity with ventilation ports were studied during nanofluid convection. The cavity had a double T-shape, while rotational surface effects were also considered. The nanofluid contained hybrid Ag–MgO nano-sized particles, while the PCM–PB system contains spherical-shaped, encapsulated PCM paraffin wax. The numerical tests are conducted for varying values of Re number ( 100 Re 500 ), rotational Re number ( 100 Rew 500 ), port size ( 0.1 L 1 d i 0.5 L 1 ), PCM zone length ( 0.4 L 1 L 0 L 1 ), location of the PCM zone ( 0 y p 0.25 H ) and nanoparticle solid volume fraction ( 0 NC 0.5 L 1 ).
Figure 5 shows the flow pattern distributions within the cavity for different fluid stream Re (Rew = 500) and rotational Re numbers (Re = 300). The recirculation zones were established within the cavity, near the inlet port and above the exit port, when Re increased from Re = 100 to Re = 250. Above the PCM–PB region, toward the wall, a small vortex was also formed. As the Re further increased, the extent of those zones also modified with increased fluid stream velocity. In the absence of rotational surface effects (Figure 5d, Rew = 0), the upper vortex near the inlet port becomes closer to the interior of the domain. When rotational effects are considered, the vortex size near the inlet port and on the bottom corner of the upper region became larger. The fluid velocity near the walls rose, due to the rotation of the surfaces and interactions with the main fluid stream, effecting the Ph-C dynamics near the walls and in the interior of the complex-shaped cavity. The distribution of the liquid faction (Lq ), with varying fluid stream Re and rotational Re numbers, is shown in Figure 6. The Ph-C process becomes fast, especially near the walls, for higher Re number; at t = 150 min, a complete phase transition occurs within the cavity. However, at Re = 100, there are locations in the interior of the PCM–PB domain with Lq = 0. For the case of a higher value of fluid stream Re number, better thermal transport within the PCM–PB system was obtained, which accelerates the Ph-C process. When rotational surface effects were considered, along with the higher fluid stream velocity, it had a positive impact on the Ph-C process, especially near the wall region, due to the higher fluid velocity at those locations. The effect of Re on the distribution of Lq becomes apparent, at times, near the complete phase transition. At t = 150 min, a complete phase change was seen for the configuration with Rew = 150. The dynamics of the Lq were affected by varying the Re and Rew numbers, while the impact of the Re on the Ph-C dynamics was significant (Figure 7). The value of Lq = 1 was reached in a shorter time, with higher values of Re. However, the behavior of Lq (with varying Re) was different, depending upon the time interval. After t = 70 min, the Ph-C process becomes fast, with the highest rotational Re number, while the trend was opposite before t = 70 min.
The complete phase transition time (tp in minutes) reduces with higher fluid stream Re number, as shown in Figure 8a and Figure 9a. The amount of reduction depends upon the amount of the rotation of the vented cavity. At Rew = 500, up to 51% reduction in the tp was obtained at the higher fluid stream Re number. In the absence of rotation (Rew = 0), the amount of reduction in the tp was 61%, while with the rotation of the surface at the highest speed, the amount was only 49%. Even though the tp value was lower with higher rotational surface effects (generally), the effectiveness in increasing the fluid stream velocity on the variation of tp was higher (without the rotation of the surface). As the surface rotational speed increased, the Ph-C process generally became fast and a reduction in the tp was observed. However, the impacts of rotation on the Ph-C process was significant at low fluid stream Re number. At Re = 100, 300, and 500, the amount of reductions in the tp were 39.8%, 34.8%, and 24.5% (when comparing cases without rotation (Rew = 0) and with rotations at the highest speed (Rew = 1000)).
The geometric variation of the 3D complex-shaped vented cavity were also influential on the fluid flow, HT, and Ph-C dynamics. One of the important geometric parameters was the port size at the inlet and outlet for the vented cavity. Their sizes were taken as di and varied during the simulations. Figure 10 shows the flow pattern variations within the vented cavity for different port sizes. When the port size increased, the upper vortex near the inlet becomes closer to the interior of the domain, while its extent increased with larger port sizes. The vortex size above the exit port also enlarged with higher values of di. The length of the PCM–PB zone effects the re-circulation zone distribution within the 3D complex-shaped vented cavity. A large vortex, occupying the most of the upper domain near the inlet port, was observed for L0 = L1. When the size of the PCM zone was reduced, a large vortex was established above the exit port, while near the inlet port, it disappeared. The Ph-C process was significantly influenced by the port size, as shown in Figure 11, at various time instances. In the interior of the vented cavity, the phase transition was fast for a large portion of the domain with larger port sizes. This is due to the penetration of the more fluid stream in the interior of the domain with larger port sizes and the increased effects of thermal transport within the PCM–PB zone. At t = 150 min, complete phase transition was seen for port size di = 0.5 L1.
The acceleration of the Ph-C with higher port size and its impacts on the dynamics of transition are shown in Figure 12. The phase transition time (tp in minutes) was reduced by about 34.8%, with the highest port size. As the length of the PCM–PB region was increased, the Ph-C process became slower and the value of the tp rose with higher L0. This was due to the increment of the number of spherical-shaped, encapsulated PCMs. The coupled interaction between the flow dynamics with the change in the geometry of the vented cavity and the number of spheres in the PB zone determines the amount of rise in the tp. The increment in the tp was about 58%, when configurations with smallest and largest L0 were compared (Figure 13). The vertical location of the PCM–PB zone is also influential on Ph-C dynamics. When the vertical position is closer to the inlet port, it has a positive impact on the Ph-C process, as shown in Figure 14a. Complete phase transition time was reduced by about 20%, when the cases with yp = 0.01 H and yp = 0.25 H were compared. Performance improvements were further achieved by using nano-sized particles in the base HT fluid. The flow re-circulation and separated flow region near the contracted area were altered by using nanoparticles and varying their amount. The variation in the flow field affects the Ph-C dynamics. On the other hand, thermal transport within the PCM zone also positively affects nanoparticle loading in the HT fluid. The amount of reduction in tp was obtained as 9.5%, with the highest nanoparticle volume fraction (Figure 14b).

4. Conclusions

The phase change process in a 3D complex-shaped cavity is explored under the combined effects of surface rotations and nanoparticle loading in the base fluid for a PCM-packed bed integrated system. The following conclusions are drawn as:
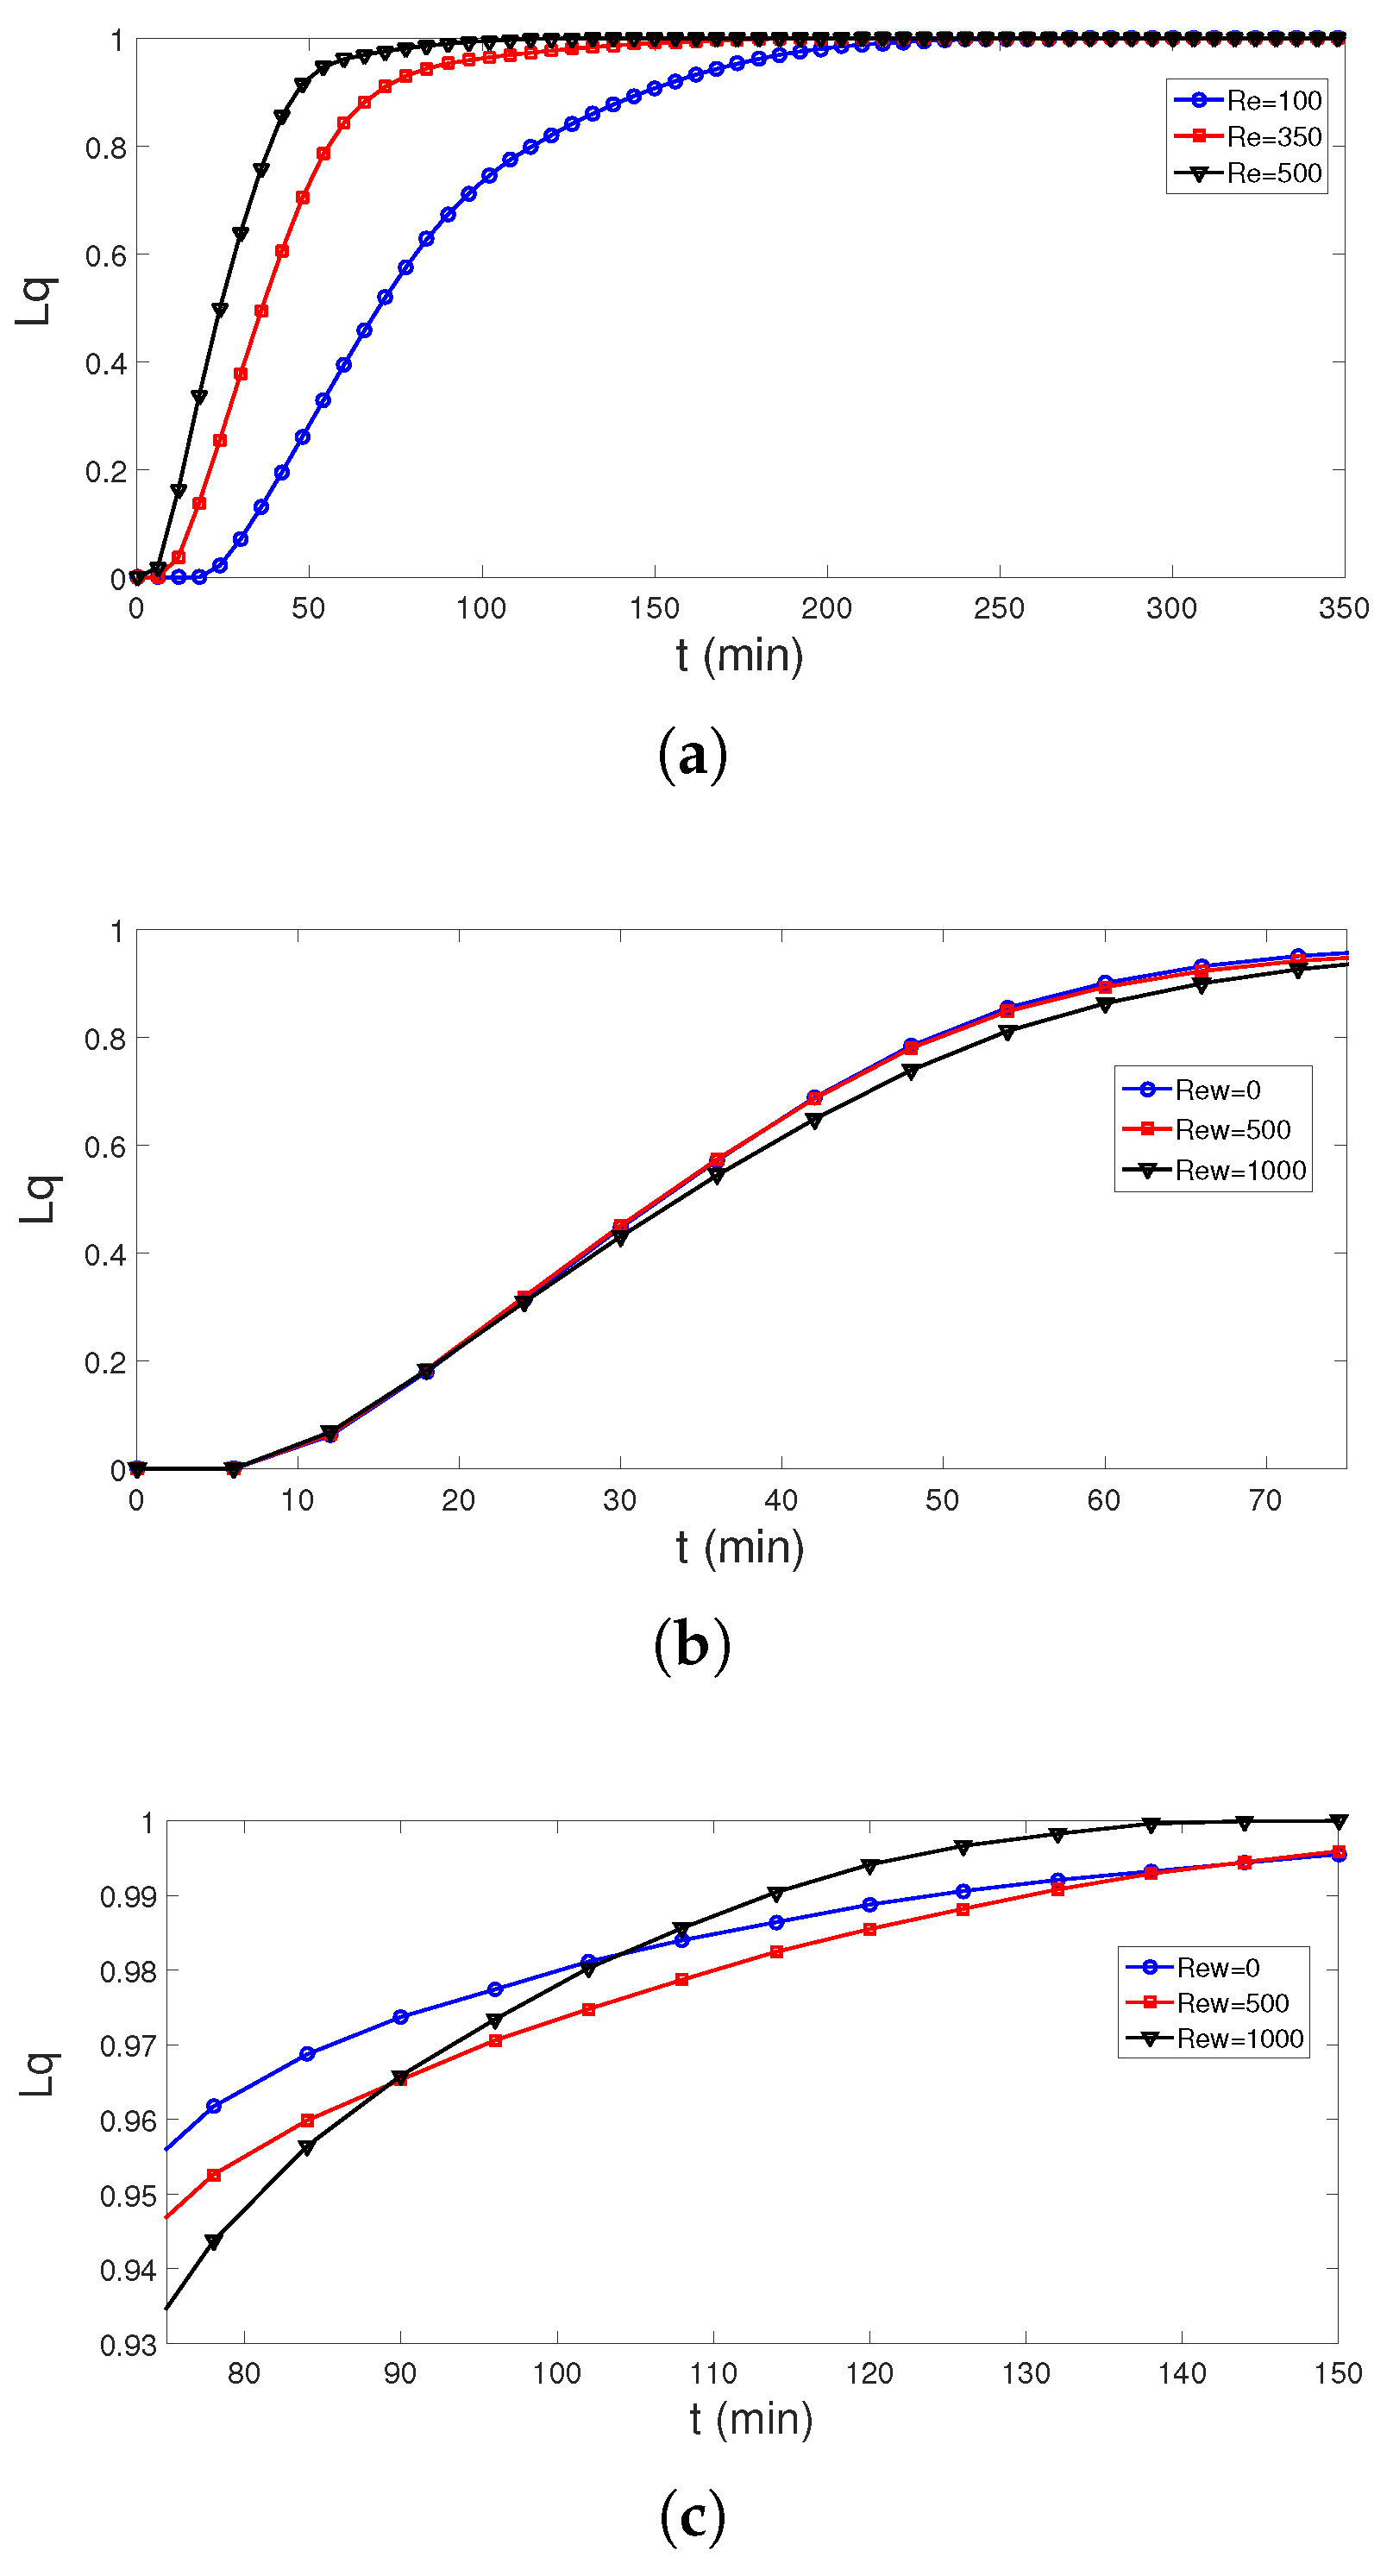
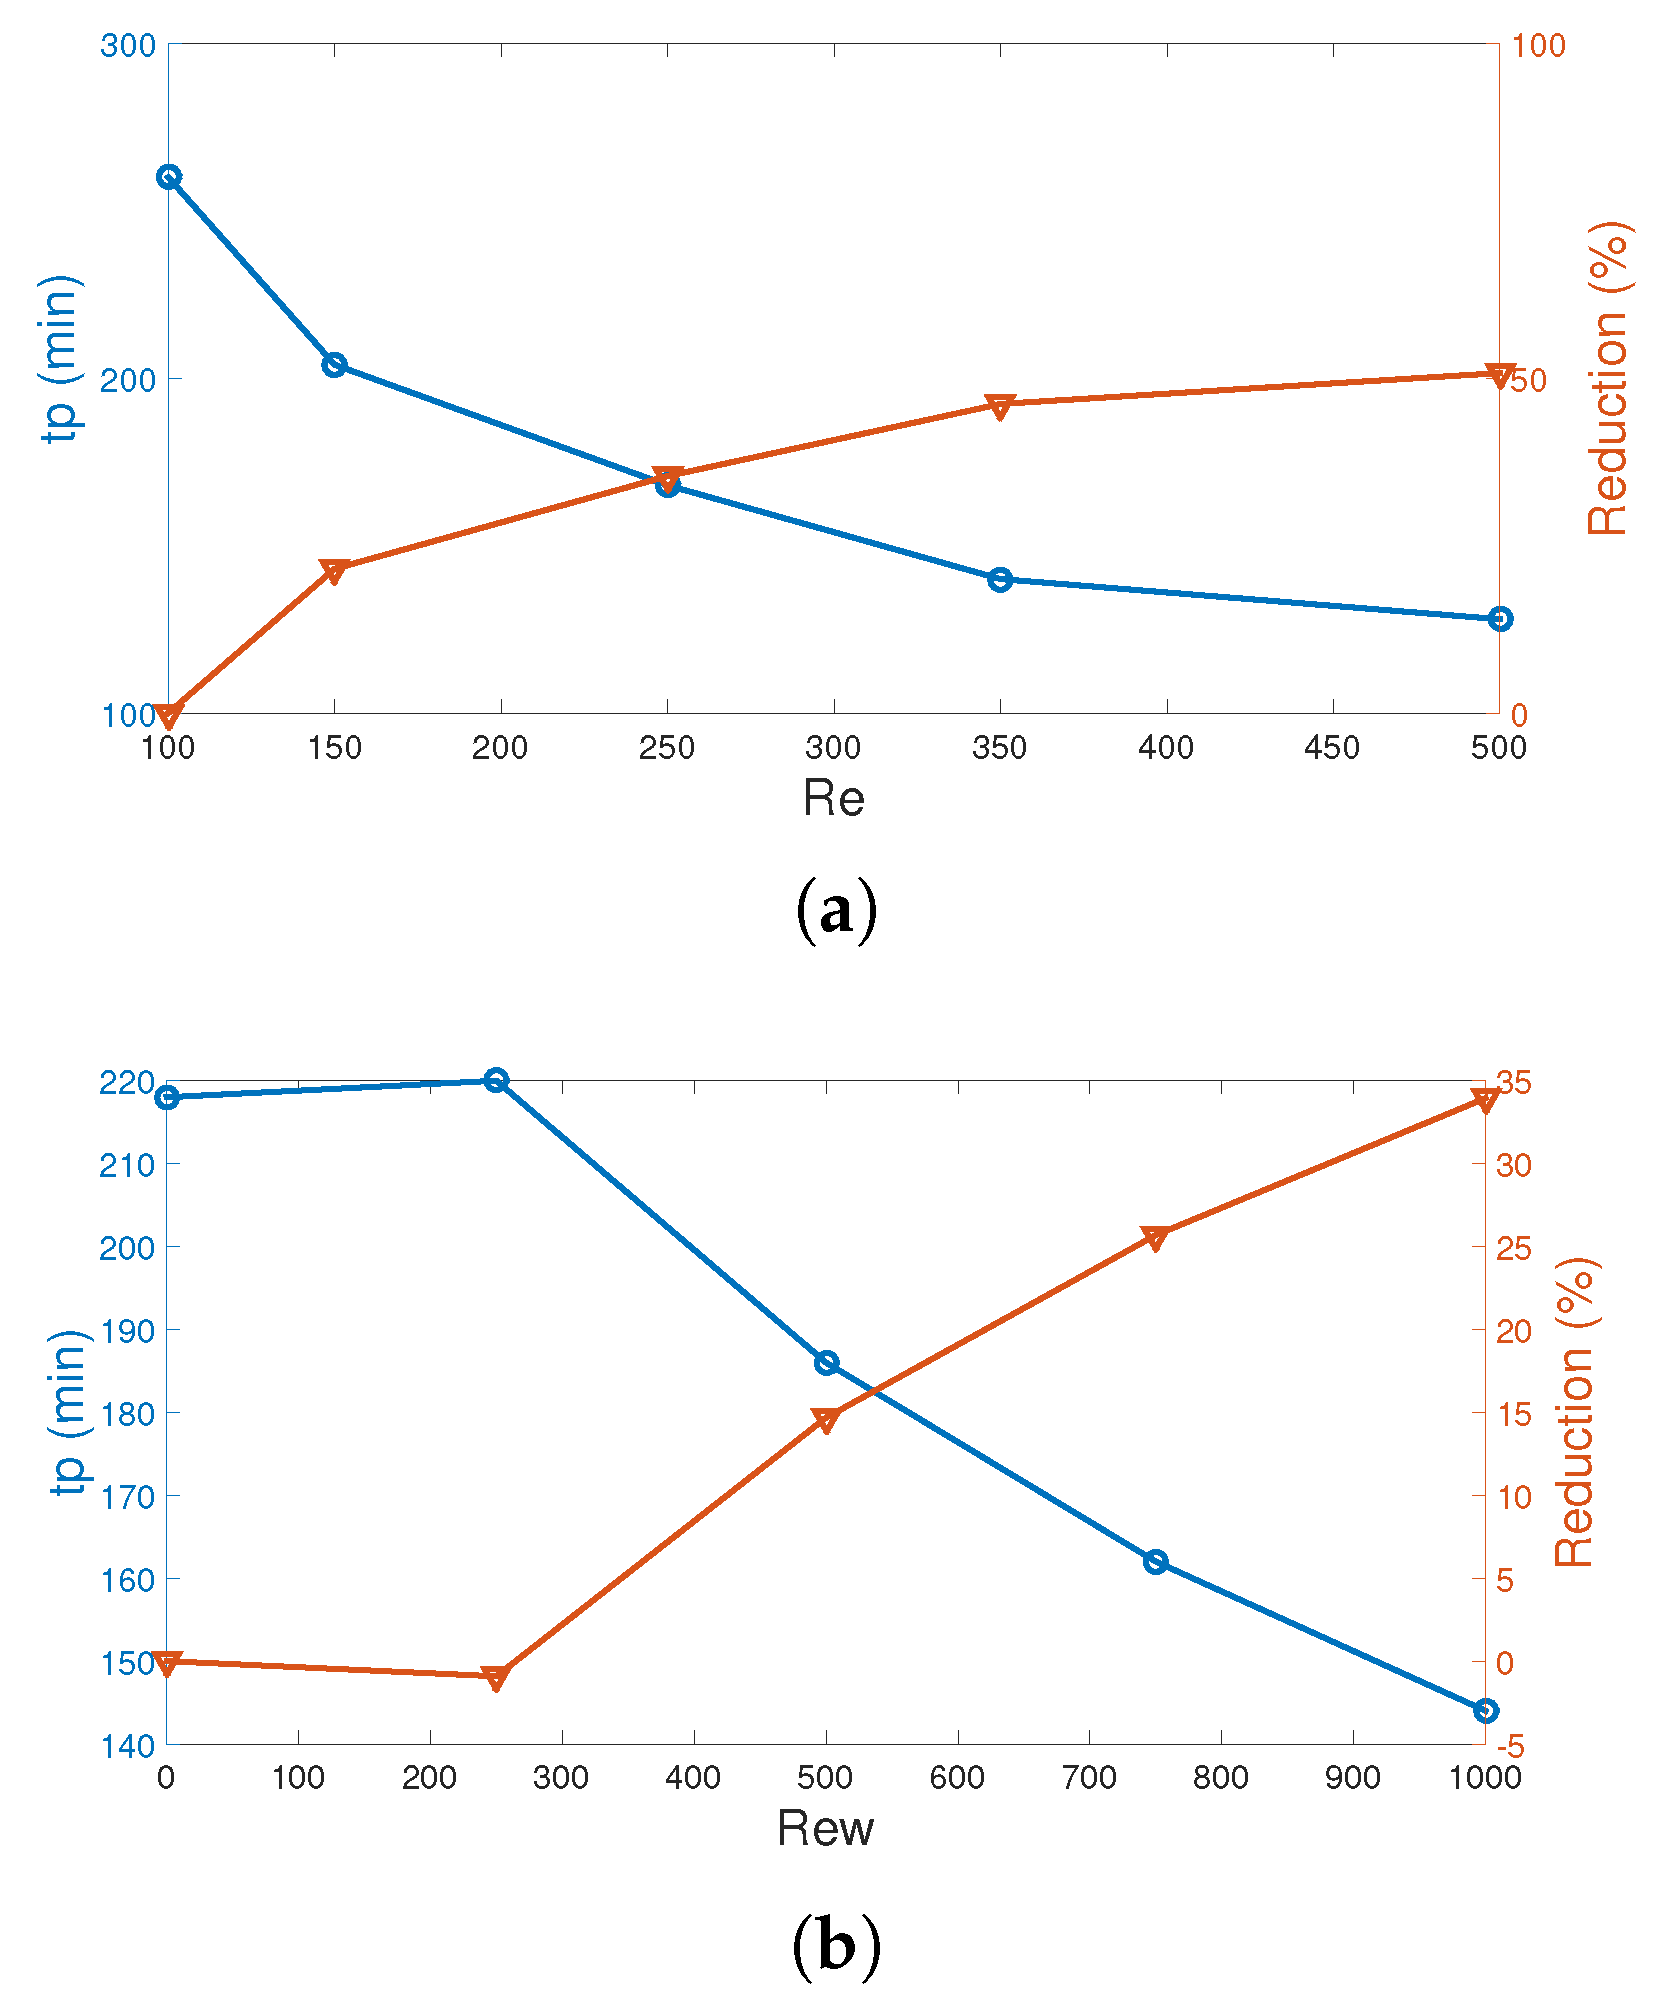
  • The impacts of surface rotation on the phase change become effective for lower values of fluid stream Re numbers.
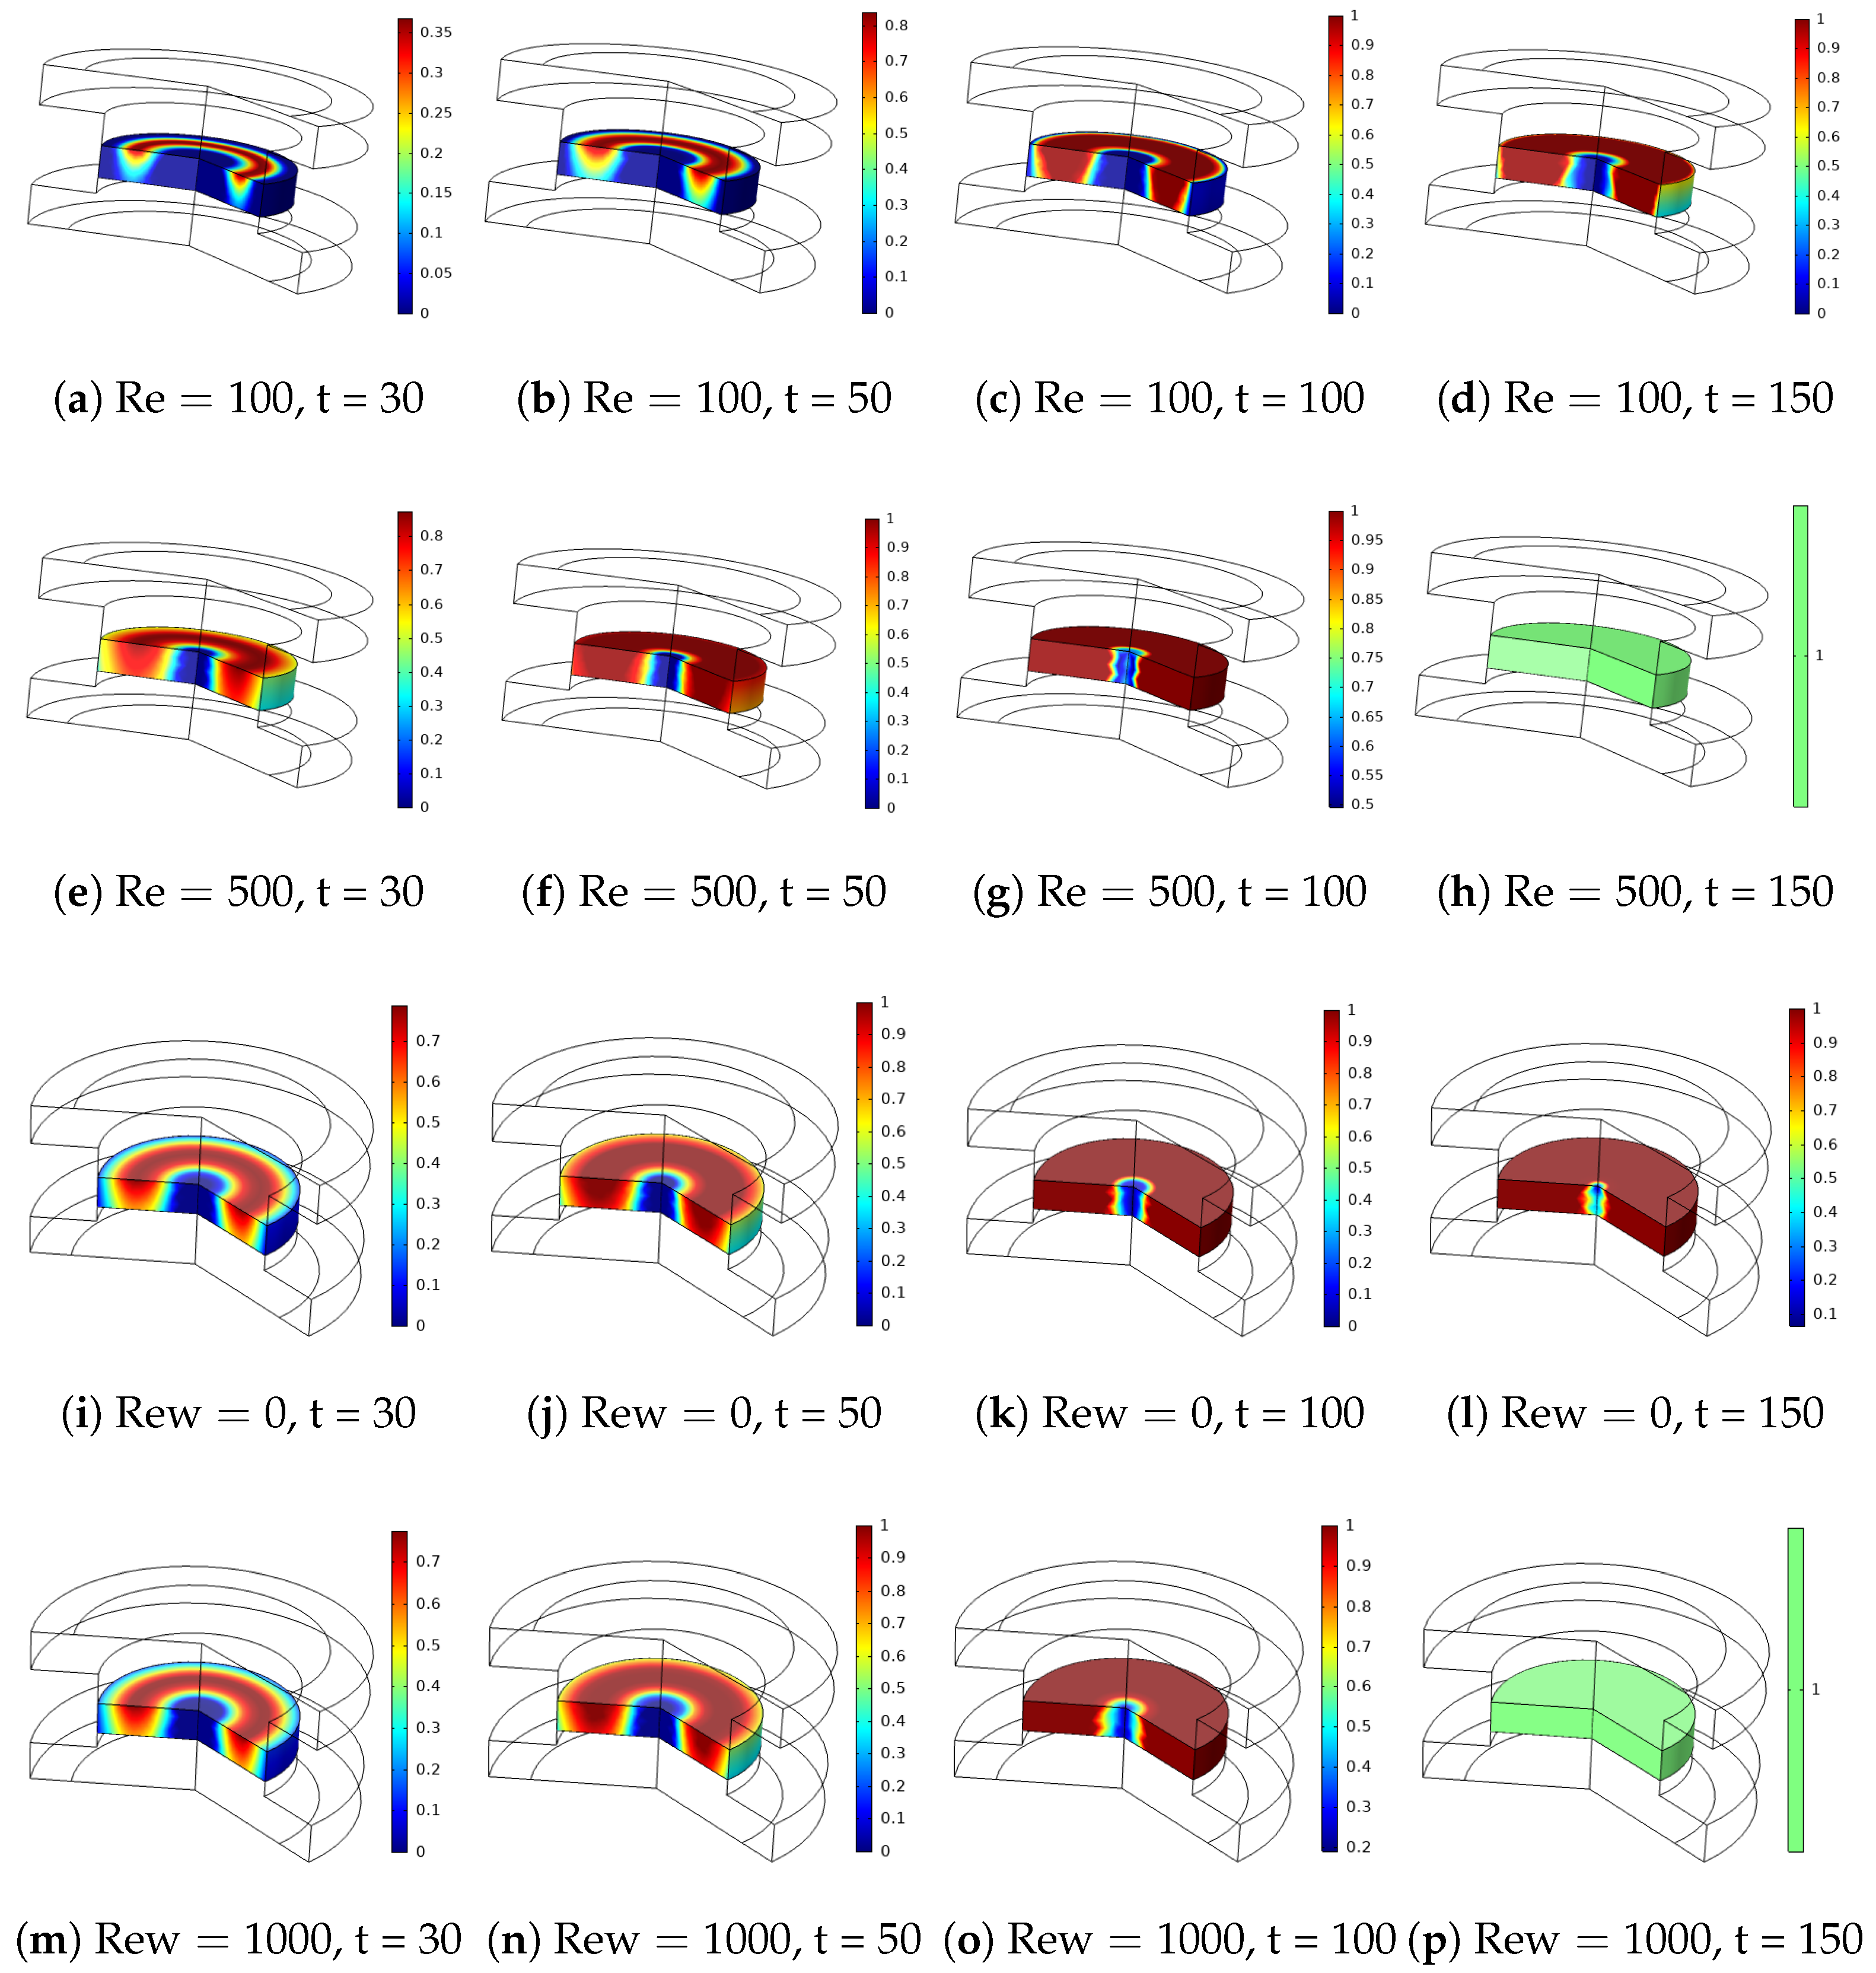
  • At the highest rotational speed of the surface, a 39.8% and 24.5% reduction in the phase transition time (tp) were achieved at Re = 100 and Re = 500.
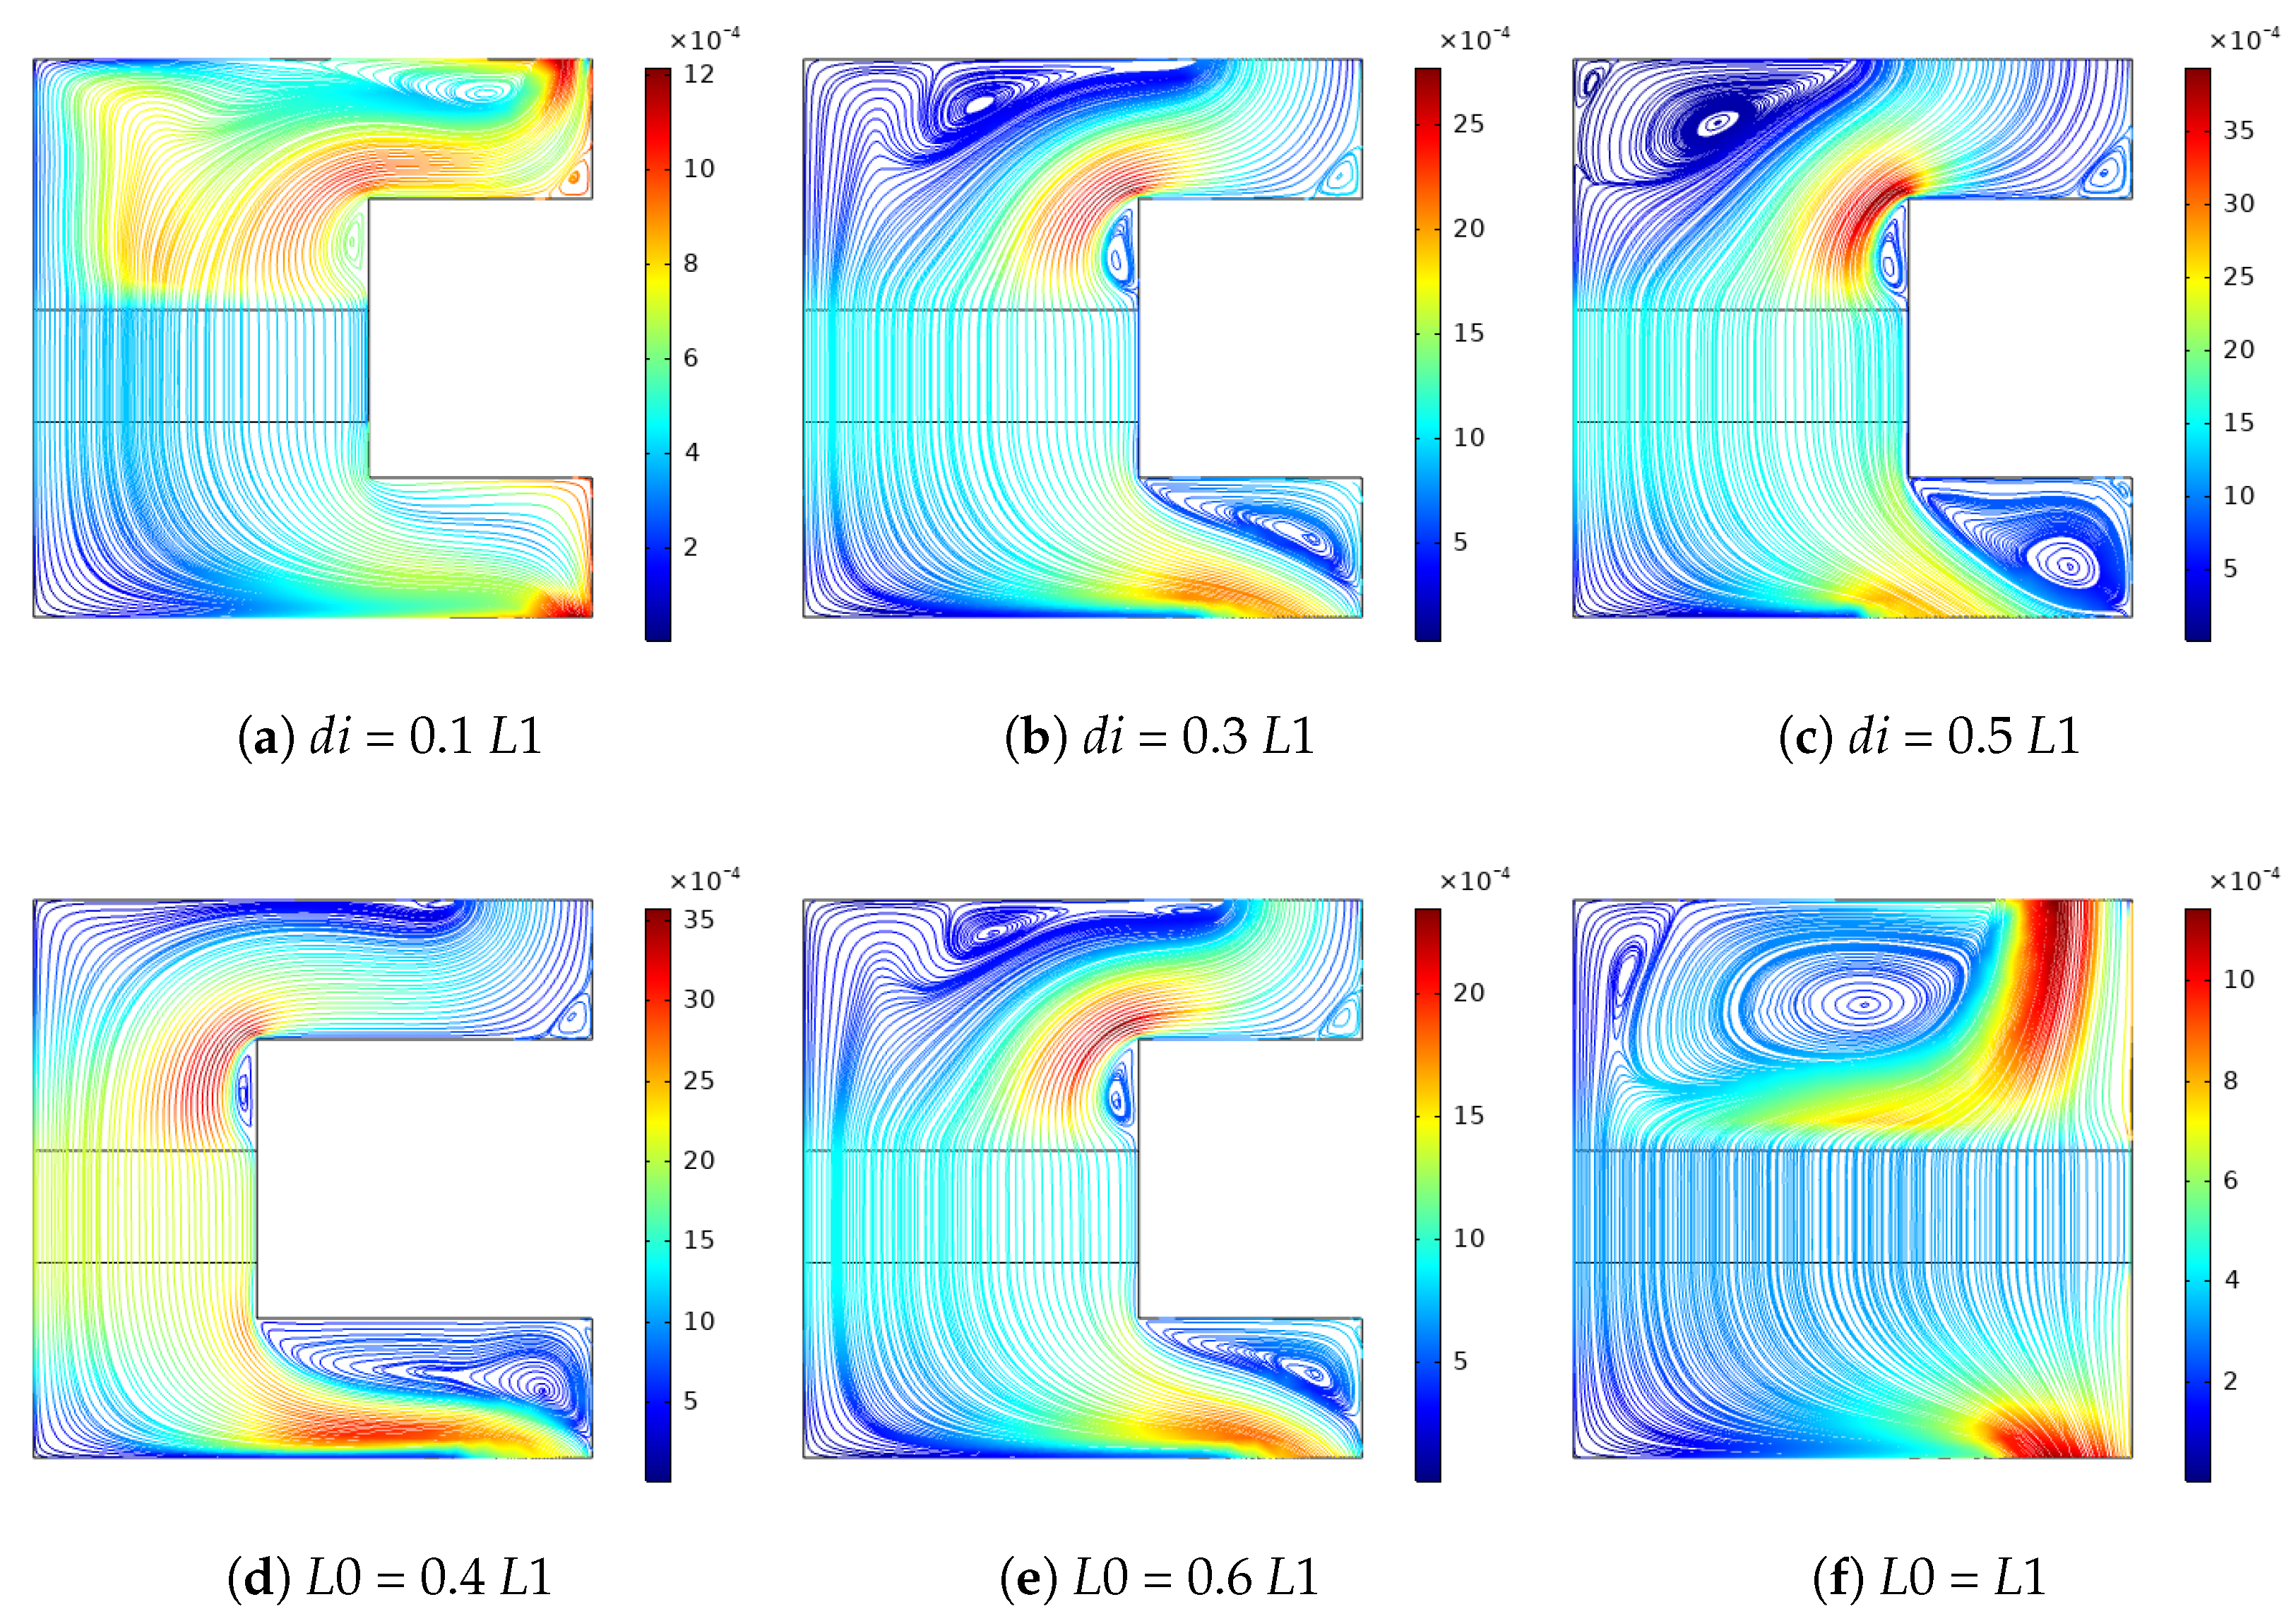
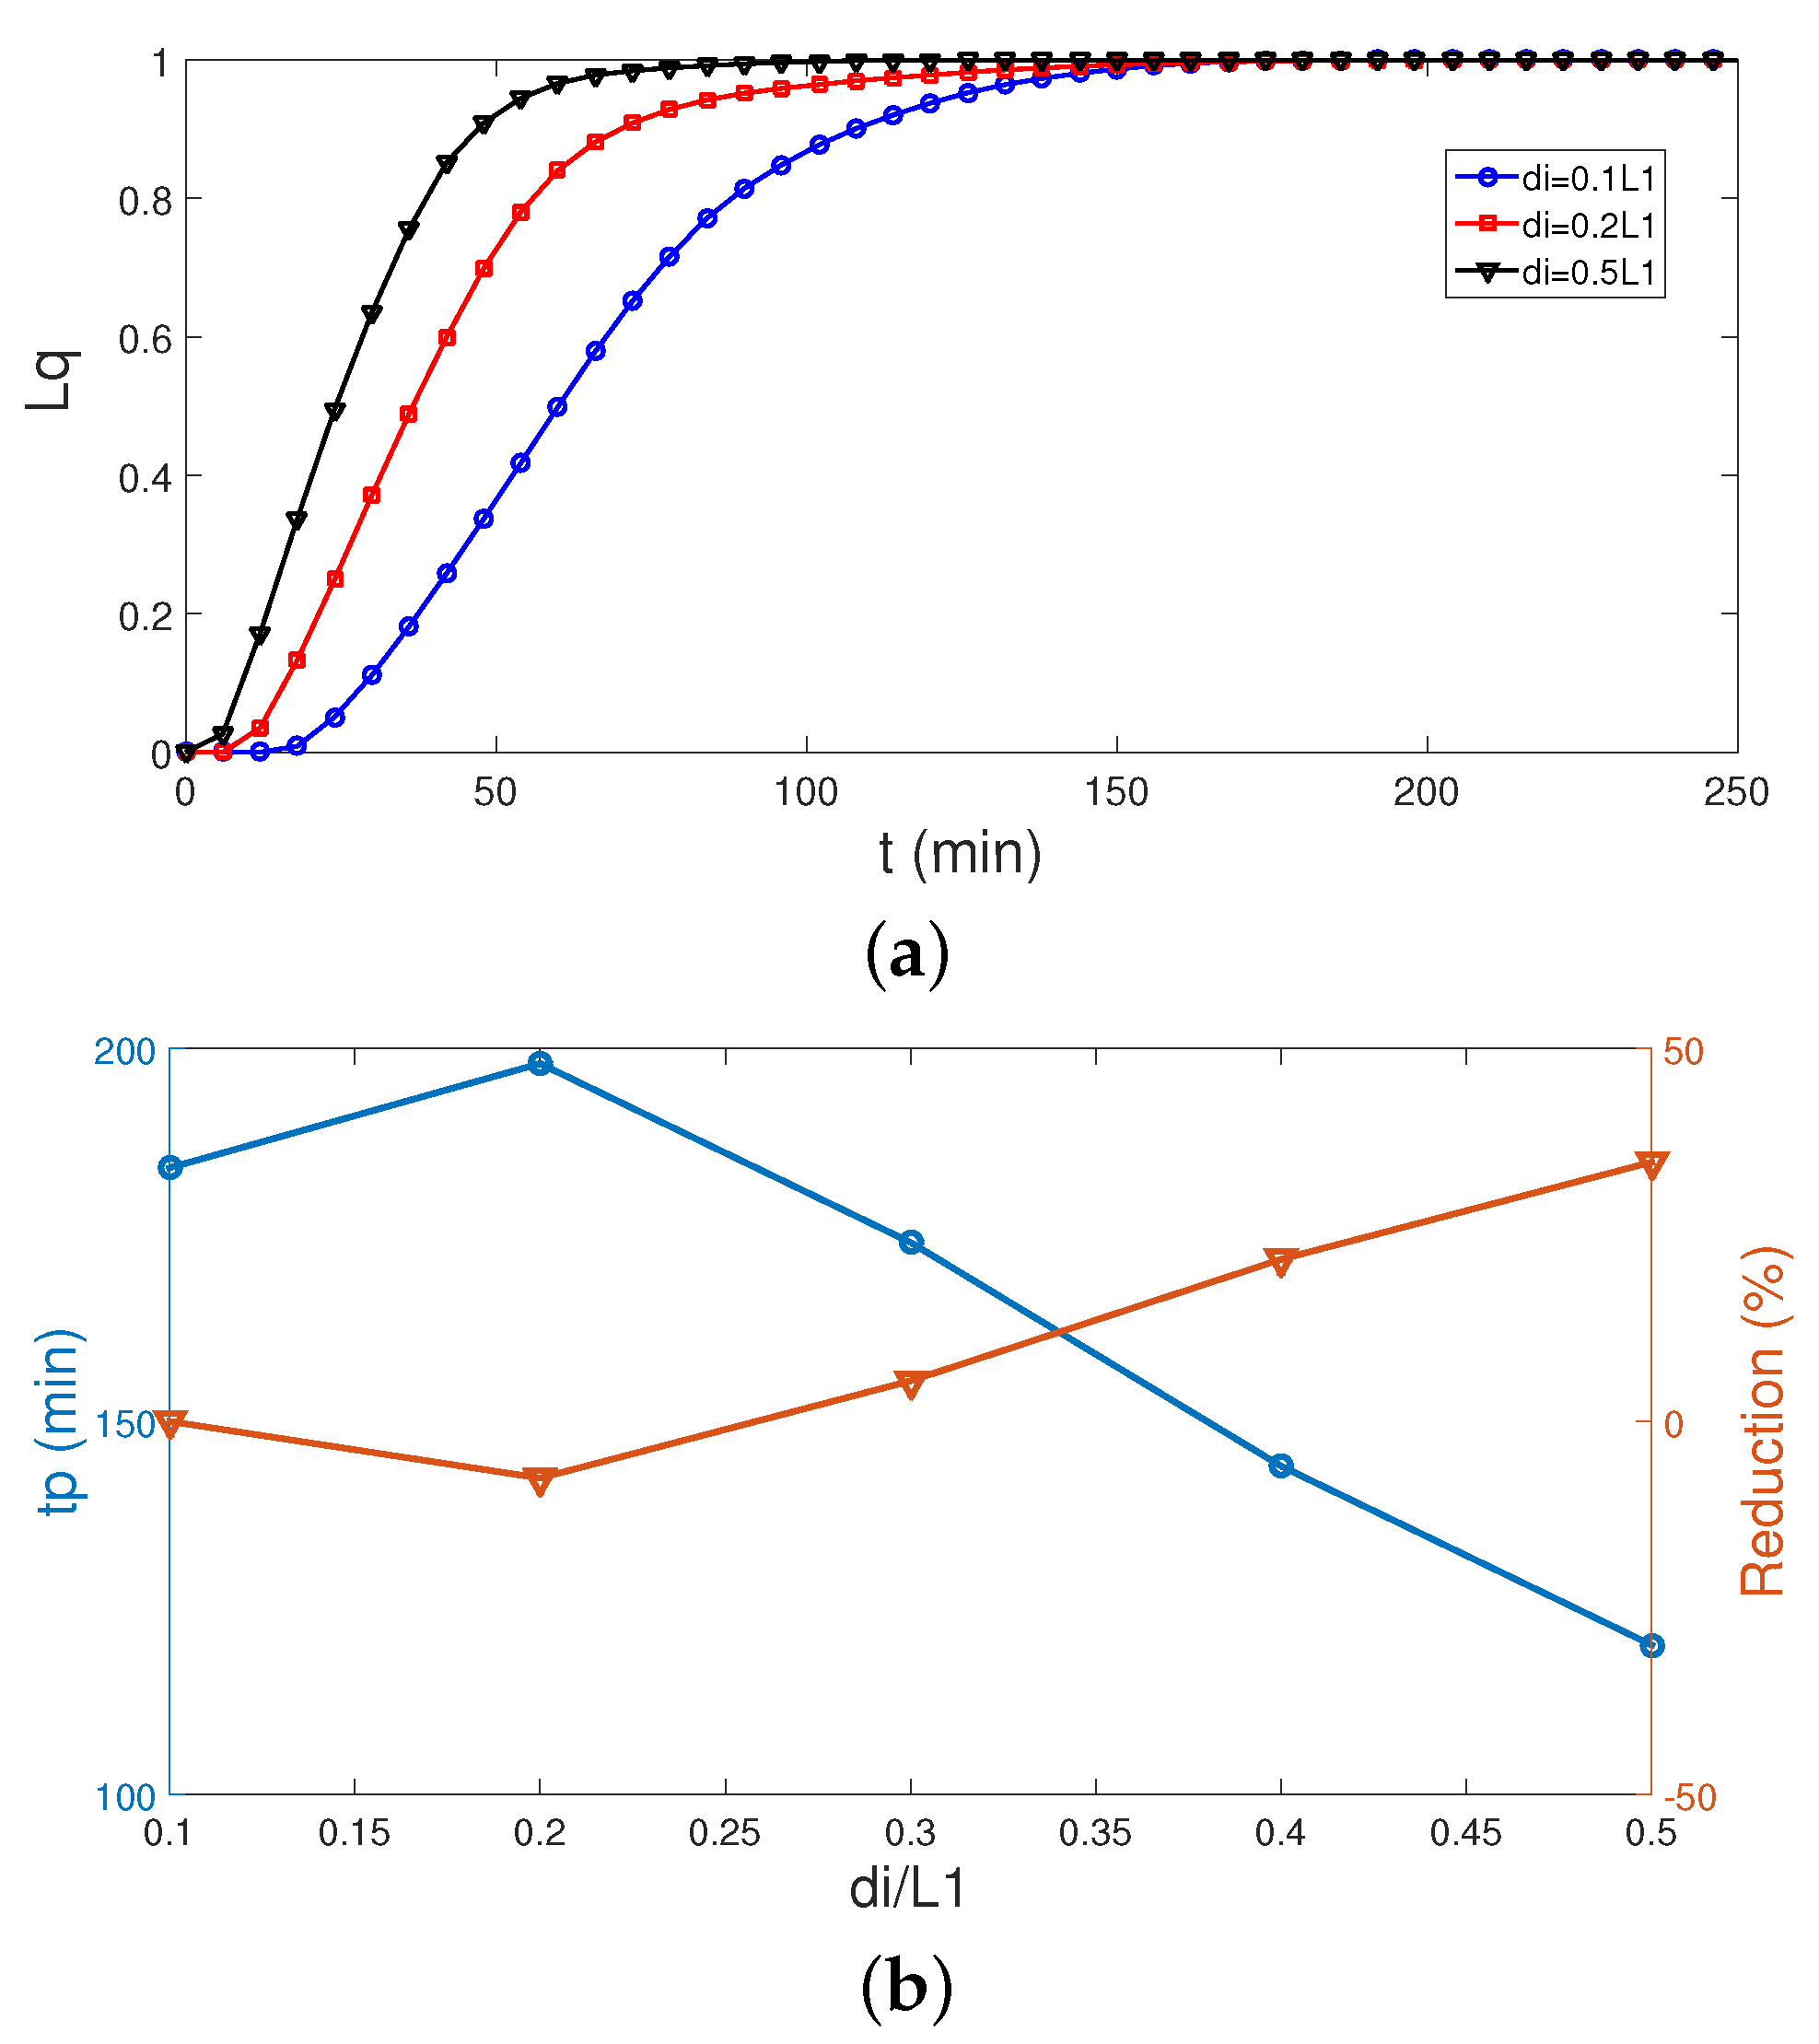
  • Flow recirculation, especially near the ports, are affected by the port sizes, while a larger port size accelerates the phase change process. When configurations with the smallest and largest port sizes are compared, a 34.8% reduction in tp is obtained.
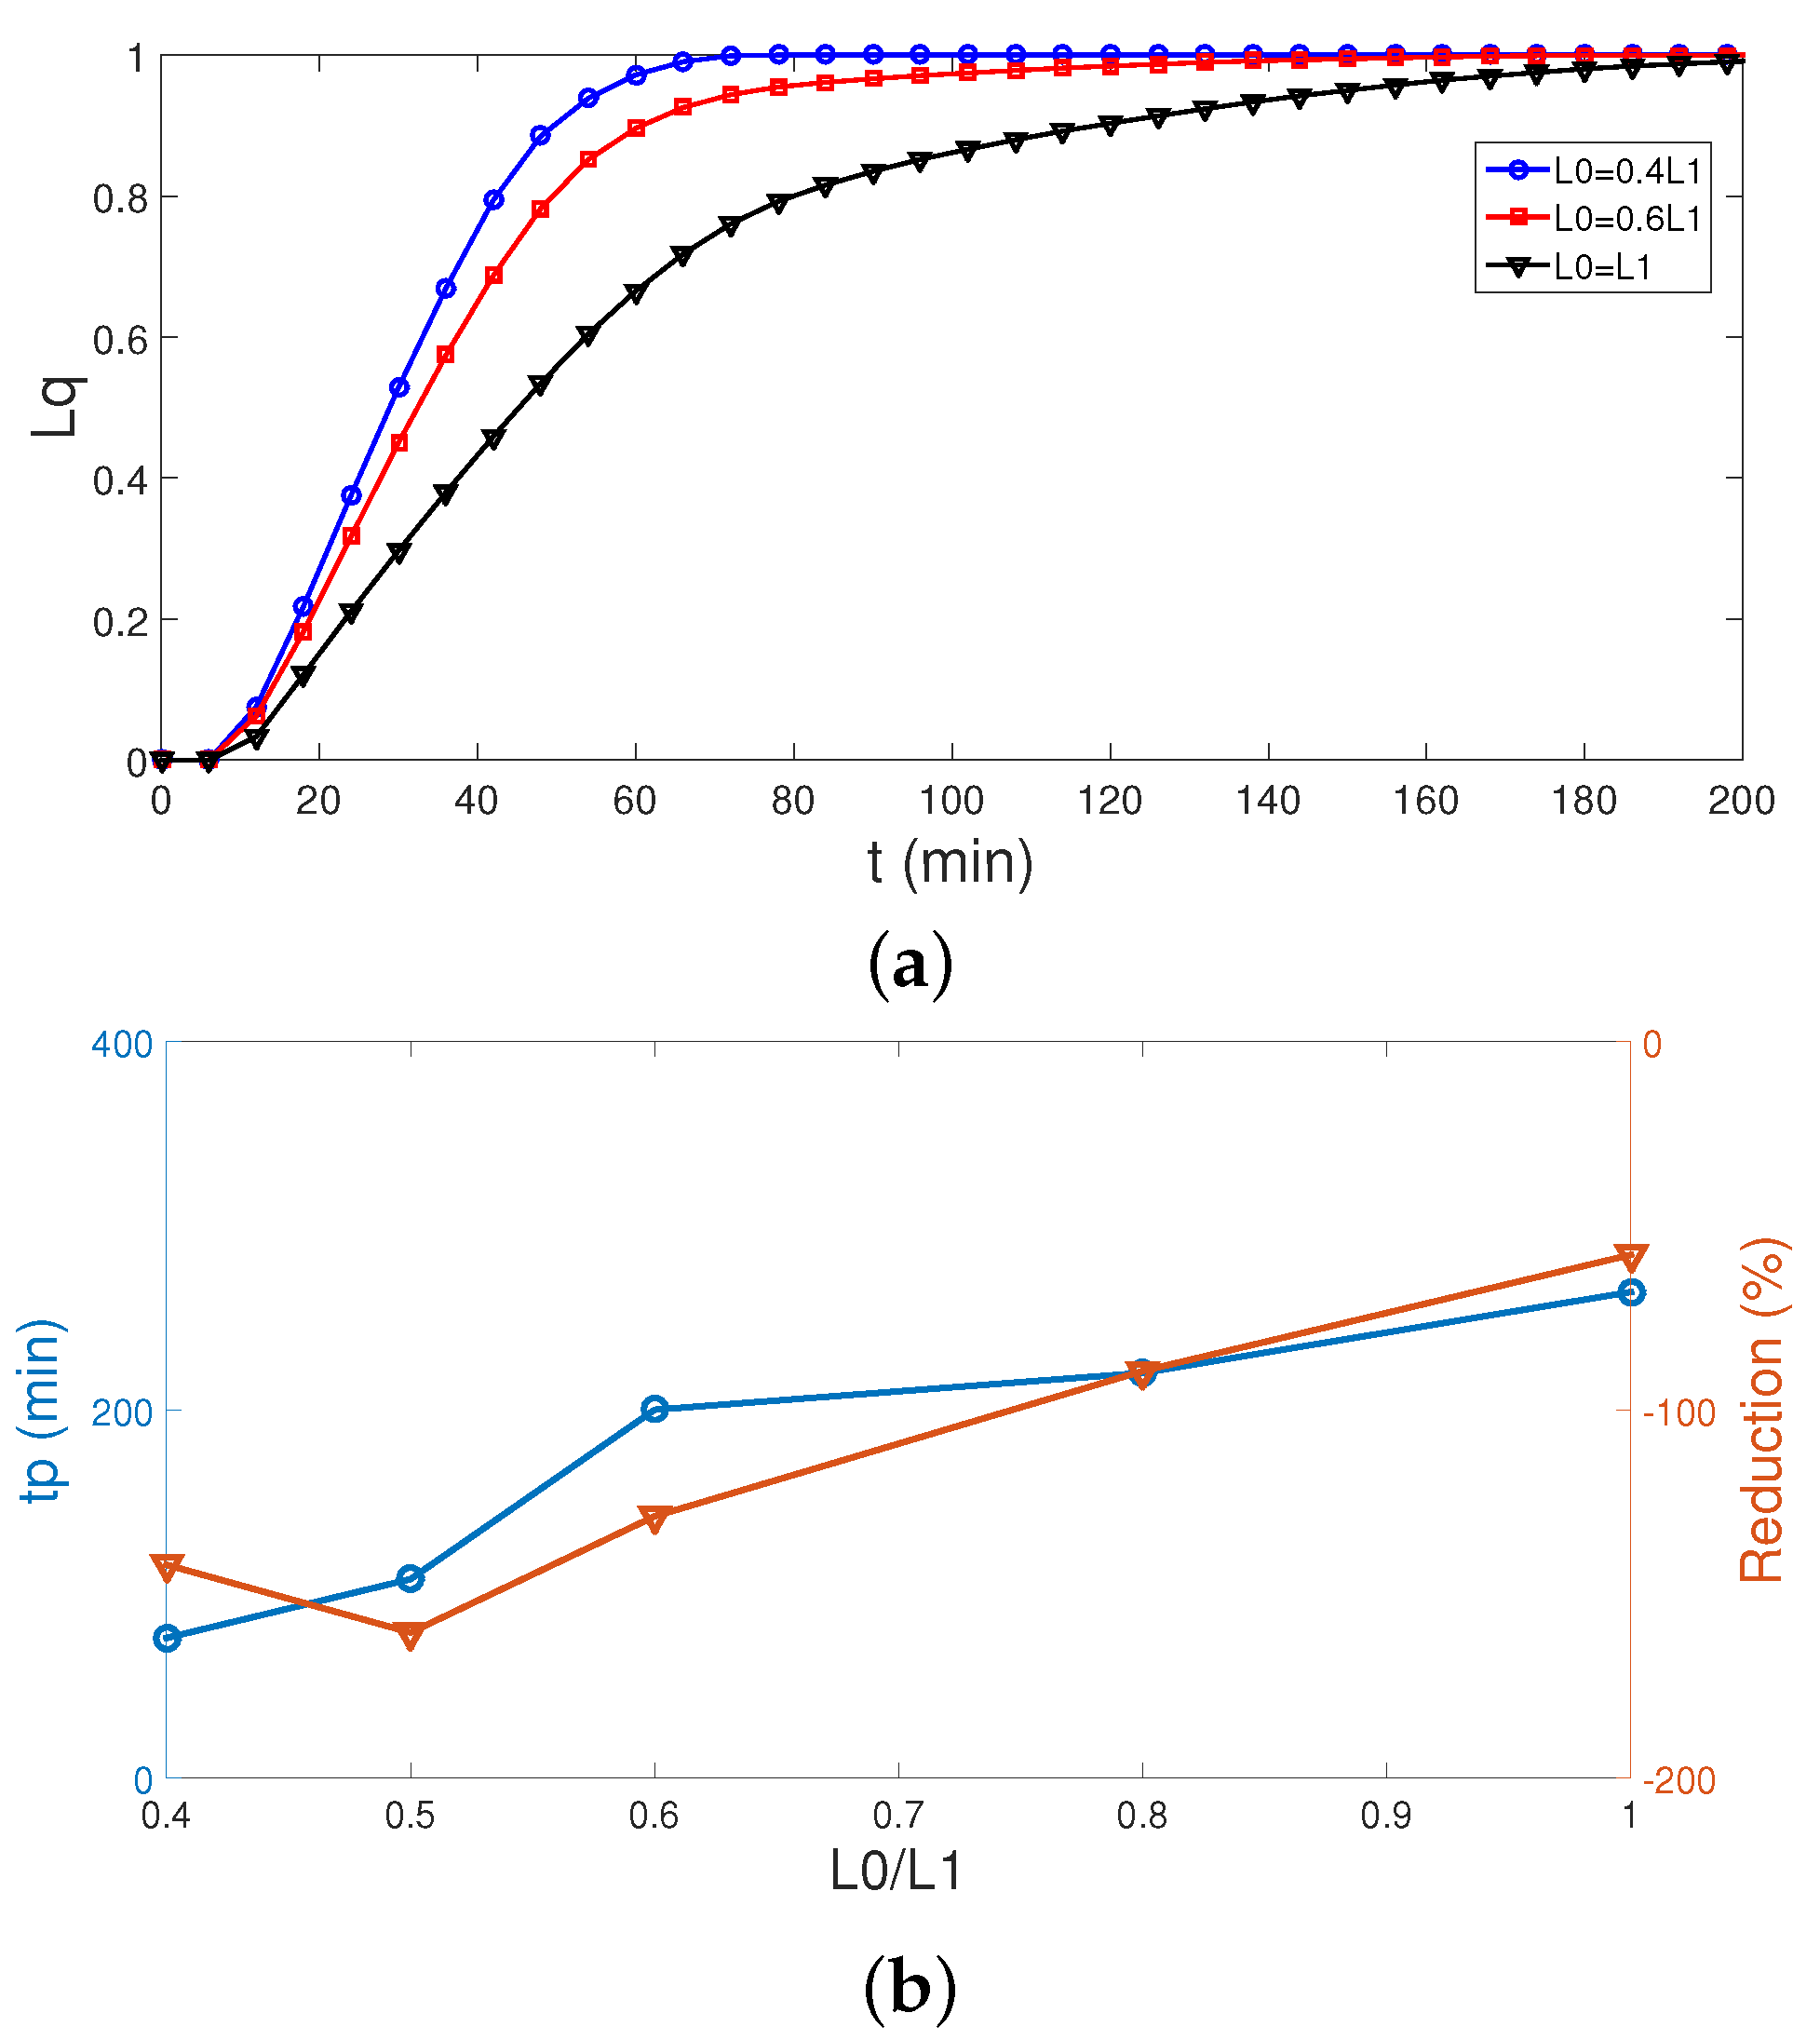
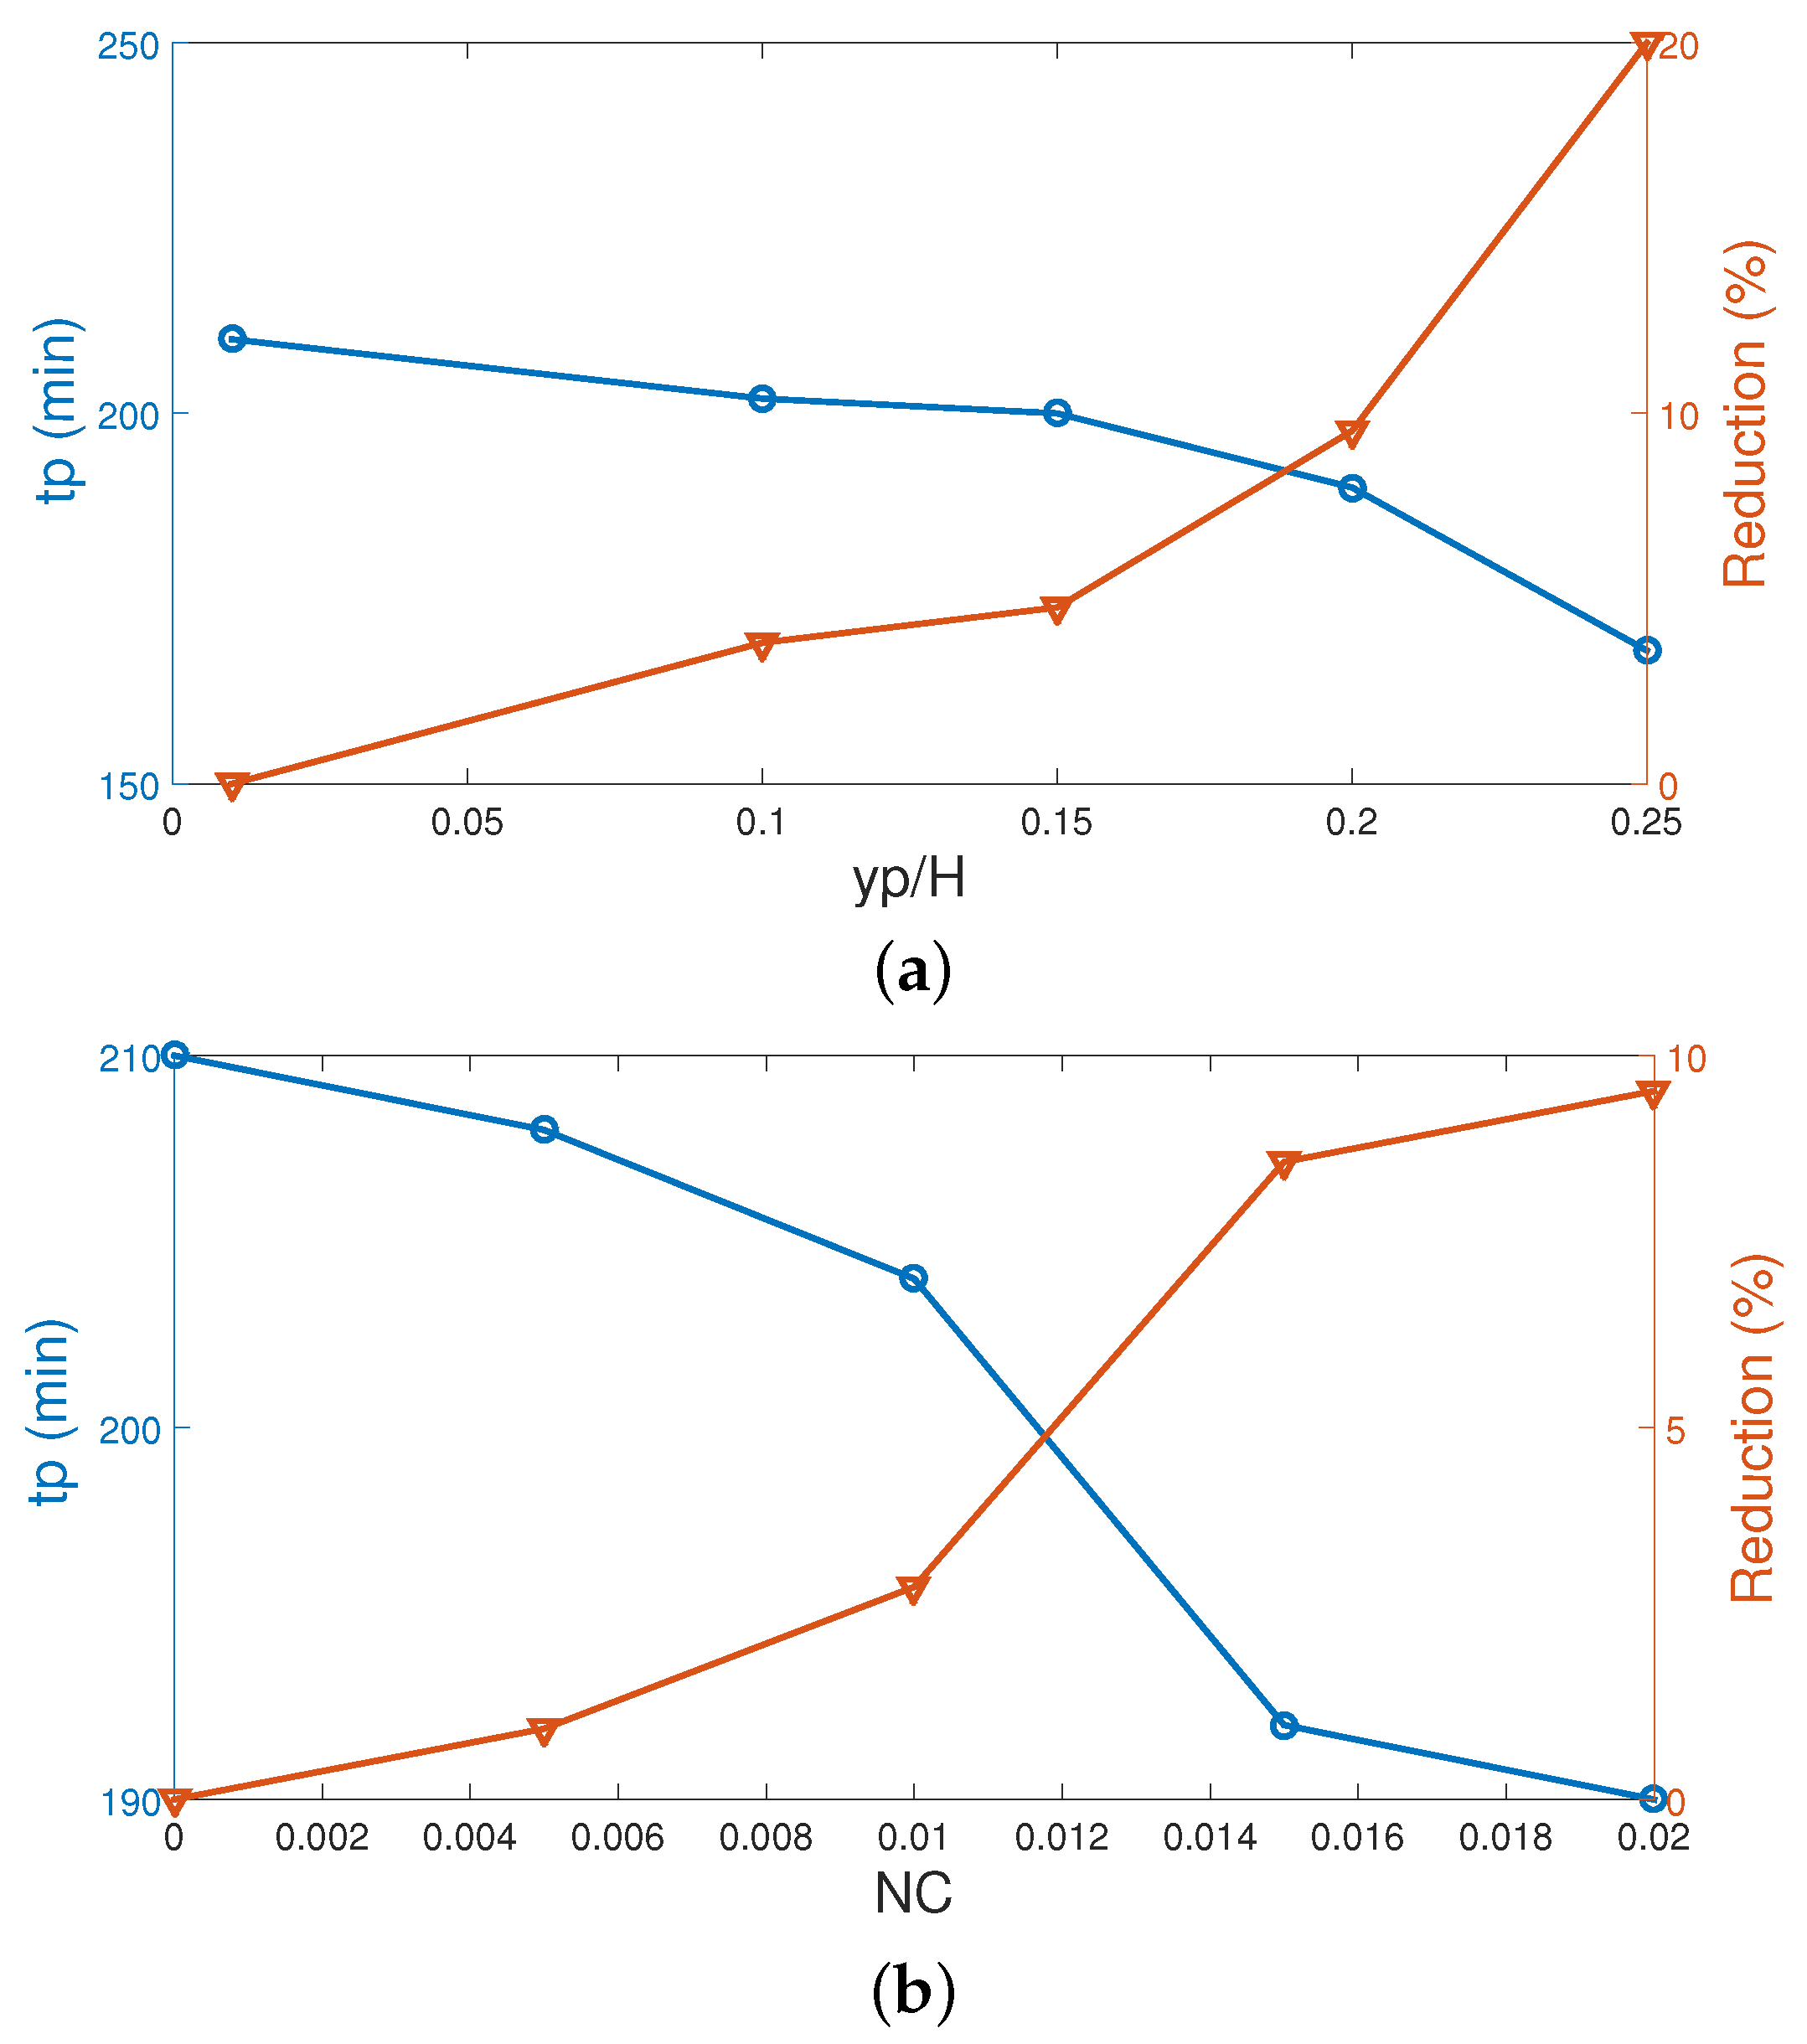
  • The size and vertical location of the PCM–PB system shows opposite behavior on the phase change dynamics. When the zone is closer to the inlet port, phase change accelerates. The reduction and increment in the tp are obtained as 20% and 58% for the largest yp and length of the PCM zone.
  • Inclusion of hybrid nanoparticles in the base HT fluid accelerates the phase transition and a tp reduction of about 9.5% is achieved at the highest nanoparticle loading.

Author Contributions

Conceptualization, F.S.; methodology, F.S., L.K. and M.O.; software, F.S.; validation, L.K.; formal analysis, F.S.; investigation, F.S., L.K. and M.O.; writing—original draft preparation, F.S.; writing—review and editing, F.S., L.K. and M.O.; visualization, F.S. and L.K.; supervision, F.S., L.K. and M.O. All authors have read and agreed to the published version of the manuscript.

Funding

The Deanship of Scientific Research (DSR) at King Abdulaziz University, Jeddah, Saudi Arabia has funded this project, under grant no. (FP-059-43).

Institutional Review Board Statement

Not applicable.

Informed Consent Statement

Not applicable.

Conflicts of Interest

The authors declare no conflict of interest.

Abbreviations

The following abbreviations are used in this manuscript:
diport size
Lqliquid fraction
kthermal conductivity
Hcavity height
hpcPCM–PB height
Lradius of cylinder
L0PCM–PB radius
L f latent heat of fusion
nunit normal vector
NuNusselt number
ppressure
PrPrandtl number
ReReynolds number
Rresidual
Rewrotational Reynolds number
ttime
tpfull phase transition time
Ttemperature
T m melting temperature
u, v, wvelocity components
Wweight function
r, zcylindrical coordinates
ypcdistance of PCM–PB from lower cavity
Greek Characters
ν kinematic viscosity
ρ density of the fluid
κ permeability
ε porosity
ω angular rotational speed
Subscripts
ccold
hhot
maverage
nfnanofluid
psolid particle

References

  1. Javadi, F.; Metselaar, H.; Ganesan, P. Performance improvement of solar thermal systems integrated with phase change materials (PCM), a review. Sol. Energy 2020, 206, 330–352. [Google Scholar] [CrossRef]
  2. Pomianowski, M.; Heiselberg, P.; Zhang, Y. Review of thermal energy storage technologies based on PCM application in buildings. Energy Build. 2013, 67, 56–69. [Google Scholar] [CrossRef]
  3. Khan, M.M.A.; Ibrahim, N.I.; Mahbubul, I.; Ali, H.M.; Saidur, R.; Al-Sulaiman, F.A. Evaluation of solar collector designs with integrated latent heat thermal energy storage: A review. Sol. Energy 2018, 166, 334–350. [Google Scholar] [CrossRef]
  4. Shon, J.; Kim, H.; Lee, K. Improved heat storage rate for an automobile coolant waste heat recovery system using phase-change material in a fin–tube heat exchanger. Appl. Energy 2014, 113, 680–689. [Google Scholar] [CrossRef]
  5. Zhao, C.; Lu, W.; Tian, Y. Heat transfer enhancement for thermal energy storage using metal foams embedded within phase change materials (PCMs). Sol. Energy 2010, 84, 1402–1412. [Google Scholar] [CrossRef] [Green Version]
  6. Mat, S.; Al-Abidi, A.A.; Sopian, K.; Sulaiman, M.Y.; Mohammad, A.T. Enhance heat transfer for PCM melting in triplex tube with internal–external fins. Energy Convers. Manag. 2013, 74, 223–236. [Google Scholar] [CrossRef]
  7. Mahian, O.; Ghafarian, S.; Sarrafha, H.; Kasaeian, A.; Yousefi, H.; Yan, W.M. Phase change materials in solar photovoltaics applied in buildings: An overview. Sol. Energy 2021, 224, 569–592. [Google Scholar] [CrossRef]
  8. Hajizadeh, M.R.; Selimefendigil, F.; Muhammad, T.; Ramzan, M.; Babazadeh, H.; Li, Z. Solidification of PCM with nano powders inside a heat exchanger. J. Mol. Liq. 2020, 306, 112892. [Google Scholar] [CrossRef]
  9. Safaei, M.R.; Goshayeshi, H.R.; Chaer, I. Solar still efficiency enhancement by using graphene oxide/paraffin nano-PCM. Energies 2019, 12, 2002. [Google Scholar] [CrossRef] [Green Version]
  10. Singh, H.; Saini, R.; Saini, J. A review on packed bed solar energy storage systems. Renew. Sustain. Energy Rev. 2010, 14, 1059–1069. [Google Scholar] [CrossRef]
  11. de Gracia, A.; Cabeza, L.F. Numerical simulation of a PCM packed bed system: A review. Renew. Sustain. Energy Rev. 2017, 69, 1055–1063. [Google Scholar] [CrossRef] [Green Version]
  12. Selimefendigil, F.; Öztop, H.F. Analysis of hybrid nanofluid and surface corrugation in the laminar convective flow through an encapsulated PCM filled vertical cylinder and POD-based modeling. Int. J. Heat Mass Transf. 2021, 178, 121623. [Google Scholar] [CrossRef]
  13. Saeidi, S.; Khodadadi, J. Forced convection in a square cavity with inlet and outlet ports. Int. J. Heat Mass Transf. 2006, 49, 1896–1906. [Google Scholar] [CrossRef]
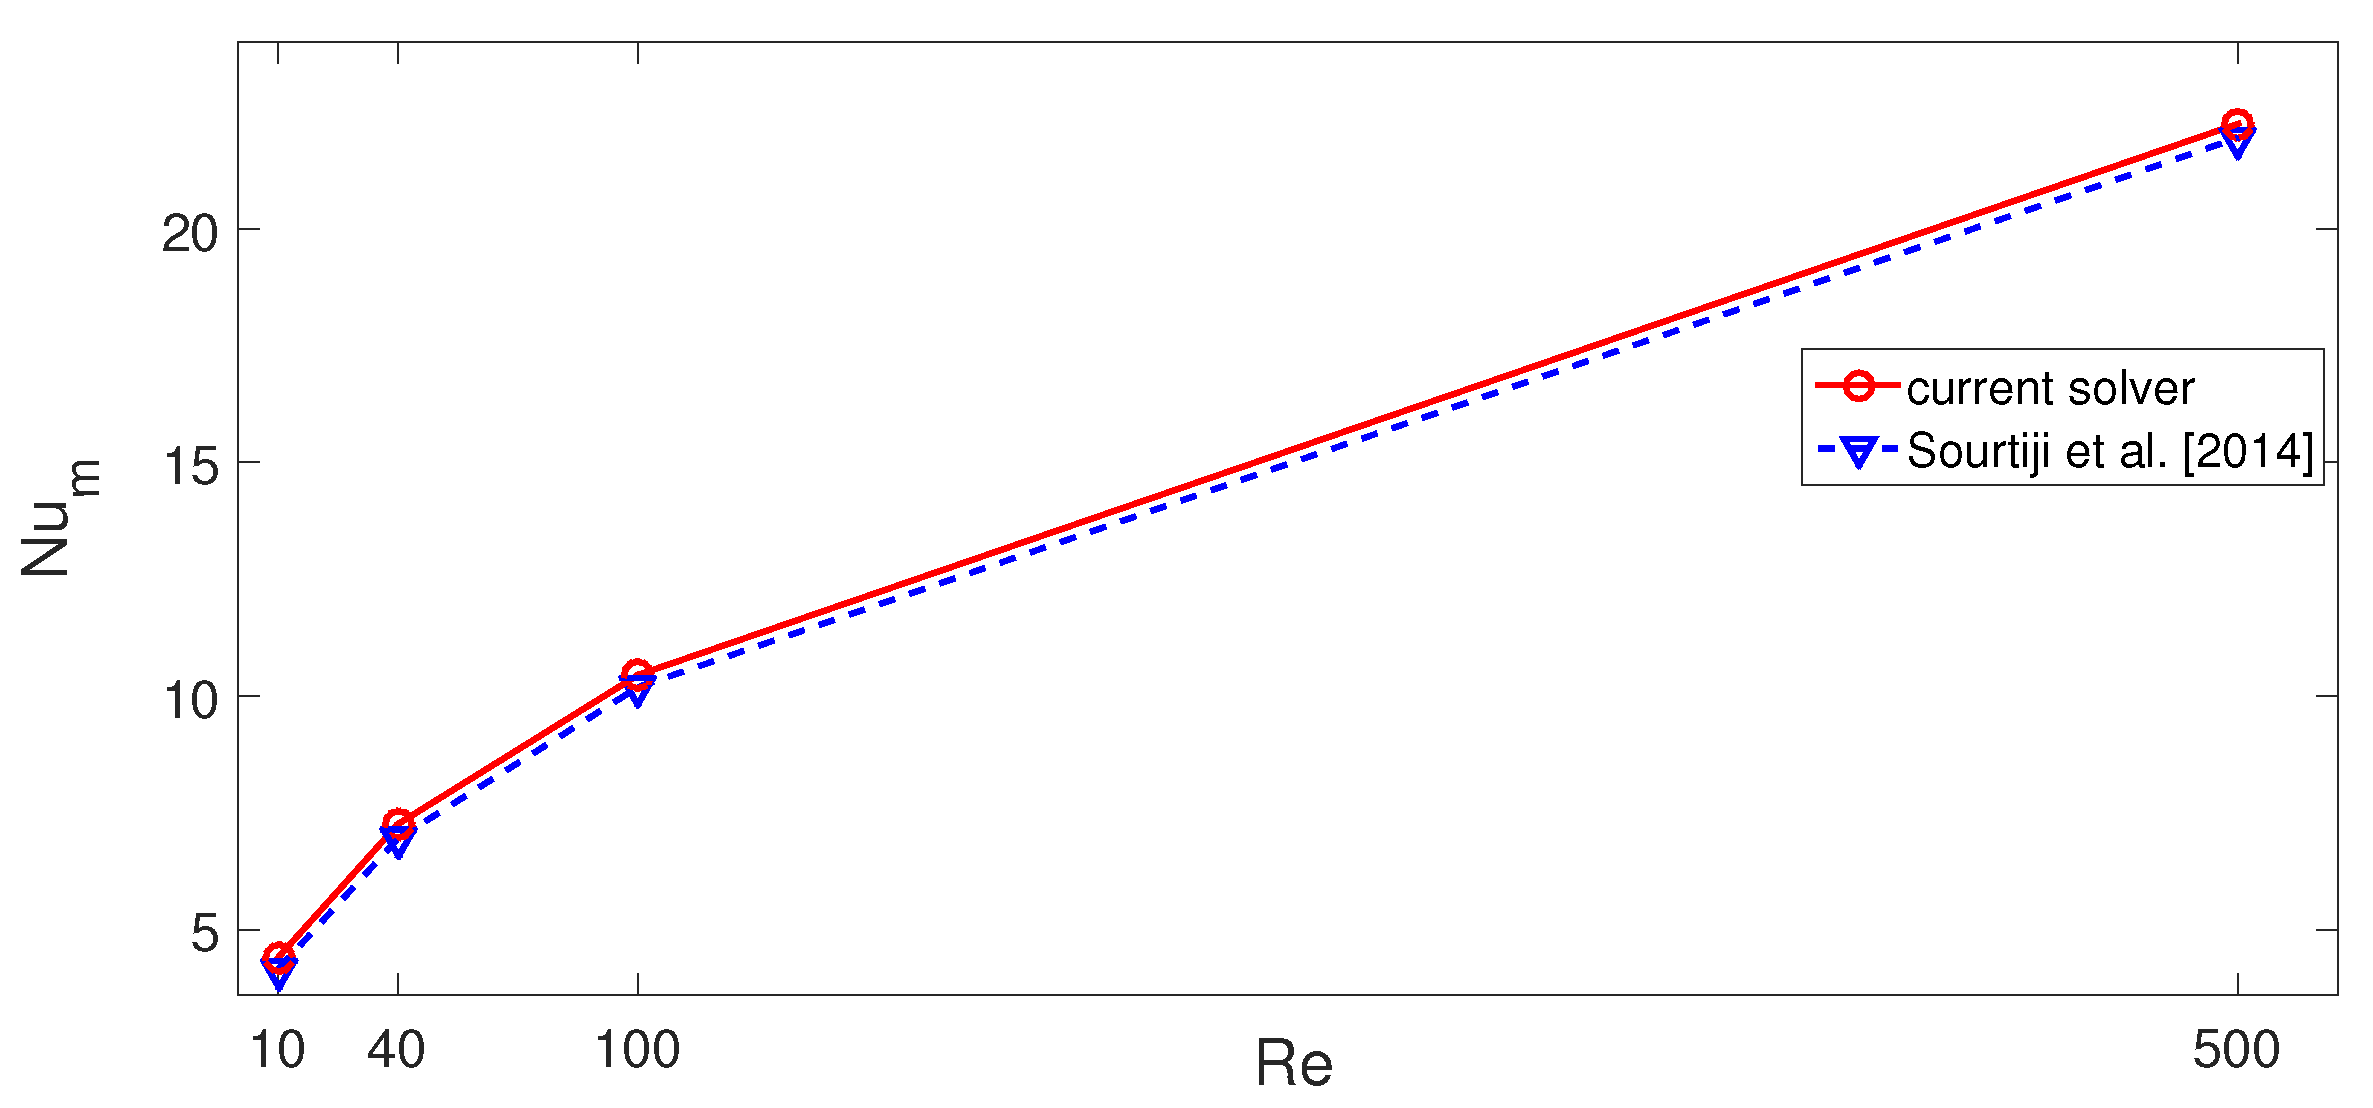
  14. Sourtiji, E.; Gorji-Bandpy, M.; Ganji, D.; Hosseinizadeh, S. Numerical analysis of mixed convection heat transfer of Al2O3-water nanofluid in a ventilated cavity considering different positions of the outlet port. Powder Technol. 2014, 262, 71–81. [Google Scholar] [CrossRef]
  15. Selimefendigil, F.; Öztop, H.F. Fluid-solid interaction of elastic-step type corrugation effects on the mixed convection of nanofluid in a vented cavity with magnetic field. Int. J. Mech. Sci. 2019, 152, 185–197. [Google Scholar] [CrossRef]
  16. Kherroubi, S.; Benkahla, Y.K.; Boutra, A.; Bensaci, A. Two-and three-dimensional comparative study of heat transfer and pressure drop characteristics of nanofluids flow through a ventilated cubic cavity (part II: Non-Newtonian nanofluids under the influence of a magnetic field). J. Therm. Anal. Calorim. 2020, 1–28. [Google Scholar] [CrossRef]
  17. Ezzouhri, R.; Joubert, P.; Penot, F.; Mergui, S. Large Eddy simulation of turbulent mixed convection in a 3D ventilated cavity: Comparison with existing data. Int. J. Therm. Sci. 2009, 48, 2017–2024. [Google Scholar] [CrossRef]
  18. Lariani, A.; Nesreddine, H.; Galanis, N. Numerical and experimental study of 3D turbulent airflow in a full scale heated ventilated room. Eng. Appl. Comput. Fluid Mech. 2009, 3, 1–14. [Google Scholar] [CrossRef] [Green Version]
  19. Selimefendigil, F.; Öztop, H.F. Impact of a rotating cone on forced convection of Ag–MgO/water hybrid nanofluid in a 3D multiple vented T-shaped cavity considering magnetic field effects. J. Therm. Anal. Calorim. 2021, 143, 1485–1501. [Google Scholar] [CrossRef]
  20. Khan, Z.; Hamid, M.; Khan, W.; Sun, L.; Liu, H. Thermal non-equilibrium natural convection in a trapezoidal porous cavity with heated cylindrical obstacles. Int. Commun. Heat Mass Transf. 2021, 126, 105460. [Google Scholar] [CrossRef]
  21. Selimefendigil, F.; Öztop, H.F.; Abu-Hamdeh, N. Impacts of conductive inner L-shaped obstacle and elastic bottom wall on MHD forced convection of a nanofluid in vented cavity. J. Therm. Anal. Calorim. 2020, 141, 465–482. [Google Scholar] [CrossRef]
  22. Aly, A.M. Mixing between solid and fluid particles during natural convection flow of a nanofluid-filled H-shaped cavity with three center gates using ISPH method. Int. J. Heat Mass Transf. 2020, 157, 119803. [Google Scholar] [CrossRef]
  23. Khan, Z.H.; Khan, W.A.; Sheremet, M.; Hamid, M.; Du, M. Irreversibilities in natural convection inside a right-angled trapezoidal cavity with sinusoidal wall temperature. Phys. Fluids 2021, 33, 083612. [Google Scholar] [CrossRef]
  24. Mehrizi, A.A.; Farhadi, M.; Afroozi, H.H.; Sedighi, K.; Darz, A.R. Mixed convection heat transfer in a ventilated cavity with hot obstacle: Effect of nanofluid and outlet port location. Int. Commun. Heat Mass Transf. 2012, 39, 1000–1008. [Google Scholar] [CrossRef]
  25. Hussain, S.; Jamal, M.; Geridonmez, B.P. Impact of fins and inclined magnetic field in double lid-driven cavity with Cu–water nanofluid. Int. J. Therm. Sci. 2021, 161, 106707. [Google Scholar] [CrossRef]
  26. Shih, Y.C.; Khodadadi, J.; Nien, S.W.; Zeng, Y.; Huang, X.L. Impact of an oscillating guide vane on the thermo-hydraulic fields in a square cavity with single inlet and outlet ports. Int. J. Heat Mass Transf. 2019, 128, 1184–1200. [Google Scholar] [CrossRef]
  27. Jasim, L.M.; Hamzah, H.; Canpolat, C.; Sahin, B. Mixed convection flow of hybrid nanofluid through a vented enclosure with an inner rotating cylinder. Int. Commun. Heat Mass Transf. 2021, 121, 105086. [Google Scholar] [CrossRef]
  28. Selimefendigil, F.; Öztop, H.F. Estimation of the mixed convection heat transfer of a rotating cylinder in a vented cavity subjected to nanofluid by using generalized neural networks. Numer. Heat Transf. Part A Appl. 2014, 65, 165–185. [Google Scholar] [CrossRef]
  29. Velazquez, A.; Arias, J.; Montanes, J. Pulsating flow and convective heat transfer in a cavity with inlet and outlet sections. Int. J. Heat Mass Transf. 2009, 52, 647–654. [Google Scholar] [CrossRef] [Green Version]
  30. Chamkha, A.J.; Selimefendigil, F.; Oztop, H.F. Pulsating flow of CNT—Water nanofluid mixed convection in a vented trapezoidal cavity with an inner conductive T-shaped object and magnetic field effects. Energies 2020, 13, 848. [Google Scholar] [CrossRef] [Green Version]
  31. Benzema, M.; Benkahla, Y.K.; Labsi, N.; Ouyahia, S.E.; El Ganaoui, M. Second law analysis of MHD mixed convection heat transfer in a vented irregular cavity filled with Ag–MgO/water hybrid nanofluid. J. Therm. Anal. Calorim. 2019, 137, 1113–1132. [Google Scholar] [CrossRef]
  32. Ismael, M.A.; Jasim, H.F. Role of the fluid-structure interaction in mixed convection in a vented cavity. Int. J. Mech. Sci. 2018, 135, 190–202. [Google Scholar] [CrossRef]
  33. Ahmed, S.E. Caputo fractional convective flow in an inclined wavy vented cavity filled with a porous medium using Al2O3-Cu hybrid nanofluids. Int. Commun. Heat Mass Transf. 2020, 116, 104690. [Google Scholar] [CrossRef]
  34. Hamid, M.; Khan, Z.; Khan, W.; Haq, R. Natural convection of water-based carbon nanotubes in a partially heated rectangular fin-shaped cavity with an inner cylindrical obstacle. Phys. Fluids 2019, 31, 103607. [Google Scholar] [CrossRef]
  35. Shirvan, K.M.; Öztop, H.F.; Al-Salem, K. Mixed magnetohydrodynamic convection in a Cu-water-nanofluid-filled ventilated square cavity using the Taguchi method: A numerical investigation and optimization. Eur. Phys. J. Plus 2017, 132, 204. [Google Scholar] [CrossRef]
  36. Khan, Z.; Khan, W.; Hamid, M.; Liu, H. Finite element analysis of hybrid nanofluid flow and heat transfer in a split lid-driven square cavity with Y-shaped obstacle. Phys. Fluids 2020, 32, 093609. [Google Scholar] [CrossRef]
  37. Benzema, M.; Benkahla, Y.K.; Boudiaf, A.; Ouyahia, S.E.; El Ganaoui, M. Magnetic field impact on nanofluid convective flow in a vented trapezoidal cavity using Buongiorno’s mathematical model. Eur. Phys. J. Appl. Phys. 2019, 88, 11101. [Google Scholar] [CrossRef]
  38. Sheikholeslami, M.; Jafaryar, M.; Said, Z.; Alsabery, A.I.; Babazadeh, H.; Shafee, A. Modification for helical turbulator to augment heat transfer behavior of nanomaterial via numerical approach. Appl. Therm. Eng. 2020, 182, 115935. [Google Scholar] [CrossRef]
  39. Nallusamy, N.; Sampath, S.; Velraj, R. Experimental investigation on a combined sensible and latent heat storage system integrated with constant/varying (solar) heat sources. Renew. Energy 2007, 32, 1206–1227. [Google Scholar] [CrossRef]
  40. Versteeg, H.K.; Malalasekera, W. An Introduction to Computational Fluid Dynamics: The Finite Volume Method; Pearson Education: London, UK, 2007. [Google Scholar]
  41. Patankar, S.V. Numerical Heat Transfer and Fluid Flow; Mcgraw-Hill Book Company: New York, NY, USA, 1980. [Google Scholar]
  42. Mohammadnejad, F.; Hossainpour, S. A CFD modeling and investigation of a packed bed of high temperature phase change materials (PCMs) with different layer configurations. J. Energy Storage 2020, 28, 101209. [Google Scholar] [CrossRef]
  43. Cimpean, D.; Sheremet, M.; Pop, I. Mixed convection of hybrid nanofluid in a porous trapezoidal chamber. Int. Commun. Heat Mass Transf. 2020, 116, 104627. [Google Scholar] [CrossRef]
  44. Carman, P.C. Fluid flow through granular beds. Chem. Eng. Res. Des. 1997, 75, S32–S48. [Google Scholar] [CrossRef]
  45. Nooruddin, H.A.; Hossain, M.E. Modified Kozeny—Carmen correlation for enhanced hydraulic flow unit characterization. J. Pet. Sci. Eng. 2011, 80, 107–115. [Google Scholar] [CrossRef]
  46. Siavashi, M.; Bahrami, H.R.T.; Saffari, H. Numerical investigation of flow characteristics, heat transfer and entropy generation of nanofluid flow inside an annular pipe partially or completely filled with porous media using two-phase mixture model. Energy 2015, 93, 2451–2466. [Google Scholar] [CrossRef]
  47. Nield, D.; Bejan, A. Convection in Porous Media, in Convection Heat Transfer; John Wiley & Sons, Inc.: Hoboken, NJ, USA, 2013. [Google Scholar]
  48. Wakao, N.; Kaguei, S.; Funazkri, T. Effect of fluid dispersion coefficients on particle-to-fluid heat transfer coefficients in packed beds: Correlation of Nusselt numbers. Chem. Eng. Sci. 1979, 34, 325–336. [Google Scholar] [CrossRef]
  49. Ma, Y.; Mohebbi, R.; Rashidi, M.M.; Yang, Z. MHD convective heat transfer of Ag-MgO/water hybrid nanofluid in a channel with active heaters and coolers. Int. J. Heat Mass Transf. 2019, 137, 714–726. [Google Scholar] [CrossRef]
  50. Esfe, M.H.; Arani, A.A.A.; Rezaie, M.; Yan, W.M.; Karimipour, A. Experimental determination of thermal conductivity and dynamic viscosity of Ag-MgO/water hybrid nanofluid. Int. Commun. Heat Mass Transf. 2015, 66, 189–195. [Google Scholar] [CrossRef]
  51. Reddy, J.N. Introduction to the Finite Element Method; McGraw-Hill Education: New York, NY, USA, 2019. [Google Scholar]
  52. Lewis, R.W.; Nithiarasu, P.; Seetharamu, K.N. Fundamentals of the Finite Element Method for Heat and Fluid Flow; John Wiley & Sons: Hoboken, NJ, USA, 2004. [Google Scholar]
  53. Heinrich, J.C.; Pepper, D.W. Intermediate Finite Element Method: Fluid Flow and Heat Transfer Applications; Routledge: London, UK, 2017. [Google Scholar]
  54. Reddy, J.N.; Gartling, D.K. The Finite Element Method in Heat Transfer and Fluid Dynamics; CRC Press: Boca Raton, FL, USA, 2010. [Google Scholar]
  55. Reddy, J.N. An Introduction to Nonlinear Finite Element Analysis Second Edition: With Applications to Heat Transfer, Fluid Mechanics, and Solid Mechanics; OUP: Oxford, UK, 2014. [Google Scholar]
  56. Zienkiewicz, O.C.; Taylor, R.L.; Nithiarasu, P.; Zhu, J. The Finite Element Method; McGraw-hill: London, UK, 1977; Volume 3. [Google Scholar]
  57. Curtiss, C.F.; Hirschfelder, J.O. Integration of stiff equations. Proc. Natl. Acad. Sci. USA 1952, 38, 235. [Google Scholar] [CrossRef] [PubMed] [Green Version]
  58. Hindmarsh, A.C.; Brown, P.N.; Grant, K.E.; Lee, S.L.; Serban, R.; Shumaker, D.E.; Woodward, C.S. SUNDIALS: Suite of nonlinear and differential/algebraic equation solvers. ACM Trans. Math. Softw. (TOMS) 2005, 31, 363–396. [Google Scholar] [CrossRef]
  59. Ascher, U.M.; Petzold, L.R. Computer Methods for Ordinary Differential Equations and Differential-Algebraic Equations; SIAM: Philadelphia, PA, USA, 1998; Volume 61. [Google Scholar]
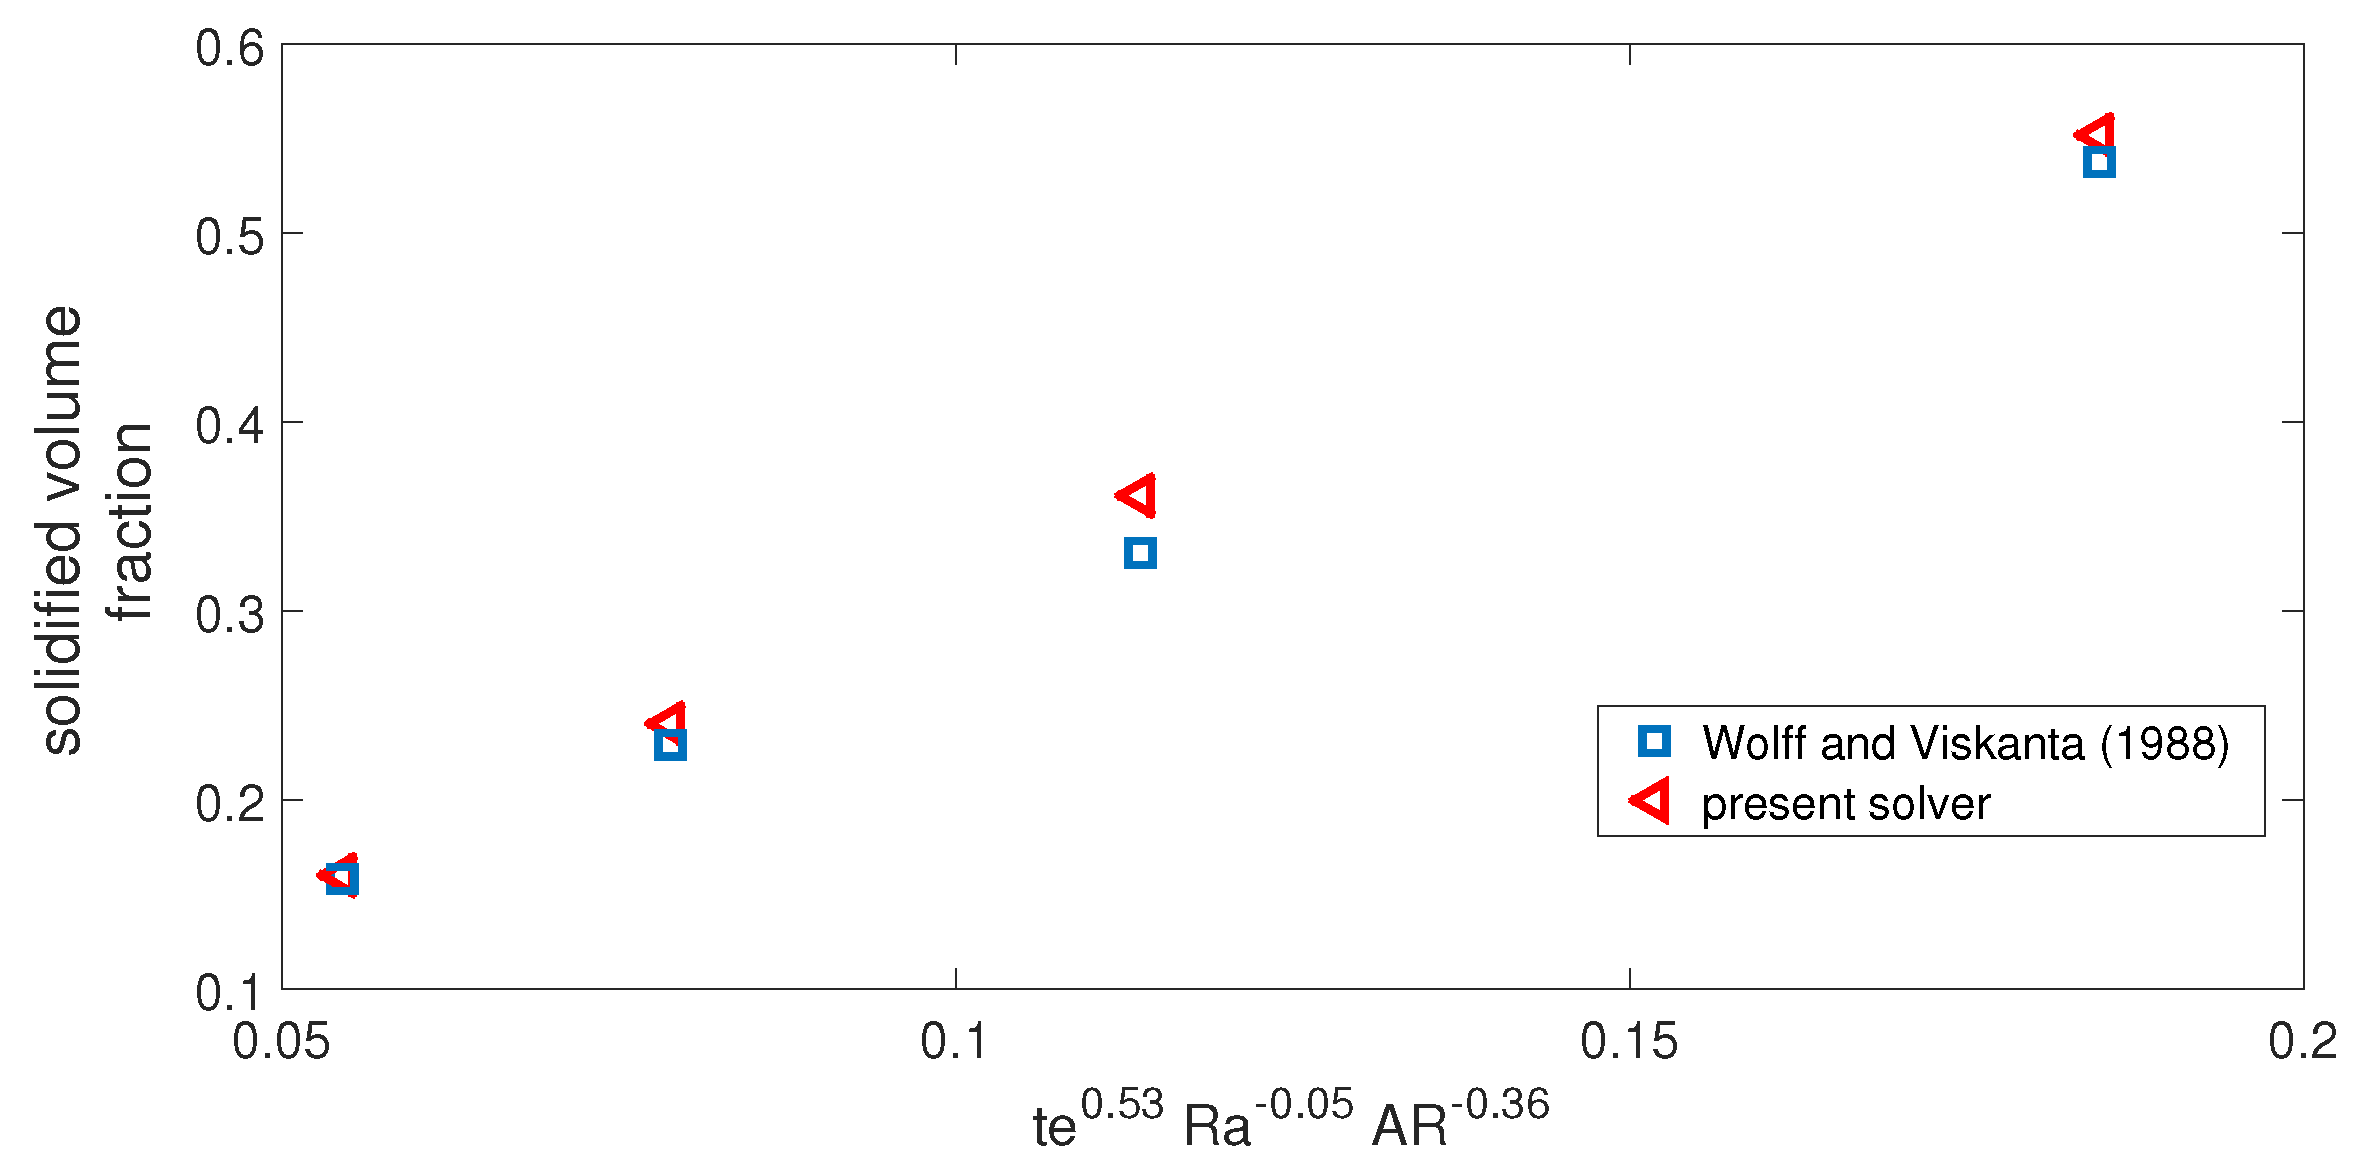
  60. Wolff, F.; Viskanta, R. Solidification of a pure metal at a vertical wall in the presence of liquid superheat. Int. J. Heat Mass Transf. 1988, 31, 1735–1744. [Google Scholar] [CrossRef]
Figure 1. 3D view of the complex geometry of the vented cavity with one inlet and outlet port, as well as the (a) boundary conditions and schematic view in 2D (b).
Mathematics 09 02566 g001
Figure 2. Numerical test results for grid independence at two rotational Re numbers (a) and grid distribution for one part of the computational domain (b).
Mathematics 09 02566 g002
Figure 3. Comparison results (with [60]) for fraction of the solidified volume at various times for Ph-C process in a differentially heated cavity.
Mathematics 09 02566 g003
Figure 4. Average Nu number comparisons (with results of [14]) for different Re numbers, when convective HT in a vented cavity was considered.
Mathematics 09 02566 g004
Figure 5. Impacts of fluid stream Re (Rew = 500, (a)–(c)) and rotational Re numbers (Re = 300, (d)–(f)) on the flow pattern distributions within the vented U-shaped cavity (di = 0.25 L1, L0 = 0.6 L1, yp = 0.1 H, and NC = 0.02).
Mathematics 09 02566 g005
Figure 6. Distribution of liquid fraction (Lq) with varying fluid stream Re number (Rew = 500, (a)–(h)) and rotational Re number (Re = 300, (i)–(p)) at various time instances (t in minutes) (di = 0.25 L1, L0 = 0.6 L1, yp = 0.1 H, NC = 0.02).
Mathematics 09 02566 g006
Figure 7. Time evolution of average Lq with varying Re ((a) Rew = 500) and varying Rew ((b,c) Re = 300) (di = 0.25 L1, L0 = 0.6 L1, yp = 0.1 H, and NC = 0.02).
Mathematics 09 02566 g007
Figure 8. Complete phase transition time (tp in minutes) with varying Re (a) and rotational Re (b). The amount of reduction in the tp is also presented in the figures (di = 0.25 L1, L0 = 0.6 L1, yp = 0.1 H, and NC = 0.02).
Mathematics 09 02566 g008
Figure 9. Complete phase transition time (tp in minutes) with varying Re at the lowest and highest Rew (a) and with varying Rew at the lowest and highest Re (b) (di = 0.25 L1, L0 = 0.6 L1, yp = 0.1 H, and NC = 0.02).
Mathematics 09 02566 g009
Figure 10. Effects of port size (L0 = 0.6 L1 (ac)) and PCM domain length (di = 0.25 L1 (df)) on the distribution of flow patterns within the U-shaped cavity (Re = 300, Rew = 500, yp = 0.1 H, and NC = 0.02).
Mathematics 09 02566 g010
Figure 11. Distribution of time dependent liquid fraction within the cavity with varying port sizes (Re = 300, Rew = 500, L0 = 0.6 L1, yp = 0.1 H, and NC = 0.02).
Mathematics 09 02566 g011
Figure 12. Impacts of port size on the time evolution of average Lq (a) and complete phase transition time (tp in minutes) (b) (Re = 300, Rew = 500, L0 = 0.6 L1, yp = 0.1 H, and NC = 0.02).
Mathematics 09 02566 g012
Figure 13. Effects of PCM-zone length on the time evolution of average Lq (a) and on the complete phase transition time (tp in minutes) (b) (Re = 300, Rew = 500, di = 0.25 L1, yp = 0.1 H, and NC = 0.02).
Mathematics 09 02566 g013
Figure 14. Impacts of PCM-zone location within the vented cavity ((a) NC = 0.02) and including nanoparticles in the base fluid ((b) yp = 0.1 H) on the complete phase transition time in minutes. Amount of reductions in the tp is also provided (Re = 300, Rew = 500, di = 0.25 L1, and L0 = 0.6 L1).
Mathematics 09 02566 g014
Publisher’s Note: MDPI stays neutral with regard to jurisdictional claims in published maps and institutional affiliations.

