Article

Association Rules Mining for Hospital Readmission: A Case Study

by
Nor Hamizah Miswan
1,2,*,
‘Ismat Mohd Sulaiman
3,
Chee Seng Chan
1,* and
Chong Guan Ng
4
1
Department of Artificial Intelligence, Faculty of Computer Science and Information Technology, University of Malaya, Kuala Lumpur 50603, Malaysia
2
Department of Mathematical Sciences, Faculty of Science and Technology, Universiti Kebangsaan Malaysia, Bangi 43600, Malaysia
3
Health Informatics Centre, Planning Division, Ministry of Health Malaysia, Putrajaya 62590, Malaysia
4
Department of Psychological Medicine, Faculty of Medicine, University of Malaya, Kuala Lumpur 50603, Malaysia
*
Authors to whom correspondence should be addressed.
Mathematics 2021, 9(21), 2706; https://doi.org/10.3390/math9212706
Submission received: 30 August 2021 / Revised: 22 September 2021 / Accepted: 28 September 2021 / Published: 25 October 2021
(This article belongs to the Special Issue Applied Data Analytics)

Abstract

:
As an indicator of healthcare quality and performance, hospital readmission incurs major costs for healthcare systems worldwide. Understanding the relationships between readmission factors, such as input features and readmission length, is challenging following intricate hospital readmission procedures. This study discovered the significant correlation between potential readmission factors (threshold of various settings for readmission length) and basic demographic variables. Association rule mining (ARM), particularly the Apriori algorithm, was utilised to extract the hidden input variable patterns and relationships among admitted patients by generating supervised learning rules. The mined rules were categorised into two outcomes to comprehend readmission data; (i) the rules associated with various readmission length and (ii) several expert-validated variables related to basic demographics (gender, race, and age group). The extracted rules proved useful to facilitate decision-making and resource preparation to minimise patient readmission.

1. Introduction

Hospital readmission is defined as the follow-up admission to a hospital, either to the same or a different hospital, within a certain period. Currently, most of the studies on readmission application use 30 days as the standard period for readmission. Hospital readmission has been found to increase unnecessary cost of hospital operations according to Golmohammadi and Radnia [1] due to two main reasons, namely; (1) to assist transitional care delivery for the right target patient, especially for higher-risk patients and (2) to ensure quality measures as publicly reported metrics for hospital comparisons and reimbursement [2]. In this vein, predicting readmission and understanding the influencing factors are extensively studied concerns [3] with hospital readmission becoming a global complexity in terms of healthcare quality, health outcomes, and financial implications.
Correspondingly, hospital readmission studies’ related factors were more challenging to define than mortality studies as death was a more predictable factor than readmission factors [4]. Besides that, it is also essential to discover every potential variable to provide an early justification towards the focus target. However, many applications in the biomedical informatics domain require a foundation of clinical knowledge. For example, disease diagnosis requires information on the disease’s signs and symptoms. Similarly, preventive care decision support requires screening tests and indications for illnesses to prescribe the medication. These knowledge foundations are often developed by a domain expert at significant costs [5]. Hence, it is essential to understand the overall readmission task based on the current datasets to support the decisions provided by the domain expert.
In recent years, many healthcare services have employed information systems to store and manage their patient data into different forms, such as numbers, text, images, and audio. The data information would enable healthcare practitioners to make important medical decisions; thus, data mining techniques are crucial for researchers to extract valuable information from healthcare databases. Other types of data mining methods include classification, generalisation, clustering, association, pattern matching, and data visualisation [6]. In the medical field, it is shown that data mining usage has improved decision-making in prognosis, diagnosis, and treatment planning [7].
Many studies on data mining, specifically rule mining, have been conducted over the years. For example, Tseng et al. [8] investigated health equity and healthcare needs among immigrant women. Meanwhile, Lee at al. [9] analysed lifestyle-oriented behavioural risk factors towards high-risk cardiovascular diseases. The recent studies utilised rule mining to analyse the independent variable patterns among specific risk groups. On another note, Altaf et al. [10] surveyed the application of ARM in health informatics and found out that ARM had considerably evolved over the years. The comprehensive studies differed in terms of variables, sampling, and focus on health issues, namely specific healthcare institutions, diseases, or group of patients, such as elderly patients. While a few studies from this survey utilised data from Asian countries [11,12,13], only a small number of researchers have addressed Malaysia’s phenomenon. For instance, Payus et al. [14] explored hospitalisation rules for respiratory illness patients due to air pollution. The study concluded that particulate matter 10, carbon monoxide, and temperature are strong influences for respiratory illness. For readmission application, the healthcare systems in Malaysia have different regulations in using readmission rates; thus, the predictive variables and model parameters might differ to other countries. This gap presented a need for developing an ARM based on local settings, especially in addressing the gap in the existing literature. The study of identifying relations of every variable in readmission using data mining techniques was minimal compared to other medical applications. Therefore, this study investigated the following contributions:
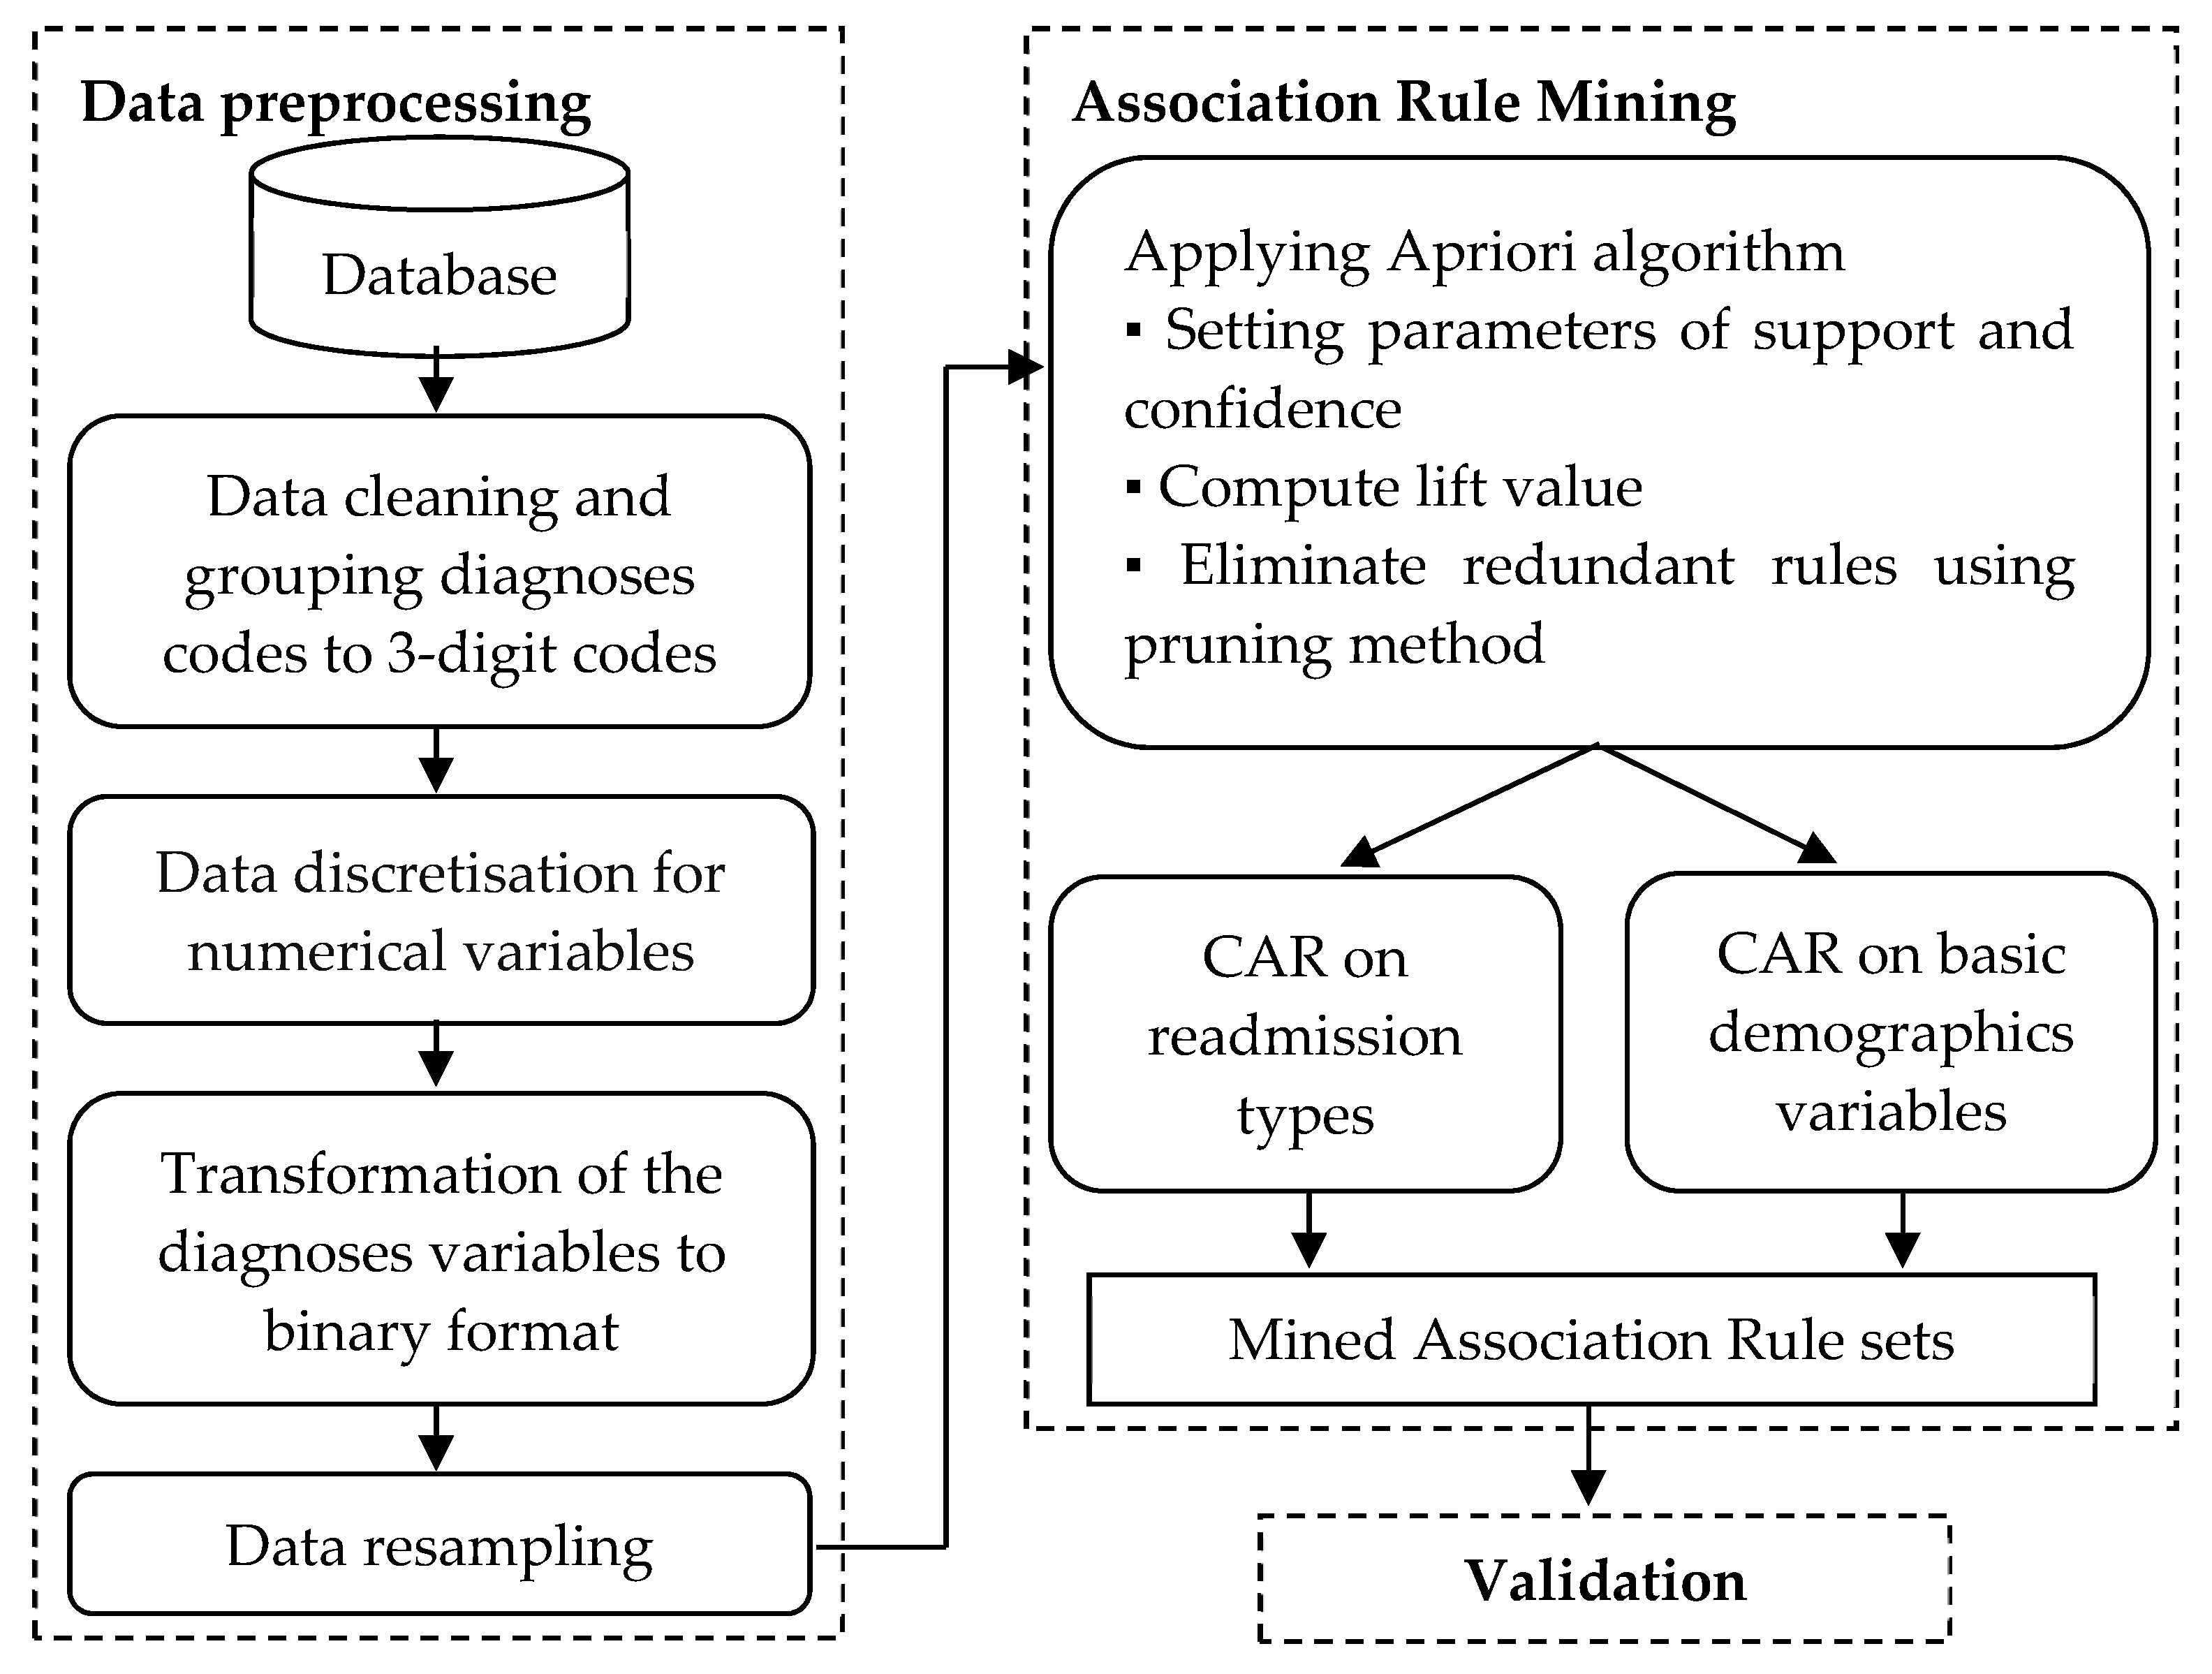
  • We propose the overall framework of ARM in readmission task, which consisted of two processes; data preprocessing and rule mining extraction. The preprocessing stage involved data discretisation, transformation to a binary setting, and handling imbalance data;
  • We present the significant rules between input variables on a different setting of readmission durations and basic demographics variables.
As for novelty of the present research, to the best of the author’s knowledge, this is the first study to use ARM for hospital readmission that utilised the relation of input variables concerning various supervised rule learning, which are useful to identify patients who are at risk of readmission based on the patient’s historical data. This paper added to the existing data mining study, particularly on different ways to set the rules, and added new insights on readmission application, especially for Malaysia’s health data. The mined rules are discussed and validated by the domain expert, which is a valuable guide in making decisions on targeted patients’ clinical resources based on various readmission durations.
As hospital readmission research methodologies solely emphasised early readmission prediction (a significant drawback), one of the potential intricacies involves the development of a robust and comprehensive early warning system to successfully predict and identify the high risk of readmitted patients, particularly in different readmission periods. As such, this study aimed to identify the underlying factors of patients’ historical variables following the different readmission threshold length. We hypothesise that ARM would be a feasible technique to analyse clinical datasets and effectively identify clinically accurate and meaningful associations between heart failure patients’ data elements, particularly in Malaysian public hospitals. Additionally, the empirical foundation and inherent rule measurability in this study would distinguish different outcome settings: various hospital readmission durations and basic demographics variables.
This paper’s remainder is organised as follows: Section 2 summarises the related studies regarding data mining for hospital readmission, the ARM and its importance, the ARM in medical application, and comparison between ARM and other methods. In Section 3, the methodology of ARM is introduced, specifically for the Apriori algorithm and described datasets used in this study. Section 4 presents the results of the mined rules and the association with different length of readmissions and Section 5 presents the discussion. Section 6 outlines the practical and managerial implications. Finally, Section 7 concludes the paper and discusses the future direction of research.

2. Related Works

2.1. Data Mining for Hospital Readmission

Data mining has formed a branch of applied artificial intelligence which allows a search of valuable information, especially in large volumes of data. The growing number of databases have created the need to have technologies that intelligently utilise the information and knowledge, thus making data mining an increasingly important research area [6]. Likewise, data mining has been extensively used in healthcare problems due to the increasing amount of data in healthcare systems, especially in this digital era.
The interest in hospital readmission rates is growing worldwide, contributing to the growing research in hospital readmissions, such as identifying the risk factors or predictors which led to readmission and predicting the readmission risks based on various related areas through statistics, machine learning, and data mining [3]. Thus, understanding the key factors and prediction on possible hospital readmission are being widely researched. However, existing studies have not examined how to identify the patient’s future readmissions based on various lengths of readmission, such as 30 days or one year. Hospital readmission within 30 days has been widely used as an indicator for the quality of care in the index hospitalisation in most readmission studies [15]. Further understanding of hospital readmission based on various readmission durations could also provide an overview of the patient’s future, including readmission risks, to help the physician develop early intervention and enhance both financial and quality output.
Studies have utilised data mining techniques for complex problems in healthcare applications, with a limited number exploring data mining approaches in a readmission risk task [15]. For instance, Ben-assuli and Padman [3] used data mining to analyse repeated hospital readmission, while Braga et al. [16] predicted readmission for intensive care unit (ICU) readmissions. Correspondingly, Shameer et al. [13] investigated the risk factors associated with psychiatric readmission and Zheng et al. [17] predicted readmission using metaheuristics and data mining. Data mining in these hospital readmissions mentioned helped predict future readmission by employing prediction models, such as Support Vector Machine, Naïve Bayes, and Logistic Regression. Therefore, further study is required to understand how these factors are associated or the relationship among the factors, especially in mining important hidden patterns, specifically on rule mining techniques.

2.2. The ARM and Its Importance

As a well-established data mining process, ARM is one of the techniques involved in data mining to discover interesting knowledge, such as patterns, changes, associations, and significant structures from many databases [18]. The ARM techniques are employed to model dependencies between dataset items. In the past decade, ARM methods and other data mining types (classification and clustering) have been extensively studied and successfully applied in practical systems associated with multiple domains [10]. As such, ARM denotes vital research values as the association rule identifies item correlations that are undetected by conventional artificial intelligence and statistical methods. This technique was motivated by the widespread application of ARM found in the market basket analysis [19], which determined the co-occurring factors on how customers purchased an item in a supermarket. The technique also offers information on customers’ purchase behaviours towards retailers for appropriate decision-making. For example, the {bread, jam} → {cheese} rule indicates that customers who purchase bread and jam together might also buy cheese. In this regard, many businesses support ARM-based applications.
One of the recent ARM applications in business involves analysing fraudulent financial statement patterns for open innovation. For example, Sawangarreerak and Thanathamathee [18] investigated the fraud pattern associations with financial ratios based on the Stock Exchange of Thailand financial statements with frequent pattern growth (FP-Growth) ARM. Resultantly, nine significant fraudulent financial statement patterns proved useful for investors and users in decision-making. Another notable study by Apiletti and Pastor [20] examined the quality of expresso, a popular coffee variant. Specifically, ARM was manipulated to extract the rules of the study variables: setting of grinders, extraction time, and of expresso-brewing flow rate with professional coffee-making machines. The extracted rules offered a competitive advantage and data-driven analysis of the anticipated pattern in high-quality expresso brewing.
Incorporating ARM into recommender systems could facilitate user preferences in business marketing and recommendations in other fields. The recommender system provides recommendation services to the aforementioned users based on personalised preferences to alleviate online information traffic [21]. Thus, Orama et al. [22] presented potential ARM benefits in tourism recommenders following social media-based clustering for user profiles. In Chen and Deng [23], ARM in video-learning recommendations were utilised to observe students’ interest following the individuals’ learning behaviours in the network, while Hang et al. [21] implemented the optimal travel route recommender system. Based on the study similarities, the rules extracted for the recommender systems enabled users to make personalised decisions based on past users’ data history.
The ARM is also employed in operation-based systems. A review Zhao et al. [24] identified data mining application in the energy system building domain. Regarding ARM methods, the extracted rules proved useful in discovering valuable building operation patterns to facilitate building managers’ understanding of operational performance, control strategies, and energy consumption profiles. The Apriori was one of the most common algorithms to determine typical building operation systems. Meanwhile, Shi et al. [25] determined effective management strategies for scenic area emergencies. The ARM was employed to explore the emergency mechanism–coping strategy association to mitigate unexpected events during the developmental and operational activities of scenic areas. The study finding provided a list of strategies to manage scenic area emergencies.
The aforementioned studies justified the essentiality of ARM in various domains, particularly in renowned applications. Essentially, ARM is a rule-based method to determine intriguing variable connections in large databases and the relationship between frequently utilised objects. For example, if/then statements highlight relationships between unrelated data in databases or other information repositories. Association rules are also currently employed in other application areas, including web usage mining, intrusion detection, continuous production, and bioinformatics. Motivated by the significance of ARM mentioned above, the current study investigated further within the setting of hospital readmission application. ARM is a well-established technique that highlights hidden patterns and correlations [26]. The feature is particularly advantageous in hospital readmission research to identify the associations that ultimately lead to patient readmission or otherwise).

2.3. The ARM in Medical Application

Following the essentiality of understanding input variable associations to identify frequent diseases and the correlation between different types of diseases and diagnostic tests, ARM in healthcare application is equally useful for medical knowledge discovery. In healthcare, the Apriori algorithm and FP-growth of ARM were frequently utilised [27] to extract valuable information and assisted physicians in curing patients [28]. By comparing the retrieved systematic reviews on this task, the study identified an increasing number of studies devoted to utilising ARM for understanding medical applications [29,30].
In recent years, the Apriori algorithm in ARM was frequently used in healthcare services to generate association rules between clinical events and various medications, tests, and other relations [7,31]. Among the tasks of interest of ARM in medical applications were identifying risks [27,32], understanding factors [33,34], discovering patterns [7,12], clinical decision support systems [35,36], feature selection [37], and prediction/classification [38].
In investigating the risks, Li et al. [39] defined the risk by statistical metrics (relative risk), and Li et al. [27] then proposed an algorithm based on the antimonotone property for mining optimal risk pattern sets, while Ramezankhani et al. [32] applied ARM to identify risk patterns for type 2 diabetes incidence. All of these studies concluded that the proposed algorithm of ARM was efficient in exploring the risk patterns. While most studies applied ARM to understand the factors of any given problem, ARM usage in healthcare application was used to investigate the factors or relations associated with clinical events. For example, Nahar et al. [33] applied ARM to investigate the contributing factors on heart disease and analysed the information available based on gender. The study found that females had a lower risk of heart disease, and the detail rules were extracted in terms of clinical measurement. Similarly, Sariyer [7] highlighted the relations between the type of diagnosis and laboratory tests conducted in emergency departments, known as the main units in hospitals, which were often overcrowded with patients. Due to the time consumption and high costs for conducting the laboratory tests, the understanding of this relation improved decision-making and efficiently utilised available resources.
For pattern discovery in medical data, Lee et al. [12] proposed the ARM approach to investigate the pattern for acute myocardial infarction patients, focusing on the young adult population. The study found several (four) variables associated with diabetes and hypertension for the target group, namely glucose, smoking, triglyceride total cholesterol, and creatinine. Additionally, the frequent usage of ARM has supported decision-making as Cheng et al. [35] designed icuARM to support the clinical decision of ICU in the clinical system. icuARM was implemented with multiple association rules and a graphical user interface to perform real-time analysis and information mining in the ICU setting. The authors of Harahap et al. [36] decided on the medicine required based on the top disease population, which utilised the Apriori algorithm to accurately classify ten dominant diseases in patient prescription datasets. ARM can also be used as feature selection and classification, as seen in [37], which presents a proposed novel feature in selection method based on ARM for early diagnosis of Alzheimer’s and performed classification using Support Vector Machine (SVM). Similarly, Said et al. [38] applied the Apriori algorithm to extract heart disease prediction rules.
These studies show that ARM, particularly the Apriori algorithm, has helped health practitioners with clinical interpretations based on a patient’s data. This approach has also reduced time and cost, thus indicating that using ARM techniques is pertinent in hospital readmission scenarios. The readmission aspect might help with unnecessary cost reduction, given less attention than other medical applications.

2.4. Comparison between ARM and Other Methods

The ARM is a more suitable method compared to regression modelling in assessing the co-occurrence of behavioural variables in datasets where variables are treated equally [40]. In this vein, regression modelling has gained popularity in hospital readmission [4] to assess the statistical interactions among independent variables and investigate the differences in the effects of one or more independent variables (particularly for feature selection processes). Nevertheless, it is deemed difficult to interpret the variable combination meaning [41] and analyse correlations based on the study variable. Other feature selection types strive to determine the key variables associated with diseases and specific risk conditions. For example, the wrapper-based method employs a specific classifier to evaluate selected attribute performance. Although past readmission studies [42,43,44] applied the wrapper technique, such as forward, backward, or stepwise selection, the approach was computationally expensive.
The univariate approach is frequently employed following elements of simplicity and practical effectiveness [4]. Notwithstanding, redundancy is not omitted unless the univariate feature selection examines the relationship strength between each feature and response variable. Meanwhile, a tree-based method is recommended when the order of manifesting variables is crucial albeit inadequate to evaluate simple combinations [45]. As healthcare systems generate large data containing hidden knowledge, information discovery is deemed impossible with conventional methods. Thus, data mining is more suitable for medical research [32]. In this vein, ARM was selected as the primary method in this study.

3. Materials and Methods

3.1. Datasets

The dataset was extracted from the Customer Healthcare Information System (Sistem Maklumat Rawatan Pelanggan—SMRP), developed and maintained by the Health Informatics Centre, Ministry of Health Malaysia. Malaysia is situated in Southeast Asia, consisting of two regions separated by the South China Sea, namely Peninsular Malaysia and Malaysian Borneo. This country has a population of over 30 million, with 70% living in the urban areas in a multicultural society. The expectancy of life at birth is 75 years, and the annual population growth rate is about 1.13% [46].
Firstly, the datasets on all inpatients with the discharged diagnosis of heart failure coded as I50 based on the “International Statistical Classification of Diseases and related health problems 10th revision”, which is denoted as ICD-10 from 2007 to 2011, were extracted. Data cleaning was followed by removing redundant and unrelated information and patients that ended with death. The remaining dataset consisted of discharge records of 48,593 patients from all Malaysian public hospitals. To understand each length of the threshold’s characteristics, this study considered several mutually exclusive readmission types based on the readmission length, as shown in Table 1. This study used a multi-class association rule to discover the relations of variables shown in Table 2.
From the information of variables in Table 2, the input features covered the relevant factors that either directly or indirectly influence the readmission risk. There are three main categories of variables involved: demographic, admission, discharge information, and prior hospitalisation. The demographic variables of gender, age, and race are the common input factors considered by many similar studies. Accounting for Malaysia’s multi-ethnicity, three major race groups are considered, which are Malays that make up the majority, followed by Chinese and Indian [47].
Additionally, the age group was divided into seven categories based on the World Health Organisation (WHO) guidelines and Malaysian age classification [48]. The identified age groups were further refined based on the extracted datasets and several other studies [49,50,51]. A smaller range for each group was preferable to detect specific patients to target. The range for adult aged 19 to 64 years old was further divided into three adult categories.
Regarding admission and discharge information variables, the discipline of care indicated which department the patients came from, or the discharged discipline. Other related diagnoses and length of stay also fall under this category. The prior hospitalisation variables were related to previous hospitalisation information, including the total number of past admissions, visit for the past 360 days, other diagnoses, underlying cause, external cause, and surgery experience. Notations in Table 2 were used to represent each input when extracting the rules mined in this study.

3.2. Research Framework

The overall framework for ARM study of hospital readmission is illustrated in Figure 1. There are two processes were involved, that are started with data preprocessing followed by rule mining extraction. Data preprocessing include how the raw data were managed to produce a structured dataset suitable for ARM input. The outcomes of the rules extraction are supervised rule learning, also known as class association rules (CAR) which were divided into two respects. The first respect was that the frequent pattern among input features on the readmission type shown in Table 1 was extracted. Secondly, the rules for the relation of input variables towards basic demographic predictors (i.e., gender, race and age group) were discovered. Subsequently, the mined rules were validated by the domain expert.

3.3. Data Preprocessing

Data cleaning was conducted prior to data analysis and modelling. Firstly, (i) data before the year 2007, (ii) records that ended with death, and (iii) duplicated data were removed, thus only records of inpatient data of those discharged alive between 2007 to 2011 were included. In regards to the content, data with very few information, particularly on missing input variables, were also removed. Correspondingly, irrelevant records, such as having a negative duration of admission stay, and data that were not related to this study, such as admission and discharge ward, date of birth, country of birth, and citizenship were excluded. Lastly, the datasets were grouped into 3-digit codes. The ICD-10 codes were represented from 2-digit to 5-digit codes, where the longer codes indicated a more specific diagnosis. A 3-digit code represented sufficient information on the disease without the need for further specificity.
Association rule learning typically works for categorical data; thus, data discretisation for numerical variables were performed. For prior hospitalisation, each number was divided into one category and a separate category was included for values greater than four. For categorical variables that contained a large number of inputs, such as admitting and discharge discipline of care and other related diagnoses, the most frequent categories were considered to be the input, and the least frequent categories were labelled as “others” to reduce the model complexity and dimension of the sparse data structure. For other related diagnoses, including external cause, the ICD-10 inputs were represented in binary format for rule mining model. For instance, the existence of the codes for each patient was defined as “yes”, and the other attributes were represented as “no” using binary values: true and false. The structured dataset mentioned from the discretisation and binary format were combined and ready for the ARM task.
The next step in the preprocessing was to build the ARM using Apriori algorithm on supervised rule learnings, based on various durations of readmission and basic demographics predictors. “arules” package of R software was used to extract the rule mining. For rule learning based on various readmission duration, the data were balanced based on the readmission categories using a resampling approach. The class that had the last sample was considered the reference of ratio. This was due to the imbalance in the distribution of categories (Table 1) that are commonly found in many readmission studies [4]. However, this study involved multi-class learning, while other studies were binary data of 30-day readmission.
The under-sampling technique was chosen from several data sampling approaches because this method does not affect the minority class. For instance, the random under-sampling method removes some portions of the majority class to ensure a good balance with the minority class; thus, they carry risks of removing those samples that contain essential information, which in turn will poorly represent the majority class’s characteristics. Hence, this study utilised under-sampling with the use of near-miss technique. Unlike the standard under-sampling approach that randomly eliminates the sample, the near-miss technique has been recognised as the latest benchmark for heuristic under-sampling technique. This technique identifies and removes less important instances for learning, such as samples that fall far away from the decision border. The near-miss idea is to select a sample from majority class close to the samples from minority class by calculating the average distance and eliminating the samples from majority class with a relatively small average distance [52]. Near-miss technique under-samples all the class in this study, excludes the minority class, and combines them with the minority class to build a balanced dataset. For most cases, under-sampling is superior in computation time [53].

3.4. Association Rule Mining

For the notation of ARM, I = {i1, i2, …, id} represented the set of items, similar to market basket analysis for all the items sold in the market and T = (t1, t2, …, tn) represented a set of transactions or database in which each transaction ti consisted of a set of items, such that tiI. The total number of transactions was represented by n. In the readmission study, the notation I held a similar role to X, representing the features or predictors involved. T described the overall dataset of every instance up to n, which denoted the hospital’s patients. The admitted patients in a dataset contained its input data, a subset of the predicted variables, such as demographics and clinical history.
In ARM, the rules are usually represented in implication rules, such as xixj where both xi, xjI and xi∩xj = ∅. The left-hand side (LHS) is the antecedent, and the right-hand side (RHS) is the consequent. The strength of association rules is calculated based on two important measures: support and confidence computed as Equations (1) and (2). Support determines the percentage of transactions in T that contain xixj. Hence, it measures how often the rule applies to the whole dataset. The support is a significant measure as a first step for filtering out the less frequent rules that comprise very low support. Confidence determines the percentage of transactions in T that contain xi also contain xj. Therefore, it measures how much confidence that the rule holds.
s(xixj) = freq(xixj)/n
c(xixj) = freq(xixj)/freq(xi)
where freq(xi ∪ xj) is the count or frequency of the combination xi and xj while freq(xi) is the count or frequency of xi. The rules are accepted, provided that the constraints of both of these measures are satisfied, which are larger than the minimum support and confidence threshold [26].
The ARM context included in this study was multi-class association rule learning, wherein the rules were investigated with certain fixed target class labels on the right-hand side. This case is known as supervised rule learning or CAR. Hence, for each transaction T had the label class y, where yY was the set of all target class labels and IY = ∅. The CAR had the implications of Xy, where XI, and the strength of CAR had the same definition of support and confidence in Equations (1) and (2) above. However, CAR has several differences from the standard association rule, namely the consequent has only a single item and must only form the class labels set Y.
This study implemented the Apriori algorithm, known as the most commonly used algorithm for ARM. Apriori algorithm uses frequent sets of predictors (itemsets) to generate association rules. The rule is based on the concept that a subset of frequent predictors must also be a frequent predictor. The implementation of the Apriori algorithm consists of two main steps. Firstly, all the frequent set of predictors generated a support value greater than the minimum support. The pseudo-code to implement Apriori algorithm for generating frequent itemsets is presented in Algorithm 1, where F represented the frequent itemsets, and k represented the highest order of frequent itemsets. Ck denoted the candidate of k-itemsets, while sup showed as the support, and minsup was the minimum support. The output of Algorithm 1 produced all frequent itemsets that had support above minimum support. To generate the candidate’s set Ck in Algorithm 1, two steps, namely the join step and the pruning step, were conducted [26].
Algorithm 1. Apriori algorithm for generating frequent itemsets
Require: T, I, minsup
Output: F
F1 = {f|f ∈ I, F.sup ≥ min sup}
for (k = 2; Fk−1 = , k + +) do
Ck = generate candidate (Fk−1);
for each transaction in the database, t ∈ T do
for each candidate, C ∈ Ck, do
Increment the count of all candidate those are contained in t
end for
end for
Fk = {c ∈ Ck|c.sup ≥ min sup}
end for
return F = ⋂k Fk
For the second step, all the confidence values were generated with a value greater than the minimum confidence from the chosen frequent set of predictors from the previous step. The second step was straightforward as it evaluated the frequent itemsets generated in Algorithm 1 and generated the confidence rules. Due to this, most of the research focused more on the first step [35]. The researchers set the minimum support and minimum confidence values, and different combinations of these values created different sets of rules. The final output of Apriori algorithm was to set all frequent itemsets with varying sizes up to k.
The evaluation of rules mining using the support and confidence was sufficient for rules extraction in a dataset. However, detecting essential rules was challenging as there were many rules created. High confidence tends to rate rules highly, where the consequent was frequent [5]. Therefore, it was crucial to consider the rules based on the importance and among the commonly used measures was using lift value. The lift, which also refers to the interestingness measure, could be defined as the confidence of xixj over the proportion of all transactions that contained xj, represented by Equation (3).
l(xixj) = c(xixj)/s(xi)
A rule with its importance greater than one indicated the antecedent and the consequent appeared more often together than expected. The antecedent occurrence had a positive relationship to the consequent occurrence, while a value smaller than one indicated that both sides of the itemsets appeared less often together than expected [35,54]. Thus, the study only considered the rules with a lift value greater than one.
These three measures were essential in selecting and evaluating the association rules. To further improve the selection of rules, highly potential rules available were considered, especially for datasets that contained a tremendous amount of input variables and the number of instances; this caused many rules to be redundant. Rule A is called redundant if there is another rule B, such that B is a subset of A, and B is proportional to A [55]. B might always occur wherever A occurs due to the underlying relationship. Such rules do not provide any new knowledge about the data as the redundant rules could share the same support, confidence, and lift values. Correspondingly, these rules are more extended; thus, they are harder to interpret [56]. Pruning some rules could provide more concise and accurate rules while maintaining high confidence in the mined rules [26].

4. Experimental Results

The outcomes of the rule mining for supervised learning are explained in two parts. First, the different readmission length rules to discover the relationship between each readmission group are explained. Next, the rules based on the demographic predictors namely gender, race, and age group are identified.

4.1. ARM on Different Readmission Lengths

Based on the six classes of readmission lengths in this study, only one-sixth of the observations were for each readmission length. Therefore, the study started with a relatively small support value and searched for the highest confidence value to achieve reliable and accurate rules. Table 3 reports the top rules for all readmission durations.
The rules presented had a moderate confidence value that ranged from 0.2 to 0.6 with different settings of support values. The not readmitted category had the highest confidence values (0.659) due to its high frequency compared to the readmitted patients described in Table 1. Additionally, the not readmitted category had the highest importance rules (with a lift above three) discovered with Malay’s race, neither having past admission, nor involved in other diagnoses, as well as not having external cause, and admission and discharge discipline general medicine. Overall, it could be observed that none of the readmission categories shared highly similar rules, which differentiated all the categories. However, the rule related to admission discipline of general medicine and rule related to the Malay race was present in almost all categories.
When the rules of readmitted categories were comparatively analysed, it was observed that the short readmission duration (0–30 days) had the highest confidence with a value of 0.3661 and lift value of 2.1966, while the longer readmission in category D and E (more than 180 days) had lower confidence (0.2653 and 0.2924) and lift (1.5915 and 1.7544) values, respectively. It was worth noting that readmission categories A and B shared partially similar past admissions variables more than four times, were predominantly male from the old adult aged group, had no surgery experience, and no external cause. Conversely, readmission categories D and E were similar in terms of index admission length of a stay of one to five days, had two other diagnoses, and had no surgery experience.

4.2. ARM on Basic Demographics Predictors

To further discover the data’s significant rules, demographic predictors were selected to be the rules’ RHS. The selected demographic predictors for the association rules were gender (Section 4.2.1), race (Section 4.2.2), and age group (Section 4.2.3). To extract the rules, two datasets were populated; all patient data and a readmitted patient dataset.

4.2.1. ARM on Gender Predictor

Table 4 illustrates the four top rules associated with the gender male and female for both datasets.
Length of stay, age group, and race were the significant variables that differentiated the rule of both genders in all patient datasets. Males with higher confidence dominated a length of stay between one and five days; while females dominated a length of stay between six and ten days. It was found that males had a higher readmission possibility due to heart failure under the old adult category and were predominantly Chinese. Conversely, females had a higher readmission possibility due to heart failure under the elderly category and Indian race.
On the other hand, the readmitted patient dataset did not differentiate the genders based on length of stay, age group, or race. Both genders shared a similar length of stay of one to five days and were under the old adult age group. Additionally, a high confidence value was shown for readmitted males with J44 (chronic obstructive pulmonary disease) and had no underlying cause. The readmitted males also did not have diagnoses, such as E14 (diabetes mellitus), E87 (disorders of fluid, electrolyte and acid-base balance), I20 (angina pectoris), and N18 (chronic kidney disease). Contrastingly, readmitted females were associated with no past admission and were predominantly Indian. The readmitted females also did not have J44 (chronic obstructive pulmonary disease), decompensated heart failure, and other diagnoses.

4.2.2. ARM on Race Predictor

The rules associated with the three main patient races (i.e., Malay, Chinese, and Indian) are summarised in Table 5. Based on this, Malays had a higher confidence value, while the Indians had the lowest confidence in their association rules. For most of the rules, all three main races had a length of stay from one to five days. Age group was the most common variable that differentiated the three races mentioned for both data populations. The Malays and Indians were generally associated with the old adult age group, while the Chinese were associated with the elderly. Additionally, admission and discharge discipline was also a differentiating factor based on race, where the Chinese were associated with cardiology discipline and Indians were associated with general medicine.
Conversely, Malays were associated with the ICD code “not otherwise classified” (NOC), which were diagnoses made by the doctors that did not have a specific classification code in ICD. Besides these rules, the rules for readmitted patient data were similar to all patient data, especially for Chinese. Interestingly, the data found that the main rule for readmitted Malay patients had a diagnosis of I25 (chronic ischemic heart disease), while the readmitted Indian patients had one total visit for the past 360 days.

4.2.3. ARM on Age Group Predictor

The rules on all patients according to age group are summarised in Table 6. There were seven age groups classified in this study. The rules for infants, children, and teenagers cannot be produced due to having the least sample. The rules fell into these two age groups: the elderly age group with the highest confidence value, followed by the old adult age group. The variables that differentiated between the elderly and old adult age groups for both data populations were race, gender, and length of stay.
The elderly age group was associated with the Chinese race, while the old adult age group was associated with the Indian race and followed by the Malay race. In terms of gender, the old adult age group was associated with males, while the elderly were associated with females. The findings also showed that males were exposed to heart failure earlier in age than females, as described in Table 4. Furthermore, the elderly patients tended to admit from six to ten days, while the old adult patients had a stay from one to five days for length of stay.
To conclude the rules from the two age groups mentioned for both data classifications, the elderly age group had rules associated with the Chinese race, were predominantly female, and had an admission length from one to five days. Conversely, for both, data classification from the old adult age group had rules associated with the Indian and Malay race, were predominantly male, and an admission length from one to five days. Other rules for the middle adult and young adult age groups had low confidence values of less than 0.1 in both data populations.

4.3. Summary on the Overall ARM

This study introduced six groups of readmission length to investigate the existence of any unique characteristics of readmitted cases, to pre-emptively manage certain groups of cases, and prevent readmissions. The overall findings suggested a tendency for readmission within readmission categories A (0–30 days) and B (31–90 days) compared to a longer duration. This short duration could potentially increase the operation cost, especially for unnecessary readmission. For categories A and B of readmitted cases, these groups shared similar input in several aspects, had a past admission of more than four times, no surgery, no external cause, and were male. In addition to category A of the readmitted patient, this group also had two visits in the past 360 days. This finding showed that multiple admissions history had a higher chance of being readmitted in a shorter duration.
Contrastingly, the readmitted cases from categories C (91–180 days) and D (181–360 days) shared the common rules of being admitted within one to five days and were predominantly Malays. The total visit for the past 360 days for readmission category C was one, while readmission category D was not related to this past total visit to differentiate these two groups. The latter also found that it consisted of females and had two other diagnoses. In terms of age group, the old adult age group dominated readmission category D, while the elderly age group had readmission category C.
The supervised rule learning in this study was also extended to demographic variables. The association among these variables based on the part of the rules mined in Table 4, Table 5 and Table 6 is shown in Figure 2 with its respective confidence value. It was demonstrated that age group variables were connected to gender and race variables; the elderly age group was generally associated with females, predominantly from the Chinese race, and admitted within six to ten days with a confidence value of 0.57. Conversely, the old adult aged group consisted of two different associations; namely Indian males and were admitted within one to five days with a confidence value of 0.57 and Malay males with a confidence value of 0.47.
In terms of gender, the variables that discriminated between both genders were age groups and length of admission stay. Males were associated with old adult patients, predominantly Chinese, and had hospital admission within five days with a confidence value of 0.72. Meanwhile, the female gender was associated with the elderly age group, had hospital admission within six to ten days, and a confidence value of 0.6. Concerning the race variable, the Malay race possessed the main significant rule with the female gender, the old adult aged group, and a high confidence value of 0.94. Additionally, the Chinese race was associated with the elderly age group, while the Indian race was associated with an old adult age group with confidence values of 0.49 and 0.2, respectively. All the rules associated with hospital readmission were necessary for any clinical decision support system and added to medical applications’ knowledge discovery.

5. Discussion

In this study, ARM was used to extract hidden patterns and relations among input features and the variety of readmission lengths in this study. Hospital readmission study has been an important application in the medical field due to the cost burden and challenges to understand the impact factors for hospital readmission. This study proposed the overall framework of ARM in hospital readmission tasks. The framework included data handling, such as data discretisation, transformation to a binary setting, and data balancing before proceeding to rule mining using ARM. The current study then extended ARM application for the medical field in hospital readmission of heart failure disorder based on supervised rule learning settings, namely, readmission types and basic demographic predictors. For the theoretical time complexity of the entire processing framework, the processing stage consumes the most time, in line with the volume of a dataset. However, the proposed framework reduces the time complexity via one-hot encoding for transformation and near-miss under-sampling for data balancing. The rule mining extraction stage is more straightforward, using the Apriori algorithm of the ‘arules’ package, and the complexity depends on how large the input variables are in the dataset.
The study found that the percentage of overall readmitted patients (for all readmitted durations up to more than 360 days) was only about 23% compared to non-readmitted patients. From a clinician’s perspective, this was a positive finding as it reduced high readmission rates, but the imbalanced distributions impacted the support and confidence values of every group of readmission length. The highest confidence level for each readmission length was only about 0.3. However, the confidence levels were considered sufficient to represent the characteristics of the readmitted groups because the findings were similar to other studies in medical application [5,19,35,36,57]. As such, the aforementioned studies represented some of the rules with a confidence value of approximately 0.3.
Additionally, some co-occurrence relations were found in the overall rules. Rules of having no past admission were seen together with having no other diagnosis, which might be due to less illness severity. Rules of having past admission more than four times or having two past visits within 360 days were seen together with having no external causes. These multiple admissions might represent high-risk heart failure patients due to end-stage heart failure [58], and thus had no relation with external causes mainly related to injuries, such as accidents, fractures, and wounds. Co-occurrence relations were also found in the rules in basic demographics predictors. The female gender from the elderly age group and length’s stay of six to ten days were seen together, whereas for males, rules of the old adult age group with length’s stay of one to five days were concurrent. This finding showed that males were exposed to heart failure at an earlier age as compared to females. Previous studies showed that women were protected with endogenous oestrogens during their fertile period, and thus, delayed the manifestation of atherosclerotic disease [59], which often led to heart problems. However, with the increase in age, the risk of heart failure in women was almost similar to men, especially for menopausal women. Consequently, heart failure concerns older women compared to men, potentially carrying higher disease severity risks and a much longer length of stay than men. This finding is aligned with previous epidemiological research, which stated that heart failure’s occurrence increased with advancing age and affected older women greater than men [60].
From the overall rules listed above, some noteworthy findings could be highlighted. Firstly, the patients with multiple past admissions and past visits within 360 days were possibly associated with early readmission (readmission categories A and B). This scenario might describe patients with high disease severity, such as end-stage heart failure with a high possibility of recurrent hospitalisation more often within the year. In addition, this group of end-stage heart failure patients often suffer from dyspnoea, fatigue, and cardiac arrhythmias [58], which add to recurrent treatment necessities. Concurrent with other reports on heart failure readmission [61,62], this study identified that the prior admission strongly increased the risk for 30 days readmission.
Correspondingly, males with heart failure were part of the rule associated with shorter readmission length. This finding supported a scoping review conducted by [63], which found that many papers reported higher readmission rates among men with heart failure as compared to women. Previous studies also suggested that men reportedly sought less health assistance than women, thus explaining the above [21,64]. Further research is required to understand the association of gender towards readmission in this country.
This study also found that a short duration from one to five days of index admission stay was a possible indicator for late readmission (readmission categories D and E) in this particular dataset. The association of length’s stay towards readmission was complex [65], wherein prior studies have provided conflicting findings. Some studies suggested that short length of hospital stays increased the rate of 30 days 20 readmission [66,67], while other studies found that extended length of stay increased the readmission risk [65]. In addition, Moriyama et al. [68] reported a nonlinear relationship between length of stay and readmission, where index hospital stay was associated with increased rate, regardless of the short and long length of stay duration. However, all these studies indicated the association towards early readmission, whereas the association towards late readmission remained unclear. Short length of stay was often associated with premature discharge; thus, many patients were required to return to the hospital for a short period for additional inpatient care [69]. Further research is required to investigate the relationship of a short length stay with the premature discharge in this study. This study speculated that the short length of stay associated with late readmission was due to the reduced severity of patients (i.e., low-risk heart failure patient). However, it increased the risk if the patient neglected necessary healthcare, thereby leading to late readmission. It was also seen that heart failure patients with multiple morbidities were associated with late readmission (>180 days). It could be argued that these patients might be under regular follow-up for other diseases, which optimised their heart failure condition and thus reduced early readmission. This finding was also supported by [70] study on non-heart failure study readmission.
This study’s strengths included a comprehensive set of the mined rules for supervised learning, which underlined patients’ universal characteristics with various lengths of readmission and demographic predictors. Concurrently, a large set of patient discharge data across the country were used to generalise the readmission perspective for the whole population and served as a preliminary finding for future research on heart failure readmission. Notwithstanding, the study limitations involved the availability of variables in SMRP to describe heart failure readmission factors. The SMRP are census data that offer good coverage for ARM to learn the associations. Despite the limited variables, some of the findings corresponded to other studies. The proposed ARM framework was also justified in readmission datasets with the well-established Apriori algorithm for ARM. Hence, the generalisability to other settings remain unknown as medical application datasets are confidential with ethics approval requirements. Nonetheless, this study considered a large (nationwide) dataset. The study also proposed methods on different readmission duration (unavailable in past research). The empirical outcomes could be utilised as a benchmark for future studies. Regarding future research directions, the proposed method capacity could be measured against other readmission datasets and explored in other medical datasets. Future studies could also investigate the suitability of other ARM algorithms to comprehend hospital readmission.

6. Practical and Managerial Implications

Comprehensible instruments to facilitate decision-making are highly valuable in the healthcare domain. As hospital readmission impacts the financial management of healthcare institutions, it is deemed essential to make correct decisions in treating patients and mitigating unnecessary readmission in a timely manner. The intricacies of hospital readmission and ambiguous correlations further complicated healthcare application predictions compared to the prediction of mortality or other diseases. Thus, it is deemed essential to emphasise the relationship between input variables for various readmission lengths and appropriate decision-making.
Highlighting the rules, specifically in various readmission lengths, presents many practical implications. First, the extracted rules facilitate healthcare practitioners through ARM to understand the nature of short-term or long-term readmissions while making proper plans on the discharge day. As such, high-risk readmitted patients could have frequent follow-ups or make phone calls to update patient severity. Regarding managerial implications, proper planning could function as a standard patient discharge procedure. As public hospital healthcare practitioners and management need to make rapid medical decisions, employing the rules perceivably improves operational performance in overcrowded environments following a high volume of patients. Lastly, benchmarking the rules potentially ensures optimal resource utilisation. For example, target patients with a high risk of future readmission (high-severity patients) could be located in full-capacity hospitals.

7. Conclusions

This study attempted to fulfil all the objectives mentioned above of two respects. Firstly, the overall framework of ARM in readmission task was proposed, which consisted of two processes: data preprocessing and rule mining extraction. In the preprocessing stage, the steps included were data cleaning, discretisation, transformation, and resampling to illustrate how the raw data were managed to produce a structured dataset. This structured representation was used in the rule extraction stage using the Apriori algorithm. Secondly, the association rules of heart failure hospital readmission in the Malaysian public hospitals were identified. The rules were mined in supervised rule learning on various settings of readmission types and basic demographics variables (i.e., gender, race, and age group). The ARM achieved reasonable confidence using the variables extracted from the national health census called SMRP.
Overall, some co-occurrent relationships, such as zero past admissions, were associated with zero diagnosis. Meanwhile, past admissions of over four times or two past visits within 360 days did not portray external causes. Additionally, the rules for shorter readmission durations (<180 days) were associated with multiple past admissions (predominantly males under the elderly age group) with no external causes. Contrarily, longer readmission durations (>180 days) were related to short durations and multiple diagnoses. The relationships among basic demographic variables were also extensively discussed. The rules for females were associated with the elderly age group and with a duration of 6 to 10, whereas the counterparts for males were often related to the elderly age group with a duration of one to five. The findings could follow the timeline where males were exposed to heart failure at an earlier age compared to females. The proposed ARM framework added new knowledge by discovering the factors for heart failure hospital readmission in Malaysia and could be replicated in other acute and chronic disorders using the same variables in SMRP. As a future research direction, this paper aims to enrich the ARM by adding more clinical variables using the same framework, such as laboratory procedures and medications from SMRP or the Malaysian Health Data Warehouse (MyHDW).

Author Contributions

Conceptualisation, N.H.M., ‘I.M.S., C.S.C., and C.G.N.; methodology, N.H.M. and ‘I.M.S.; software, N.H.M.; validation, ‘I.M.S., C.S.C., and C.G.N.; formal analysis, N.H.M.; investigation, N.H.M. and ‘I.M.S.; resources, C.S.C.; data curation, N.H.M.; writing—original draft preparation, N.H.M.; writing—review and editing, ‘I.M.S., C.S.C., and C.G.N.; supervision, C.S.C. and C.G.N.; project administration, C.S.C.; funding acquisition, C.S.C. All authors have read and agreed to the published version of the manuscript.

Funding

This research received no external funding.

Institutional Review Board Statement

Not applicable.

Informed Consent Statement

Not applicable.

Data Availability Statement

The data presented in this study are available on request from the corresponding author. The data are not publicly available due to the requirement in medical ethical approval where all records and data are to be kept strictly confidential and can only be used for the purpose of this study.

Acknowledgments

The authors are thankful to the Director-General of Health Malaysia for allowing us to publish this paper and also the support from the Health Informatics Centre, Malaysian Ministry of Health, for providing the data to support this study under medical ethics of NMRR-18-2909-44625. The financial support received from the University of Malaya, Universiti Kebangsaan Malaysia, and the Ministry of Education, Malaysia is gratefully acknowledged.

Conflicts of Interest

The authors declare no conflict of interest.

References

  1. Golmohammadi, D.; Radnia, N. Prediction modeling and pattern recognition for patient readmission. Int. J. Prod. Econ. 2015, 171, 151–161. [Google Scholar] [CrossRef]
  2. Kansagara, D.; Englander, H.; Salanitro, A.; Kagen, D.; Theobald, C.; Freeman, M.; Kripalani, S. Risk prediction models for hospital readmission: A systematic review. JAMA 2011, 306, 1688–1698. [Google Scholar] [CrossRef] [PubMed] [Green Version]
  3. Ben-Assuli, O.; Padman, R. Analysing repeated hospital readmissions using data mining techniques. Health Syst. 2018, 7, 166–180. [Google Scholar] [CrossRef] [PubMed]
  4. Artetxe, A.; Beristain, A.; Grana, M. Predictive models for hospital readmission risk: A systematic review of methods. Comput. Methods Programs Biomed. 2018, 164, 49–64. [Google Scholar] [CrossRef]
  5. Wright, A.; Chen, E.S.; Maloney, F.L. An automated technique for identifying associations between medications, laboratory results and problems. J. Biomed. Inform. 2010, 43, 891–901. [Google Scholar] [CrossRef] [Green Version]
  6. Liao, S.-H.; Chu, P.-H.; Hsiao, P.-Y. Data mining techniques and applications—A decade review from 2000 to 2011. Expert Syst. Appl. 2012, 39, 11303–11311. [Google Scholar] [CrossRef]
  7. Sarıyer, G.; Tasar, C.O. Highlighting the rules between diagnosis types and laboratory diagnostic tests for patients of an emergency department: Use of association rule mining. Health Inform. J. 2020, 26, 1177–1193. [Google Scholar] [CrossRef] [PubMed] [Green Version]
  8. Tseng, M.-H.; Wu, H.-C. Investigating health equity and healthcare needs among immigrant women using the association rule mining method. Healthcare 2021, 9, 195–208. [Google Scholar] [CrossRef] [PubMed]
  9. Lee, S.J.; Cartmell, K.B. An association rule mining analysis of lifestyle behavioral risk factors in cancer survivors with high cardiovascular disease risk. J. Pers. Med. 2021, 11, 366–376. [Google Scholar] [CrossRef] [PubMed]
  10. Altaf, W.; Shahbaz, M.; Guergachi, A. Applications of association rule mining in health informatics: A survey. Artif. Intell. Rev. 2017, 47, 313–340. [Google Scholar] [CrossRef]
  11. Jabbar, M.A.; Deekshatulu, B.L.; Chandra, P. Knowledge discovery using associative classification for heart disease prediction. In Intelligent Informatics; Springer: Berlin/Heidelberg, Germany, 2013; pp. 29–39. [Google Scholar]
  12. Lee, D.G.; Ryu, K.S.; Bashir, M.; Bae, J.-W.; Ryu, K.H. Discovering medical knowledge using association rule mining in young adults with acute myocardial infarction. J. Med. Syst. 2013, 37, 9896. [Google Scholar] [CrossRef] [PubMed]
  13. Shameer, K.; Perez-Rodriguez, M.M.; Bachar, R.; Li, L.; Johnson, A.; Johnson, K.W.; Glicksberg, B.S.; Smith, M.R.; Readhead, B.; Scarpa, J.; et al. Pharmacological risk factors associated with hospital readmission rates in a psychiatric cohort identified using prescriptome data mining. BMC Med. Inform. Decis. Mak. 2018, 18, 1–11. [Google Scholar] [CrossRef]
  14. Payus, C.; Sulaiman, N.; Shahani, M.; Bakar, A.A. Association rules of data mining application for respiratory illness by air pollution database. Int. J. Basic Appl. Sci. 2013, 13, 11–16. [Google Scholar]
  15. Graham, K.L.; Auerbach, A.D.; Schnipper, J.L.; Flanders, S.A.; Kim, C.S.; Robinson, E.J.; Ruhnke, G.W.; Thomas, L.R.; Kripalani, S.; Vasilevskis, E.E. Preventability of early versus late hospital readmissions in a national cohort of general medicine patients. Ann. Intern. Med. 2018, 168, 766–774. [Google Scholar] [CrossRef] [PubMed]
  16. Braga, P.; Portela, F.; Santos, M.F.; Rua, F. Data mining models to predict patient’s readmission in intensive care units. In Proceedings of the 6th International Conference on Agents and Artificial Intelligence (ICAART 2014), Angers, France, 6–8 March 2014. [Google Scholar]
  17. Zheng, B.; Zhang, J.; Yoon, S.W.; Lam, S.S.; Khasawneh, M.; Poranki, S. Predictive modeling of hospital readmissions using metaheuristics and data mining. Expert Syst. Appl. 2015, 42, 7110–7120. [Google Scholar] [CrossRef]
  18. Sawangarreerak, S.; Thanathamathee, P. Detecting and analyzing fraudulent patterns of financial statement for open innovation using discretization and association rule mining. J. Open Innov. Technol. Mark. Complex. 2021, 7, 128–147. [Google Scholar] [CrossRef]
  19. Kaur, M.; Kang, S. Market basket analysis: Identify the changing trends of market data using association rule mining. Proced. Comput. Sci. 2016, 85, 78–85. [Google Scholar] [CrossRef] [Green Version]
  20. Apiletti, D.; Pastor, E. Correlating espresso quality with coffee-machine parameters by means of association rule mining. Electronics 2019, 9, 100–118. [Google Scholar] [CrossRef] [Green Version]
  21. Hang, L.; Kang, S.-H.; Jin, W.; Kin, D.-H. Design and implementation of an optimal travel route recommender system on big data for tourists in Jeju. Processes 2018, 6, 133–152. [Google Scholar] [CrossRef] [Green Version]
  22. Orama, J.A.; Borras, J.; Moreno, A. Combining cluster-based profiling based on social media features and association rule mining for personalised recommendations of touristic activities. Appl. Sci. 2021, 1, 6512. [Google Scholar] [CrossRef]
  23. Chen, X.; Deng, H. Research on personalized recommendation methods for online video learning resources. Appl. Sci. 2021, 11, 804. [Google Scholar] [CrossRef]
  24. Zhao, Y.; Zhang, C.; Zhang, Y.; Wang, Z.; Li, J. A review of data mining technologies in building energy systems: Load prediction, pattern identification, fault detection and diagnosis. Energy Build Environ. 2020, 1, 149–164. [Google Scholar] [CrossRef]
  25. Shi, Y.; Wu, B.; Chen, N.; Chen, A.; Li, J.; Li, H. Determination of effective management strategies for scenic area emergencies using association rule mining. Int. J. Disaster Risk Reduct. 2019, 39, 101208. [Google Scholar] [CrossRef]
  26. Aggarwal, C.C. Data Classification: Algorithms and Applications; CRC Press: New York, NY, USA, 2015. [Google Scholar]
  27. Li, J.; Fu, A.W.-C.; Fahey, P. Efficient discovery of risk patterns in medical data. Artif. Intell. Med. 2009, 45, 77–89. [Google Scholar] [CrossRef]
  28. Stilou, S.; Bamidis, P.D.; Maglaveras, N.; Pappas, C. Mining association rules from clinical databases: An intelligent diagnostic process in healthcare. Stud. Health Technol. Inform. 2001, 2, 1399–1403. [Google Scholar]
  29. Dos Santos, B.S.; Steiner, M.T.A.; Fenerich, A.T.; Lima, R.H.P. Data mining and machine learning techniques applied to public health problems: A bibliometric analysis from 2009 to 2018. Comput. Ind. Eng. 2019, 138, 106120. [Google Scholar] [CrossRef]
  30. Pazhanikumar, K.; Arumugaperumal, S. Association rule mining and medical application: A detailed survey. Int. J. Comput. Appl. 2013, 80, 10–19. [Google Scholar] [CrossRef] [Green Version]
  31. Kulkarni, A.R.; Mundhe, D. Data mining technique: An implementation of association rule mining in healthcare. Int. Adv. Res. J.Sci. Eng. Technol. 2017, 4, 76–85. [Google Scholar] [CrossRef]
  32. Ramezankhani, A.; Pournik, O.; Shahrabi, J.; Azizi, F.; Hadaegh, F. An application of association rule mining to extract risk pattern for type 2 diabetes using tehran lipid and glucose study database. Int. J. Endocrinol. Metab. 2015, 13, e25389. [Google Scholar] [CrossRef] [Green Version]
  33. Nahar, J.; Imam, T.; Tickle, K.S.; Chen, Y.-P.P. Association rule mining to detect factors which contribute to heart disease in males and females. Expert Syst. Appl. 2013, 40, 1086–1093. [Google Scholar] [CrossRef]
  34. Nahar, J.; Tickle, K.S.; Ali, A.S.; Chen, Y.-P.P. Significant cancer prevention factor extraction: An association rule discovery approach. J. Med. Syst. 2011, 35, 353–367. [Google Scholar] [CrossRef] [PubMed]
  35. Cheng, C.-W.; Chanani, N.; Venugopalan, J.; Maher, K.; Wang, M.D. icuARM—An icu clinical decision support system using association rule mining. IEEE J. Transl. Eng. Health Med. 2013, 1, 4400110. [Google Scholar] [CrossRef] [PubMed]
  36. Harahap, M.; Husein, A.; Aisyah, S.; Lubis, F.; Wijaya, B. Mining association rule based on the diseases population for recommendation of medicine need. J. Phys. Conf. Ser. 2018, 1007, 012017. [Google Scholar] [CrossRef]
  37. Chaves, R.; Ramirez, J.; Gorriz, J.; Puntonet, C.G. Association rule-based feature selection method for alzheimer’s disease diagnosis. Expert Syst. Appl. 2012, 39, 11766–11774. [Google Scholar] [CrossRef]
  38. Said, I.U.; Adam, A.H.; Garko, A.B. Association rule mining on medical data to predict heart disease. Int. J. Sci. Technol. Manag. 2015, 4, 26–35. [Google Scholar]
  39. Li, J.; Fu, A.W.-C.; He, H.; Chen, J.; Jin, H.; McAullay, D.; Williams, G.; Sparks, R.; Kelman, C. Mining risk patterns in medical data. In Proceedings of the Eleventh ACM SIGKDD International Conference on Knowledge Discovery in Data Mining, Chicago, IL, USA, 21–24 August 2005; pp. 770–775. [Google Scholar]
  40. Park, S.H.; Jang, S.Y.; Kim, H.; Lee, S.W. An association rule mining-based framework for understanding lifestyle risk behaviors. PLoS ONE 2014, 9, e88859. [Google Scholar] [CrossRef]
  41. Lemon, S.C.; Roy, J.; Clark, M.A.; Friedmann, P.D.; Rakowski, W. Classification and regression tree analysis in public health: Methodological review and comparison with logistic regression. Ann. Behav. Med. 2003, 26, 172–181. [Google Scholar] [CrossRef]
  42. Deschepper, M.; Eeckloo, K.; Vogelaers, D.; Waegeman, W. A hospital wide predictive model for unplanned readmission using hierarchical ICD data. Comput. Methods Programs Biomed. 2019, 173, 177–183. [Google Scholar] [CrossRef]
  43. Dorajoo, S.R.; See, V.; Chan, C.T.; Tan, J.Z.; Tan, D.S.Y.; Razak, S.M.B.A.; Ong, T.T.; Koomanan, N.; Yap, C.W.; Chan, A. Identifying potentially avoidable readmissions: A medication-based 15-day readmission risk stratification algorithm. Pharmacother. J. Hum. Pharmacol. Drug Ther. 2017, 37, 268–277. [Google Scholar] [CrossRef]
  44. Greenwald, J.L.; Cronin, P.R.; Carballo, V.; Danaei, G.; Choy, G. A novel model for predicting rehospitalization risk incorporating physical function, cognitive status, and psychosocial support using natural language processing. Med. Care 2017, 55, 261–266. [Google Scholar] [CrossRef]
  45. Imamura, T.; Matsumoto, S.; Kanagawa, Y.; Tajima, B.; Matsuya, S.; Furue, M.; Oyama, H. A technique for identifying three diagnostic findings using association analysis. Med. Biol. Eng. Comput. 2007, 45, 51–59. [Google Scholar] [CrossRef] [PubMed]
  46. Jaafar, S.; Noh, K.M.; Muttalib, K.A.; Othman, N.H.; Healy, J. Malaysian Health System Review; WHO: Geneva, Switzerland, 2012. [Google Scholar]
  47. Kaboudarahangi, M.; Tahir, O.M.; Kamal, M. Malaysia’s three major ethnic group preferences in creating a malaysian garden identity. Aust. Geogr. 2014, 44, 197–213. [Google Scholar] [CrossRef]
  48. Yorulmaz, M.; Mohamed, N.N. Malaysia health system review: Overviews and opinions. Int. J. Health Adm. Educ. Congr. (Sanitas Magisterium) 2019, 5, 45–57. [Google Scholar]
  49. Berry, J.G.; Gay, J.C.; Maddox, K.J.; Coleman, E.A.; Bucholz, E.M.; O’Neill, M.R.; Blaine, K.; Hall, M. Age trends in 30 day hospital readmissions: US national retrospective analysis. BMJ 2018, 360, k497. [Google Scholar] [CrossRef] [Green Version]
  50. Jain, S.; Khera, R.; Mortensen, E.M.; Weissler, J.C. Readmissions of adults within three age groups following hospitalization for pneumonia: Analysis from the nationwide readmissions database. PLoS ONE 2018, 13, e0203375. [Google Scholar] [CrossRef] [PubMed]
  51. Swift, H.J.; Abrams, D.; Drury, L.; Lamont, R.A. Categorization by age. Encycl. Evol. Psychol. Sci. 2018. [Google Scholar] [CrossRef]
  52. Ahn, G.; Park, Y.-J.; Hur, S. A membership probability—Based undersampling algorithm for imbalanced data. J. Classif. 2021, 38, 2–15. [Google Scholar] [CrossRef]
  53. Guo, H.; Li, Y.; Shang, J.; Gu, M.; Huang, Y.; Bing, G. Learning from class imbalanced data: Review of methods and applications. Expert Syst. Appl. 2017, 73, 220–239. [Google Scholar]
  54. Mahmood, S.; Shahbaz, M.; Guergachi, A. Negative and positive association rules mining from text using frequent and infrequent itemsets. Sci. World J. 2014, 2014. [Google Scholar] [CrossRef]
  55. Nguyen, L.T.; Vo, B.; Nguyen, T.-N.; Nguyen, A. Mining class association rules on imbalanced class datasets. J. Intell. Fuzzy Syst. 2019, 37, 7131–7139. [Google Scholar] [CrossRef]
  56. Bui-Thi, D.; Meysman, P.; Laukens, K. Clustering association rules to build beliefs and discover unexpected patterns. Appl. Intell. 2020, 50, 1943–1954. [Google Scholar] [CrossRef]
  57. Yang, D.H.; Kang, J.H.; Park, Y.B.; Park, Y.J.; Oh, H.S.; Kim, S.B. Association rule mining and network analysis in oriental medicine. PLoS ONE 2013, 8, e59241. [Google Scholar] [CrossRef] [Green Version]
  58. Habal, M.V.; Garan, A.R. Long-term management of end-stage heart failure. Best Pract. Res. Clin. Anaesthesiol. 2017, 31, 153–166. [Google Scholar] [CrossRef] [PubMed]
  59. Maas, A.H.E.M.; Appelman, Y.E.A. Gender differences in coronary heart disease. Neth. Heart J. 2010, 18, 598–603. [Google Scholar] [CrossRef]
  60. Bozkurt, B.; Khalaf, S. Heart failure in women. Methodist DeBakey Cardiovasc. J. 2018, 13, 216–223. [Google Scholar] [CrossRef]
  61. Chamberlain, R.S.; Sond, J.; Mahendraraj, K.; Lau, C.S.; Siracuse, B.L. Determining 30-day readmission risk for heart failure patients: The readmission after heart failure scale. Int. J. Gen. Med. 2018, 11, 127. [Google Scholar] [CrossRef] [Green Version]
  62. Hummel, S.L.; Katrapati, P.; Gillespie, B.W.; DeFranco, A.C.; Koelling, T.M. Impact of prior admissions on 30-day readmissions in medicare heart failure inpatients. Mayo Clin. Proc. 2014, 89, 623–630. [Google Scholar] [CrossRef] [PubMed] [Green Version]
  63. Hoang-Kim, A.; Parpia, C.; Freitas, C.; Austin, P.C.; Ross, H.J.; Wijeysundera, H.C.; Tu, K.; Mak, S.; Farkouh, M.E.; Sun, L.Y. Readmission rates following heart failure: A scoping review of sex and gender based considerations. BMC Cardiovasc. Disord. 2020, 20, 1–19. [Google Scholar] [CrossRef] [PubMed]
  64. Woz, S.; Mitchell, S.; Hesko, C.; Paasche-Orlow, M.; Greenwald, J.; Chetty, V.; O’Donnell, J.; Jack, B. Gender as risk factor for 30 days post-discharge hospital utilisation: A secondary data analysis. BMJ Open 2012, 2, e000428. [Google Scholar] [CrossRef] [Green Version]
  65. Chopra, I.; Wilkins, T.L.; Sambamoorthi, U. Hospital length of stay and all-cause 30-day readmissions among high-risk medicaid beneficiaries. J. Hosp. Med. 2016, 11, 283–288. [Google Scholar] [CrossRef] [Green Version]
  66. Kitakata, H.; Kohno, T.; Kohsaka, S.; Shiraishi, Y.; Parizo, J.T.; Niimi, N.; Goda, A.; Nishihata, Y.; Heidenreich, P.A.; Yoshikawa, T. Prognostic implications of early and midrange readmissions after acute heart failure hospitalizations: A report from a japanese multicenter registry. J. Am. Heart Assoc. 2020, 9, e014949. [Google Scholar] [CrossRef] [PubMed]
  67. Sud, M.; Yu, B.; Wijeysundera, H.C.; Austin, P.C.; Ko, D.T.; Braga, J.; Cram, P.; Spertus, J.A.; Domanski, M.; Lee, D.S. Associations between short or long length of stay and 30-day readmission and mortality in hospitalized patients with heart failure. JACC Heart Fail. 2017, 5, 578–588. [Google Scholar] [CrossRef] [PubMed]
  68. Moriyama, H.; Kohno, T.; Kohsaka, S.; Shiraishi, Y.; Fukuoka, R.; Nagatomo, Y.; Goda, A.; Mizuno, A.; Fukuda, K.; Yoshikawa, T. Length of hospital stay and its impact on subsequent early readmission in patients with acute heart failure: A report from the wet-hf registry. Heart Vessel. 2019, 34, 1777–1788. [Google Scholar] [CrossRef]
  69. Carey, K.; Lin, M.-Y. Hospital length of stay and readmission: An early investigation. Med. Care Res. Rev. 2014, 71, 99–111. [Google Scholar] [CrossRef]
  70. Hughes, L.D.; Witham, M.D. Causes and correlates of 30 day and 180 day readmission following discharge from a medicine for the elderly rehabilitation unit. BMC Geriatr. 2018, 18, 197. [Google Scholar] [CrossRef] [Green Version]
Figure 1. The complete research framework of ARM for hospital readmission.
Mathematics 09 02706 g001
Figure 2. The association among basic demographics variables based on the mined CAR with its respective confidence value.
Mathematics 09 02706 g002
Table 1. Readmission type based on length of readmission.
Readmission TypeDuration from the Previous DischargeTotal (%)
Nor readmitted-37,380 (76.93)
Readmission category AFrom 0 to 30 days3092 (6.36)
Readmission category BFrom 31 to 90 days2563 (5.27)
Readmission category CFrom 91 to 180 days1780 (3.66)
Readmission category DFrom 181 to 360 days1652 (3.40)
Readmission category EMore than 360 days2126 (4.38)
Table 2. Summary of variables and list of input used to create rules.
VariablesTotal InputList of InputNotation
Gender2Male, femaleGender = {M, F}
Race4Malay, Chinese, Indian, othersRace = {Mal, Chi, Ind, O}
Age group7Infant (less than two years), children (three to eleven years old), teenagers (12 to 18 years old), young adult (19 to 30 years old), middle-aged adult (31 to 45 years old), old adult (46 to 64 years old) and elderly (more than 64 years old)Age = {I, C, T, YA, MA, OA, E}
Admitting discipline of care9General medical, paediatric, general surgery, orthopaedics, gynaecology, cardiology, cardiothoracic surgery, others, without classificationAdmit_disp = {GEN, PAE, SUR, OTH, GYN, CAR, CTS, O, NOC}
The discipline of care to be discharged from9Disc_disp = {I10, I25, E14, J18, I48, E87, J44, I20, N18, V89, DHF, OD}
Other related diagnoses12I10, I25, E14, J18, I48, E87, J44, I20, N18, V89, decompensated heart failure (DHF), other diagnosesEach of the codes represented as binary variables of yes or no
Length of stay71–5 days, 6–10 days, 11–15 days, 16–20 days, 21–25 days, 26–30 days, more than 30 daysLOS = {1–5 days, 6–10 days, 11–15 days, 16–20 days, 21–25 days, 26–30 days, Above 30 days}
Past admission6No, one, two, three, four, more than fourPast_adm = {N, 1, 2, 3, 4, above 4}
Total visit past 360 days6TV_360days = {N, 1, 2, 3, 4, above 4}
Total other diagnoses6TOD = {N, 1, 2, 3, 4, above 4}
Total underlying cause4No, one, two, more than twoTC = {N, 1, 2, above 2}
Total external cause of trauma4TE = {N, 1, 2, above 2}
Surgery experience2Yes, noSE = {Y, N}
Table 3. ARM for supervised learning based on different readmission threshold.
Readmission TypeConditionSupportConfidenceLift
Not readmitted{Past_adm = N, TOD = N, TE = N, Race = Mal, Admit_disp = GEN, Disc_disp = GEN} 0.01440.65903.9539
{LOS = 1–5 days, past_adm = N, TOD = N, Race = Mal}0.07220.32301.9378
{LOS = 1–5 days, past_adm = N, TOD = N, Gender = F}0.05030.31301.8783
{Past_adm = N, Race = Mal, Gender = F, E14 = N, J18 = N, I48 = N, E87 = N, DHF = N}0.05030.30481.8286
Readmission category A
(0–30 days)
{Past_adm = above 4, TE = N, E87 = N} 0.01090.36612.1966
{TV_360days = 2, TE = N, Gender = M, E14 = N, J18 = N, I20 = N}0.01020.33111.9869
{TV_360days = 2, SE = N, TE = N, Race = Mal, underlying cause I25 = N, J18 = N, E87 = N, N18 = N}0.01040.32491.9495
{Age = OA, TE = N, external cause V89 = N, J18 = N, E87 = N} 0.06700.17021.0213
Readmission category B
(31–90 days)
{Past_adm = above 4, SE = N, I48 = N, I20 = N}0.01010.33562.0134
{Age = OA, SE = N, TE = N, Admit_disp = GEN, Disc_disp = GEN, J18 = N, I48 = N, DHF = N} 0.05030.18041.0824
{SE = N, TE = N, Admit_disp = GEN, Gender = M, external cause V89 = N, J18 = N, I48 = N, DHF = N} 0.07090.17951.0768
Readmission category C
(91–180 days)
{LOS = 1–5 days, TV_360 days = 1, TOD = N, TC = N, Race = Mal, Admit_disp = GEN, underlying cause I25 = N} 0.01010.30491.8293
{LOS = 1–5 days, Age = E, TV_360 days = 1, Disc_disp = GEN, external cause V89 = N, I10 = N, J44 = N, N18 = N}0.01010.30211.8127
{TC = N, TE = N, Race = Mal, Admit_disp = GEN, underlying cause I25 = N, E14 = N, N18 = N, OD = N 0.06380.18271.0963
Readmission category D
(181–360 days)
{LOS = 1–5 days, TOD = 2, SE = N, I25 = N, I48 = N, I20 = N, DHF = N} 0.01010.26531.5915
{LOS = 1–5 days, age = OA, SE = N, Race = Mal, Admit_disp = GEN, Gender = F, I25 = N, J44 = N} 0.01210.25641.5385
{Age = OA, Admit_disp = GEN, Disc_disp = GEN, I25 = N, I48 = N, J44 = N, N18 = N}0.05200.19351.1608
Readmission category E
(More than 360 days)
{Past_adm = N, TOD = 2, SE = N, E14 = N, J44 = N, N18 = N} 0.01010.29241.7544
{LOS = 1–5 days, past_adm = N, TC = N, Admit_disp = GEN, Disc_disp = GEN, E14 = N, J44 = N, N18 = N}0.06720.22121.3271
Table 4. Supervised association rule mined based on gender.
Data ClassificationRulesSupportConfidenceLift
All patient data{Age = OA, TC = N, TE = N, Race = Chi, adm_disp = GEN, disc_disp = GEN, external cause V89 = N, DHF = N} → {Gender = M}0.02790.71811.2968
{LOS = 1–5 days, age = OA, TC = N, TE = N, Race = Chi, external cause V89 = N, I48 = N, DHF = N} → {Gender = M}0.02770.71791.2964
{Age = E, past_adm = N, TE = N, Race = Ind, J18 = N, E87 = N, J44 = N, OD = N} → {Gender = F}0.02160.58541.3118
{LOS = 6–10 days, age = E, TV_360days = N, TC = N, external cause V89 = N, I25 = N, E14 = N, J44 = N, N18 = N} → {Gender = F}0.05030.52311.1722
Readmitted patient data{LOS = 1–5 days, TC = N, E14 = N, E87 = N, J44 = Y, I20 = N, N18 = N} → {Gender = M}0.01060.91541.5359
{Age = OA, TV_360days = 1, SE = N, TC = N, TE = N, J18 = N, N18 = N, OD = N} → {Gender = M}0.05030.69891.1726
{LOS = 1–5 days, Age = OA, past_adm = N, TE = N, Race = Ind, J44 = N, DHF = N, OD = N} → {Gender = F}0.01070.62181.5390
{LOS = 1–5 days, Age = E, past_adm = N, TE = N, Race = Ind, I10 = N, I25 = N, J44 = N} → {Gender = F}0.01070.62181.5390
Table 5. Supervised association rule mined based on race.
Data ClassificationRulesSupportConfidenceLift
All patient data{Age = OA, admit_disp = NOC, disc_disp = NOC, Gender = F, E14 = N, J18 = N, E87 = N, OD = N} → {Race = Mal}0.01010.94401.5436
{LOS = 1–5 days, admit_disp = NOC, disc_disp = NOC, Gender = F, I10 = N, E14 = N, E87 = N, OD = N} → {Race = Mal} 0.01800.94391.5434
{Age = E, TV_360days = N, TOD = N, admit_disp = CAR, disc_disp = CAR, I10 = N, J44 = N, OD = N} → {Race = Chi}0.01170.48632.6473
{LOS = 1–5 days, Age = E, past_adm = N, TOD = N, TE = N, underlying cause I25 = N, external cause V89 = N, I10 = N, J44 = N} → {Race = Chi}0.06590.25621.3950
{LOS = 1–5 days, age = OA, Gender = F, TOD = N, TC = N, disc_disp = GEN, I10 = N, I48 = N} → {Race = Ind}0.01360.18881.6210
{Age = OA, TOD = N, SE = N, underlying cause I25 = N, external cause V89 = N, I10 = N, I48 = N, J44 = N, DHF = N} → {Race = Ind}0.05010.15641.3431
Readmitted patient data{Admit_disp = NOC, I10 = N, I25 = Y} → {Race = Mal}0.01110.98431.5590
{Age = OA, TC = N, disc_disp = NOC, Gender = F, E14 = N, E87 = N} → {Race = Mal}0.01090.97601.5460
{Age = E, TOD = N, TE = N, admit_disp = CAR, disc_disp = CAR} → {Race = Chi}0.01060.41462.3721
{LOS = 1–5 days, age = E, TE = N, I10 = N, I25 = N, E14 = N, J18 = N, J44 = N, OD = N} → {Race = Chi}0.05840.24881.4232
{Age = OA, TV_360days = 1, disc_disp = GEN, I25 = N, J18 = N, I48 = N, I20 = N, OD = N} → {Race = Ind}0.01010.19581.5971
Table 6. Supervised association rule mined based on age group.
Data ClassificationRulesSupportConfidenceLift
All patient data{LOS = 6–10 days, Race = Chi, Gender = F, Dics_disp = GEN, E87 = N, I20 = N} → {Age = E}0.01000.78801.5810
{TC = N, TE = N, Race = Chi, Gender = F, underlying cause I25 = N, external cause V89 = N, E87 = N, DHF = N, N18 = N} → {Age = E}0.05440.75411.5130
{LOS = 1–5 days, SE = N, Race = Ind, Gender = M, external cause V89 = N, J18 = N, I48 = N, J44 = N} → {Age = OA}0.02420.57081.3831
{Race = Mal, Gender = M, adm_disp = GEN, external cause V89 = N, I48 = N, J44 = N, N18 = N, OD = N} → {Age = OA}0.10100.47751.1571
{Past_adm = N, Gender = M, underlying cause I25 = N, I10 = N, I25 = N, E14 = N, J18 = N, J44 = N} → {Age = MA}0.03360.07821.1832
{Past_adm = N, I10 = N, I25 = N, E14 = N, I48 = N, J44 = N, I20 = N} → {Age = YA} 0.01220.01541.1114
Readmitted patient data{LOS = 6–10 days, Race = Chi, Gender = F, I10 = N, I20 = N, DHF = N} → {Age = E}0.01190.82611.7230
{TV_360days = N, TC = N, TE = N, Race = Chi, disc_disp = GEN, E87 = N, OD = N} → {Age = E}0.05000.63611.3267
{LOS = 6–10 days, Race = Ind, Gender = M} → {Age = OA}0.01080.63681.4380
{TE = N, Race = Mal, admit_disp = O, Gender = M, I25 = N, J44 = N, OD = N} → {Age = OA}0.01040.61581.3904
{LOS = 1–5 days, past_adm = N, Race = Mal, Gender = M, I10 = N, E14 = N, J44 = N, I20 = N} → {Age = MA}0.01110.08731.3859
{TC = N, I25 = N, E14 = N, I48 = N, J44 = N, I20 = N, DHF = N, N18 = N} → {Age = YA}0.01020.01291.1772
Publisher’s Note: MDPI stays neutral with regard to jurisdictional claims in published maps and institutional affiliations.

