Abstract
We consider alternative possibilities for hedging spot positions on the FTSE LATIBEX Index, the index of the only international market exclusively for Latin American firms that is denominated by the euro. Since there is not a futures market on the index, it is unclear whether a relatively successful hedge can be found. We explore the plausibility of employing futures on four stock market indices: EUROSTOXX 50, S&P500, BOVESPA, and IPC, and simulate the results that could be obtained by a hedge position based on either unconditional or conditional second order moments estimated from different asymmetric GARCH models. Several criteria for hedging effectiveness suggest that futures contracts on BOVESPA should be preferred, and that a salient reduction in risk can be achieved over the unhedged LATIBEX portfolio. The evidence in favor of a better performance of conditional moments is very clear, without significant differences among the alternative GARCH specifications.
1. Introduction
Latin American firms have experienced robust growth in the last few decades, with large corporations, known as Multilatinas, obtaining access to ever more sophisticated, liquid, and efficient financial markets. Under this scenario, firms in emerging Latin American countries are currently an attractive alternative for the foreign investor in search of diversification for his/her portfolio. Although stock markets in the region have experienced an important increase in the number of firms trading as well as in their capitalization, little progress has been made towards the integration of the different markets or the development of a representative trading market for the region. The LATIBEX is the only international market trading for Latin American stocks, in the same currency, the euro. It is worth mentioning that the Mercado Integrado Latinoamericano (MILA), made up by the stock markets of Chile, Colombia, Mexico, and Peru, introduced in August 2011 the S&P MILA Andean 40 index using data since December 2006. However, unlike the LATIBEX market, MILA transactions are in the local currency of each company. Moreover, the aggregate GDP of the member countries does not represent more than 40% of the regional GDP, while LATIBEX member countries represent 68%. This is considered a convenient instrument to efficiently channel investments to the region, allowing investors to trade stocks from the main Latin American firms in a single market, with a single operating system for trading and liquidation, satisfying high transparency and security, and operating with the euro as the single currency (general information from the LATIBEX website). For the typical investor holding a position in the FTSE LATIBEX (henceforth, LATIBEX) Index who is searching for diversification possibilities, it will be important to characterize hedging strategies that allow for an efficient reduction in risk. However, in the absence of futures contracts on the LATIBEX index, it is necessary to analyze cross-hedging possibilities using futures contracts on other markets. Cross-hedging has been studied extensively, Anderson and Danthine [1] were among the first to discuss cross-hedging in a theoretical way, later Eaker and Grant [2] delved into the treatment of cross currency hedging, measuring the effectiveness of hedging when there are no futures on a currency, and, recently, there have been several applications of cross-hedging of: Commodities, such as [3], who evaluated the effectiveness of cross-hedging of commodities between the metal and spot futures markets; Energy, such as [4], who analyzed the cross-hedging of aviation fuel with commodity futures; Stock Indices, such as [5], who examined the effectiveness of cross-hedging between a UK stock index and global stock index futures from developed and emerging markets; Real Estate, such as [6], who analyzed the effectiveness of cross-hedging real estate securities with ETFs, among other various applications..
Hence, this paper tries to answer four questions: (1) Is it effective to hedge a position in the LATIBEX index with a futures contract on another stock market index? If so, (2) Which index should be employed to hedge the LATIBEX portfolio? If such a successful hedge exists, (3) How should it be implemented? and (4) Is a dynamic hedge ratio based on conditional moments more efficient than a hedge ratio based on unconditional moments?
To address these questions in our paper, as potential stock market indices for the hedge mechanism, we consider the EUROSTOXX 50 and S&P500 series because of their relevance as international financial markets. We also consider two indices from emerging stock markets, Brazil and Mexico, as a result of the large number of firms from both countries that trade in LATIBEX. Furthermore, we characterize the dynamic cross correlations between the LATIBEX index and other stock market indices. To the best of our knowledge, this is the first time that the performance of alternative models describing the time evolution of correlations between Latin American markets grouped in LATIBEX, and developed markets, as well as their volatilities, is analyzed. Furthermore, while cross-hedging has been studied in many instances for currency portfolios, and agricultural or energy commodities, it has not been often considered for emerging stock markets, which lacks an associated market on futures. Another contribution of our paper is that we consider high volatile periods such as the Global Financial Crisis and the recent economic and financial downturn caused by the Covid Crisis, where hedging strategies with financial derivatives just as options become too expensive, with futures contracts then being the obvious alternative as a hedging asset.
We evaluate the cross-hedging possibilities by estimating the minimum variance hedge ratio (henceforth, MVHR) to construct a hedged portfolio that is rebalanced daily. We start by computing least squares MVHR estimates using first order (daily) differences of spot and futures prices as it is usual in the literature, e.g., [7]. However, in the presence of autoregressive conditional heteroskedasticity in the return series of spot and futures markets, conditional and unconditional probability distributions of returns will differ, and the MVHR should be estimated using time-varying conditional second order moments, e.g., [8], for a significantly better hedging performance, as shown for fixed income markets [9,10,11], commodity and energy markets [12,13,14,15], stock market indices [16,17,18,19,20], green bonds [21], and currency markets [22,23,24,25,26]. We follow this approach by employing asymmetric and bivariate GARCH specifications for the LATIBEX portfolio and the futures contract being used as a hedge. These models allow for negative shocks to have a higher effect on volatility than positive shocks of the same size, a very well-known stylized fact of daily financial returns named as the “leverage effect”.
The asymmetric and multivariate GARCH models employed in our study are the Constant Conditional Correlation (CCC) model [27], the Dynamic Conditional Correlation (DCC) model [28], the Diagonal VEC (DVEC) model [29], and the BEKK model [30]. We compare the performance of the four GARCH specifications among them, as well as with the hedge based on the unconditional variance–covariance matrix estimated with the available information at each point in time, the naïve unitary hedge and the unhedged portfolio. We repeat the exercise for the futures contract on either EUROSTOXX 50, S&P500, BOVESPA, or the IPC indices being used as a hedge.
The structure of the rest of this paper is as follows. Section 2 describes the methodology employed to characterize the optimal hedge ratio. The data, the descriptive statistics of spot and futures and the results on the effectiveness of the static and the dynamic hedge, are described in Section 3. Finally, Section 4 summarizes the results and presents the conclusions.
2. Materials and Methods
To evaluate cross-hedging possibilities, we compute the MVHR to construct a hedged portfolio, allowing for a daily rebalancing of the hedge. MVHR estimates were initially obtained as the slope of a regression between first order differences of spot and futures prices, e.g., [7], among others. If market prices for the portfolio to be covered and for the futures contract to use in the hedge are cointegrated, this should be taken into account in an error correction model that integrates the long-term equilibrium relationships between the portfolio to be covered and the futures contract used in the hedge with their short-term interactions. In both cases, the hedge ratio is obtained from the estimate of the unconditional variance–covariance matrix at each point in time.
2.1. Methodology for Hedging with Futures
2.1.1. Models for First and Second Order Moments
To examine the possibility for cross-hedging a LATIBEX portfolio, we consider a model that simultaneously captures the evolution of LATIBEX together with prices of futures contracts on an alternative stock market index. Since the time series for the LATIBEX prices as well as those for the futures contracts are all nonstationary, their logarithmic returns are estimated. If LATIBEX and the stock index futures to be used as a hedge were cointegrated, an Error Correction model [31] would need to be employed to avoid biases in estimation of the minimum variance hedge ratio [32]. To this aim, we apply the Dickey–Fuller test on the spot and future series in logarithms, finding clear evidence of cointegration between LATIBEX and futures contracts for BOVESPA and IPC indices, while cointegration for S&P500 and EUROSTOXX 50 indices is more dubious. Anyway, to simplify the comparison, we follow the more conservative approach of estimating an Error Correction model to characterize the relationship between LATIBEX and futures returns for each of the four stock market index futures. With the daily observations, one lag seems to be enough to obtain non-autocorrelated residuals. Even though standard lag length criteria such as AIC would sometimes suggest a longer lag, the residuals of such model show a correlation above 98% with those of a simpler Vector-Autoregressive VAR(1) model, which is the model we finally decided to estimate.
where denotes the returns on LATIBEX and on the futures market that is used for the hedge at time t, is a vector of constants, is a vector of normally distributed innovations, and A = is a 2 × 3 matrix of parameters. Moreover, ECT denotes the error correction term, which are estimated as the lagged residual from the long-term equilibrium relationship between the LATIBEX index and the futures contract on each stock market index.
As a basic benchmark, we consider a least squares approach that computes the MVHR using the standard, unconditional variance–covariance matrix estimated at each point in time the hedge is established, using only the information available at that point. In addition, given the evidence on the fact that negative shocks produce a larger increase in volatility than positive shocks of the same size, we follow the suggestions in [33,34,35], among others, to estimate versions of CCC–, DCC–, DVEC–, and BEKK–GARCH(1,1) models incorporating this asymmetry. With the estimated conditional second order moments, we then characterize the conditional MVHR. Details on these models are reviewed in the Appendix A.
2.1.2. The Dynamics of the Optimum Hedge Ratio
To characterize the dynamics of the MVHR, we consider a two-period hedge problem where the only hedge instrument available is a futures contract. It is worth mentioning that the multiperiod hedge ratios have been studied by [36,37], who incorporate cointegration relationships between spot and futures markets. The authors of [38] conclude that in the presence of heteroskedasticity, the current hedge ratio depends on the relationship between current changes in prices and the subsequent hedge ratios. The hedge ratio must then be calculated backwards from the end of the investment period to the time the hedge is implemented. To simplify the discussion, we have just considered a two-period hedge problem.
We build a portfolio made up by a long position in the spot stock market index and a short position in futures. The objective for the investor is to maximize the expected utility of the portfolio, . Following [39], we approximate this function by an expression that depends positively on the expected portfolio return , and negatively on the conditional return variance , with a λ coefficient representing the degree of risk aversion: .
The return on the hedged portfolio is given by , where rs,t and rf,t denote the returns between t − 1 and t for the spot and futures position, respectively, while bt−1 denotes the position in futures between t − 1 and t. Therefore, the conditional variance of the portfolio is , and
where , , and , i = s,f denote the expectations, variances, and covariance for spot and futures contract returns, conditional on the information available at time t − 1, . Hence, the expression for the hedge ratio maximizing expected utility is
a function of sample first and second order moments, as well as of the investor’s risk aversion, λ. As pointed out by [1,40], the first part of this expression captures the pure speculative component, while the second term captures the pure hedge component. If we assume that the conditional expected return is zero: , so that the price of the futures contract follows a martingale process, , or if the risk aversion parameter is very large (), the speculative component disappears, and we are left with the pure hedge component, the MVHR
The expression for the MVHR in Equation (4) is used in our empirical analysis. This is the counterpart of the least squares hedge ratio, with unconditional moments being substituted by conditional moments. We estimate these second order moments using the alternative GARCH specifications described in the previous section. Variations in conditional variances and covariances lead to a different performance of hedge ratios, and this is shown in our application of the alternative GARCH specifications and the performance of the futures contracts on the four stock market indices. It is worth mentioning that estimates for second order moments will change with the available information set , with an implied change in the hedge ratio.
3. Data and Results
We use the FTSE LATIBEX ALL SHARE index (namely LATIBEX) elaborated by Bolsas y Mercados Españoles and regulated by the Spanish Ley del Mercado de Valores as representative of the LATIBEX market. As data for the futures contracts to be used in the hedge, we use daily closing prices for EURO STOXX 50 INDEX FUTURES (EUROSTOXX 50 Index Futures), S&P500 FUTURES index (S&P500 Index Futures), IBOVESPA FUTURES index (BOVESPA Index Futures) and S&P/BMV IPC FUTURES index (IPC Index Futures). The sample covers the period January 2005 to August 2020, which includes the Global Financial Crisis and the Covid-19 Financial Crisis. Price quotes were obtained from the Bloomberg platform and log returns are estimated as , where is the closing price; all series are dollar-denominated.
Table 1 displays some descriptive statistics, showing daily negative returns, on average, for the futures contract on EUROSTOXX 50, at a difference of the other indices, but close to zero. The highest average returns were obtained for the futures on S&P500 and BOVESPA. This was to be expected since the North American market obtained positive and growing evolution during most of the sample we considered. Return distributions show fatter tails than the normal density, and the hypothesis of normality is overwhelmingly rejected as a result of the Jarque–Bera test statistic values.

Table 1.
Descriptive statistics for returns on LATIBEX and on stock market futures indices.
3.1. Minimum Variance Hedge Ratios
To analyze the hedging possibilities using futures contracts on other stock market indices, we estimated the MVHR following the previous methodology described for the four different futures indices EUROSTOXX 50, S&P500, BOVESPA, and IPC. To gain some insight into the relationship between the LATIBEX index and the futures markets on each of these indices, we started by estimating bivariate GARCH models over the whole sample. The GARCH model parameters are estimated by maximum likelihood under the assumption of normality of the innovations vector, so they should be interpreted as quasi-maximum likelihood estimates. Using alternative probability distributions, such as Student’s t, increases the computational cost without leading to noticeable differences in hedging results. Moreover, capturing the leverage effect in volatility seems to be more important in producing better hedging results. Figure 1 shows monthly moving averages of the conditional correlation between LATIBEX and each futures contract, estimated using the full sample (3 January 2005–25 August 2020; 4082 data points) with the asymmetric DCC– and BEKK–GARCH(1,1) models. For sake of space, we present the two models that exhibited important differences between them, that is, the asymmetric DCC– and BEKK–GARCH(1,1). The graphs for the asymmetric CCC– and DVEC–GARCH(1,1) models are available upon request.
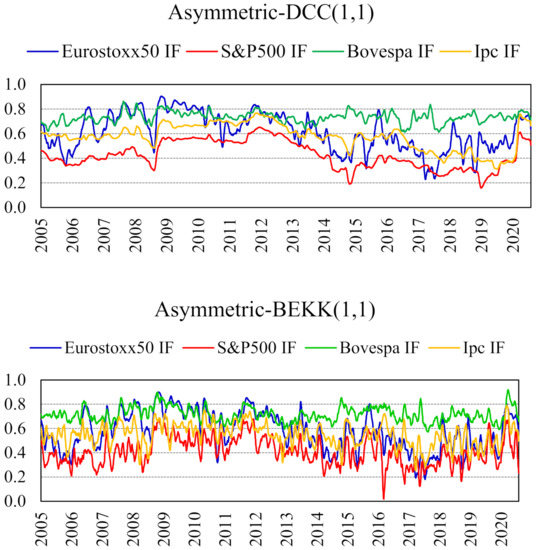
Figure 1.
Conditional correlation coefficient between LATIBEX and the futures contract on each stock market index. Estimated with asymmetric DCC–and BEKK–GARCH(1,1) models. Monthly moving averages. Full sample (1 March 2005–25 August 2020; 4082 data points).
As observed in Figure 1, in the first half of the sample (2005–2012), the correlations have medium–high levels around 0.7, with the exception of S&P500 future, which in this period, exhibits a value close to 0.5. A decrease in correlations at the beginning of the Global Financial Crisis (2008–2009) is also noticed, and, then, an increase at the end of this period. Then, in the second half of the sample (2013–August 2020) the correlations tend to decrease, with EUROSTOXX 50 and IPC index futures with values around 0.5 and S&P500 future at 0.36. The exception is with the BOVESPA futures index, which remains around 0.7. Nevertheless, an increase of correlations in the last part of the graph can be noticed, as a consequence of the Covid-19 Financial Crisis, as expected. In sum, conditional correlations from the asymmetric BEKK–GARCH(1,1) specification display larger short-term fluctuations.
To perform the hedging exercise, we split the whole sample period into two subsamples. The first ranged between 3 January 2005 and 25 August 2017 (Friday), which comprises 3300 data points. The model parameters were estimated, then used to compute one-period ahead forecasts of conditional moments and the minimum variance hedge ratio on the last day in the estimation sample. After that, we eliminated the first data point, 3 January 2005, and added a new observation at the end of the sample, 28 August 2017 (Monday), to maintain the sample size in 3300 observations. This is a real time exercise, in which the hedge is based on forecasts obtained using only the available information at each point in time. The analysis was repeated until we reached the last sample observation, 25 August 2020, for a total of 783 one-step ahead forecasts. Specifically, we started by estimating an Error Correction Model (ECM) with one lag of returns. After that, we used the Berndt, Hall, Hall, and Hausman (BHHH) algorithm to estimate asymmetric CCC–, DCC–, DVEC–, and BEKK–GARCH(1,1) specifications by quasi-Maximum Likelihood (QML) for the residuals from the ECM. From each conditional variance model, we generated second order moments. As mentioned, we performed 783 estimations of each of the four bivariate GARCH models and for each of the four futures markets indices (12,528 estimations in total), which required a noticeable computational effort.
Figure 2 shows the monthly moving average of forecasts for conditional correlations between LATIBEX and the other four futures markets indices for this sample, as estimated from asymmetric DCC– and BEKK–GARCH(1,1) models.
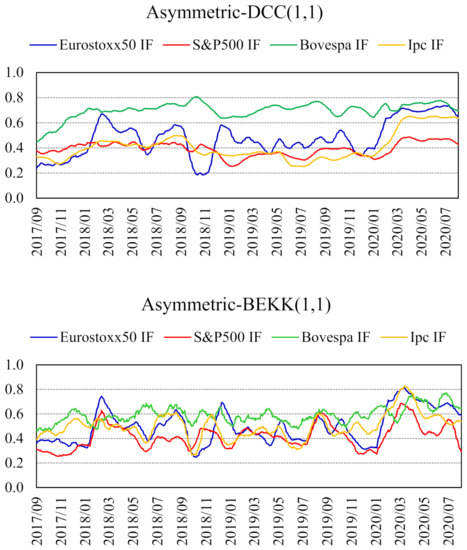
Figure 2.
Conditional correlation coefficient between LATIBEX and the futures contract on each stock market index. Estimated with asymmetric DCC– and BEKK–GARCH(1,1) models (783 forecasts). Monthly moving averages (28 August 2017–25 August 2020).
These time series represent the sequence of correlations that arise from one-day ahead forecasts of variances and covariances. The forecasted conditional correlations are at levels of 0.5 for the EUROSTOXX 50 and IPC index futures, and 0.4 and 0.7 for the S&P500 and BOVESPA index futures, respectively. As is the case with the full sample data in Figure 1, conditional correlations from the asymmetric BEKK–GARCH(1,1) specification display a higher short-term volatility.
The least squares ECM ratio (the least squares hedge ratio is always very close to that obtained from the Error Correction model, so we have just shown the latter) for the 28 August 2017–25 August 2020 period was −0.88 for EUROSTOXX 50 futures, −0.71 for S&P500 futures, −0.64 for BOVESPA futures, and −0.77 for IPC futures, all of them well below the naïve hedge ratio of −1.00. These amounts are average values of one-day ahead hedge ratios estimated over the analyzed sample. As we can observe in Table 2, average values for dynamic hedge ratios estimated from conditional volatility models are lower in absolute value to the least squares ratio for EUROSTOXX 50 futures, BOVESPA futures, and IPC futures, while being higher than the least squares for S&P500 futures contracts.
Table 2.
Characteristics of estimated Minimum Variance Hedge Ratios.
Figure 3 shows that the hedge ratio based on the BOVESPA and IPC futures contracts is very often the lowest, never surpassing the unit threshold. Estimated MVHR with multivariate asymmetric GARCH models are time varying, as new information arrives. In fact, the wide range between the maximum and minimum values of the hedge ratios in Table 2 for each model reflects the fact that hedge ratios display noticeable variation over time, as shown in Figure 3.
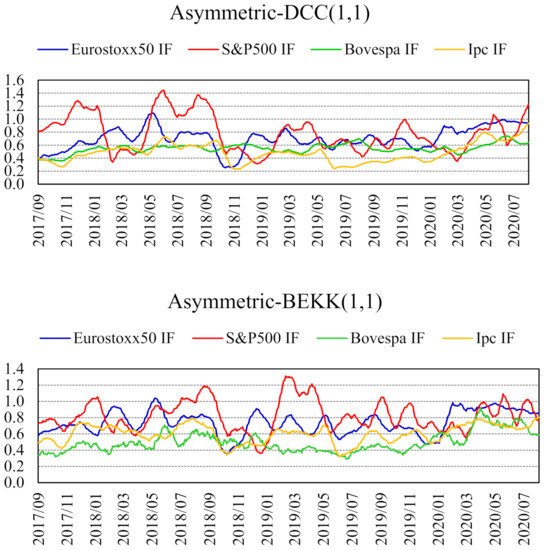
Figure 3.
Minimum variance hedge ratios for each futures contract, with sign changed. Estimated with asymmetric DCC– and BEKK–GARCH(1,1) models (783 forecasts). Monthly moving averages (28 August 2017–25 August 2020).
Linear correlations between any two MVHR obtained from asymmetric DCC–, DVEC–, and BEKK–GARCH(1,1) specifications when using EUROSTOXX 50, S&P500, and IPC futures or between their daily fluctuations are “relatively” high (see Table 3), anticipating that they might provide a similar hedge for LATIBEX. Since the MVHR follow unit root processes, only correlations between their daily fluctuations are statistically justified.
Table 3.
Minimum Variance Hedge Ratios of the different futures contracts. (a). Linear correlation coefficients between Minimum Variance Hedge Ratios estimated from different volatility models. (b). Linear correlation coefficients between Minimum Variance Hedge Ratios for different stock market futures.
In the case of the BOVESPA futures, the highest linear correlations are presented with the asymmetric CCC–, DCC–, and DVEC–GARCH(1,1) specifications. Surprisingly, for the case of Eurostoxx50 IF, the linear correlation coefficients between the MVHRs for the asymmetric CCC and other models are so small, contrary to the findings of [41] for example, though the authors examine exchange rates and employ the original CCC and DCC versions. However, this topic is little explored in the literature, as stated by [42], and, thus, more research is needed to find the plausible reasons for this result. On the other hand, Table 3 further shows that the correlations between the MVHR obtained for a given GARCH specification from different futures contracts or between their daily fluctuations are not too high, reflecting the fact that the various stock market indices may provide a different hedge for LATIBEX positions.
In what follows, we explore the properties of hedging a LATIBEX position with futures contracts on the other four indices.
3.2. Hedging Efficiency
To compare the effectiveness of the different hedge methods, we start by following [43,44], who suggest analyzing the reduction in the variance of returns achieved by the hedged position, relative to the uncovered spot position. Thus, given a class of models indexed by i, i = 1, 2,…, m we should prefer model i such that
where denotes the variance of returns for the hedged portfolio estimated with model i. Table 4 displays the results, as well as for the unhedged position (bt−1 = 0) and for the naïve hedge (bt−1 = 1), together with the percent reduction in variance relative to the unhedged position in LATIBEX, .
Table 4.
Hedging effectiveness of the different futures contracts. (a) Variance of daily returns from different portfolios. (b) Annual volatility of different portfolios.
Table 4 further presents the same information but in terms of annual volatility. We can deduce that the naïve hedge of taking the opposite position in the selected futures contract reduces volatility when using futures on the EUROSTOXX 50 and IPC but not with the S&P500 and BOVESPA. On the other hand, the hedging provided by the least squares estimates of the second order unconditional moments achieves a significant reduction in the variance of the return relative to the unhedged position for all four futures contracts, while in relation to the naive hedge, the reduction in variance is appreciable with all contracts, except for EUROSTOXX 50.
What is of greater significance is the reduction in variance from the four GARCH specifications relative to: the least squares models, the unhedged portfolio, and the naïve hedge portfolio. This happens when the portfolio is hedged with futures contracts on S&P500, BOVESPA and IPC. But with futures contracts on EUROSTOXX 50, the largest reductions in variance are achieved with the least squares model followed by naive hedging.
As expected from the high correlations among MVHR, hedge ratios from asymmetric CCC–, DCC–, DVEC– and BEKK–GARCH(1,1) models achieve similar annualized volatility reductions for three futures contracts: EUROSTOXX 50, S&P500, and IPC (see Table 4). Meanwhile, the asymmetric CCC–, DCC– and DVEC–GARCH(1,1) models perform the same for BOVESPA futures contracts.
Therefore, the best models in terms of largest variance reduction per each index futures contract to hedge the LATIBEX index may be identified. For EUROSTOXX 50 IF, the best models are the Error Correction Model (ECM) and Naive Hedging, while for the S&P500 futures, the best models are the asymmetric BEKK– and DCC–GARCH(1,1) specifications. The asymmetric CCC– and DVEC–GARCH(1,1) models outperform other models for the BOVESPA futures, and the asymmetric BEKK– and CCC–GARCH(1,1) models work well for the IPC futures. Even more importantly, the IF candidates that seem to provide the best hedge for LATIBEX positions are the BOVESPA and EUROSTOXX 50 futures contracts.
An interesting result is the reduction in variance found with the EUROSTOXX 50 futures since the LATIBEX market has its trading platform in Europe as well as the EUROSTOXX 50 futures.
3.3. Further Results
In what follows, the Certainty Equivalent (CE) concept is applied to obtain further results in our study. The CE is usually defined as the amount that investors are indifferent to for taking the risk of their investments or to receive such an amount [45]. Among the different utility functions to model the wealth (W) of an investor, let us consider an exponential utility function, given by
where γ is the coefficient of absolute risk aversion and it is positive. By considering higher order moments (i.e., τ: skewness and κ: kurtosis), the CE is approximately
where and denote the mean and standard deviation of a given portfolio return, respectively, for the hedged portfolio estimated with model i. As observed in Equation (7), the CE is lower when volatility and/or kurtosis are higher. In addition, the CE is also lower when skewness is negative. Stylized facts of equity daily returns show that the distribution of these returns is leptokurtic and negatively skewed, which can result in incorrect hedging and high losses in the underlying portfolio.
Table 5 displays the mean daily return and volatility, as well as skewness, excess kurtosis, and the Certainty Equivalent (in annual and daily terms) for each hedged portfolio as well as for the unhedged LATIBEX position with a specific level of risk aversion, e.g., γ = 4, since [46] states that the risk aversion parameter is between 2 and 4.
Table 5.
Main statistics and Certainty Equivalent for hedged portfolios.
As we have already seen, hedging reduces volatility relative to the unhedged position in all cases. Moreover, kurtosis values increase significantly in the hedged position with BOVESPA futures and to a lesser extent with the EUROSTOXX 50 futures, indicating the possibility of large positive or negative returns in these portfolios. On the contrary, with futures contracts on IPC and S&P500, the portfolio distributions are less leptokurtic. On the other hand, all of the portfolios exhibit negative asymmetry, suggesting the low possibility of large positive returns. In addition, from September 2017 to August 2020, the Certainty Equivalent is negative, despite the improvement achieved in the statistical properties of the portfolio because of the hedge. The only exception is with BOVESPA futures contracts when an asymmetric BEKK–GARCH(1,1) specification is used, obtaining a positive Certainty Equivalent.
Hedging with S&P500 futures leads to an even more negative Certainty Equivalent than the unhedged position, suggesting the inappropriateness of the S&P500 hedge according to this criterion. The estimated hedge with the asymmetric BEKK–GARCH(1,1) specification is best when using futures contracts on BOVESPA and EUROSTOXX 50, with a significant reduction in the absolute value of the Certainty Equivalent, relative to the unhedged position. The asymmetric BEKK–GARCH(1,1) specification is also best among the GARCH models for the IPC hedge, although the unit hedge ratio then produces an even better Certainty Equivalent. The most plausible reason for this result is that the IPC futures contract has a much higher value in dollars than the other futures contracts. The price fall over the sample then leads to a substantial gain in the futures position, which is especially large in the unit hedge case since the hedge ratios in all other strategies remain well below one. However, of course, this is an ex-post analysis. Even more importantly, hedging with BOVESPA futures also reduces the Certainty Equivalent very significantly with respect to the other three futures contracts, and, hence, BOVESPA futures contracts provide the best hedge according to this criterion. Once again, futures contracts for EUROSTOXX 50 and S&P500 perform significantly worse than futures contracts from the two emerging markets, leading to a more negative Certainty Equivalent.
In summary, evaluating hedging effectiveness according to both criteria variance reduction and the Certainty Equivalent leads to a consistent conclusion: for investors with positions in the LATIBEX market, it is better to implement a dynamic hedge rather than a least squares hedge, a naive hedge, or no hedge at all. The evidence on what might be the best GARCH specification is mixed, with asymmetric versions of the CCC–, DCC–, DVEC– and BEKK–GARCH(1,1) models performing best for different criteria of hedging effectiveness (see Table 6).
Table 6.
Performance of pairs (futures contract; hedge ratio), according to two hedging efficiency measures.
Nevertheless, it seems that futures contracts on BOVESPA provide the best hedge. This can be explained by the fact that most firms included in LATIBEX are from Brazil. The presence of Mexican firms is also important, but Brazilian firms have the largest weights in the composition of the LATIBEX index. As of August 2020, 22 stocks were listed in the LATIBEX All Share index, of which 15 were from Brazil (68.2%), 5 were from Mexico (22.7%), 1 from Argentina (4.5%), and 1 from Peru (4.5%). However, regarding the weighting in the index by capital, 72.7% corresponded to Brazilian companies, 26.9% to Mexican companies, 0.3% Argentine, and 0.2% Peruvian (see Table 7).
Table 7.
Stock market and LATIBEX index information. (a) Information from the Brazilian and Mexican Stock Exchanges. (b) Information from LATIBEX index.
On the other hand, the “B3—Brasil Bolsa Balcão” stock market is also more liquid. Being almost triple the size of “Bolsa Mexicana de Valores” in capitalization, it contains more than twice as many listed companies and the value of shares traded during the first half of 2020 was almost ten times greater (see Table 7).
The higher liquidity of the market and the relevant representation in the LATIBEX index might support our results.
4. Conclusions
In the absence of futures contracts on LATIBEX, an investor must consider the use of futures contracts on some other stock market index to hedge the LATIBEX portfolio. To try to solve this important issue for LATIBEX investors, we have found successful cross-hedging strategies employing futures contracts based on two developed stock markets, EUROSTOXX 50 and S&P500 indices, as well on two Emerging Latin American stock market indices, BOVESPA (Brazil) and IPC (Mexico).
To this end, we have estimated the error correction model for daily quotes on LATIBEX and futures contracts on each of the four mentioned indices under different asymmetric multivariate specifications for the conditional second order moments between the innovations in both assets. The implied dynamic minimum variance hedge ratios have been compared with the unconditional least squares ratios, as well as with the unit hedge and with the unhedged position in terms of Ederington’s effectiveness measure [7]. We have also compared the different hedging models in terms of the Certainty Equivalent of returns for the implied hedged portfolios. Our empirical exercise was designed to simulate a real time analysis, by estimating the hedge ratio each day over a three-year rolling sample. This gives us a close approximation to the hedging operation that could have been followed by an investor with a portfolio replicating LATIBEX.
Our results suggest that dynamic hedge ratios estimated from asymmetric CCC–, DCC–, DVEC– and BEKK–GARCH(1,1) models lead to improvements over the hedge provided by unconditional moments for LATIBEX portfolios. They are also clearly preferable to the unit hedge or to the unhedged position in terms of all the criteria we have employed, no matter whether the objective is to reduce volatility or the level of risk emerging from the higher order moments of the distribution of returns, summed up in the Certainty Equivalent.
The important result for practical purposes is that futures contracts on the Brazilian index BOVESPA provide the most effective cross-hedge for LATIBEX positions, which might be expected from the fact that 68% of LATIBEX is made up by Brazilian firms (73% in capital weight). The presence of Mexican firms is also important in LATIBEX but they have lower weights. Furthermore, the higher liquidity of the Brazilian market is an additional reason that facilitates the implementation of a hedge based on that market. A significant reduction in volatility is also achieved when hedging the LATIBEX in the portfolio with EUROSTOXX 50 futures. This could be especially interesting for European investors who might prefer hedging strategies using futures contracts denominated in their own currency and trading in a market they know well. Future research can be focused on alternative models for dependence, such as copulae, and alternative financial hedging instruments.
Author Contributions
Conceptualization, A.N. and P.U.; methodology, A.N. and P.U.; software, A.N. and P.U.; validation, A.N., P.U. and A.M.-V.; formal analysis, A.N., P.U. and A.M.-V.; investigation, A.N. and P.U.; writing—original draft preparation, A.N., P.U. and A.M.-V.; writing—review and editing, A.N., P.U. and A.M.-V.; visualization, A.N., P.U. and A.M.-V.; supervision, A.N., P.U. and A.M.-V.; project administration, A.N., P.U. and A.M.-V.; funding acquisition, A.M.-V. All authors have read and agreed to the published version of the manuscript.
Funding
This research was funded by FAPA-Uniandes, grant number PR.3.2016.2807.
Institutional Review Board Statement
Not applicable.
Informed Consent Statement
Not applicable.
Data Availability Statement
The data that supports the reported results can be requested to purtubia@ucm.es.
Conflicts of Interest
The authors declare no conflict of interest.
Appendix A. Multivariate Asymmetric GARCH Models for Variance–Covariance Matrices
Appendix A.1. CCC Model
The CCC model [27] starts with k univariate GARCH models for each of k indices. In our case with p = q = 1 and incorporating negative asymmetry volatility [47], we use a GJR-GARCH(1,1) model for each k index, whose expression is
where are innovations in period t, is the conditional variance of asset k, , and are the parameters. In this model the conditional correlations matrix R static, as defined
where ρij is the correlation coefficient between variables i and j. Then, the conditional variance matrix Ht is defined as: , where is the diagonal matrix
In the bivariate case, which is used in this study, k = 2 for the LATIBEX index and either one of the four index futures. Given that p = q = 1, the matrix representation of the model becomes
With this representation, it is ensured that Ht will be positive definite if certain restrictions on the parameters are met. The basic idea of this model is to keep constant the conditional correlation coefficients, which is its main disadvantage.
Appendix A.2. DCC Model
The DCC model is a generalization of the CCC model proposed by Bollerslev. The main difference is that now the correlation matrix R is time varying. The specification for the covariance matrix, Ht, can be written as: where Dt is the matrix of expression (A3) and is the matrix of time-varying conditional correlations. In our case, as with the CCC model, we start by estimating (A1) using a GJR-GARCH(1,1) model for the individual conditional variance. Once we have these estimates, we obtain the standardized residuals and calculate sample correlations of the residuals: , to be taken to the DCC specification model according to
where . and are scalar parameters, is the matrix of the standardized residuals, and is the covariance matrix of . The parameters and capture the effect of past shocks and past conditional correlations on current conditional correlations. In the DCC(1,1) model, and are positive and their sum is smaller than unity, ensuring that is positive and it presents mean reversion. This implies that after a shock, the correlation unconditional returns to long-term values. When 0, the DCC model reduces to the CCC model. The correlation estimators are of the form
for i,j = 1,2,…, n with . In our application, n = 2 for the LATIBEX index and either one of the four index futures.
Appendix A.3. Diagonal VEC Model (DVEC)
Reference [29] suggests reducing the number of parameters in the multivariate GARCH model by imposing that the matrices of coefficients of these models are diagonal. In our case, with p = q = 1 and incorporating negative asymmetry volatility [47], we have an asymmetric DVEC(1,1) model that can be expressed in terms of Hadamard (If and are m n matrices, then A⊙B is a matrix mn with elements) products as
where C, A, B, and G are matrices that accumulate only the lower triangular part of the matrices. In our case, these are 2 2 lower triangular matrices of parameters. By ⊙ we denote the Hadamard product. is a 2 2 variance–covariance matrix, is a 2 1 vector of innovations obtained from the return equations, is a 2 1 vector containing the threshold term , and k = 1,2 where we consider k = 1 for spot LATIBEX index and k = 2 as one of the four index futures. This asymmetrical DVEC(1,1) requires the estimation of 12 parameters.
Appendix A.4. BEKK Model
Reference [30] proposes a new parameterization of ensuring positivity. In our case with p = q = 1 and also incorporating negative asymmetric volatility [33], we have an asymmetric BEKK(1,1) as
where C, A, B, and G are 2 2 parameters matrices, with C being lower triangular. is the 2 × 2 variance–covariance matrix, is a 2 × 1 vector of innovations obtained from the return equations, and is a 2 × 1 vector containing the threshold term with k = 1,2 for the LATIBEX index and k = 2 for either one of the four index futures. It is not necessary to impose restrictions on the parameters of matrices C, A, B, and G, to ensure that is positive definite since the model appears expressed in terms of quadratic forms. This asymmetric BEKK(1,1) model requires the estimation of 15 parameters, and it is a model that allows dynamic dependency between the volatility series.
References
- Anderson, R.; Danthine, J.P. Cross Hedging. J. Political Econ. 1981, 89, 1182–1196. [Google Scholar] [CrossRef]
- Eaker, M.; Grant, D. Cross-hedging foreign currency risk. J. Int. Money Financ. 1987, 6, 85–105. [Google Scholar] [CrossRef]
- Chen, X.; Tongurai, J. Cross-commodity hedging for illiquid futures: Evidence from China’a base metal futures market. Glob. Financ. J. 2021, 49, 100652. [Google Scholar] [CrossRef]
- Kar, S.; Khandelwal, P. Cross-hedging aviation fuel price exposures with commodity futures: Evidence from the Indian aviation industry. IIMB Manag. Rev. 2020, 32, 389–401. [Google Scholar] [CrossRef]
- Zainudin, A.D.; Mohamad, A. Cross hedging with stock index futures. Q. Rev. Econ. Financ. 2021, 82, 128–144. [Google Scholar] [CrossRef]
- Addae-Dapaah, K.; Abdullah, K. Cross Hedging Effectiveness of Real Estate Securities Exchange Traded Funds. J. Real Estate Portf. Manag. 2020, 26, 74–100. [Google Scholar] [CrossRef]
- Ederington, L. The hedging performance of the new futures markets. J. Financ. 1979, 34, 157–170. [Google Scholar] [CrossRef]
- Myers, R. Estimating time varying optimal hedge ratios on futures markets. J. Futures Mark. 1991, 11, 39–53. [Google Scholar] [CrossRef]
- Cecchetti, S.G.; Cumby, R.E.; Figlewski, S. Estimation of the optimal futures hedge. Rev. Econ. Stat. 1988, 70, 623–630. [Google Scholar] [CrossRef]
- Oliveira, F.; Maia, S.; De Jesus, D.; Besarria, C. Which information matters to market risk spreading in Brazil? Volatility transmission modelling using MGARCH-BEKK, DCC, t-Copulas. N. Am. J. Econ. Financ. 2018, 45, 83–100. [Google Scholar] [CrossRef]
- Bhhuiyan, R.A.; Rahman, M.P.; Saiti, B.; Ghani, G.B.M. Does the Malaysian Sovereign sukuk market offer portfolio diversification opportunities for global fixed-income investors? Evidence from wavelet coherence and multivariate-GARCH analyses. N. Am. J. Econ. Financ. 2019, 47, 675–687. [Google Scholar] [CrossRef]
- Baillie, R.T.; Myers, R.G. Bivariate GARCH estimation of the optimal commodity futures hedge. J. Appl. Econom. 1991, 6, 109–124. [Google Scholar] [CrossRef]
- Sukcharoen, K.; Choi, H.; Leatham, D.J. Optimal gasoline hedging strategies using futures contracts and exchange-traded funds. Appl. Econ. 2015, 47, 3482–3498. [Google Scholar] [CrossRef]
- Candila, V.; Farace, S. On the Volatility Spillover between Agricultural Commodities and Latin American Stock Markets. Risks 2018, 6, 116. [Google Scholar] [CrossRef]
- Xu, Y.; Lien, D. Optimal futures hedging for energy commodities: An application of the gas model. J. Futures Mark. 2020, 40, 1090–1108. [Google Scholar] [CrossRef]
- Park, T.; Switzer, L. Bivariate GARCH estimation of the optimal hedge ratios for stock index futures: A note. J. Futures Mark. 1995, 15, 61–67. [Google Scholar] [CrossRef]
- Park, T.; Switzer, L. Time-varying distributions and the optimal hedge ratios for stock index futures. Appl. Financ. Econ. 1995, 5, 131–137. [Google Scholar] [CrossRef]
- Lafuente, J.A.; Novales, A. Optimal hedging under departures from the cost-of-carry valuation: Evidence from the Spanish stock index futures market. J. Bank. Financ. 2003, 27, 1053–1078. [Google Scholar] [CrossRef][Green Version]
- Chuang, C.-C.; Wang, Y.-H.; Yeh, T.-J.; Chuang, S.-L. Hedging effectiveness of the hedged portfolio: The expected utility maximization subject to the value-at risk approach. Appl. Econ. 2015, 47, 2040–2052. [Google Scholar] [CrossRef]
- Habiba, U.E.; Zhang, W. The dynamics of volatility spillovers between oil prices and stock market returns at the sector level and hedging strategies: Evidence from Pakistan. Environ. Sci. Pollut. Res. Int. 2020, 27, 30706–30715. [Google Scholar] [CrossRef]
- Jin, J.; Han, L.; Wu, L.; Zeng, H. The hedging effect of green bonds on carbon market risk. Int. Rev. Financ. Anal. 2020, 71, 101509. [Google Scholar] [CrossRef]
- Kroner, K.; Sultan, J. Exchange rate volatility and time varying hedge ratios. In Pacific-Basin Capital Markets Research; Rhee, S.G., Chang, R.P., Eds.; Elsevier Science Publishers: Amsterdam, The Netherlands, 1991; Volume II. [Google Scholar]
- Kroner, K.; Sultan, J. Time-varying distributions and dynamic hedging with foreign currency futures. J. Financ. Quant. Anal. 1993, 28, 535–551. [Google Scholar] [CrossRef]
- Tong, W. An examination of dynamic hedging. J. Int. Money Financ. 1996, 15, 19–35. [Google Scholar] [CrossRef]
- Brooks, C.; Chong, J. The cross-currency hedging performance of implied versus statistical forecasting models. J. Futures Mark. 2001, 21, 1043–1069. [Google Scholar] [CrossRef]
- Mensi, W.; Hammoudeh, S.; Rehman, M.U.; Al-Maadid, A.A.S.; Kang, S.H. Dynamic risk spillovers and portfolio risk management between precious metals and global foreign exchange markets. N. Am. J. Econ. Financ. 2020, 51, 101086. [Google Scholar] [CrossRef]
- Bollerslev, T. Modelling the coherence in short-run nominal exchange rates: A multivariate generalized ARCH model. Rev. Econ. Stat. 1990, 72, 498–505. [Google Scholar] [CrossRef]
- Engle, R.F. Dynamic conditional correlations: A simple class of multivariate GARCH. J. Bus. Econ. Stat. 2002, 20, 339–350. [Google Scholar] [CrossRef]
- Bollerslev, T.; Engle, R.F.; Wooldridge, J.M. A capital asset pricing model with time-varying covariances. J. Political Econ. 1988, 96, 116–131. [Google Scholar] [CrossRef]
- Engle, R.F.; Kroner, K.F. Multivariate Simultaneous Generalized ARCH. Econom. Theory 1995, 11, 122–150. [Google Scholar] [CrossRef]
- Engle, R.F.; Granger, C.W.J. Co-Integration and Error Correction: Representation, Estimation, and Testing. Econometrica 1987, 55, 251–276. [Google Scholar] [CrossRef]
- Lien, D. The effect of cointegration relationship on futures hedging: A note. J. Futures Mark. 1996, 16, 773–780. [Google Scholar] [CrossRef]
- Susmel, R.; Engle, R.F. Hourly volatility spillovers between international equity markets. J. Int. Money Financ. 1994, 13, 3–25. [Google Scholar] [CrossRef]
- Lai, Y.S.; Sheu, H.J. On the importance of asymmetries for dynamic hedging during the subprime crisis. Appl. Financ. Econ. 2011, 21, 801–813. [Google Scholar] [CrossRef]
- Sun, H.; Yu, B. Volatility asymmetry in functional threshold garch model. J. Time Ser. Anal. 2020, 41, 95–109. [Google Scholar] [CrossRef]
- Howard, C.T.; D’Antonio, L.J. Multiperiod hedging using futures: A risk minimization approach in the presence of autocorrelation. J. Futures Mark. 1991, 11, 697–710. [Google Scholar] [CrossRef]
- Lien, D.; Luo, X. Estimating multiperiod hedge ratios in cointegrated markets. J. Futures Mark. 1993, 13, 909–920. [Google Scholar] [CrossRef]
- Lien, D.; Luo, X. Multiperiod hedging in the presence of conditional heteroskedasticity. J. Futures Mark. 1994, 14, 927–955. [Google Scholar] [CrossRef]
- Levy, H.; Markowitz, H.M. Approximating expected utility by a function of mean and variance. Am. Econ. Rev. 1979, 3, 308–317. [Google Scholar]
- Anderson, R.; Danthine, J.P. Hedging and joint production: Theory and illustrations. J. Financ. 1980, 5, 487–501. [Google Scholar] [CrossRef]
- Chang, C.L.; González-Serrano, L.G.; Jiménez-Martín, J.A. Currency Hedging Strategies Using Dynamic Multivariate GARCH. Math. Comput. Simul. 2013, 94, 164–182. [Google Scholar] [CrossRef]
- Lai, Y.S. Evaluating the hedging performance of multivariate GARCH models. Asia Pac. Manag. Rev. 2019, 24, 86–95. [Google Scholar] [CrossRef]
- Johnson, L. The theory of hedging and speculation in commodity futures. Rev. Econ. Stud. 1960, 27, 139–151. [Google Scholar] [CrossRef]
- Stein, J.L. The simultaneous determination of spot and futures prices. Am. Econ. Rev. 1961, 5, 1012–1025. [Google Scholar]
- Alexander, C. Market Risk Analysis I: Quantitative Methods in Finance, 1st ed.; Wiley: Chichester, UK, 2008. [Google Scholar]
- Fabozzi, F.J.; Kolm, P.; Pachamanova, D.A.; Focardi, S.M. Robust Portfolio Optimization and Management, 1st ed.; Wiley: Hoboken, NJ, USA, 2007. [Google Scholar]
- Glosten, L.; Jagannathan, R.; Runkle, D. On the relation between the expected value and the volatility of the nominal excess return on stocks. J. Financ. 1993, 48, 1779–1801. [Google Scholar] [CrossRef]


Publisher’s Note: MDPI stays neutral with regard to jurisdictional claims in published maps and institutional affiliations. |
© 2021 by the authors. Licensee MDPI, Basel, Switzerland. This article is an open access article distributed under the terms and conditions of the Creative Commons Attribution (CC BY) license (https://creativecommons.org/licenses/by/4.0/).