Abstract
Rock mass is frequently subjected to rapid cooling in geothermal reservoir during water injection and reinjection. In this paper, to understand the effects of cooling treatments on heated granite, heat conduction tests, magnetic resonance imaging tests and numerical investigations were carried out to evaluate variations of thermal damage. The test results reveal that the heat flux and the heat transfer coefficient increases to a maximum within a few seconds and then gradually decreases. The maximum heat transfer coefficient of the samples treated with the initial temperature of 500, 400, 300, 200 and 100 °C is 2.3, 2.15, 1.9, 1.22 and 1.86 W·m−2K−1, respectively. The edge area with drastic temperature changes is accompanied by the densely distributed microcracks; in contrast, the internal cracks of the specimen with gentle temperature are relatively sparse. The thermal damage contributed by the heating cracks occurs at a continuous decrease, and the thermal damage contributed by cooling occurs at a continuous increase, with the increasing heating temperature. The damage caused by heating is the result of the uneven thermal expansion of the local particles, the propagation of cooling cracks is strongly affected by heating cracks, and stress concentration induced by thermal shock promotes the coalescence of the pre-existing heating cracks.
1. Introduction
Geothermal energy is wildly regarded as one of the most promising renewable sources due to its wide distribution and environmentally friendly characteristics [1]. Heat extraction through the heat exchange between the injected working fluid (generally water) and the high-temperature rock masses in geothermal reservoirs is the most effective way to exploit geothermal resources [2]. Inevitable rock damage occurs when the geothermal reservoir is subjected to the intermittent cold water injection [3], which can be used to improve the heat exchange efficiency of the reservoir and may also induce undesirable water loss [4,5]. Therefore, a better understanding of the mechanism of crack generation and propagation during water cooling is the prerequisite to improve the reservoir performance.
For the effects of water cooling on high-temperature rocks, numerous experimental studies have been conducted to investigate the variations of the macroscopic physical and mechanical properties, which were comprehensively summarized in our previous research [6,7]. Generally, the significant degeneration in the physical properties (e.g., density [3,8,9], P-wave velocity [10,11,12], permeability [13,14,15], thermophysical properties [16]) and the mechanical properties (e.g., compressive strength [17,18], tensile strength [19], fracture toughness [20,21]) can be found in the rocks after heating and water cooling.
Factors affecting the thermal damage induced by water cooling in rock materials have attracted increasing attention, i.e., heating temperature, cooling rate, particle size. Regarding the effects of heating temperature, Kim et al. [22] found that the rapid cooling from 300 °C can lead to a significant decrease in the fracture toughness and the tensile strength. Yin et al. [23] found that the threshold temperature of granite properties is about 400 °C. Sun et al. [24] determined the damage threshold temperatures of sandstone to be 300, 500 and 900 °C. Meanwhile, the higher cooling rate can result in a more significant damage in rock materials. This phenomenon has been widely verified. Wu et al. [25] studied the tensile strength of the rocks cooled at various cooling rates, and the edge wedges and the central cracking of the samples are significantly related to the cooling rate. Rathnaweera et al. [26] found that the weakening and softening of the sandstone after heating and water cooling is determined by the mineral structure. The transformation of the initial hexagonal kaolinite mineral can strengthen the sandstone cement, while the dehydroxylization of kaolinite can weaken it. In addition, the effects of water cooling on the rocks with different particle sizes are quite different. Zhao et al. [27] evaluated the tensile strength of rock with increasing grain size; as the grain size increases, the thermal cracks decrease, but the cracks become longer, which leads to a decrease in tensile strength. Wu et al. [28] found that the physical and mechanical properties of granites with coarser particles are less sensitive to the rapid cooling. In addition, many numerical investigations have been conducted to simulate the damage of the rock material after the heating and cooling. Yin et al. [29] studied the thermal damage of granite by the Discrete Element Method (DEM). Wu et al. [30] presented a numerical method for simulating fracture propagation of rock materials by the Finite Element/Discrete Element Method (FEM/DEM). Zhao et al. [19] and Tian et al. [31] simulated the inhomogeneous microcracks in thermal-treated granite by DEM.
Thermal damage in rocks induced by rapid cooling has been studied microscopically. Based on the scanning electron microscope observations, Yin et al. [6] believed that the loose mica flakes, the coalescence behaviors of the inter- and transgrain cracks induced by thermal shock, contribute to the deterioration of mechanical properties. Fan et al. [32] investigated the spatial gradient distributions of thermal damage caused by water cooling by 3D computed tomography techniques and found that the thermal damage near the sample surface was more significant than that inside the sample. Avanthi and Ranjith [33] quantitatively studied the pore structure of the rock after heating and cooling and found that the thermal deterioration in the rapid cooled sample was more significant than slow cooled sample, which can be attributed to the stress accumulation in the rock matrix. In recent years, the applications of the nondestructive flaw detection technology based on Nuclear Magnetic Resonance (NMR) and Magnetic Resonance Imaging (MRI) in rock materials has gradually attracted the attention of researchers [34]. However, it is difficult to directly monitor the cracking of rock material induced by thermal shock; therefore, the understanding of the variation of thermal damage in rock during heating and cooling is still limited.
In order to understand the variations of thermal damage of high-temperature granite subjected to water cooling, we experimentally and numerically investigated the heat conduction and thermal cracking of granite during cooling. The heat exchange between the high-temperature granite and the water was analyzed by an inverse heat conduction model, and evolutions of the surface heat transfer coefficient of the heated granite were obtained. The thermal damage of the water-cooled granite was detected by the NMR and MRI technologies; meanwhile, a DEM-based numerical model was adopted to simulate the time and spatial gradient distributions of microcracks in granite during cooling. The experimental and numerical results can contribute to the further understanding of the thermal damage of rocks subjected to thermal shock.
2. Materials and Methods
2.1. Sample Preparation
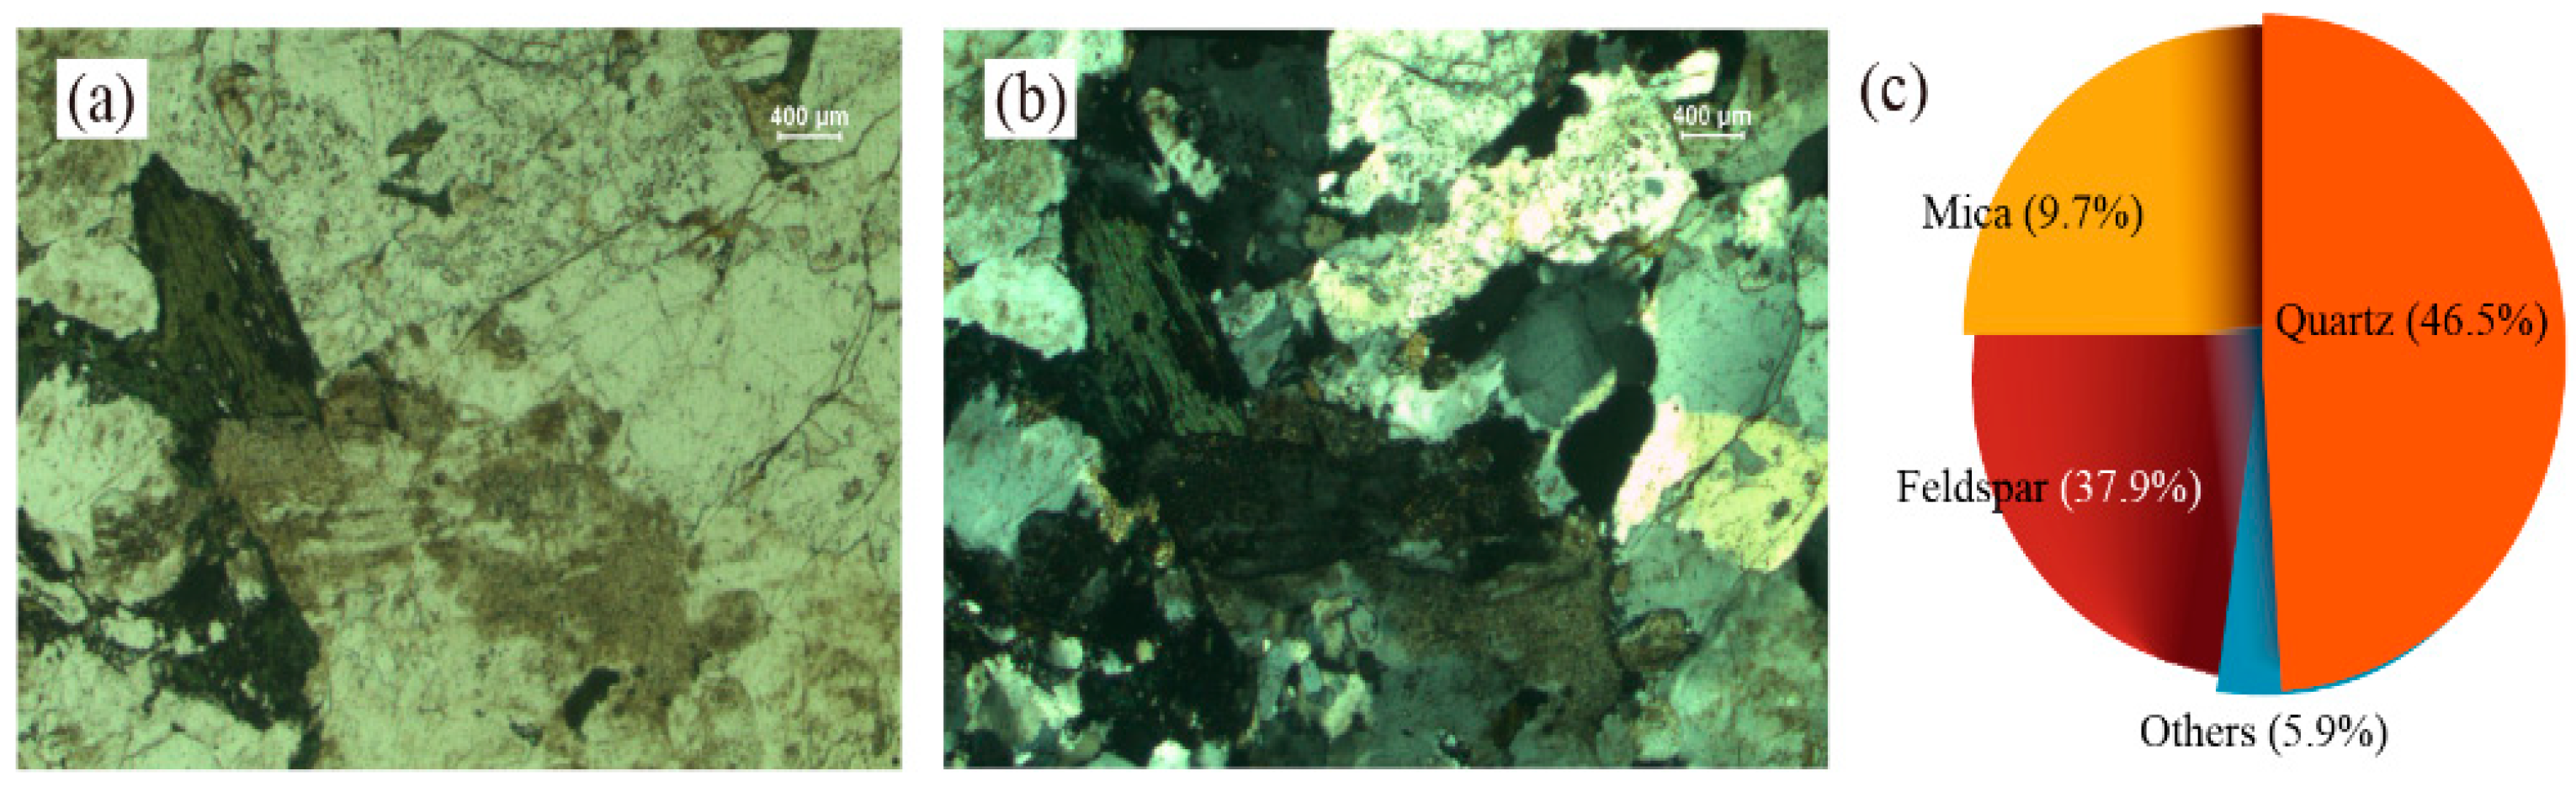
In order to weaken the influence of rock heterogeneity on thermal damage, the rock sample used in this study is granite with a uniform and dense matrix, which comes from Rucheng County, Hunan Province, as shown in Figure 1. The granite sample is mainly composed of feldspar, mica and quartz [6,35]. The collected granite blocks were cut into disc-shaped samples with a diameter of 50mm and a height of 30 mm; then, the prepared samples were polished in line with recommendations by the International Society for Rock Mechanics and Rock Engineering [36]. Subsequently, five specimens were selected to measure the transient temperature field of the high-temperature granite during cooling. These specimens were drilled with cylindrical holes of different depths by a twist drill with a diameter of 3mm, and the diameter of the hole was not larger than 3.5 mm. The schematic diagram of the holes is shown in Figure 2. In order to avoid unnecessary vibration damage in the sample, the rotation speed and feed rate of the bit were set as 1000 rpm and 0.1 mm/s.

Figure 1.
Micrographs of selected granite material: (a) single-polarized micrograph, (b) cross-polarized micrograph, (c) minerals composition.
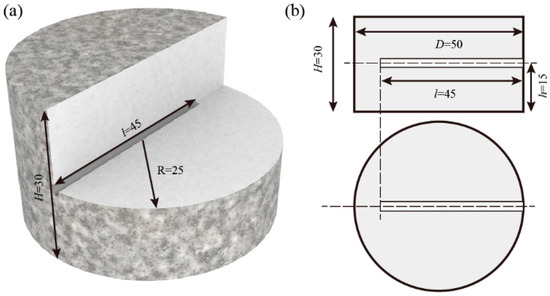
Figure 2.
Schematic diagram of disc-shaped sample with holes. (a) Section view (b) Side view and top view.
2.2. Experimental Procedure and Equipment
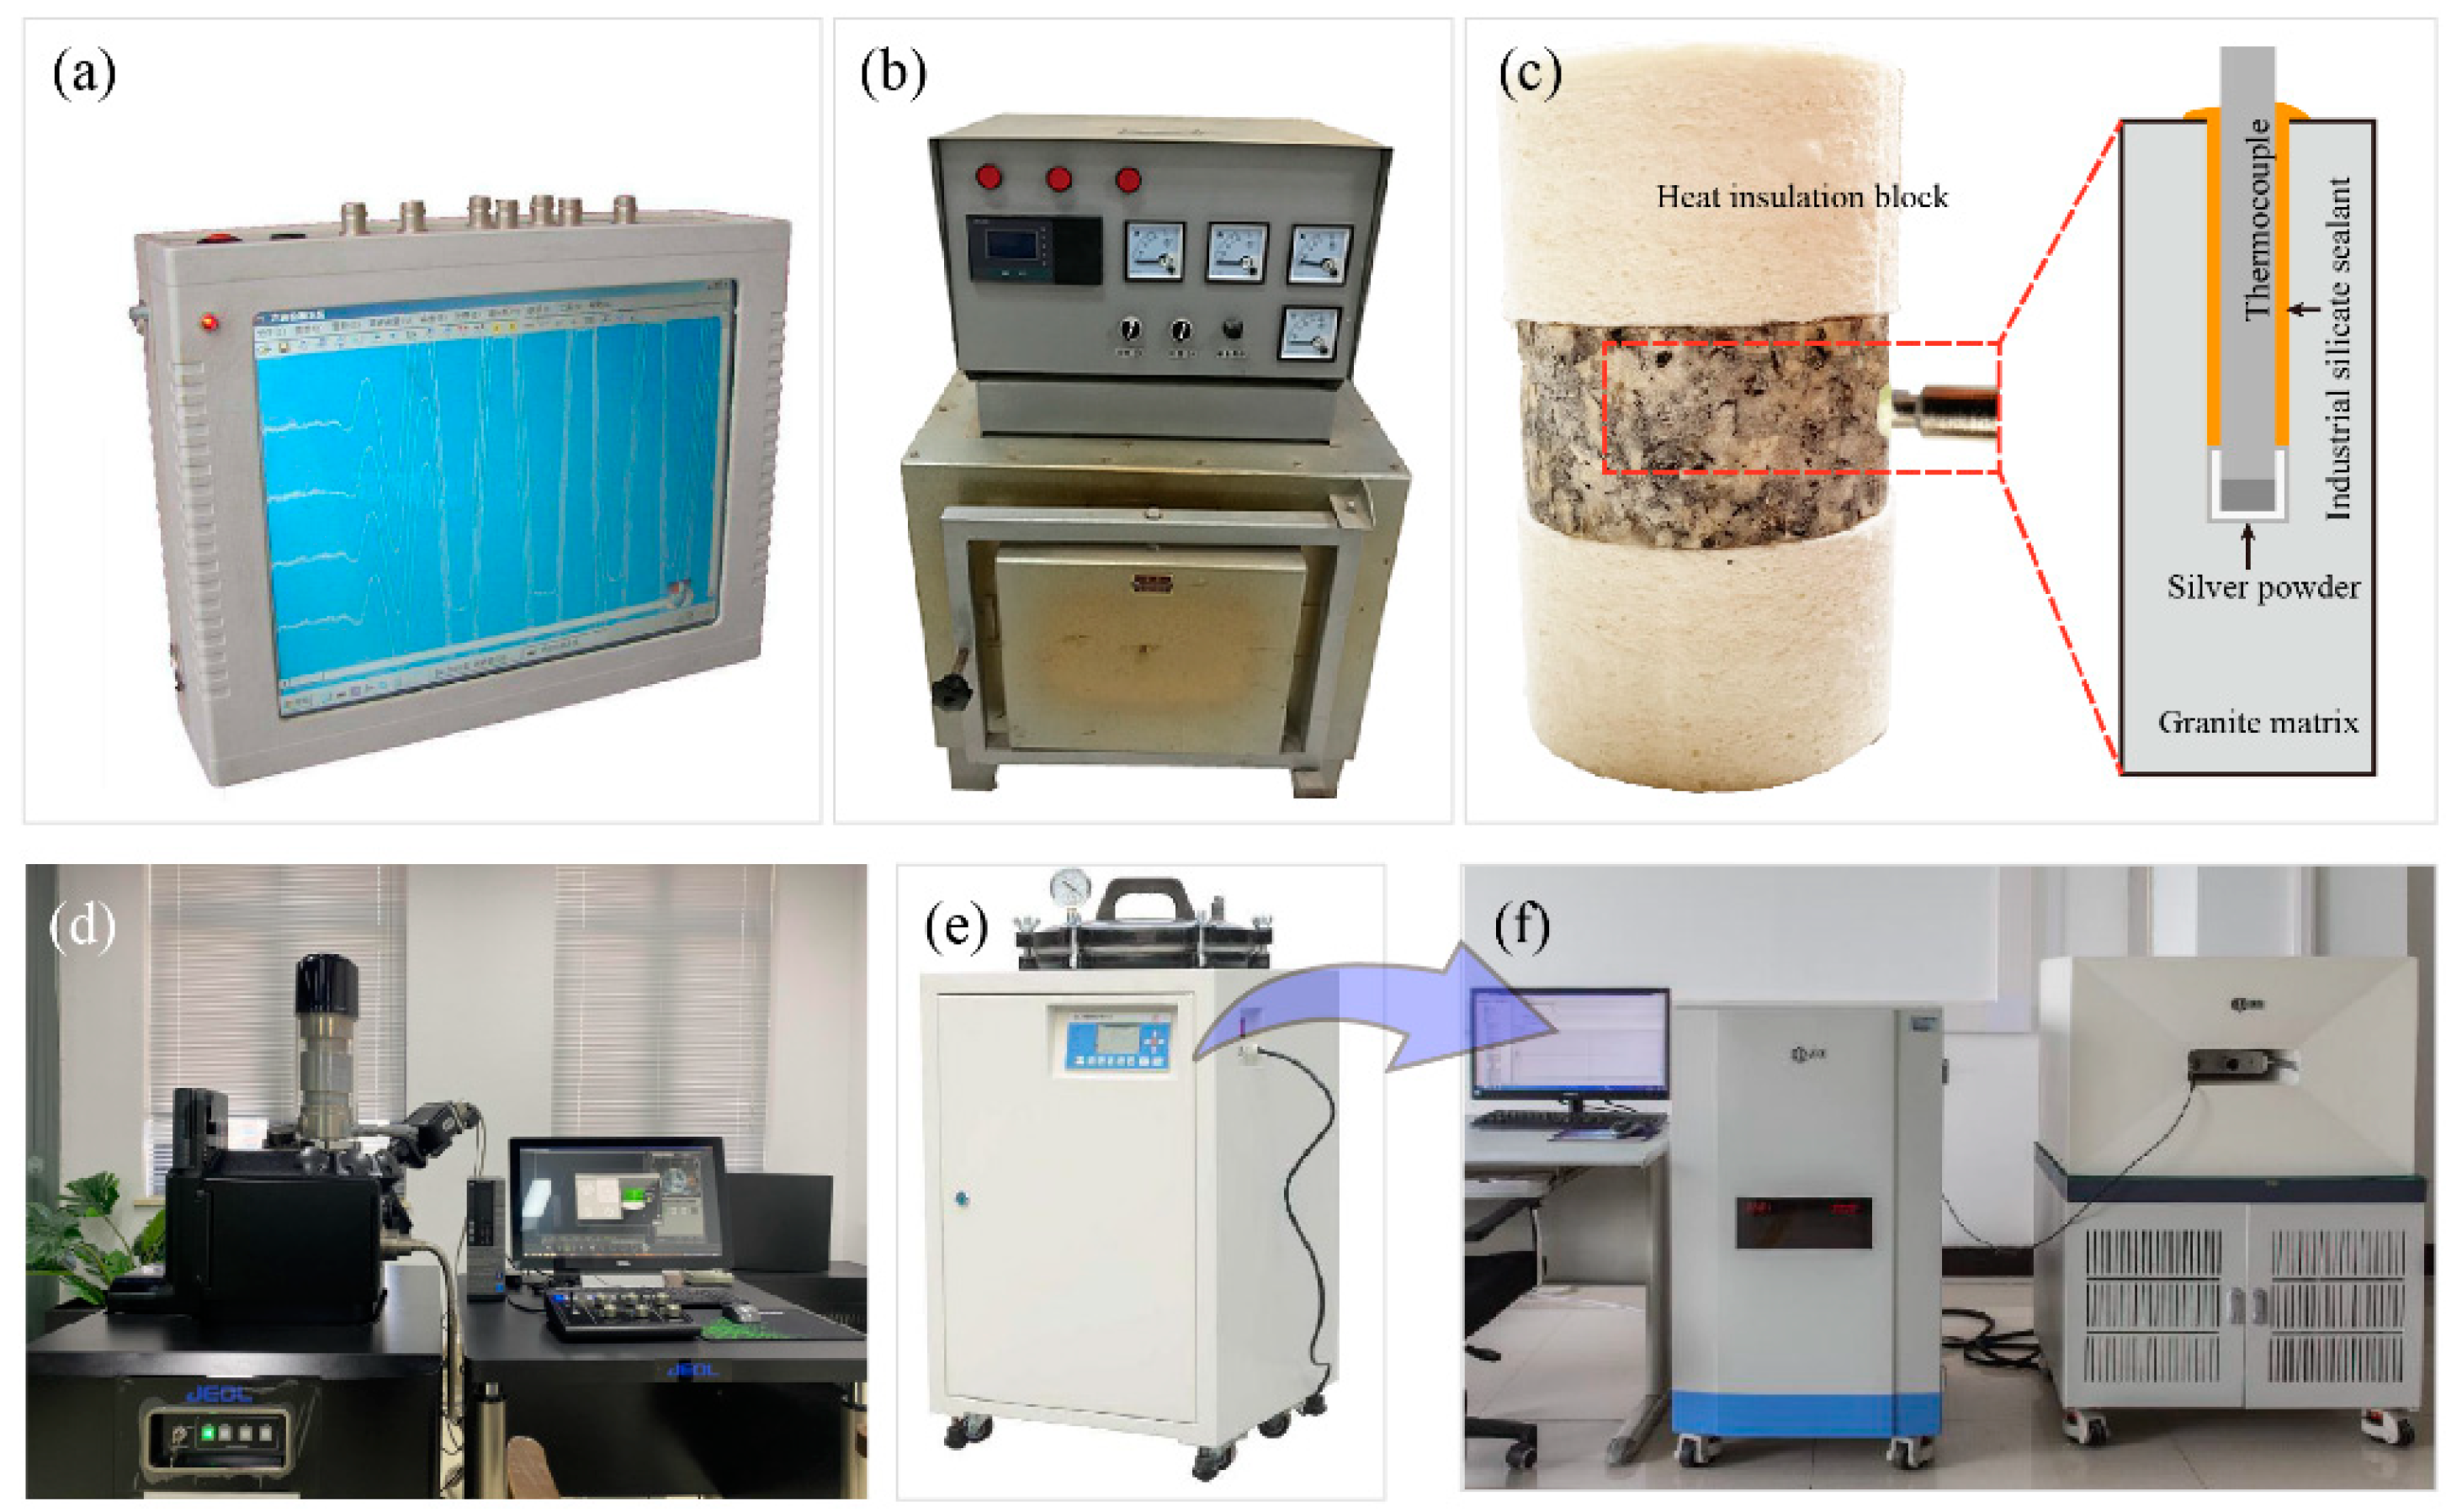
The prepared samples were further screened through the ultrasonic wave speed tests by an ultrasonic parameter detector (HS-YS4A, Xiangtan, China), as shown in Figure 3a. Subsequently, the thermocouple-boned specimens were heated in a muffle furnace (JZ-1000, Changsha, China) at a heating rate of 3 °C/min, as shown in Figure 3b. In order to simplify the problem of heat conduction, before cooling, the two ends of the specimen were fixed with heat insulation blocks to limit the heat conduction to only along the radial direction of the specimen, that is, the one-dimensional heat conduction condition. The heat insulation blocks (DeQing fiber Co., Huzhou, China) are made of aluminum silicate ceramic fiber with extremely low thermal conductivity, as shown in Figure 3c. It is noteworthy that the diameter of the thermocouple (K-type, Dittmer CO., Linsengericht, Germany) is 3 mm, which is slightly smaller than the size of the hole. Therefore, we first injected a small amount of silver powder (800 mesh, Eckart Co., Bremen, Germany) into the bottom of the hole, then inserted the thermocouple probe and finally sealed the gap between the thermocouple and the hole with industrial silicate sealant (SL8312, Shilin Polymer Co., Zhuzhou, China). The silver powder was used for improving the measurement accuracy of the thermocouple, and the industrial silicate sealant was used for fixing thermocouples and insulating water.
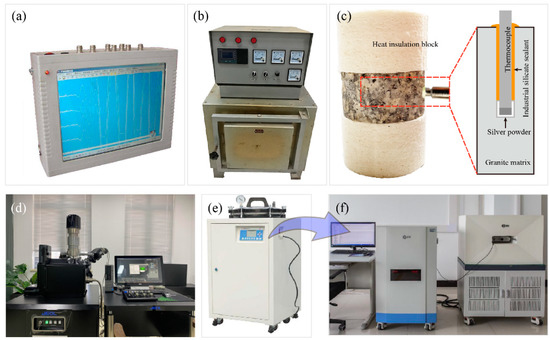
Figure 3.
Schematic diagram of experimental procedure and laboratory equipment: (a) ultrasonic parameter detector, (b) muffle furnace, (c) the specimen fixed with heat insulation blocks, (d) scanning electron microscope, (e) vacuum saturated machine, (f) nuclear magnetic resonance testing machine.
The target temperature of the samples were 100 °C, 200 °C, 300 °C, 400 °C and 500 °C, and the samples were kept at the target temperature for at least 3 h. In order to investigate the effect of the cooling method, the heated granite specimens with 500 °C were cooled in the cold water with 25 °C and the water bath of 95 °C. During cooling, the temperature of the thermocouple was recorded by a paperless recorder (MIK-R200D, MEACON Co., Hangzhou, China). For comparison, some samples were slowly cooled to room temperature in the furnace. For the characterization of thermal damage, we observed the microscopic morphology and measured the thermal damage distribution of the treated granite. The former was obtained by a scanning electron microscope (JSM-IT300, JEOL CO., Tokyo, Japan), as shown in Figure 3d. The latter was obtained by the MRI imaging from a nuclear magnetic resonance testing machine (MesoMR23-060H-I, NIUMAG Co. China), as shown in Figure 3f. Meanwhile, a vacuum saturated machine (NJ-BSJ, Shanghai, China) with a negative pressure of 0.1 MPa was used to saturate the sample, as shown in Figure 3e. The detailed parameters of the nuclear magnetic resonance testing machine are listed in Table 1.

Table 1.
NMR operating parameters.
3. Characterization and Simulation of Heat Conduction Behavior
3.1. Heat Conduction Characteristics Based on Inverse Heat Conduction Method
It can be easily inferred that, as the heat is lost from the high-temperature sample, the temperature drop in the sample will be accompanied by the weakening of the heat conduction intensity; in other words, the cooling of the heated rock is an unsteady heat transfer process. Due to factors such as bubble boiling, convective heat transfer and water flow disturbance on the sample surface, it is difficult to directly measure the heat transfer parameters (i.e., heat flux, heat transfer coefficient) on the sample surface during the cooling process. Usually, it is an effective method to obtain the transient thermal response of the sample by measuring the temperature inside the sample and indirectly obtaining the heat flux of the sample surface, which is the inverse heat conduction method [37].
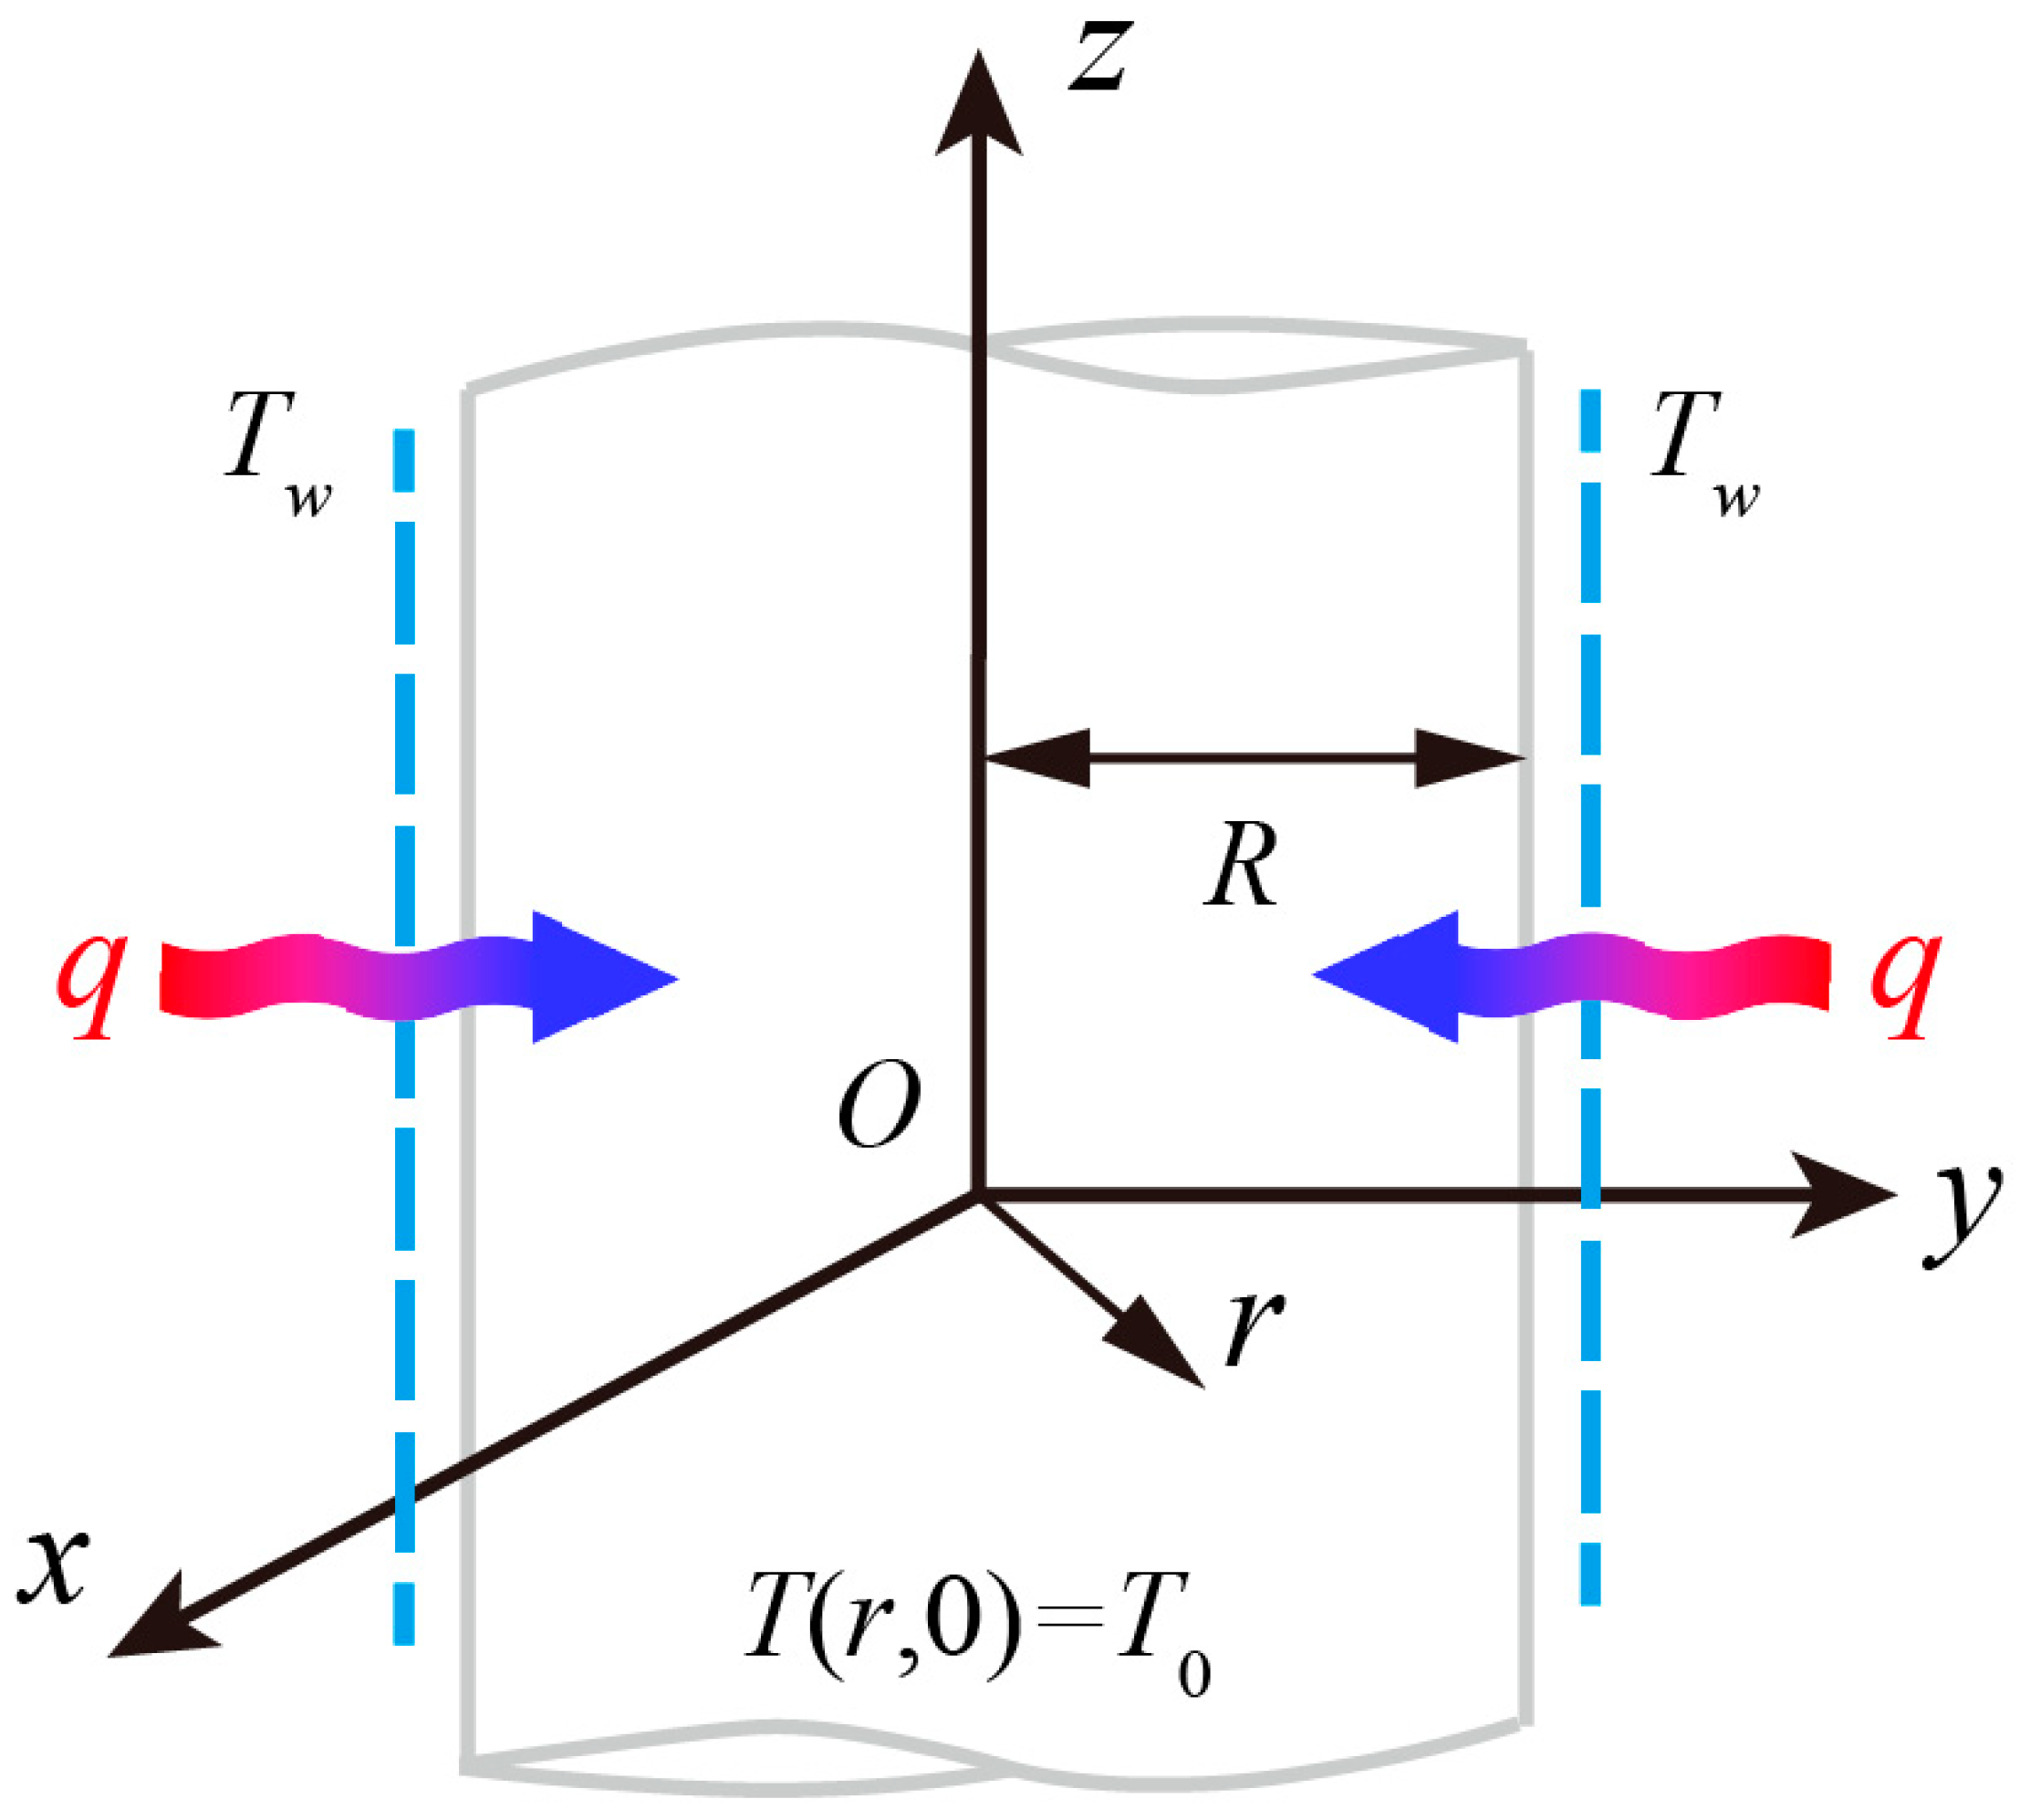
As shown in Figure 4, under the condition of one-dimensional heat conduction, the temperature field T(r, t) in the interior of the cylinder sample can be described as follows:
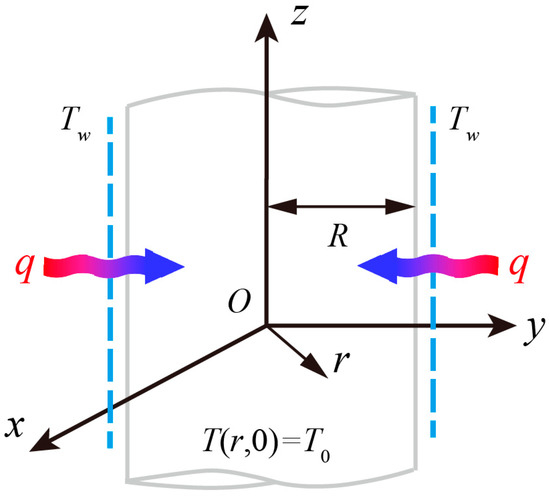
Figure 4.
Schematic diagram of one-dimensional heat transfer.
For a high-temperature sample with a temperature of T0 subjected to a water bath with a temperature of Tw, the boundary condition can be expressed as follows:
where q(t) is the heat flux at the surface of the sample. For the measured temperature of the thermocouple,
For the dimensionless variables x′ = x/R, t′ = kt/ρcL2 and T′ = (T − T0)/(Tw − T0) in the dimensionless forms of the above equations, Duhamel et al. [37] proposed the numerical solution of the heat flux:
where i ranges from k to k + r − 1, and r is a customized parameter that affects the calculation interval; αi and βi,j are parameters determined by the correlation between the future heat flux and the current heat flux. Chantasiriwan [38] proposed an optimized iterative calculation method:
where Zi is defined as
It is worth noting that the accuracy is strongly affected by the value of r and the function of αi and βi,j in Equation (6). In detail, firstly, assume the initial heat flux q0 and calculate the temperature field in the sample; then, iteratively calculate qi until the difference between the calculated temperature of the measurement point and the actual measured value is less than the preset error; subsequently, determine the next time period qi+1 by the Newton iteration method and repeat the above two steps. For simplicity, the density, specific heat and the thermal conductivity of the granite sample are taken as constant values, which are 2620 kg/m3, 1015 J/(kg·°C) and 3.5 W/(m·°C), respectively. After the heat flux q(t) on the sample surface is determined, and the surface temperature Tsur can be calculated by Equations (1)–(4). Finally, the heat transfer coefficient h(t) can be calculated by the Newton’s law of cooling:
3.2. Methodology for Numerical Analysis of Thermal Damage
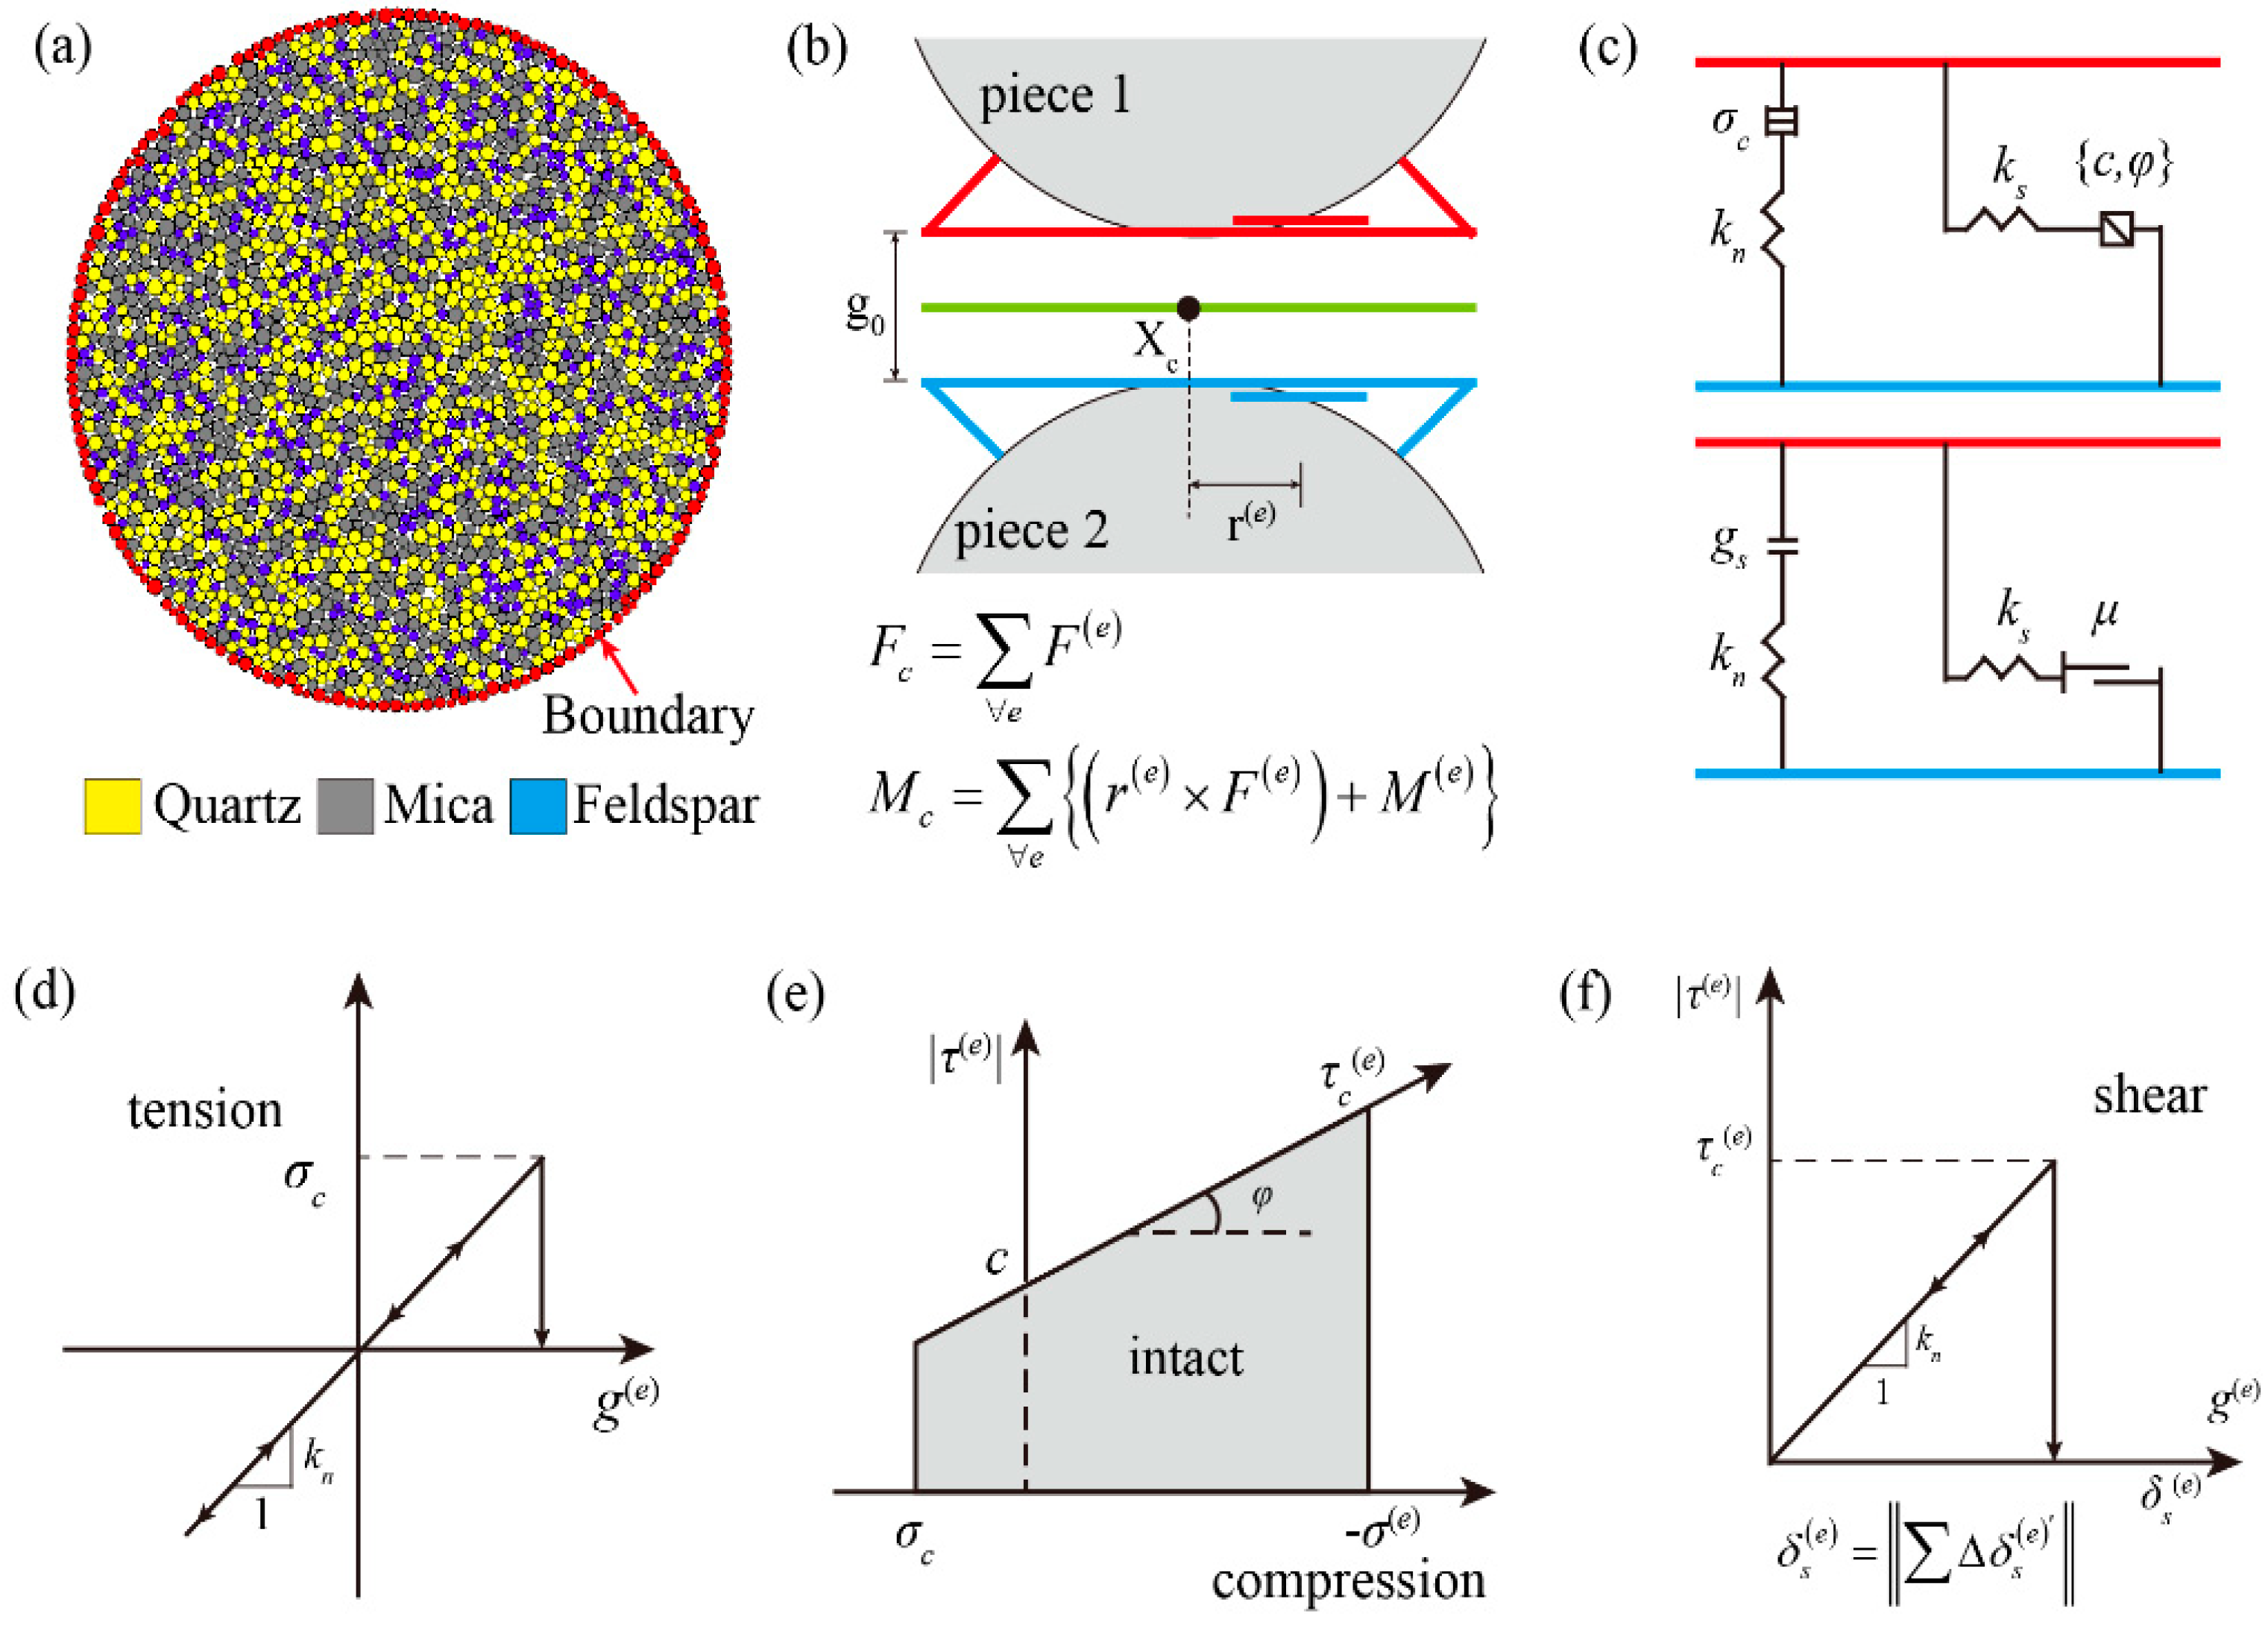
In this study, we adopted the Discrete Element Method (DEM) due to the advantages in simulating damage of rock-like materials. The numerical sample used for thermal damage simulation is shown in Figure 5a. Referring to the microscopic image shown in Figure 1, three kinds of particles with different colors and sizes were used to simulate the minerals in granite. The volume fractions of these minerals are consistent with the XRD results shown in Figure 1c. A description model between particles is necessary to simulate the mechanical behavior of rock materials. The flat-joint contact model was used to simulate linear elastic deformation and particle contact failure affected by tensile and shear stress. As shown in Figure 5b, the flat-joint contact model defines a pair of conceptual surfaces between two particles in contact. For a flat-joint contact element, the conceptual surfaces rotate around the center of the contact plane, and the constraints between particles are described as bonded or unbonded [29]. The failure envelope of the flat-joint contact model is shown in Figure 5c–f. At the same time, the contacts among particles are affected by the temperature field. In detail, a linear thermal expansion model is used to describe the thermal expansion of particles:
where ri is the particle radius, ΔT is the temperature difference between adjacent particles and α is the linear thermal expansion coefficient. In addition, the bonded and unbonded state of the contacts also characterizes the opening and closing of the heat transfer channel between particles.
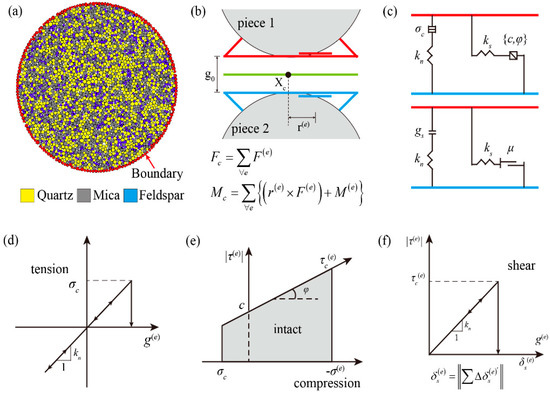
Figure 5.
Schematic diagram of DEM: (a) numerical model, (b) contact between two adjacent particles, (c) schematic diagram of the contact, (d) tensile failure criterion of the contact, (e) compression failure criterion of the contact, (f) shear failure criterion of the contact. Note: Fc and Mc are contact force and moment; g represents the gap between two adjacent particles.
It is worth noting that, due to the lack of an explicit representation of the boundary in the particle discrete element method, the heat flux of the sample boundary cannot be defined directly. The boundary condition for the numerical model is the same as Equations (2)–(4). An extra group of particles located in the outermost layer of the sample are used as the thermal boundary, as shown in Figure 5a, and the heat flux of the thermal boundary obtained by the laboratory tests is replaced by the power input to the boundary particles in the numerical model. The applied power of the boundary particles can be calculated by the following equation:
where n, Δt, Pi,t and S represent the total number of the boundary particles, the time step, the power of the boundary particle at time t and the area of the surface, respectively. More importantly, the applied heat flux q(t) is the same as the measured value in heat conduction tests.
Generally, the parameters of the contact model were calibrated by a series of mechanical experiments, as introduced in our previous study [29]. The microparameters of the granite sample used in this flat-joint contact model are listed in Table 2. The specific heat and the thermal conductivity of the particles are taken as constant values, which are 1015 J/(kg·°C) and 3.5 W/(m·°C), respectively.
Table 2.
Microparameters of numerical model.
4. Results
4.1. Temperature Field of High-Temperature Granite during Cooling
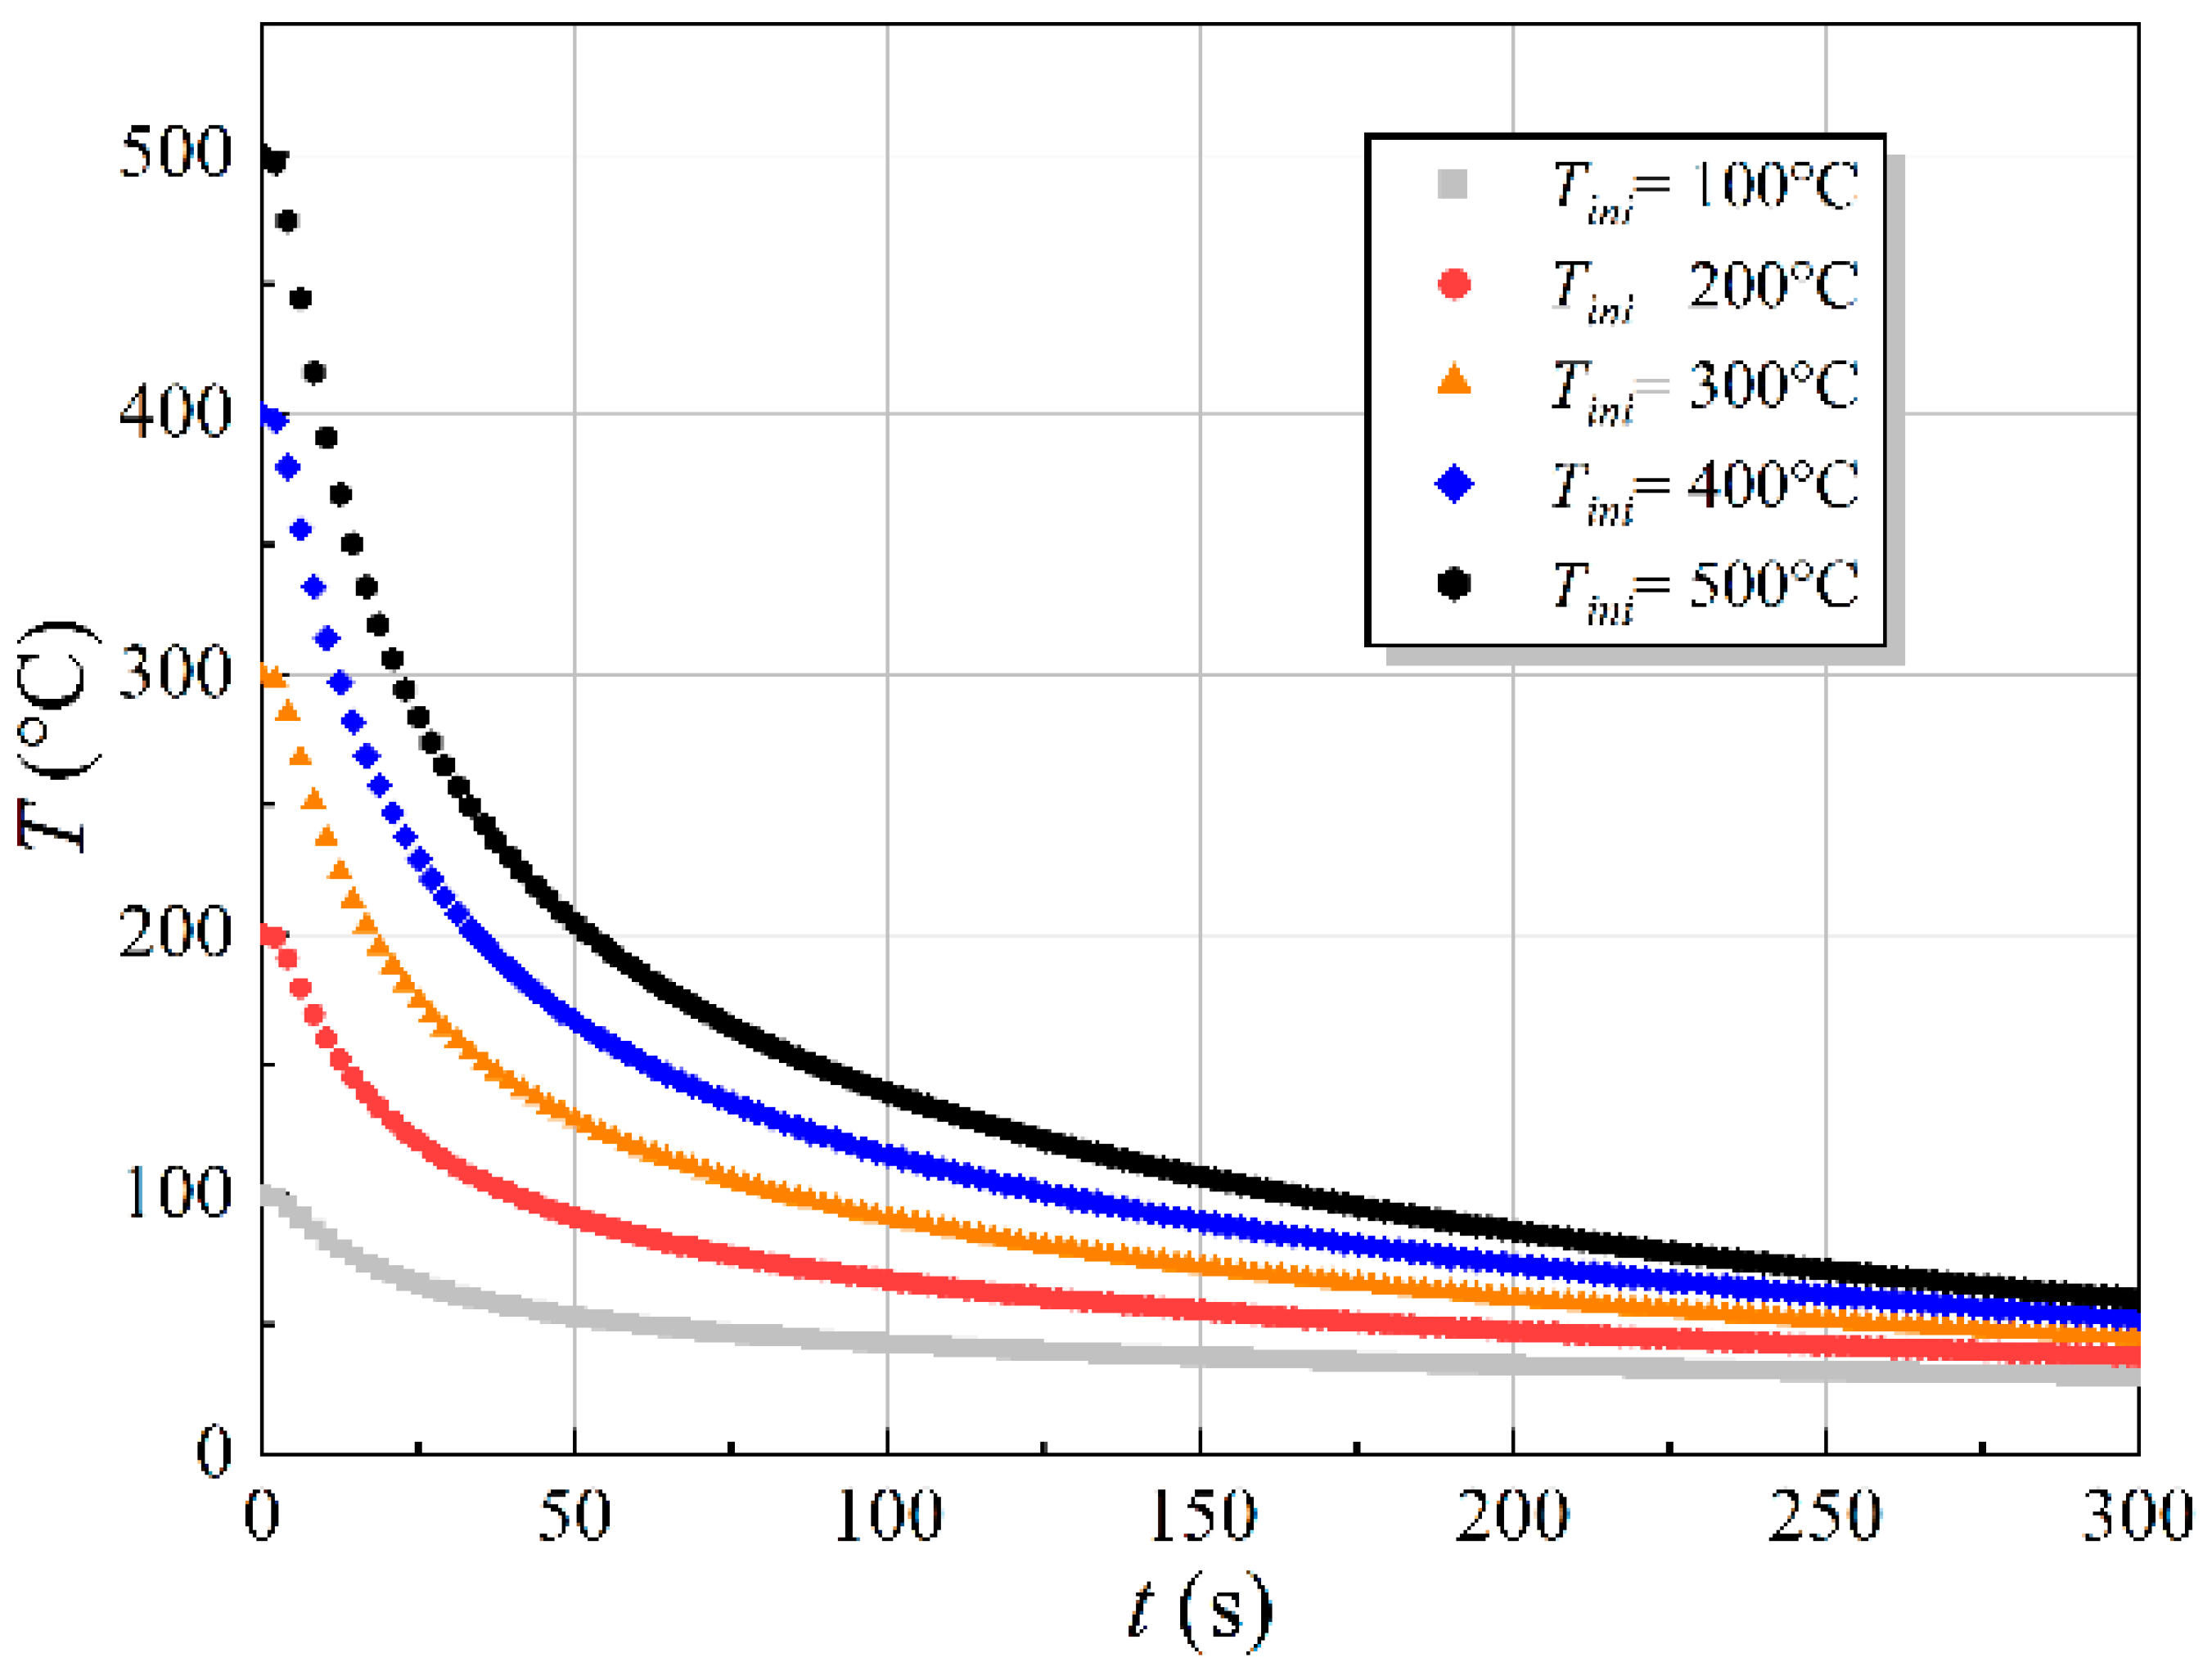
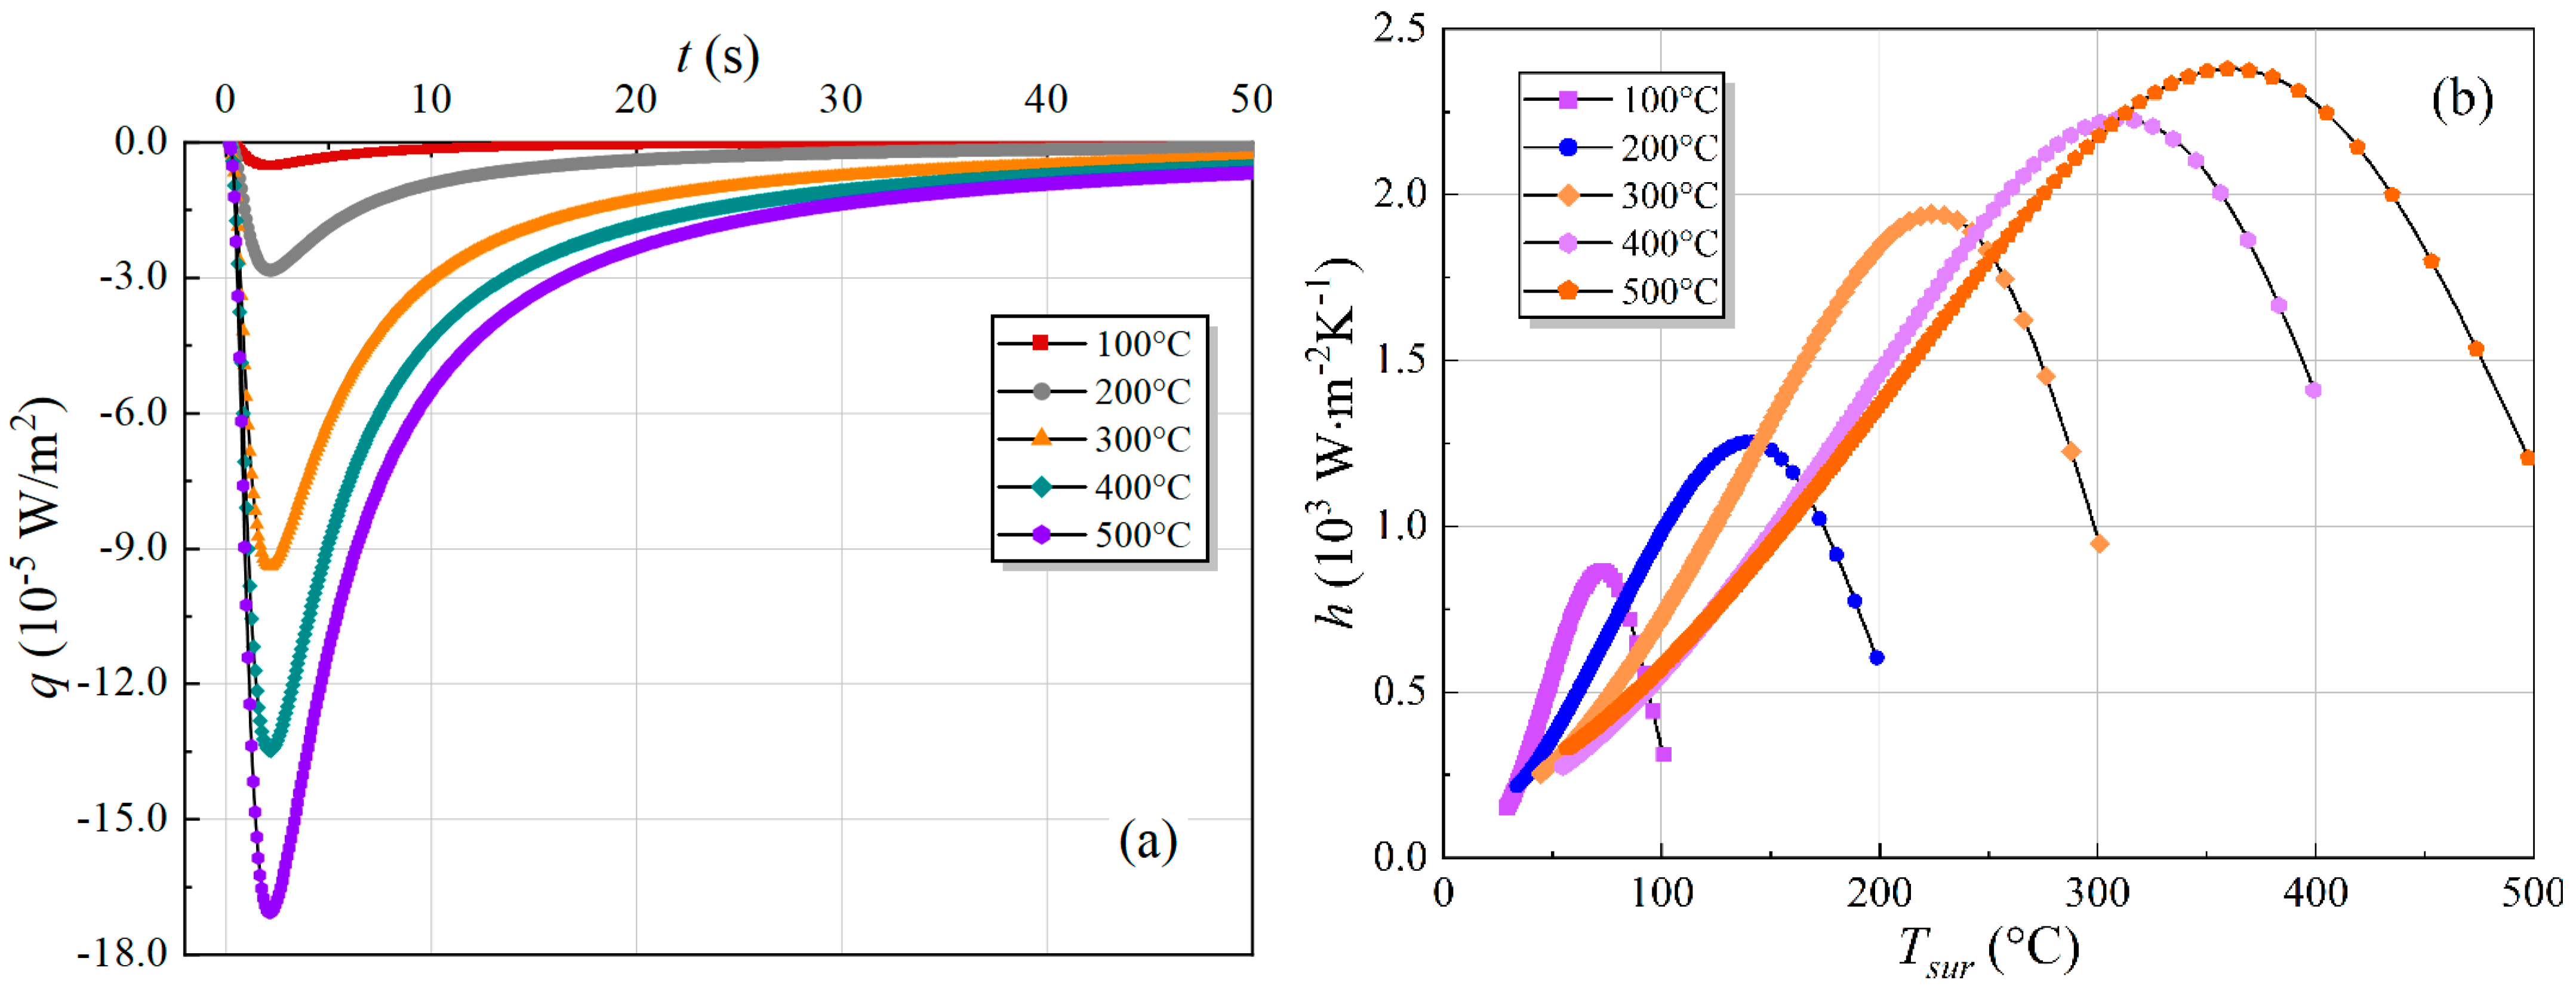
Figure 6 shows the measured temperature of the thermocouple preset at 5 mm from the edge of the sample. Figure 7a shows the calculated heat flux on the sample surface. It can be found that the heat flux of the sample surface is a negative value, which is the performance of the continuous loss of heat from the sample. At the same time, the heat flux from the specimen to the outside increases to a maximum within a few seconds and then gradually decreases. It can also be found that, the higher the initial temperature of the sample, the greater the absolute value of the heat flux. This is consistent with the phenomenon that, the higher the temperature, the more prominent the bumping of the sample in the water.
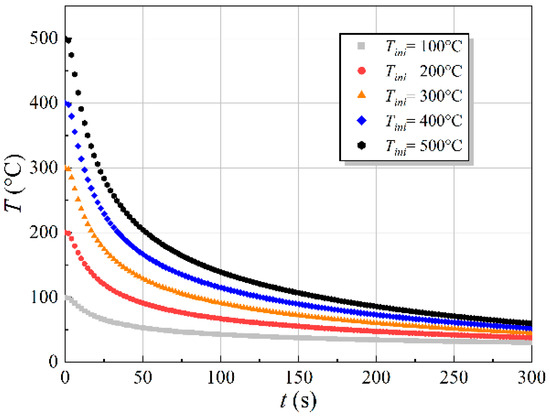
Figure 6.
Measured temperature of the thermocouple.
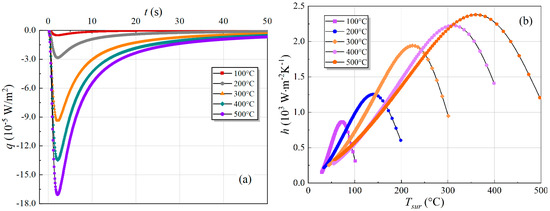
Figure 7.
Heat conduction characteristics of high temperature granite subjected to water cooling: (a) heat flux on the sample surface; (b) relationship between the heat transfer coefficient and the surface temperature.
Figure 7b shows the relationship between the heat transfer coefficient and the surface temperature. The evolution of the heat transfer coefficient shows the similar trend as the heat flux. As the decrease of the surface temperature, the heat transfer coefficient first increase to the maximum value and then gradually decreases. According to the research of Collin et al. [39], the thermal-shock-induced tensile stress is positive to the temperature difference and the heat transfer coefficient h, as follows:
where α is the thermal expansion coefficient; ΔT is the local temperature difference; μ is the Poisson ratio; r and k are the radius and thermal conductivity of the sample, respectively; and fh is a parameter that is positively related to h. Figure 7b illustrates that the maximum heat transfer coefficient of the samples treated with Tini of 500, 400, 300, 200 and 100 °C is 2.3, 2.15, 1.9, 1.22 and 1.86 W·m−2K−1, respectively. Therefore, it can be inferred that the thermal-shock-induced tensile stress is positive to Tini. In addition, with the increase of temperature, the growth rate of the maximum heat transfer coefficient of the sample becomes slower, which can be attributed to the hindrance of heat transfer by the boiling of water near the surface of the sample.
4.2. Heat Conduction Characteristics and Thermal Crack Evolution
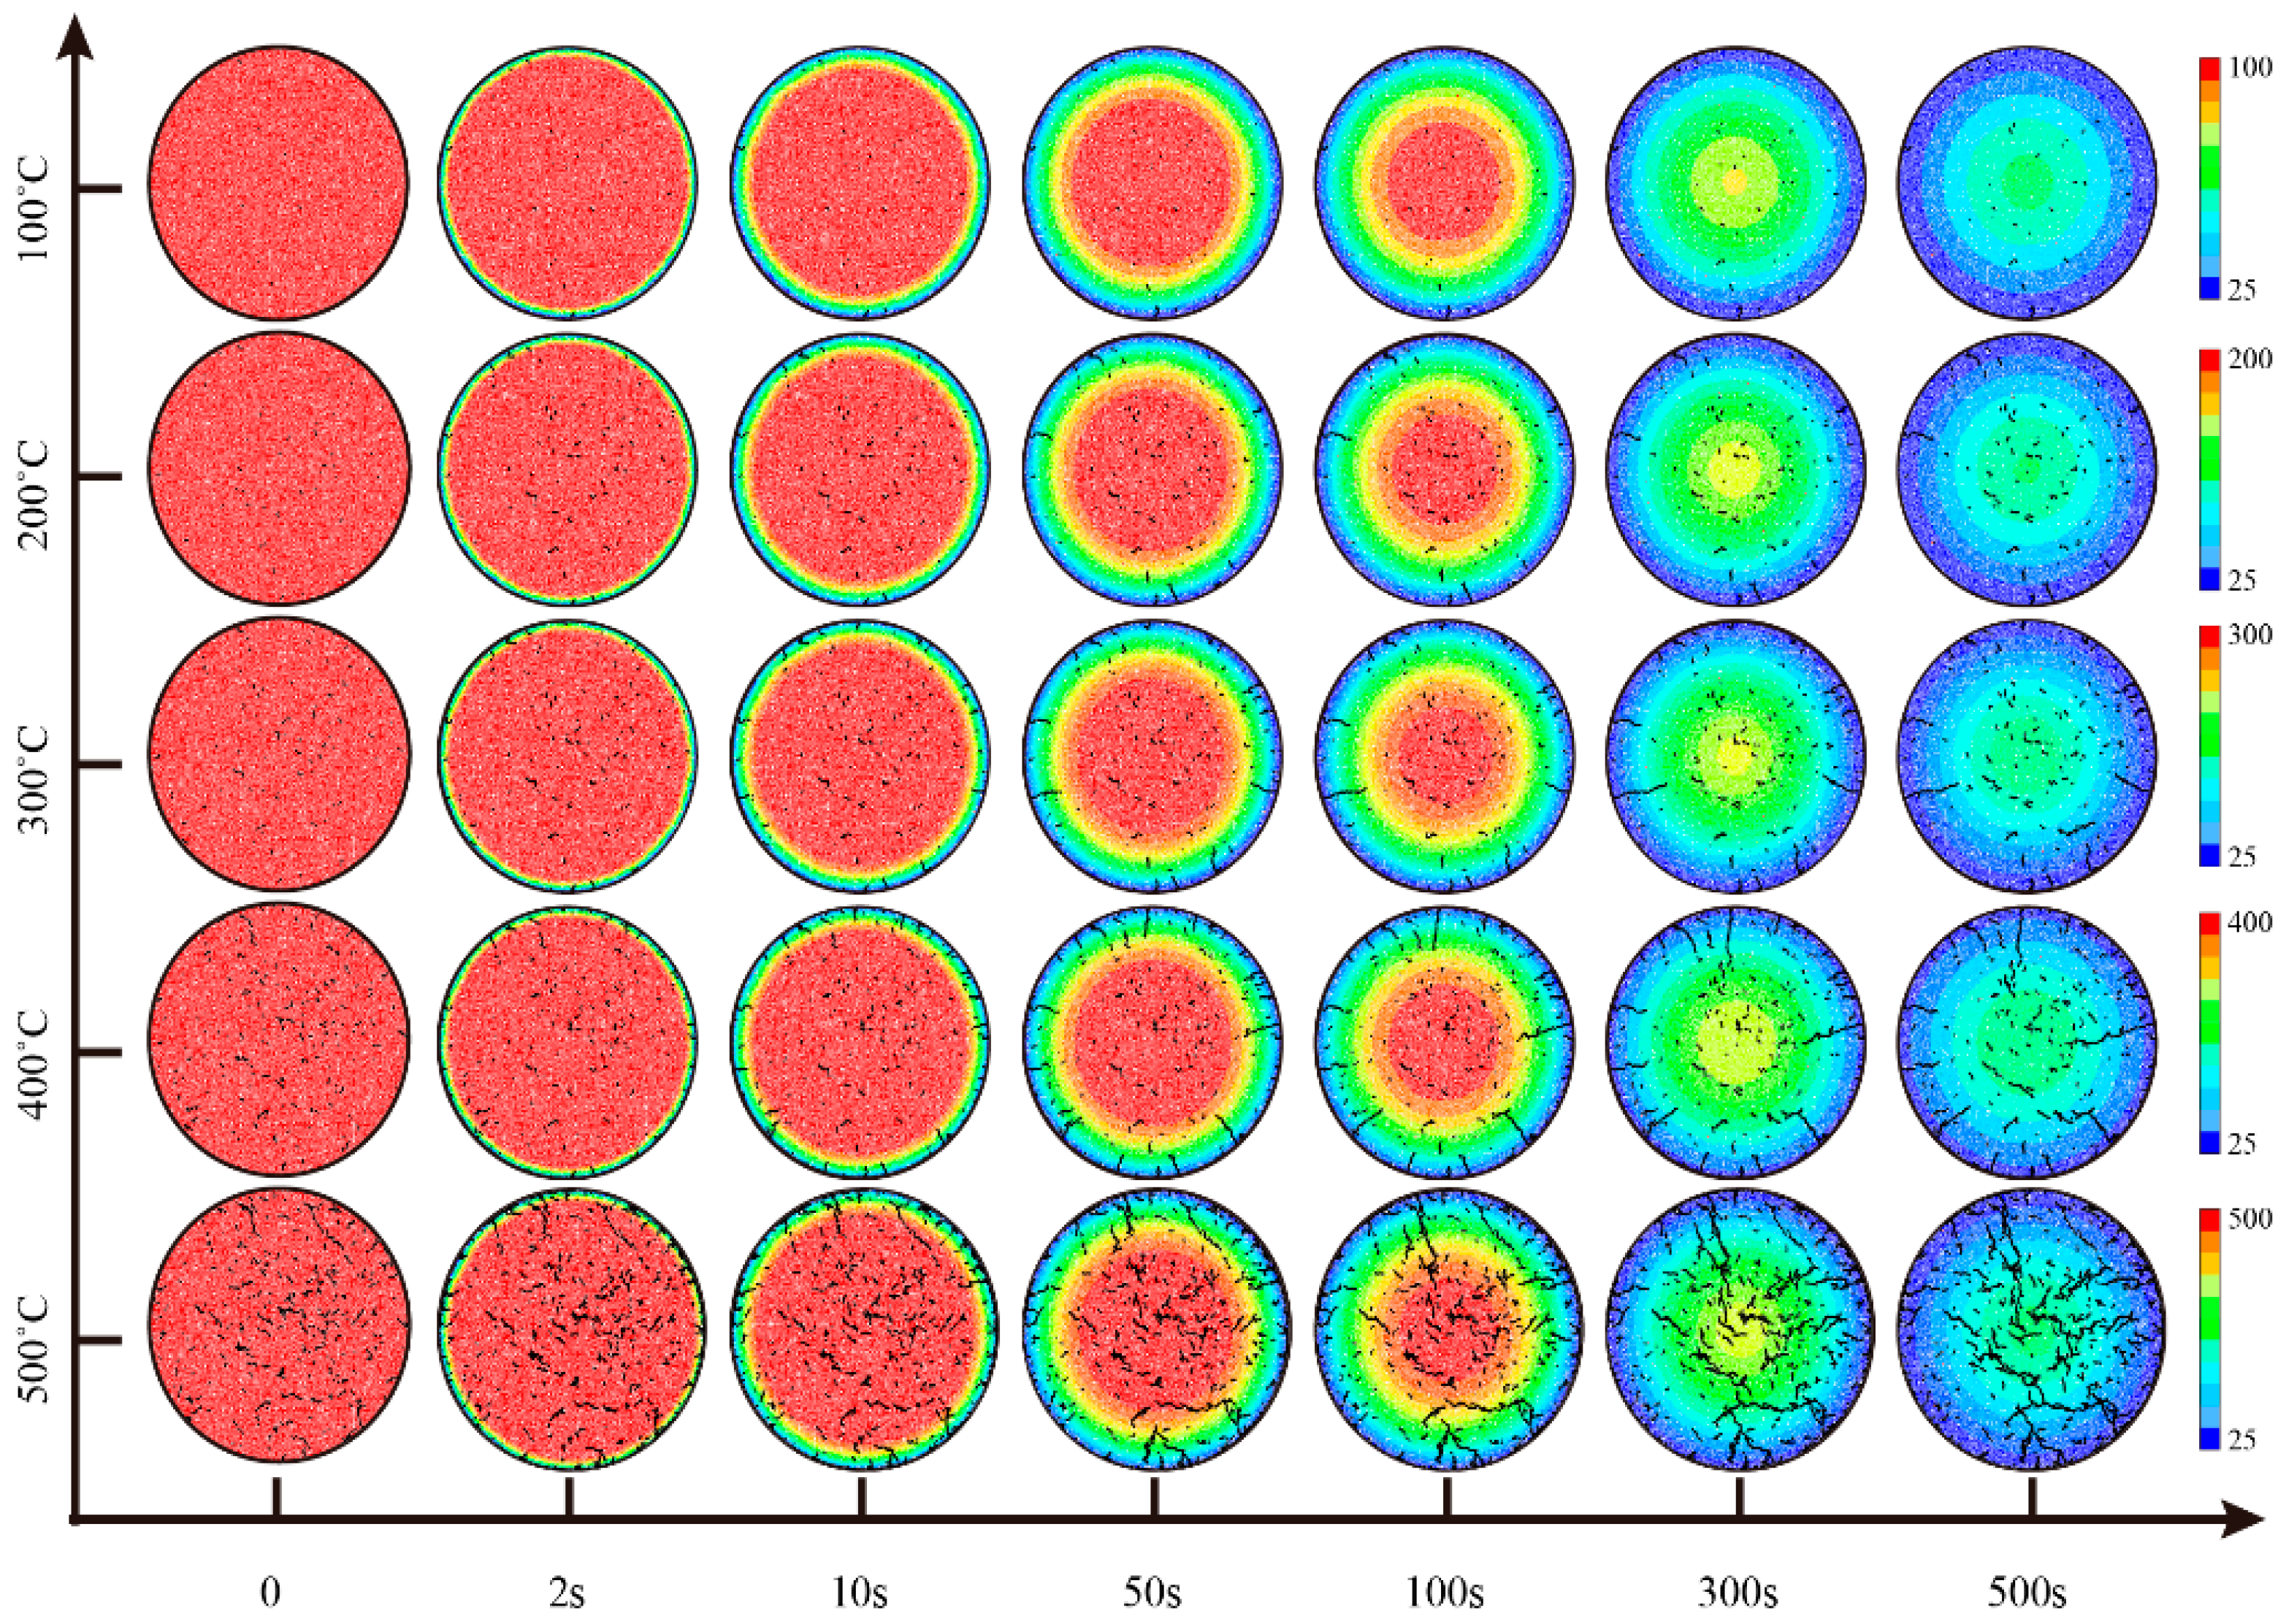
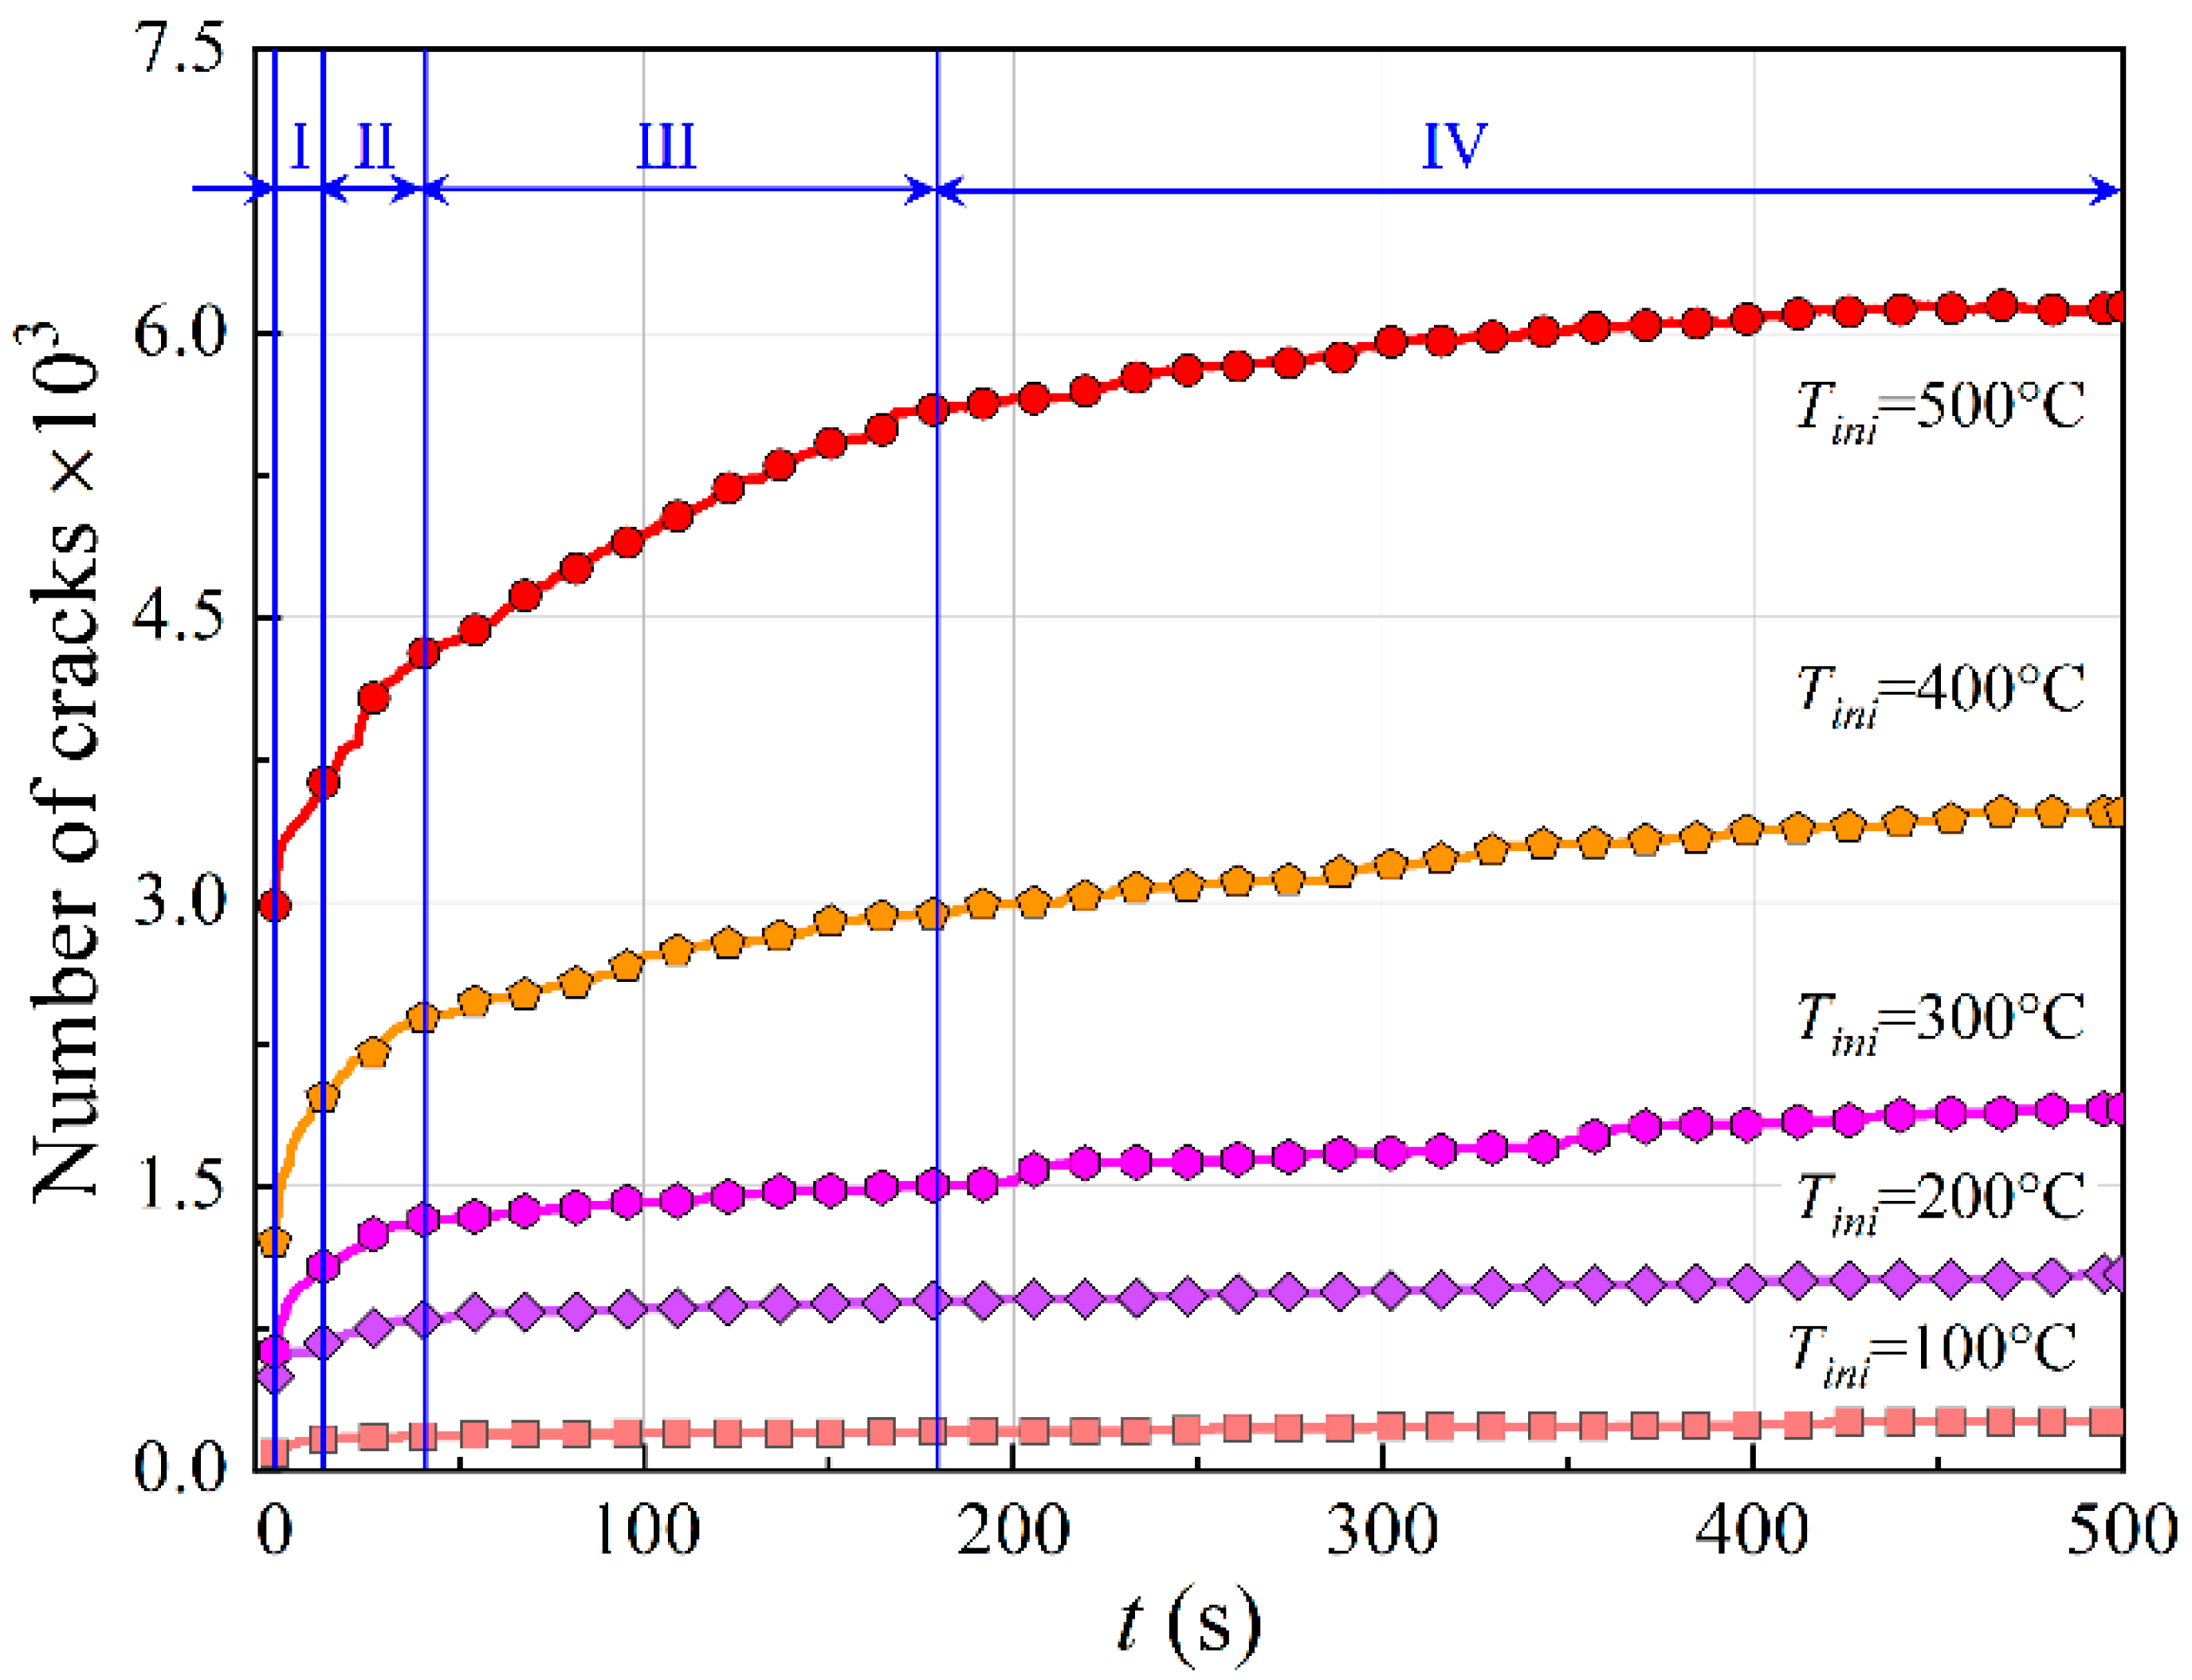
Under the heat flux boundary conditions, as shown in Figure 7a, the calculated temperature field and distributions of microcracks of the granite sample with various heating temperature Tini subjected to water cooling are shown in Figure 8. Meanwhile, with the help of the numerical model, the crack is defined as the fractured contact between the particles in the model, and a function for real-time monitoring and counting of the number of cracks is preset to quantify the number of cracks. Figure 9 presents the statistical results of microcracks in the heated sample during the cooling process. It can be found that the microcracks are randomly distributed in the heated samples, and the number and density of the microcracks increase as the increasing Tini, which is consistent with the observations from previous studies [7,32]. It is worth noting that this phenomenon can also be found in samples subjected to cooling. In the cooling stage, the cracks caused by cooling gradually spread from the edge to the inside of the sample with the loss of heat.
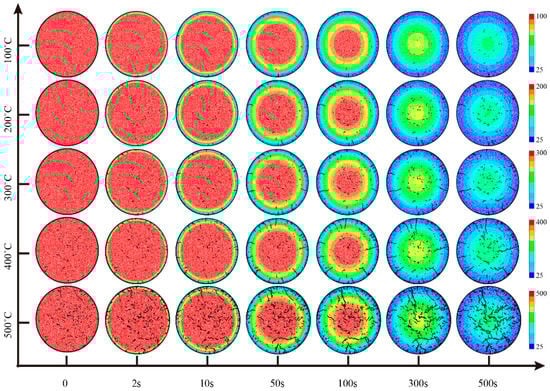
Figure 8.
Crack propagation process and temperature fields history for high-temperature granite during cooling.
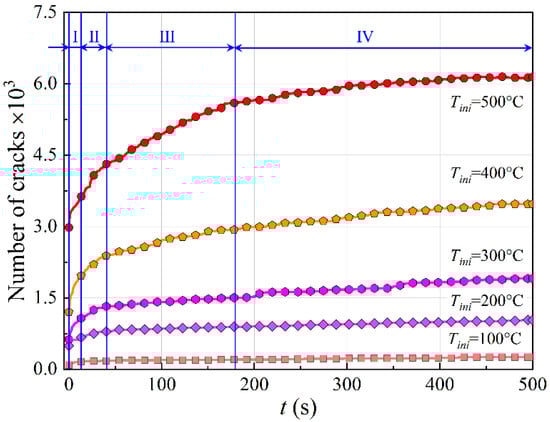
Figure 9.
Evolutions of the number of the microcracks in samples with various initial temperatures.
It can be found that the edge area with drastic temperature changes is accompanied by the densely distributed microcracks; in contrast, the internal cracks of the specimen with gentle temperature are relatively sparse. Throughout the cooling process, the variations of the number of microcracks in the high-temperature sample can be divided into four stages. The details for the samples subjected to various Tini are discussed as follows.
Stage I: Edge damage period (0–2 s). In this stage, the surface heat flux increases to the maximum value, and the temperature at the edge of the specimen drops rapidly. Meanwhile, numerous microcracks generate at the edge of the sample. Although this stage takes a short time, it contributes quite a lot to the total thermal damage, especially in those samples treated with lower Tini.
Stage II: Damage transition period (2 s–40 s). In this stage, the surface heat flux begins to decrease from the maximum value, and the temperature drop area begins to expand to the inside. However, the crack growth rate is obviously transitioned, especially in those samples treated with higher Tini.
Stage III: Damage extension period (40 s–180 s). In this stage, the surface heat flux has dropped to a low level, and the temperature inside the sample drops further. The number of cracks in those samples treated with lower Tini has grown quite slowly, while the thermal damage of samples treated with higher Tini continues to increase.
Stage IV: Damage mitigation period (180 s–end). The temperature and the surface heat flux of the whole sample drop to very low levels, and the temperature field tends to be uniform. Compared with the previous stages, the crack growth in this stage is relatively slow.
4.3. Distributions of Thermal Damage by MRI and Numerical Simulation
MRI technology provides the feasibility of nondestructively observing the distribution of thermal damage inside the specimen. As shown in Figure 10, the thermal damage of the preheated sample after cooling is mainly concentrated on the edge of the sample, which is consistent with the simulation results. This also shows the reliability of the numerical model in simulating the damage caused by heating and cooling. The damage area is discretely distributed in the sample treated with initial temperature of 100 °C, while significant edge damage can be found when the temperature difference exceeds 200 °C. At the same time, the damage area of the edge and center of the specimen increase with the increasing initial temperature. According to Figure 8, the damage in the center is caused by heating, and the damage on the edges is mainly caused by cooling. Combined with the simulation results, it can be found that, as the temperature increases, the edge cracks not only grow deeper, but the crack density also becomes higher.
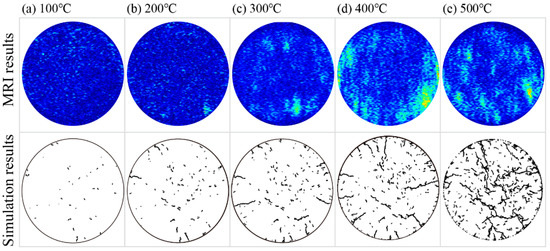
Figure 10.
Comparison of MRI results and simulation results.
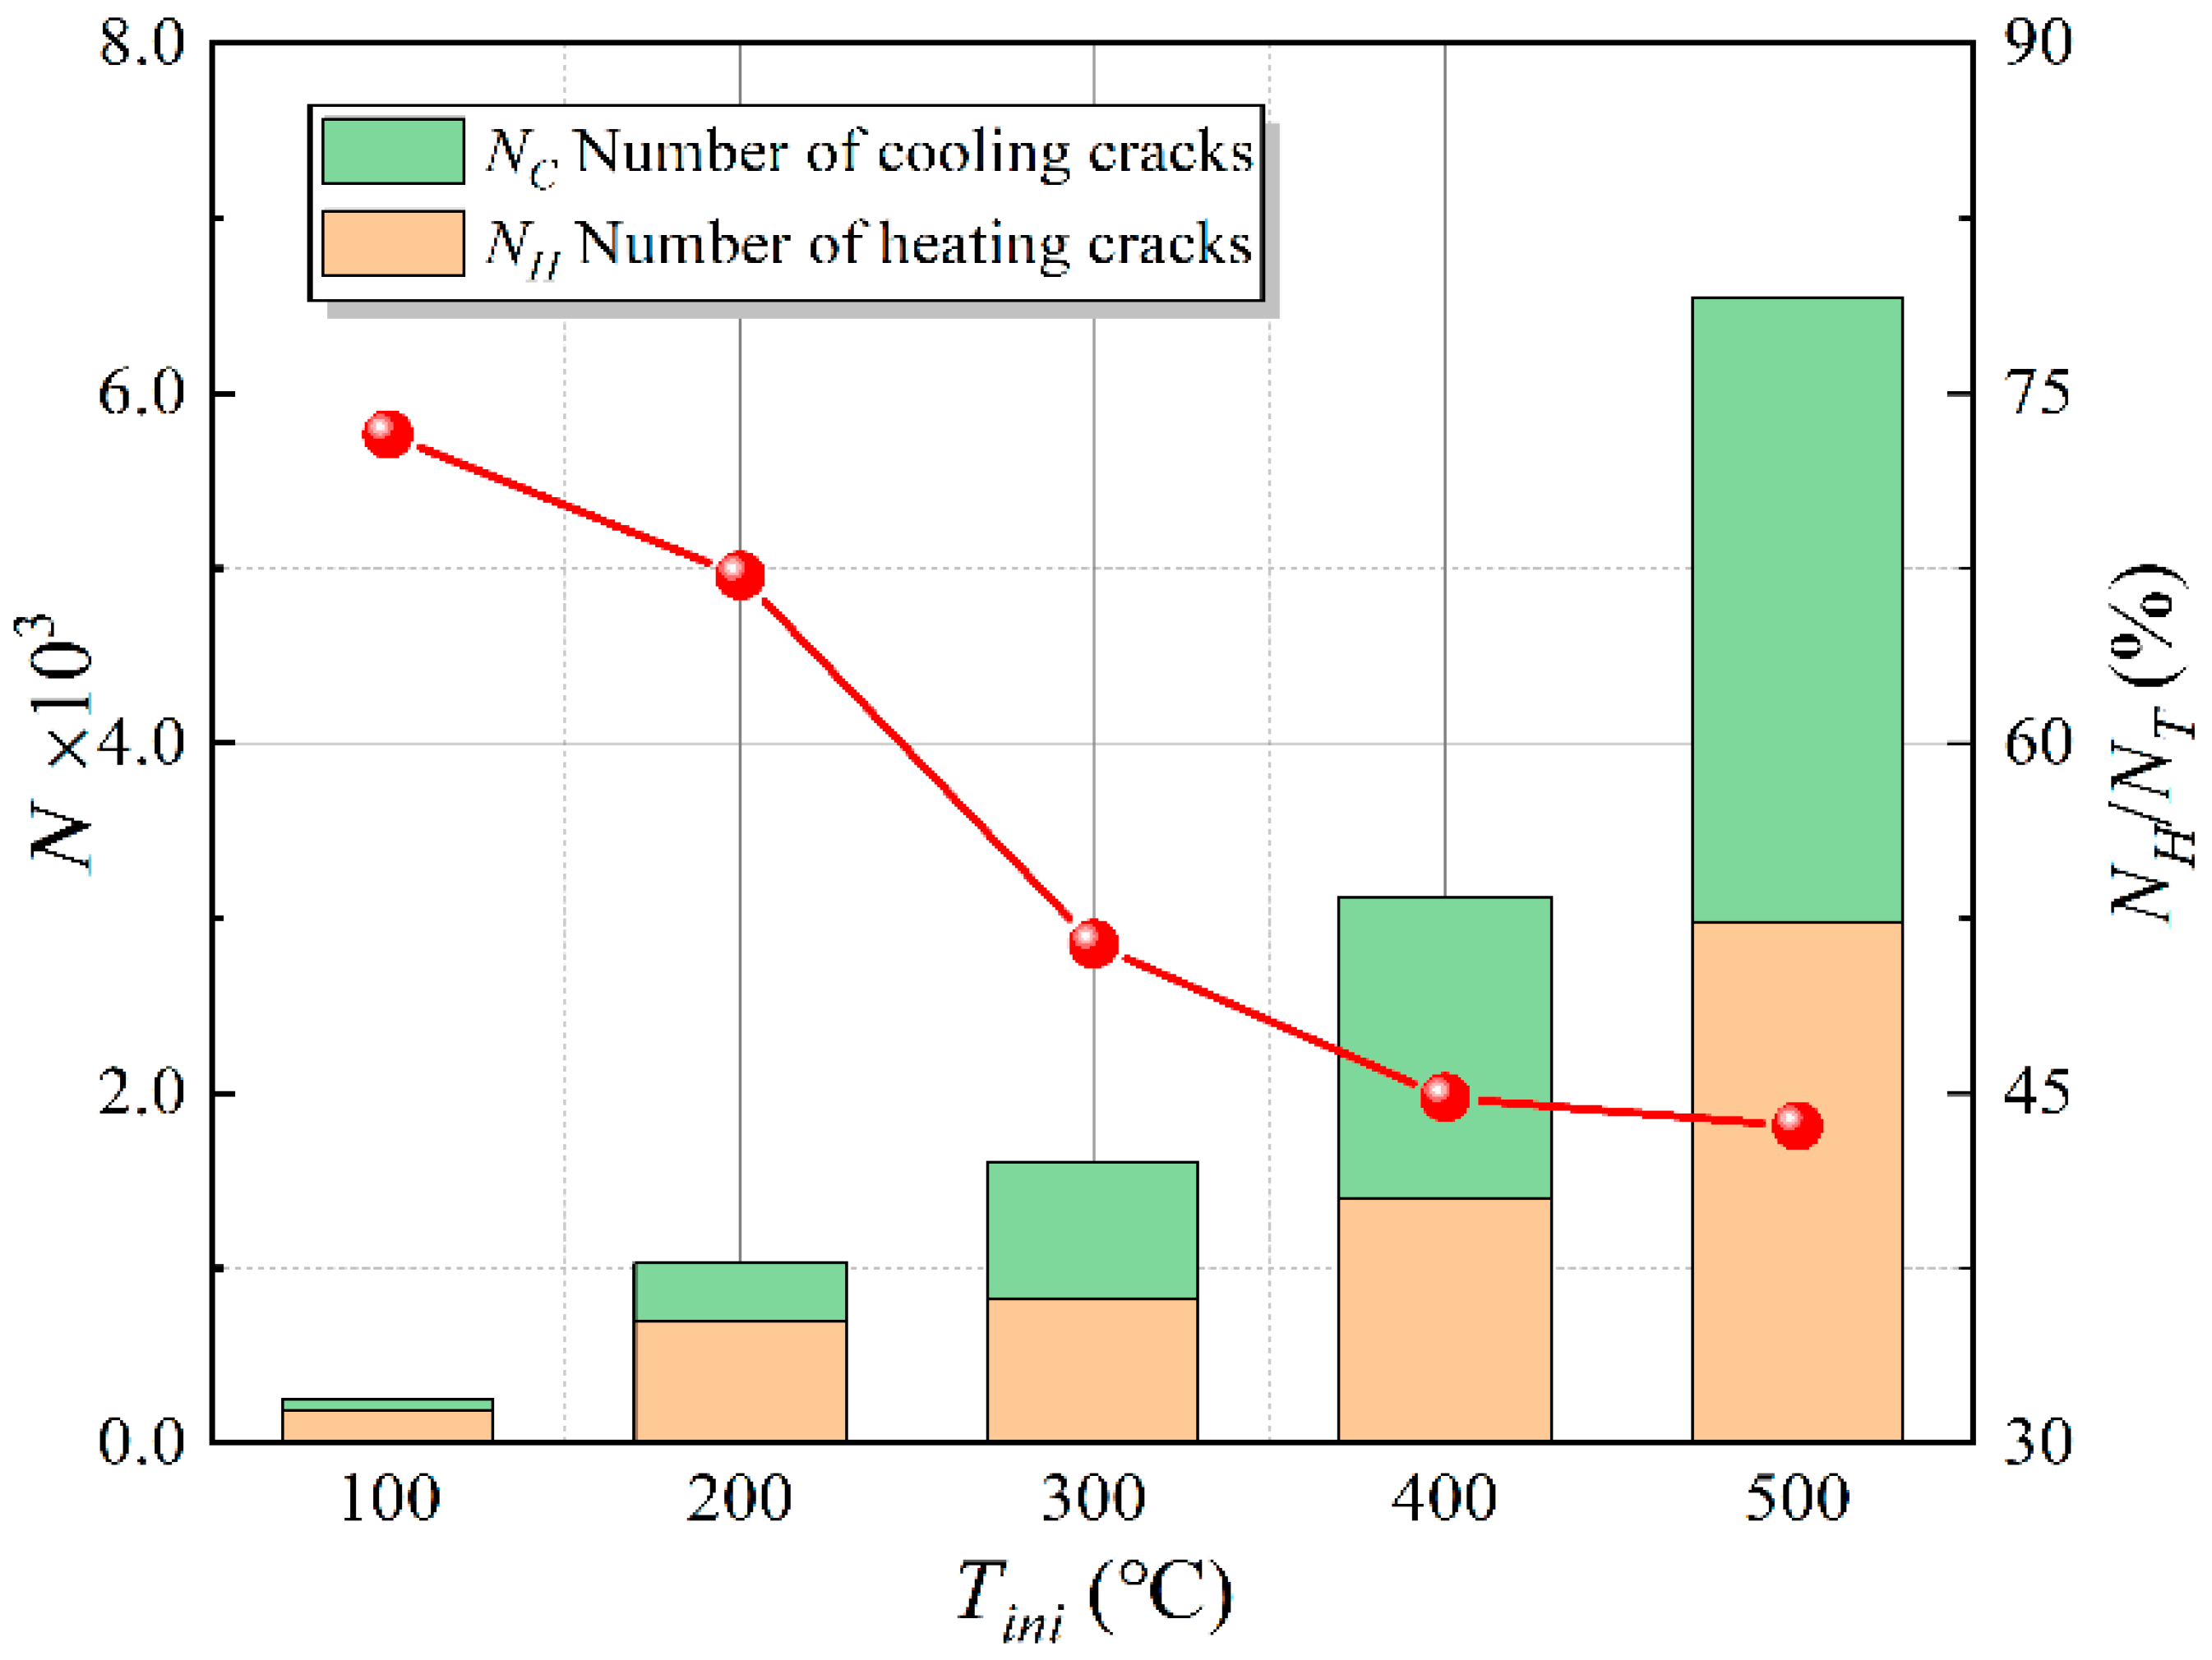
In order to quantitatively characterize the contribution of heating and cooling to thermal damage, the number of the heating cracks and the cooling cracks in the samples treated with various Tini are statistically shown in Figure 11. It can be found that the total cracks increase exponentially with increasing Tini. Both heating cracks and cooling cracks increase as Tini does; however, the values of NH/NT for the sample treated with Tini of 100 °C, 300 °C and 500 °C were 74%, 52% and 44%, respectively. The evolution of NH/NT illustrates that the thermal damage contributed by the heating cracks is continuous decrease, and the thermal damage contributed by cooling is continuous increase as the Tini increases. This phenomenon implies that the increasing temperature difference can promote the generation and propagation of microcracks induced by cooling.
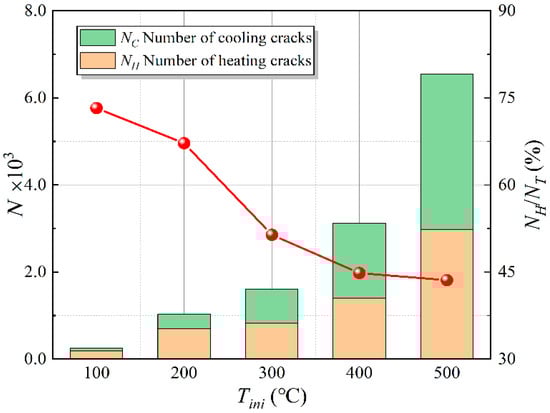
Figure 11.
Comparison of the number of the heating cracks and the cooling cracks.
4.4. Effect of Thermal Stress Field on Crack Propagation
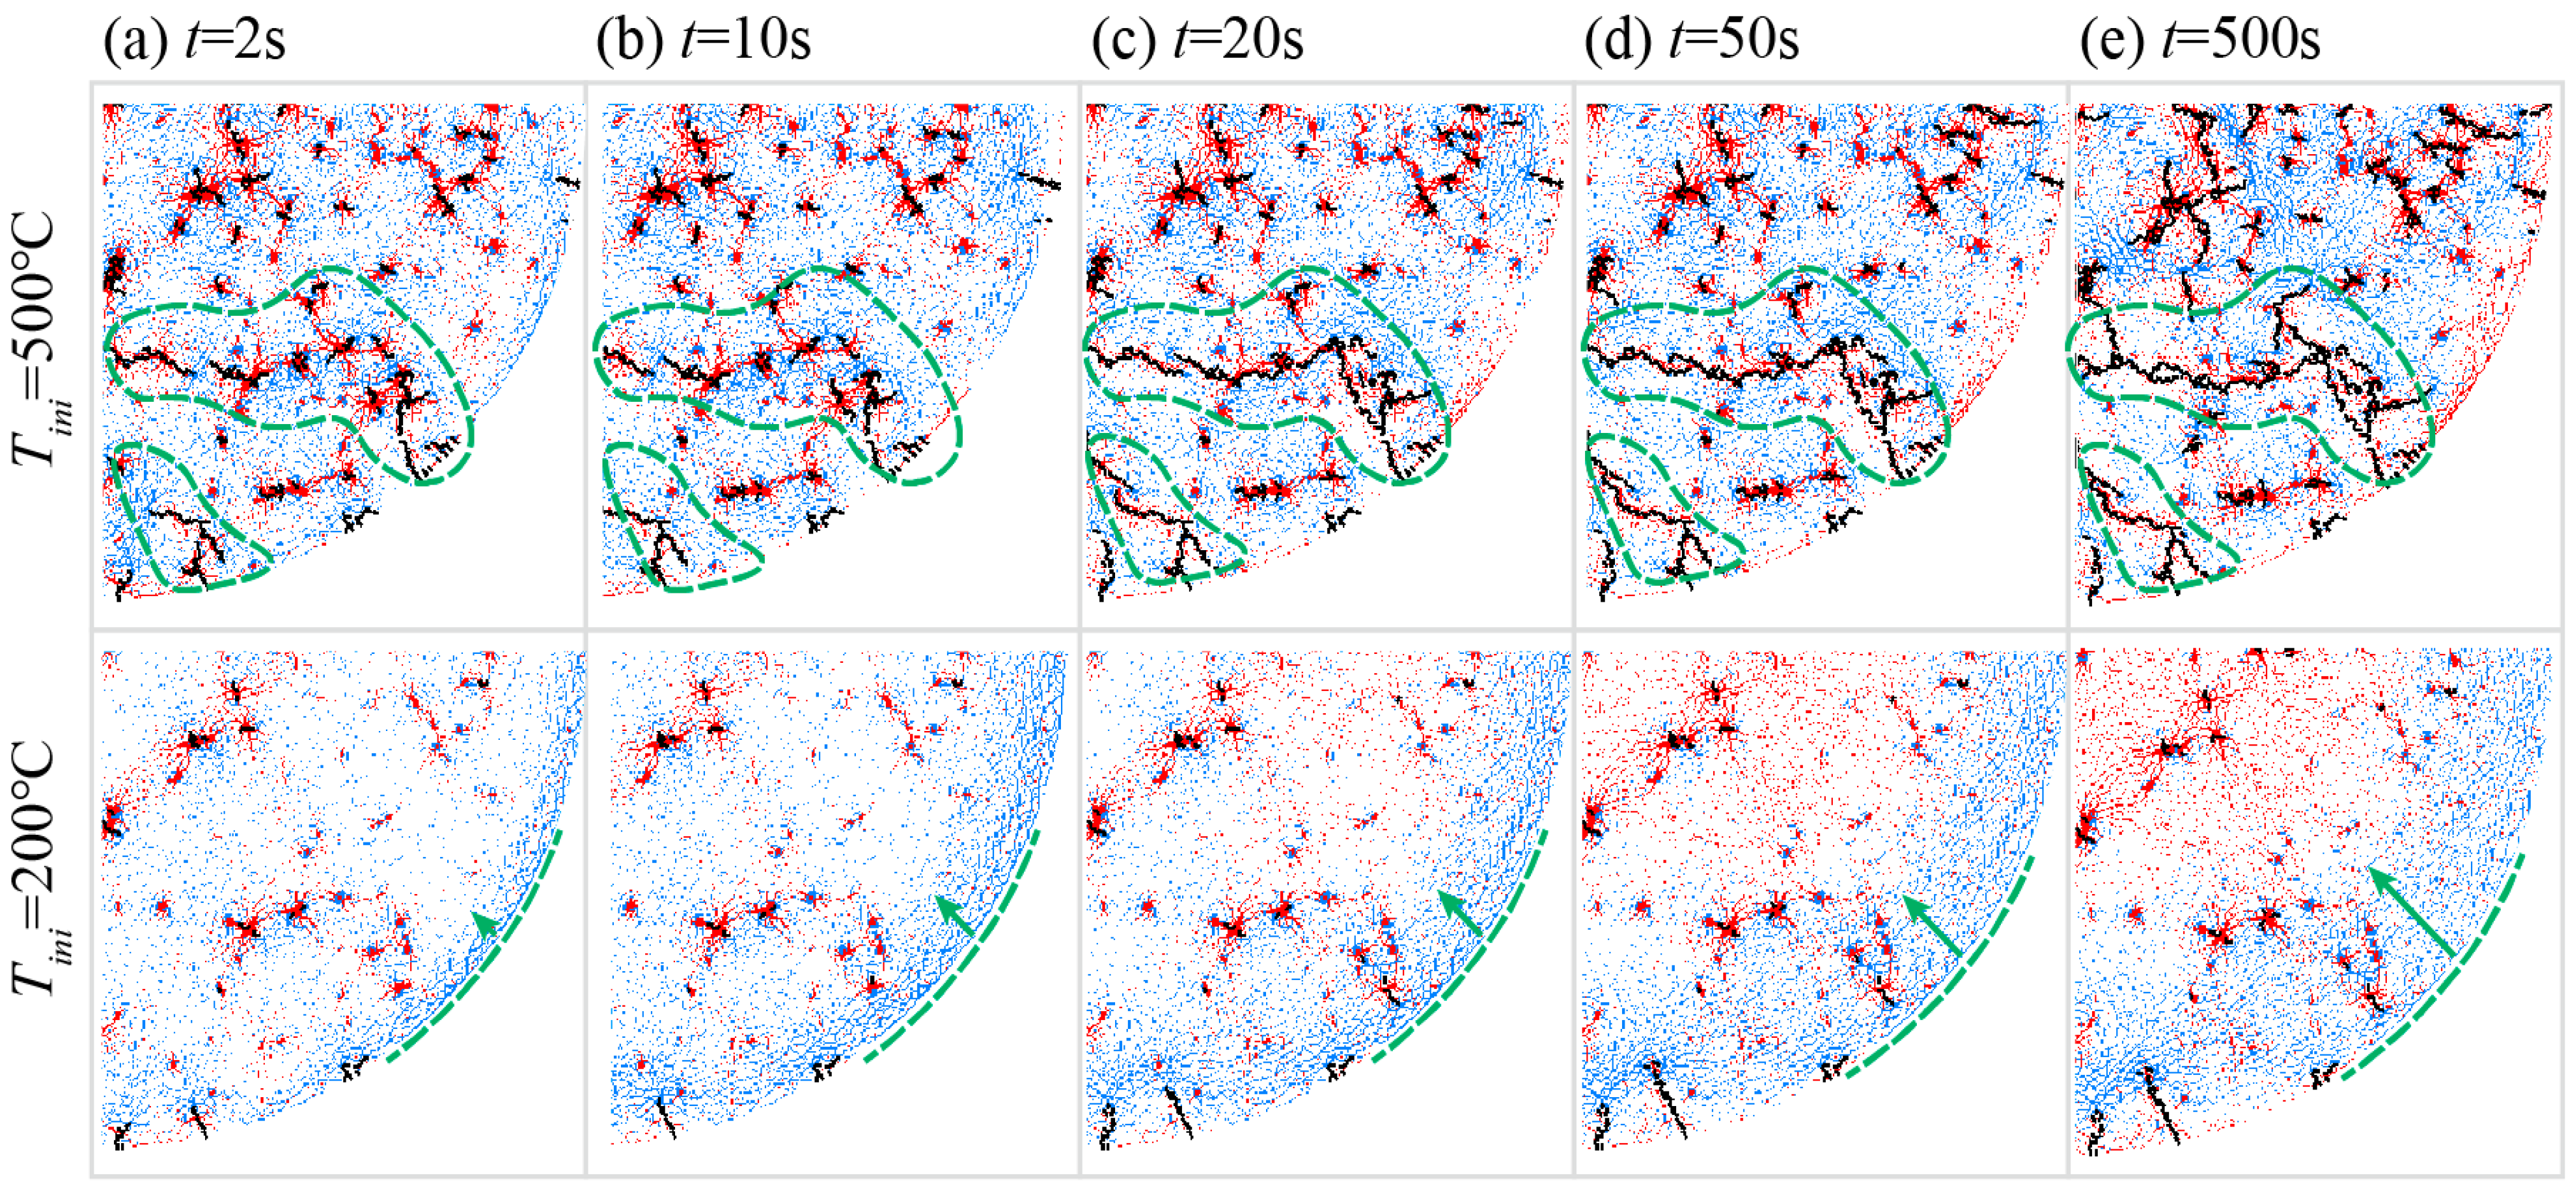
Figure 12 shows the evolution of thermal stress of high-temperature sample during cooling. It can be found that the cracks induced by heating are scattered, and the force chains near these cracks are dominated by compressive stress. This means that the damage caused by heating is the result of the uneven thermal expansion of the local particles, which is consistent with the results of previous experimental studies. The tensile stress chain gathered at the crack tip indicates that the cooling cracks are driven by the tensile stress. Most of the thermal cracks were generated in the first 50 s, which is similar to the evolution of the temperature and the heat flux shown in Figure 7 and Figure 8. Combined with the formula, it can be speculated that the cooling-induced cracks are the results of the increasing temperature gradient and heat flux.
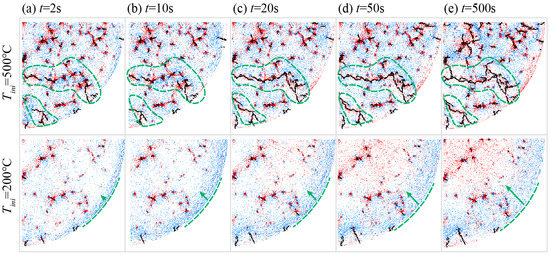
Figure 12.
Evolution of thermal stress field and thermal cracks. Note: the red and blue solid lines represent the contact between particles in compression and tension, respectively, and their thickness represents the relative magnitude of the force.
It is worth noting that the propagation of cooling cracks is strongly affected by heating cracks, as shown in the area marked with the green dashed circle in Figure 12. On the one hand, the thermal stress field is chaotic due to the pre-existing heating cracks, especially in the sample with higher temperature. On the other hand, stress concentration induced by thermal shock promotes the coalescence of the pre-existing heating cracks; in detail, the tensile stress expands the heating cracks and results in the generation of the larger cracks.
5. Discussion
Theoretically, geothermal energy is considered a renewable energy source. However, artificial or natural geothermal reservoirs will lose their sealing properties under improper operating conditions, which will lead to water loss [1]. Eventually, the geothermal system cannot operate permanently when the commercial value of the geothermal system cannot make up for the water loss. Therefore, the geothermal system is not long-term renewable in a strict sense. Modeling of the EGS system is a key method for evaluating and predicting the operating status of the geothermal system. However, none of the existing models can take accurate rock thermal damage into account. Previous studies have shown that the damage of the rock materials caused by the cooling process cannot be ignored, and the research on this issue is very limited [3,4]. As the temperature of the area in contact with the cooling medium will decrease due to heat loss during the cooling process, it can be inferred that the heat flux will decrease as the temperature of the local area of the rock decreases. In other words, the thermal damage of the rock during the cooling process changes dynamically, which is consistent with the research conclusions of this study. This study provides a solution method to obtain the time history of the temperature field, heat flux and surface heat exchange coefficient of the rock during the cooling process according to the inverse heat conduction method. According to the evolution of heat flux, the dynamic thermal damage of the rock can be obtained in the DEM-based numerical model. In addition, according to the results of this research, the thermal damage contributed by the heating cracks is a continuous decrease, and the thermal damage contributed by cooling is a continuous increase as the temperature increases. In a practical sense, the thermal damage caused by the reinjection in the high-temperature geothermal reservoir is more worthy of attention. Thanks to the excellent performance in simulating the damage of rock materials of the DEM, the simulation results are surprisingly similar to the MRI test results. Based on this method, the simulation and prediction of EGS can be further improved. In fact, thermal shock to rocks is not entirely harmful and can also be used for thermal stimulation. Subsequent research will build a complete EGS system model, further study the reservoir state during the operation of the EGS system and provide a predictive plan for its long-term stable and efficient operation.
6. Conclusions
In this study, we determined the heat transfer characteristics of high-temperature granite during the cooling process; the thermal damage was measured by MRI technology. Meanwhile, evolutions of thermal damage in granite were analyzed by experimental and numerical methods. The main conclusions are summarized as follows.
- (1)
- The heat flux and heat transfer coefficient of the high-temperature granite during cooling were calculated by the inverse heat conduction method. The heat flux from the specimen to the outside increased to a maximum within a few seconds and then gradually decreased. The higher the initial temperature of the sample, the greater the absolute value of the heat flux. The evolution of the heat transfer coefficient shows the similar trend as the heat flux. The maximum heat transfer coefficient of the samples treated with the initial temperature of 500, 400, 300, 200 and 100 °C is 2.3, 2.15, 1.9, 1.22 and 1.86 W·m−2K−1, respectively.
- (2)
- The edge area with drastic temperature changes is accompanied by the densely distributed microcracks; in contrast, the internal cracks of the specimen with gentle temperature are relatively sparse. Throughout the cooling process, the variations of the number of microcracks in the high-temperature sample can be divided into four stages: edge damage period, damage transition period, damage extension period and damage mitigation period.
- (3)
- The damage area of the edge and center of the specimen increase with the increasing initial temperature, and the total cracks increase exponentially with the increasing Tini. The evolution of NH/NT illustrates that the thermal damage contributed by the heating cracks is a continuous decrease, and the thermal damage contributed by cooling is a continuous increase as the Tini increases.
- (4)
- The damage caused by heating is the result of the uneven thermal expansion of the local particles, and the cooling cracks are driven by the tensile stress. The cooling-induced cracks are the result of the combination of temperature gradient and heat flux. The propagation of cooling cracks is strongly affected by heating cracks, and stress concentration induced by thermal shock promotes the coalescence of the pre-existing heating cracks.
Author Contributions
Conceptualization, Q.L.; methodology, Q.L.; software, Q.L.; validation, Q.L., T.Y., X.L. and R.S.; formal analysis, Q.L.; investigation, T.Y.; resources, R.S.; data curation, R.S.; writing—original draft preparation, Q.L.; writing—review and editing, Q.L., T.Y., X.L. and R.S.; visualization, Q.L.; supervision, Q.L. and T.Y.; project administration, T.Y.; funding acquisition, T.Y. All authors have read and agreed to the published version of the manuscript.
Funding
This work was supported by the National Natural Science Foundation of China (51774325, 41972283, 41630642) and the Research Initiation Project of Jiangxi University of Science and Technology (205200100551).
Institutional Review Board Statement
Not applicable.
Informed Consent Statement
Not applicable.
Data Availability Statement
The data presented in this study are available on request from the corresponding author.
Conflicts of Interest
The authors declare no conflict of interest.
References
- Barbier, E. Geothermal energy technology and current status: An overview. Renew. Sustain. Energy Rev. 2002, 6, 3–65. [Google Scholar] [CrossRef]
- Olasolo, P.; Juárez, M.C.; Morales, M.P.; D’Amico, S.; Liarte, I.A. Enhanced geothermal systems (EGS): A review. Renew. Sustain. Energy Rev. 2016, 56, 133–144. [Google Scholar] [CrossRef]
- Zhu, Z.; Kempka, T.; Ranjith, P.G.; Tian, H.; Jiang, G.; Dou, B.; Mei, G. Changes in thermomechanical properties due to air and water cooling of hot dry granite rocks under unconfined compression. Renew Energy 2021, 170, 562–573. [Google Scholar] [CrossRef]
- Kumari, W.G.P.; Ranjith, P.G. Sustainable development of enhanced geothermal systems based on geotechnical research—A review. Earth-Sci. Rev. 2019, 199, 102955. [Google Scholar] [CrossRef]
- Cheng, W.; Wang, C.; Nian, Y.; Han, B.; Liu, J. Analysis of influencing factors of heat extraction from enhanced geothermal systems considering water losses. Energy 2016, 115, 274–288. [Google Scholar] [CrossRef]
- Yin, T.; Li, Q.; Li, X. Experimental investigation on mode I fracture characteristics of granite after cyclic heating and cooling treatments. Eng. Fract. Mech. 2019, 222, 106740. [Google Scholar] [CrossRef]
- Li, Q.; Li, X.; Yin, T. Factors affecting pore structure of granite under cyclic - heating and cooling: A nuclear magnetic resonance investigation. Geothermics 2021, 96, 102198. [Google Scholar] [CrossRef]
- Yin, T.; Wang, C.; Wu, Y.; Wu, B. A waveform modification method for testing dynamic properties of rock under high temperature. J. Rock Mech. Geotech. Eng. 2021, 13, 833–844. [Google Scholar] [CrossRef]
- Hao, W.; Dan, M.; Spearing, A.J.S.; Guoyan, Z. Fracture phenomena and mechanisms of brittle rock with different numbers of openings under uniaxial loading. Geomech. Eng. 2021, 25, 481–493. [Google Scholar]
- Li, Q.; Li, X.; Yin, T. Effect of microwave heating on fracture behavior of granite: An experimental investigation. Eng. Fract. Mech. 2021, 250, 107758. [Google Scholar] [CrossRef]
- Yin, T.; Tan, X.; Wu, Y.; Yang, Z.; Li, M. Temperature dependences and rate effects on Mode II fracture toughness determined by punch-through shear technique for granite. Theor. Appl. Fract. Mech. 2021, 114, 103029. [Google Scholar] [CrossRef]
- Li, Q.; Yin, T.; Li, X.; Zhang, S. Effects of rapid cooling treatment on heated sandstone: A comparison between water and liquid nitrogen cooling. Bull. Eng. Geol. Environ. 2020, 79, 313–327. [Google Scholar] [CrossRef]
- Yin, T.; Wu, Y.; Wang, C.; Zhuang, D.; Wu, B. Mixed-mode I + II tensile fracture analysis of thermally treated granite using straight-through notch Brazilian disc specimens. Eng. Fract. Mech. 2020, 234, 107111. [Google Scholar] [CrossRef]
- Tian, W.; Yang, S.; Elsworth, D.; Wang, J.; Li, X. Permeability evolution and crack characteristics in granite under treatment at high temperature. Int. J. Rock Mech. Min. Sci. 2020, 134, 104461. [Google Scholar] [CrossRef]
- Zhu, Z.; Ranjith, P.G.; Tian, H.; Jiang, G.; Dou, B.; Mei, G. Relationships between P-wave velocity and mechanical properties of granite after exposure to different cyclic heating and water cooling treatments. Renew Energy 2021, 168, 375–392. [Google Scholar] [CrossRef]
- Sun, Q.; Zhang, W.; Zhu, Y.; Huang, Z. Effect of high temperatures on the thermal properties of granite. Rock Mech. Rock Eng. 2019, 52, 2691–2699. [Google Scholar] [CrossRef]
- Zhao, F.; Sun, Q.; Zhang, W. Fractal analysis of pore structure of granite after variable thermal cycles. Environ. Earth Sci. 2019, 78, 677. [Google Scholar] [CrossRef]
- Ge, Z.; Sun, Q. Acoustic emission (AE) characteristics of granite after heating and cooling cycles. Eng. Fract. Mech. 2018, 200, 418–429. [Google Scholar] [CrossRef]
- Zhao, Z. Thermal influence on mechanical properties of granite: A microcracking perspective. Rock Mech. Rock Eng. 2016, 49, 747–762. [Google Scholar] [CrossRef]
- Zhao, Z.; Xu, H.; Wang, J.; Zhao, X.; Cai, M.; Yang, Q. Auxetic behavior of Beishan granite after thermal treatment: A microcracking perspective. Eng. Fract. Mech. 2020, 231, 107017. [Google Scholar] [CrossRef]
- Yang, S.; Tian, W.; Elsworth, D.; Wang, J.; Fan, L. An experimental study of effect of high temperature on the permeability evolution and failure response of granite under triaxial compression. Rock Mech. Rock Eng. 2020, 53, 4403–4427. [Google Scholar] [CrossRef]
- Kim, K.; Kemeny, J.; Nickerson, M. Effect of rapid thermal cooling on mechanical rock properties. Rock Mech. Rock Eng. 2014, 47, 2005–2019. [Google Scholar] [CrossRef]
- Yin, T.; Li, X.; Xia, K.; Huang, S. Effect of thermal treatment on the dynamic fracture toughness of Laurentian granite. Rock Mech. Rock Eng. 2012, 45, 1087–1094. [Google Scholar] [CrossRef]
- Sun, H.; Sun, Q.; Deng, W.; Zhang, W.; Lü, C. Temperature effect on microstructure and P-wave propagation in Linyi sandstone. Appl. Therm. Eng. 2017, 115, 913–922. [Google Scholar] [CrossRef]
- Wu, Q.; Weng, L.; Zhao, Y.; Guo, B.; Luo, T. On the tensile mechanical characteristics of fine-grained granite after heating/cooling treatments with different cooling rates. Eng. Geol. 2019, 253, 94–110. [Google Scholar] [CrossRef]
- Rathnaweera, T.D.; Ranjith, P.G.; Gu, X.; Perera, M.S.A.; Kumari, W.G.P.; Wanniarachchi, W.A.M.; Haque, A.; Li, J.C. Experimental investigation of thermomechanical behaviour of clay-rich sandstone at extreme temperatures followed by cooling treatments. Int. J. Rock Mech. Min. Sci. 2018, 107, 208–223. [Google Scholar] [CrossRef]
- Zhao, Z.; Liu, Z.; Pu, H.; Li, X. Effect of thermal treatment on Brazilian tensile strength of granites with different grain size distributions. Rock Mech. Rock Eng. 2018, 51, 1293–1303. [Google Scholar] [CrossRef]
- Wu, X.; Huang, Z.; Cheng, Z.; Zhang, S.; Song, H.; Zhao, X. Effects of cyclic heating and LN2-cooling on the physical and mechanical properties of granite. Appl. Therm. Eng. 2019, 156, 99–110. [Google Scholar] [CrossRef]
- Yin, T.; Zhang, S.; Li, X.; Bai, L. A numerical estimate method of dynamic fracture initiation toughness of rock under high temperature. Eng. Fract. Mech. 2018, 204, 87–102. [Google Scholar] [CrossRef]
- Wu, Z.; Ma, L.; Fan, L. Investigation of the characteristics of rock fracture process zone using coupled FEM/DEM method. Eng. Fract. Mech. 2018, 200, 355–374. [Google Scholar] [CrossRef]
- Tian, W.; Yang, S.; Huang, Y.; Hu, B. Mechanical behavior of granite with different grain sizes after high-temperature treatment by particle flow simulation. Rock Mech. Rock Eng. 2020, 53, 1–17. [Google Scholar] [CrossRef]
- Fan, L.; Gao, J.; Du, X.; Wu, Z. Spatial gradient distributions of thermal shock-induced damage to granite. J. Rock Mech. Geotech. Eng. 2020, 12, 917–926. [Google Scholar] [CrossRef]
- Isaka, B.A.; Ranjith, P.G.; Rathnaweera, T.D.; Perera, M.S.A.; De Silva, V.R.S. Quantification of thermally-induced microcracks in granite using X-ray CT imaging and analysis. Geothermics 2019, 81, 152–167. [Google Scholar] [CrossRef]
- Zhou, Z.; Cai, X.; Cao, W.; Li, X.; Xiong, C. Influence of water content on mechanical properties of rock in both saturation and drying Processes. Rock Mech. Rock Eng. 2016, 49, 3009–3025. [Google Scholar] [CrossRef]
- Si, X.; Gong, F. Strength-weakening effect and shear-tension failure mode transformation mechanism of rockburst for fine-grained granite under triaxial unloading compression. Int. J. Rock Mech. Min. Sci. 2020, 131, 104347. [Google Scholar] [CrossRef]
- Ulusay, R. The ISRM Suggested Methods for Rock Characterization, Testing and Monitoring: 2007–2014; Springer International Publishing: Berlin/Heidelberg, Germany, 2014; Volume 15, pp. 47–48. [Google Scholar]
- Beck, J.V. Inverse Heat Conduction: Ill-Posed Problems; Wiley: New York, NY, USA, 1985. [Google Scholar]
- Chantasiriwan, S. Comparison of three sequential function specification algorithms for the inverse heat conduction problem. Int. Commun. Heat Mass Transf. 1999, 26, 115–124. [Google Scholar] [CrossRef]
- Collin, M.; Rowcliffe, D. Analysis and prediction of thermal shock in brittle materials. Acta Mater. 2004, 48, 1655–1665. [Google Scholar] [CrossRef]


Publisher’s Note: MDPI stays neutral with regard to jurisdictional claims in published maps and institutional affiliations. |
© 2021 by the authors. Licensee MDPI, Basel, Switzerland. This article is an open access article distributed under the terms and conditions of the Creative Commons Attribution (CC BY) license (https://creativecommons.org/licenses/by/4.0/).