Abstract
Machine learning has grown in popularity in recent years as a method for evaluating financial text data, with promising results in stock price projection from financial news. Various research has looked at the relationship between news events and stock prices, but there is little evidence on how different sentiments (negative, neutral, and positive) of such events impact the performance of stocks or indices in comparison to benchmark indices. The goal of this paper is to analyze how a specific banking news event (such as a fraud or a bank merger) and other co-related news events (such as government policies or national elections), as well as the framing of both the news event and news-event sentiment, impair the formation of the respective bank’s stock and the banking index, i.e., Bank Nifty, in Indian stock markets over time. The task is achieved through three phases. In the first phase, we extract the banking and other co-related news events from the pool of financial news. The news events are further categorized into negative, positive, and neutral sentiments in the second phase. This study covers the third phase of our research work, where we analyze the impact of news events concerning sentiments or linguistics in the price movement of the respective bank’s stock, identified or recognized from these news events, against benchmark index Bank Nifty and the banking index against benchmark index Nifty50 for the short to long term. For the short term, we analyzed the movement of banking stock or index to benchmark index in terms of CARs (cumulative abnormal returns) surrounding the publication day (termed as D) of the news event in the event windows of (−1,D), (D,1), (−1,1), (D,5), (−5,−1), and (−5,5). For the long term, we analyzed the movement of banking stock or index to benchmark index in the event windows of (D,30), (−30,−1), (−30,30), (D,60), (−60,−1), and (−60,60). We explore the deep learning model, bidirectional encoder representations from transformers, and statistical method CAPM for this research.
1. Introduction
Since the emergence of Web technology, Internet-based news media has become a significant medium for discovering and sharing information. Because of the quick and widespread transmission method, it is a potentially useful source of information about companies’ underlying values. The impact of Internet-based news articles on stock prices has been studied by several researchers [1,2]. The stock markets are influenced by a variety of news events, including domestic and international news [3]. Traders or investors usually sell stocks when they receive bad news. A poor earnings report, a breach of corporate governance, macroeconomic and political uncertainties, and unfortunate events all result in panic selling and a drop in the value of many, though not all, stocks. Investors are more likely to buy stocks when they receive good news. Positive economic indications, positive earnings reports, the debut of a new product, and corporate acquisitions all translate into purchasing momentum and a rise in stock prices. A company’s revenues or sales that achieved or failed to meet an expected figure are frequently mentioned in business news articles. Some announcements or news are company specific or influence a specific sector. In the Indian stock market, the news on RBI policies or announcements [4] and loan frauds can impact particularly the stocks of the banking sector [5].
1.1. Why the Banking Sector?
The banking sector accounts for 7–8% of India’s overall GDP. Since the liberalization of the economy in 1991, the Indian banking sector has experienced significant growth and transformation. Even though the banking sector is well-regulated, it faces several challenges, including economic difficulties and a lack of ethical norms. Recent studies show that financial crises harm growth and that assessing and measuring bank risk on a regular and timely basis is critical to preserving the banking system’s stability and profitability [6,7]. Another study mentions that fraud has grown significantly in number and value during the previous 10 years, according to the Reserve Bank of India’s annual report (2019) and the Economic Times’ article (2019) [5]. It also mentions that during 2009–2010, banks reported 4669 frauds worth 1998.94 crores, which increased to 6,801 frauds worth 71,542.93 crores by the end of 2018–2019. From 2009–2010 to 2018–2019, the number of incidents of fraud increased by 45.66%, with the sum implicated increasing by 35 times or more. Bank fraud has the potential to have severe economic and social effects. To measure the bank risks, one of the most often used indicators is the return volatility of banking stocks. These reasons have attracted us to study banking events and their impacts. Our study focuses on understanding and analyzing the impact of such events on the valuation of banks through the observations of banking stocks listed in Indian stock exchanges NSE and BSE.
Economists have conducted a significant number of studies to determine the correlations between news events and stock returns. Banking stocks can exhibit aberrant behavior as a reaction to socio-political events, bank risks, and other news events, according to economists. There has been no systematic effort to automate the tracking of such events and utilize them to analyze banking stocks. There have been individual initiatives to analyze Twitter sentiments or various banking activities, but to our knowledge, no integrated effort to examine the influence of specific categories of news events on banking stock movements exists. This might be owing to them being unable to compile a database of classifying several potentially important news events from the overall financial news articles that will have an influence on banking stocks in the immediate future. Further, we examine stock market performance and news articles together, like many of our counterparts, to discover strong and weak causal connections between various types of events and stock price changes depending on the polarity or tone of words in the news articles. The study does content analysis using the lexicon of Loughran and McDonald based on bag-of-words to see if the positive/negative sentiments of bank corporate governance news affect stock market performance. The authors then assess the impact of bank corporate governance news on financial markets, as well as whether the sentiments of the news influences the market returns [8]. They calculate positive (or negative) sentiments as (P-N)/(TW), where P and N are the frequency of positive and negative words in the news event, respectively, and TW is the total words. We contend that such basic quantitative measurements cannot adequately capture the impact of linguistics on a company’s fundamental values.
1.2. Sentiments in the News?
News articles, as well as the sentiment expressed in such articles, include a lot of information that may or may not be properly represented in stock market statistics. The finance community has shown an increased interest in using linguistic and text analysis tools to analyze this data automatically in the prospects of introducing contextual information to existing financial models. Integrating approaches from two fields, text and econometric analysis, has received a lot of attention in recent years [9,10], with systems being created to automate the process and combine the techniques and data processing activities [11]. Developing a system that can take these massive quantities of news content and calculate a model that can use it, is an exciting problem. The work discussed here is about developing a technique and implementation that can do text analysis and statistical modeling, with an emphasis on designing a framework that can be generalized to facilitate the study of several text sources, news categories, financial information, and time-series data.
Text sentiment analysis is a fast-growing discipline of natural language processing (NLP) that is currently broadly utilized in a variety of business applications, including algorithmic trading, social media analytics, consumer behavior, sales, and marketing. Such technologies have started to be utilized in economic and financial research in recent years. The study uses text sentiment analysis to determine the objective function of the central bank using meeting transcripts from the Federal Open Market Committee [12]. Another research study focuses on “lexical” methods that determine the sentiment of a piece of text based on the tone of the words within it. Such methods are based on lexicons, which are pre-defined collections of terms and sentiment ratings allied with them. They test several sentiment-scoring algorithms using a set of news items that have been hand-labeled with positive and negative sentiment [13]. While there are several techniques to generate sentiment, and the influence of news has been studied in multiple markets using diverse methodologies, some methods have made an effort to apply the same methodology to assess the impact of news in various markets in a common fashion. For example, classification-based techniques must be retrained for correct application across domains.
Our technique is novel in that it incorporates text sentiments classification using a pre-trained transformer model based on a supervised machine learning approach to classify various news categories, in particular banking domain terminology, into positive, negative, and neutral labels (sentiments groups) without requiring a huge amount of training data. After classifying the news events into sentiment labels positive, negative and neutral are further complied to measure their corresponding effects on the related stocks concerning events as well as without dividing them into events. In our work, first, the impact of news events is analyzed, and second, the impact of news events classified into sentiments positive, negative, and neutral is analyzed on the related banking stocks or the banking index.
1.3. Event Study?
On the surface, this appears to be a challenging process; however, an event study may be used to quickly build a measure that analyses the effects of a news event on the value of related stocks. An event study analyses the influence of a specific news category on the worth of a stock using financial market data. The value of such research derives from the statistic that, given market logic, the consequences of an event will be instantly observed in the stock price. Thus, stock prices monitored over time may be used to create a measure of the news event’s impact. Event studies have been used for several sector-specific events in the financial markets. Mergers and acquisitions, earnings releases, and macroeconomic factors such as the trade imbalance are just a few examples [14]. In our study, we propose a novel method to quantify the six different categories of news events and explore their impact on the short-term to long-term returns of the related stocks or the index. The following research question is the subject of this study:
Do news events (RBI announcements, government announcements, mergers or acquisitions, frauds, quarterly or annual results, ratings agencies’ or experts’ views) with varying sentiments (negative, neutral, or positive) have a significant impact on the stock prices of the bank or the banking index that has undergone events? The indicator created as an outcome may be applied to design trading and investing strategy in the future.
We are particularly interested in (1) definitive evidence of the relationship between Internet-based banking news events and their related banking stock in the Indian stock market; (2) analysing the influence of each banking news event; and (3) which news event sentiment is more powerful? This paper is organized as follows. In Section 2 the literature review is discussed, a methodology is defined in Section 3, the data mentioned in Section 4, the results are summarized in Section 5, and a conclusion is drawn in Section 6.
2. Literature Review
In the stock market, certain scheduled and unscheduled events may influence the company’s financial performance. The literature on fraud-related events shows that fraud harms a company’s profitability and shareholder value [5]. The objective of another research is to show that bank corporate governance news influences market returns [8]. However, the authors mentioned that bidders in stock mergers generate much more news articles after the commencement of merger discussions but before the public announcement. They also show how companies’ attempts to affect their stock price can skew the timing and substance of financial media reporting [15]. They believe that companies create and broadcast news to the media to affect the price of their shares during major business events. So, the researchers need to be more proactive pre and post events news publications or announcements. While the study of the press in political economics models has been ignored in the past, there is currently a growing collection of work on the subject. The model evaluates its empirical relevance and reconciles it with what is known about the media’s role in promoting political accountability [16]. Recent research looked at the impact of financial irregularity notifications on the value of a firm’s shares in the short term. The findings revealed that the announcement of a financial penalty had little effect on the value of the share in concern traded in Borsa Istanbul. They also acknowledged that before the announcement, the fines had been factored into the share price [17]. The impact of fake financial reporting on the (US stock market) NYSE, NASDAQ, and Over-the-Counter (OTC) capital markets was investigated in the past. The authors looked at disclosures of false financial reporting that were substantiated by the Securities and Exchange Commission (SEC) and published in the Wall Street Journal (WSJ) between 1990 and 1999. Event study-based regression analysis was used to investigate the impact of these announcements on financial markets. The study found that announcements have significant negative consequences the day before and on the day of the announcement [18]. In our study, we analyze the impact of banking news events and governmental news events on the banking stocks or index in Indian stock markets.
Empirical research also shows that event studies may be used to predict how the stock price will respond to a negative or positive announcement. They looked at how time-varying betas and event-induced variance played a role in estimating anomalous returns surrounding major news releases. They discovered price reversal trends after both negative and positive profit warnings by listed firms on the Hong Kong Stock Exchange [19]. According to another study, stock prices overreact to negative news included in profit warnings. They observe a substantial price reduction of roughly 3% around negative alerts in the [−1, +1] window and a big price gain of 7.81% in the [+2, +60] window. They look at how the market reacts to changes in experts’ stock risk ratings, as well as what kind of information such changes transmit. They discovered that when analysts adjust their risk assessments to a lower or higher level, stock prices rise or fall, even when other factors such as stock recommendations, price goals, profit predictions, and current news regarding company events are taken into account [20].
In recent years, algorithmic trading has developed as a major trend in financial portfolio management, because of advancements in processing power and the capacity of computers to analyze enormous quantities of such news events [21]. This, in combination with developments in the machine or deep learning and natural language processing (NLP), has propelled text data as a source of information for investing strategies. So far, sentiment analysis has been the most influential area of NLP in the stock market analysis [9]. They examined the relationship between the tone of news articles and market prices using sentiment analysis, indicating that media negativity can influence both trade volume and market prices.
Many techniques have been proposed in the literature based on feature selection for stock market analysis, according to news articles. The authors created a method to assess sentiment in financial news articles by extracting features from noun phrases and scoring them on a negative/positive subjectivity measure [22]. The authors improved accuracy by using a selection process based on a contextual entropy model that discovered comparable emotion words and their accompanying strengths from online stock market news events to extend a collection of seed words [23]. Using Chi-square feature selection with n-gram features, the authors also got good results [24]. An evolving algorithm was utilized to integrate trading rules utilizing technical indicators and events derived from the news with expert-defined impact scores to incorporate news into stock trading strategies [25]. They derived events from news messages that are given in plain text format with no annotations. They made use of the ViewerPro system based on a domain-specific knowledge repository, which is an ontology that contains attributes and lexical representations of financial entities (firms) and news events.
Financial market analysis has also been approached using deep learning approaches. The authors look into whether and to what extent it is feasible to trade on news sentiment, as well as if a deep learning technique would be a viable tool for doing so. They did feel, however, that deep learning technologies might pose a significant risk to the financial system as a whole, because of their propensity for “herd behavior”, and that they should be treated with caution [26]. However, another study evaluated that the deep learning model was more accurate than the SVM model. Following that, they utilized a neural tensor network to learn word and structured event embeddings as inputs to their stock market analysis models [27]. Following this research, the authors coupled recurrent and convolution layers with pre-trained word vectors to forecast changes in the S&P 500 index in the US stock market [28]. Following deep learning approaches for natural language processing (NLP), the authors of a recent paper propose using bidirectional encoder representations from BERT transformers to do sentiment analysis of news items and give useful information for stock market decision-making. A self-learning task is used to pre-train this model on a large number of general-domain texts. They manually categorized stock news items as positive, neutral, or negative to fine-tune their model on sentiment analysis for the stock market [29]. In a similar direction, in our study, we use a newer distilled version of BERT, DistilBERT [30], to perform the sentiment classification of the news events into positive, negative, and neutral.
Our objective is to show that financial news about banks influences their stock returns, based on the literature on news sentiments. We also look into whether news sentiments, as well as bank events extracted from financial news, may have a substantial impact on their stock returns. We concentrate on press sources since, as previously said [31], online newspapers are the primary source of financial information. From 2017 to 2021, we collected 10,000 financial news items, which were then divided into banking and non-banking categories, yielding 1000 news articles on Indian listed banks and other related domains (governmental and global news) reported by leading financial press sources. Using the sentiment classification based on DistilBert state-of-art NLP pre-trained transformer model, we conduct news sentiment analysis to analyze if the negative, positive or neutral sentiment of the news, also corresponding to banking news events, influences banking stock performance. The analysis of Indian banking stock prices based on banking, other co-related events, and sentiments classification using the state-of-art NLP technique [32] is one of the major novelties of the study.
3. Methodology
The research methods performed in the paper are described in this section. First, a text classification approach is utilized to extract banking events from financial news articles, and then a text analysis methodology is described for examining the information content of banking news events. The news events are classified into negative, positive, and neutral sentiments. The event study used to analyze the influence on stock market returns is detailed in the second part, and the econometric model that was used to explore the relationship with both the banking news events and news sentiments, and individual banks’ stock or index returns is provided in the final part.
3.1. Banking News Events Extraction
In our study, we want to separate news about the banking sector and its most related domains from the rest of the financial news as shown in Figure 1.
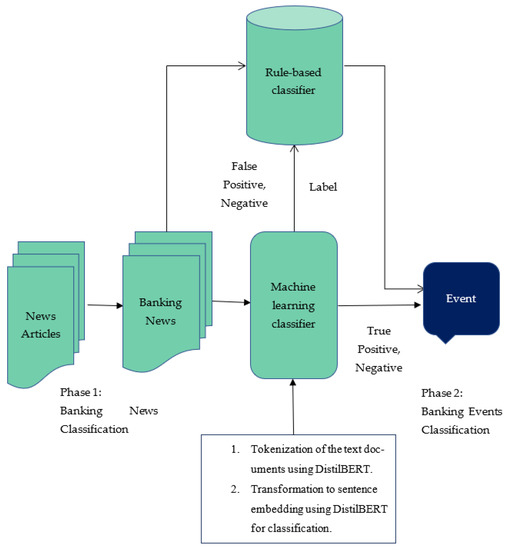
Figure 1.
Steps for news-event representation and classification using a hybrid approach of rule-based and machine learning model based on DistilBERT [32].
We believe that a country’s ‘banking news’ is most closely linked to its ‘governmental news events,’ which include information on government initiatives for good governance, state or national elections, changes or new developments in governmental policies, and ‘global’ financial news, which includes information on global trade, currency-commodity price changes, and global sentiments. So we have a four-class classification issue with a collection of news articles to extract banking and its most linked news, i.e., Government and Global, from the complete financial news articles. With a total of 10,000 instances, we opt to categorize the news items into banking, governmental, global, and non-banking categories. Non-banking news encompasses all financial news culled from different new portals that do not fall under these three categories (banking, governmental and global). The classification of textual news items is a two-step approach. The documents are retrieved in the first phase of our experiment using web scraping code developed in Python from various websites such as Bloomberg, Financial Express, and Moneycontrol. Following that, using manual labeling, news items are divided into four categories: Banking, non-banking, global, and governmental. The news articles are then trained and tested using the Random Forest algorithm to accomplish the categorization objective for a new set of news items. We’re particularly interested in categorizing banking and other closely connected news articles into seven events, discussed in later sections.
The task of identifying and extracting structured information about events in any text and assigning the right label is known as event extraction and classification. Because of the thoroughness of the collected data and its applicability to a variety of real-world situations, it has drawn the attention of many academics and industries. Furthermore, a growing number of ways to enhance the performance of event extraction systems and the quality of derived information from rule-based approaches to machine learning techniques have been presented. In our work, we employ a hybrid method [32] that combines these two techniques, rule based and machine learning, to get better results by utilizing both.
Our rule-based part, which is based on simple or complicated logical expressions of natural language processing, fine-tuned the base model further (DistilBERT for documents embedding+ Random Forest for classifier). In this area of our hybrid model, we have certain rule descriptions that can put such constraints on the terms that exist in news articles or not. For our implementation, however, a simplified rule language has been established to make rule creation easier. Each event label may be associated with one or more rules. Each rule is compared to the input news article to approve or reject a category, based on whether the input news item meets the rule’s criteria. Rejecting a label reduces the number of false positives produced by the classifier, which improves accuracy. By adding a new label, all false negatives are eliminated, and recall improves. The advantage of our approach is that by fine-tuning the classifier by defining unique rules for each label, we were able to improve the accuracy of our model by 1.0% over the baseline model. When compared to the expert’s efforts necessary to train the classifier on a training set containing a collection of documents for each label with stated rules, writing rules for each label did not require a significant expert workload.
3.2. Entity Recognition Using Modified NER and Deep Learning Approach
The challenge of finding and classifying named entities (people, locations, organizations, and so on) referenced in the unstructured text is known as named entity recognition (NER). This topic is employed in a variety of NLP applications, including machine translation, information extraction, and virtual agents, among others. The predefined categories into which the identified entities are grouped generally include items such as organizations, locations, times, currencies, personal names, and others.
Many breakthroughs in natural language processing have occurred in recent years in the NLP field, particularly the transition to transfer learning. Researchers have been able to obtain state-of-the-art results on numerous benchmarks due to models like ELMo, ULMFiT, Transformer, and OpenAI’s GPT, which have given the community huge pre-trained models with excellent performance. Rather than training new networks from start, lower layers of deep learning networks with millions of parameters learned on a single task may be reused and fine-tuned for different tasks, marking a change in NLP.
The introduction of Google’s BERT [33], which has been regarded as the start of a new era in NLP, is one of the most significant milestones in the advancement of NLP recently. For entity extraction from financial documents, the authors used a character-based approach. They have shown in research that NER models trained on labeled data from a source domain may be utilized as base models for identification of distinct named entity classes in a target domain, and then fine-tuned with a little amount of labeled data. The pre-trained BERT model produced state-of-the-art results [34]. Similarly, we use representations based on BERT in our financial NER model as a result of BERT’s performance in state-of-the-art models. The HuggingFace transformers library in python is used to fine-tune a pre-trained BERT model for identifying named entities in banking news events. We just need to fine-tune BERT in 2–4 epochs, although it is quite huge, sophisticated, and has millions of parameters. Because BERT was trained on a large quantity of data and has already encoded a lot of information about our language, this outcome is possible. BERT is one of the most powerful NLP models accessible right now, because of its impressive performance obtained in a short length of time with a little quantity of data.
The CoNLL Dataset [35] is used to demonstrate Named Entity Recognition. The input text files for our datasets are in the CoNLL format. In CoNLL datasets, there are 9 classes of NER tags:
O, Outside of a named entity
B-MIS, Beginning of a miscellaneous entity right after another miscellaneous entity
I-MIS, Miscellaneous entity
B-PER, Beginning of a person’s name right after another person’s name
I-PER, Person’s name
B-ORG, Beginning of an organization right after another organization
I-ORG, Organisation
B-LOC, Beginning of a location right after another location
I-LOC, Location
The goal of the experiment was to see how well the model performed for various entities in banking news events. We need to make an optimizer to fine-tune our Bert Classifier. The hyper-parameters are used: Batch size 16, learning rate 4e-5, and epochs 12. For every epoch, efficiency on the development dataset is assessed, and if performance has not improved for 12 epochs, training is discontinued. The test set is then evaluated using the best-performing model from the development set. Documents on news events from the banking sector are included in the dataset, with 60% being used as a training set, 25% as a test set, and 15% as a development set. We achieve 90.61% accuracy with a precision of 90% and recall 91.21%.
3.3. Sentiment Classification of News Events
As mentioned in the previous subsection, in the last two years, the growth of Transfer Learning methods in NLP through large pre-trained language models has become a basic method in numerous NLP tasks. It is not a misconception that BERT has significantly transformed the NLP paradigm. It is impressive that a single model, based on a pre-trained unlabelled dataset, can get state-of-the-art results on a variety of NLP tasks with little fine-tuning. In this phase, we utilize DistillBERT [30] to do sentiment analysis of news events using a distilled version of bidirectional encoder representations from transformers BERT. A self-learning task is used to pre-train this model on a large number of general-domain texts. We manually categorized seven banking news events as positive, neutral, or negative to fine-tune our powerful model on sentiment analysis for the banking stock or index analysis [36].
3.4. Event Study
We analyze how stock markets respond to banking news events, and if so, how these reactions differ depending on if the news is positive, negative, or neutral. As shown in Figure 2, Canara Bank announced its Q4 results in May 2019, with a decreased deficit for the fiscal year 2018–19. In a month, the stock has risen from 280 INR to a high of 300 INR. During the same time, the Indian government announced a proposal to inject capital into PSU banks. Investors’ moods have improved as a result of it. However, as the union budget was announced at the same time, the PSU banks took a heavy hit. In addition, the news began targeting PSU banks on non-performing loans, which peaked in FY20. Canara Bank’s shares have plunged to INR 210 in September 2019. Canara Bank said on 9 December 2019, that it will dilute 30% of its interest in Can Fin Homes with premium. In December 2019, the Indian government also addressed the problem of economic stagnation. Canara Bank was given a buy signal by the expert in mid-December 2019, and the stock has since recovered to 230 INR levels on 23 December 2019. This example demonstrates how events contained in news messages might be useful in financial applications.
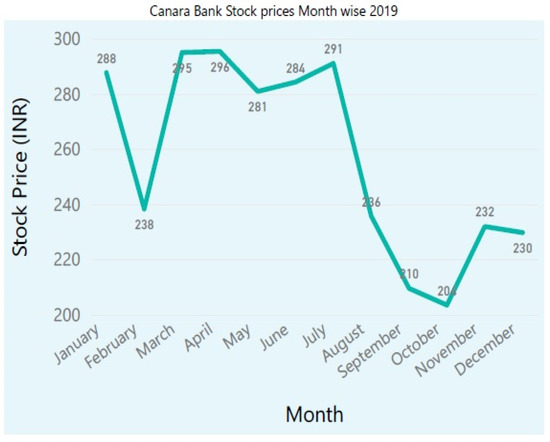
Figure 2.
Movement of the Stock price of Canara Bank (NSE) for month-wise 2019 [32].
The influence of six banking and governmental events on Indian bank stock or index returns is analyzed using the event study technique. This method calculates abnormal returns after a banking news event is introduced to the public on the day . The release of the banking news event explains variations in the stock prices of the respective bank or index (Bank Nifty). The difference between the actual returns of a bank’s stock or index reported on the day and the predicted returns that the bank’s stock or index would have shown in the absence of the event is computed as abnormal returns. The three-factor model is used to calculate expected returns [37]. The model includes a US factor, a global financial factor, and a domestic market factor . Because the three factors are all value-weighted market indices, the model can theoretically integrate distinct CAPMs as special cases: When the β’s on the first two factors are zero, the model becomes a domestic CAPM; when the β’s on the domestic factor are zero, the model becomes a world CAPM.
where, is the stock return, is the intercept, and is a three-dimensional vector of factor sensitivities for bank on day . The idiosyncratic component is . Banks might be more or less international depending on their business models. We use the model to estimate abnormal returns, a factor model CAPM [38]. As a result, the market rate of return factor in the factor vector drive the systematic component of returns.
For day , the abnormal return due to any of six banking news events of bank is computed as follows
On day , the average abnormal return () is calculated as the average abnormal stock return for all n bank shares.
The CAR is calculated as the sum of the average abnormal returns for all days in the event window for each stock ,
By calculating the average CARs for all n shares, we may estimate the mean CARs in the event windows (CAR (1, 2)).
The statistical significance of the CARs estimations is determined using the Standardised Cross-Sectional t-test method [39].
4. Data
Using python-written code, we scraped news from public news sources such as Bloomberg, Financial Express, Money Control, and Times of India for our experiment. As a consequence, from 2017 to 2020, we have gathered almost 10,000 instances of financial news articles. The news articles are related to a variety of events. We’d like to categorize the banks and other most connected news items into seven events; Fraud, Global, Governmental, Merger or Acquisition, RBI Policies, Ratings Agencies or Expert’s View, and Results. The data was obtained using a python script that was running many times each day. The banking and other most connected news were separated and categorized from financial news in phase-1 of the model so that news articles relating to our area of interest could be entertained in phase-2 [32].
In this phase-2, we also performed sentiment classification [36] of the news events mentioned in Table 1. The following banking news events were manually labeled as positive, negative, or neutral: Fraud, Global, Governmental, Merger or Acquisition, RBI Policies, Ratings Agencies or Expert’s View, and Results. Even for domain experts, the categorization of financial news events is imprecise. The complexity of financial news is to blame for a lot of the confusion. The interpretation of a banking financial event will be significantly influenced by announcements of projected quarterly results, analyst terminology used during ratings, and perceptions of RBI policies, among other things. The annotator’s knowledge is required for labeling or annotation of news events into the appropriate polarity. The DistilBERT model is fine-tuned with our data set before being put into the Random Forest supervised machine learning classifier.

Table 1.
Stock market variables.
In phase-3, in this paper, we explore the link between CARs and news sentiments following banking news events using block stepwise ordinary least squares (OLS) regressions with robust standard errors. The CAR, which is derived from the event study data, is the dependent variable. We created a variety of event windows ranging in size from 120 days (−60 to +60) to zero days (i.e., a calculation carried out for a single day). The statistical significance of the CARs estimations is determined using the Standardised Cross-Sectional Z test method. The variables utilized to study the relationship between banking news events and stock and bank nifty (Indian stock market) return reactions are listed in Table 1. It shows the total abnormal stock returns across several event windows. Table 2 shows factors related to banking news events and sentiments, which describe communication tone. The following is the form of our equation:
where and are the intercept and slope coefficient of the OLS regression model respectively, represents the news articles and , and the variable F represents the
Table 2.
News Events factors.
- (i)
- category of news events, and
- (ii)
- the polarity of news events
5. Experimentation Results and Analysis
We split our overall sample into three subsamples to see if news with a negative polarity, a positive polarity, or a neutral polarity influences market reactions to banking news events.
In Table 3, we find highly statistically significant mean CARs of 0.6%, −0.8%, and −1.48% in the event windows (−1,D), (D,1), and (−1,−1), respectively, surrounding the publication day of the banking news event. Following the immediate announcement of the negative banking news event, negative CARs were found in the event window (D,1), and (−1,−1). It means the investors have reacted in the same direction as the tone of news events. We also find a statistically significant mean CAR of −2.48% in the event window of (D,30). It means that the effect of the negative banking news events sustained for one month period after the publication of news events. The significant mean CAR of −5.13% is shown in the event window of (−30,30). Therefore, it is interpreted that the negative banking news events can make a negative effect on the banking stock index for a short to medium time.
Table 3.
The impact of banking news events with different polarities or tones of communication on Bank stock or Bank Nifty returns.
The banking stock index, on the other hand, does not appear to counter to positive and neutral banking news events, as seen by mean CARs that are not statistically significant in all event windows except we get statistically significant negative CARs of −1.72% and −2.87% in the event window of (D,5) and (D,30), respectively, even after the publication of positive banking news events. However, the mean CARs are positive before the publication of banking news events with a positive tone of communication in all the event windows (−1, D), (−5,−1), (−30,−1), and (−60,−1). Moreover, the mean CARs covert to negative for all the event windows after the publication of positive tone of the banking news event (D,1), (D,5), (D,30), (D,60), but not the statistically significant. We can still take this as evidence that the banking index can predict news events with a positive tone before they occur but significant. The findings in Table 3 show that the banking news events’ polarity has a significant influence on banking index returns; negative news, as compared to positive and neutral news events, seems to be informational.
To examine the possible influence of tone, we construct three different subgroups of each news event: Negative (Fraud, Global, Governmental, Merger or Acquisition, RBI Policies, Ratings Agencies or Expert’s View, and Results), positive (Fraud, Global, Governmental, Merger or Acquisition, RBI Policies, Ratings Agencies or Expert’s View, and Results), and neutral (Fraud, Global, Governmental, Merger or Acquisition, RBI Policies, Ratings Agencies or Expert’s View, and Results). Due to the lack of such a category of news items in the data set, data for one or more news events is missing in each subsample. Due to the lack of news items with particular polarity in the data set, data for one or more news events are missing in each subsample.
The findings in Table 4 support and expand on earlier findings, indicating that the tone of news events has a significant influence on stock market returns. The greater influence of negative ‘Fraud’ news event on bank stock or the bank index returns tends to be in almost all the event windows (−60,60), (−30,30), (−1,1), (−60,−1), (−30,−1), (−1,D), (D,1), (D,5), (D,30), (D,60) that exhibit statistically significant mean CARs equal to −23.78%, −18.57%, −2.54%, −14.38%, −12.38%, −0.27%, −2.31%, −6.07%, −7.96%, −11.80%, respectively. It indicates that the impact of negative ‘Fraud’ news events lasted for a long time after the news had been published.
Table 4.
The impact of megative polarity or tone of online banking news events publication on bank stock or Bank Nifty returns.
The significant outcomes before the publication of any of the news events are interpreted as confirmation that the stock market may predict news with negative sentiments. Moreover, the negative CARs are observed in almost all the event windows before the date of publication of all negative news events shown in Table 4. Though there are statistically significant results seen before the publication of news articles on RBI policies, the negative CARs are seen only around the date of publication with CAR −1.02% and −1.01% in the event window (−1,D) and (−1,1) respectively. It means the negative tone of news articles on RBI policies may impact returns for 1–2 trading sessions around the news publication day. It may not impact the returns much at any time. Similarly, the negative CARs are seen before the publication of negative news on Governmental policies but with only significant CAR −0.69% in the event window (−1,1). The impact of the negative news on the Results event is seen in banking stock returns for a short time. The negative significant CARs are found in the symmetric event window (−5,5), and another event window (−30,−1) with CARs −3.8% and −10.32%, respectively. It gives a piece of evidence that the stock market may anticipate the negative quarterly or annual results of the banking stocks and it can impact the returns for a short time. It is also shown that the impact of news publication on negative views of Rating agencies and Experts on the banking stocks is not statistically significant.
As Table 3 shows that the banking stock index does not appear to counter to positive and neutral banking news events, as evidenced by mean CARs that are not statistically significant in all event windows, except for event windows (D,5) and (D,30) with statistically significant negative CARs of −1.72% and −2.87%, even after the publication of positive banking news events. It means stock markets anticipate the positive news and investors book profits after the online publication of positive news and positive reaction does not sustain after the publication of positive tone of news events. This is also supported with the evidence of publication of positive tone of news event on ‘Results’, as indicated in Table 5. The statistically significant negative CAR −3.74% is shown in the event window of (D,5).
Table 5.
The impact of positive polarity or tone of online banking news events publication on bank stock or Bank Nifty returns.
It is also indicated, in Table 5, that even the positive tone of news published on event ‘Merger or Acquisition’, the statistically significant negative CARs are seen in the event windows (D,1), (D,5), (D,30) after the date of news publication with CAR −1.99%, −3.65%, −7.68%, respectively. The negative impact of even positive tone of news event ‘Merger or Acquisition’ increases from a day of an online news publication or announcement and sustains for a month. The negative CARs are also seen before the publication of news on event ‘Merger or Acquisition’ and, moreover, statistically significant in the symmetric event windows (−5,5) and (−30,30) with CAR −3.48% and −11.42%, respectively. It means stock markets react negatively to pre or post-announcement of news events on ‘Merger or Acquisition’ in banks for the short to medium term. However, the CAR turns positive with 3.76% in the event window (D,60), i.e., two months post-announcement of banks’ mergers, also suggested by [40,41] in the post-announcement analysis of bank mergers. Another paper demonstrates on European banks’ mergers that target bank shares have significant positive abnormal returns, but bidding bank shareholders have no significant abnormal returns [42,43].
Whenever, there are positive announcements on banks’ by Ratings agencies or Experts, the banking stock index tends to appear statistically significant but with negative CARs −7.74%, and −12.60% in the event window (D,30), and (D,60), respectively. Before the announcements or ratings by the agencies or experts on the banking stocks or index has made published online, banking stocks or banking index has shown positive CARs that were too statistically significant in the event window (−5,−1) with CAR 3.24% and other event windows too but not statistically significant. It means when banking stock or index has been shown a positive trend, the rating agencies or experts give their positive announcements. However, stock or index tends to give negative returns post-announcements by Market experts even with positive sentiments.
It is noticeable that announcements or news publications on events ‘RBI_Policies’ and ‘Governmental’ with a positive tone or sentiment have a significant positive impact on banking stocks or banking index. Table 5 has shown positive CARs in all the event windows after the online publication of news articles with a positive tone or sentiments on RBI policies and governmental policies and, moreover, they are statistically significant in the event window (D,60) with CARs 10.32% and 3.79%, respectively. It shows that banking stocks or the banking index perform aligned with positive tone or sentiments of news events on RBI_Policies and national Government.
The results shown in Table 6 are interesting to discuss for all the news events mentioned in the table. Though Table 3 shows that the banking stock index does not appear to react to neutral and positive banking news events collectively. However, Table 6 shows that banking stocks or the banking index perform positively with positive CARs pre and post-announcements with even neutral sentiments or tone of communication in almost all the event windows, especially statistically significant in the event windows of the pre-online publication of news as well as symmetric event windows for RBI_Policies and Governmental news events. However, banking stocks do not show abnormal returns during online publication of neutral views or announcements by Market Experts and Rating Agencies on banking stocks except one event window pre-publication date (−1,D) with −0.46% CAR. However, even neutral sentiments or tone of communication on banks’ mergers or acquisitions strongly impact the markets. It has shown negative CARs post-announcements in all the event windows, especially statistically significant in the event window (D,60) with CAR −8.02%. Though only the news articles with positive and neutral sentiments or tone of communication available for news event ‘Merger_Or_Acquisition’ in the data set, the banking stocks or the banking index has reacted negatively with statistically significant abnormal returns, as shown in Table 5 and Table 6.
Table 6.
The impact of neutral polarity or tone of online banking news events publication on bank stock or Bank Nifty returns.
6. Conclusions
News events or online news articles can contribute to the building of investor sentiment; therefore, online media has a considerable influence on financial markets. This research explores the connections between online news events and stock market returns, concentrating on the influence of a selection of banking and government news events reported in major online news portals between 2018 and 2021 on abnormal stock returns. The study takes into account the potential that the type of news event and the polarity or tone of communication impact the returns of banking stocks.
The results indicate that the effect of the news on events (Fraud, Governmental, Merger or Acquisition, RBI Policies, Ratings Agencies or Expert’s View, and Results) with negative tone sustained for one month period after the publication day of news. The significant mean CAR of −5.13% is shown in the symmetric event window of (−30,30). It also provides evidence that the stock market may anticipate negative quarterly or annual results from banking firms and that this might have a short-term influence on returns. Significant outcomes before the event date are interpreted as confirmation that stock markets may predict negative news events. This confirms earlier studies that show stock markets behave differently before, during, and after the announcement of negative news. We also found evidence that banking stocks or the banking index react more negatively to the negative tone or sentiments of the banking news events.
Our findings have some significance. To begin with, banking index overreactions to negative news suggest that the market is concerned about good and effective government and banking policies. News publications with positive or even neutral sentiment on the events ‘RBI Policies’ and ‘Governmental announcements’ have a significant positive impact on banking stocks or banking indices, which is statistically significant in the event window (D,60) with CARs of 10.32% and 3.79%, respectively. However, investors dislike merger-related news for even thriving banks, according to the study; therefore, they prefer to sell their stocks. Furthermore, even with positive sentiments, banking stocks or the banking index returns tend to be negative following market experts’ statements.
Author Contributions
Conceptualization, V.D., A.S. and S.V.; methodology, V.D.; software, V.D., A.S. and S.V.; validation, V.D., A.S., S.V., A.A., and W.A.; formal analysis, V.D.; investigation, V.D., A.S., S.V., A.A. and W.A.; resources, V.D., A.S., S.V., A.A. and W.A.; data curation, V.D.; writing—original draft preparation, V.D.; writing—review and editing, V.D., A.S., S.V., A.A. and W.A.; visualization: V.D., A.S., S.V., A.A. and W.A.; supervision, A.S., S.V.; project administration, V.D., A.S., S.V., A.A. and W.A. All authors have read and agreed to the published version of the manuscript.
Funding
This research was funded by Taif University Researchers Supporting Project number (TURSP-2020/254), Taif University, Taif, Saudi Arabia.
Institutional Review Board Statement
Not applicable.
Informed Consent Statement
Not applicable.
Data Availability Statement
Not applicable.
Conflicts of Interest
The authors declare no conflict of interest.
References
- De Carosia, A.E.O.; Coelho, G.P.; da Silva, A.E.A. Investment Strategies Applied to the Brazilian Stock Market: A Methodology Based on Sentiment Analysis with Deep Learning. Expert Syst. Appl. 2021, 184, 115470. [Google Scholar] [CrossRef]
- Chowdhury, S.G.; Routh, S.; Chakrabarti, S. News analytics and sentiment analysis to predict stock price trends. Int. J. Comput. Sci. Inf. Technol. 2014, 5, 3595–3604. [Google Scholar]
- Alqahtani, A.; Hammoudeh, S.; Selmi, R. Relationship between different sources of geopolitical risks and stock markets in the GCC region: A dynamic correlation analysis. Rev. Behav. Financ. 2021. Ahead-of-Print. [Google Scholar] [CrossRef]
- Chundakkadan, R.; Sasidharan, S. Monetary Policy Announcement and Stock Returns: Evidence from Long-Term Repo Operations in India. Asian Econ. Lett. 2021, 3, 27117. [Google Scholar] [CrossRef]
- Sharma, D.; Verma, R. Reaction of Stock Price to Frauds’ Announcements: Evidence from Indian Banking Sector. Asia-Pac. J. Manag. Res. Innov. 2020, 16, 157–166. [Google Scholar] [CrossRef]
- Goel, T.; Lewrick, U.; Tarashev, N. Bank capital allocation under multiple constraints. J. Financ. Intermed. 2019, 44, 100844. [Google Scholar] [CrossRef]
- Ho, K.-Y.; Shi, Y.; Zhang, Z. News and return volatility of Chinese bank stocks. Int. Rev. Econ. Financ. 2020, 69, 1095–1105. [Google Scholar] [CrossRef]
- Carlini, F.; Cucinelli, D.; Previtali, D.; Soana, M.G. Don’t talk too bad! stock market reactions to bank corporate governance news. J. Bank. Financ. 2020, 121, 105962. [Google Scholar] [CrossRef]
- Tetlock, P.C. Giving Content to Investor Sentiment: The Role of Media in the Stock Market. J. Financ. 2007, 62, 1139–1168. [Google Scholar] [CrossRef]
- Xing, F.Z.; Cambria, E.; Welsch, R.E. Natural language based financial forecasting: A survey. Artif. Intell. Rev. 2017, 50, 49–73. [Google Scholar] [CrossRef]
- Li, X.; Xie, H.; Chen, L.; Wang, J.; Deng, X. News impact on stock price return via sentiment analysis. Knowl. Based Syst. 2014, 69, 14–23. [Google Scholar] [CrossRef]
- Shapiro, A.H.; Francisco, F.R.B.O.S.; Wilson, D.J. Taking the Fed at its Word: A New Approach to Estimating Central Bank Objectives Using Text Analysis. Fed. Reserv. Bank San Fr. Work. Pap. Ser. 2019, 02, 1–74. [Google Scholar] [CrossRef][Green Version]
- Shapiro, A.H.; Sudhof, M.; Wilson, D.J. Measuring news sentiment. J. Econom. 2020. [Google Scholar] [CrossRef]
- MacKinlay, A.C. Event studies in economics and finance. J. Econ. Lit. 1997, 35, 13–39. [Google Scholar]
- Ahern, K.R.; Sosyura, D. Who Writes the News? Corporate Press Releases during Merger Negotiations. J. Financ. 2014, 69, 241–291. [Google Scholar] [CrossRef]
- Besley, T.; Prat, A. Handcuffs for the Grabbing Hand? Media Capture and Government Accountability. Am. Econ. Rev. 2006, 96, 720–736. [Google Scholar] [CrossRef]
- Eryigit, M. Short-term performance of stocks after fraudulent financial reporting announcement. J. Financ. Crime 2019, 26, 464–476. [Google Scholar] [CrossRef]
- Cox, R.A.; Weirich, T.R. The stock market reaction to fraudulent financial reporting. Manag. Audit. J. 2002, 17, 374–382. [Google Scholar] [CrossRef]
- Yin, S.; Mazouz, K.; Benamraoui, A.; Saadouni, B. Stock price reaction to profit warnings: The role of time-varying betas. Rev. Quant. Financ. Account. 2017, 50, 67–93. [Google Scholar] [CrossRef]
- Tumurkhuu, T.; Wang, X. The Relationship between the Profit Warning and Stock Returns: Empirical Evidence in EU Markets. 2010. Available online: http://umu.diva-portal.org/smash/get/diva2:394405/FULLTEXT01.pdf (accessed on 1 November 2021).
- Ruta, D. Automated Trading with Machine Learning on Big Data. In 2014 IEEE International Congress on Big Data; IEEE: Anchorage, AK, USA, 2014; pp. 824–830. [Google Scholar]
- Schumaker, R.P.; Zhang, Y.; Huang, C.-N.; Chen, H. Evaluating sentiment in financial news articles. Decis. Support Syst. 2012, 53, 458–464. [Google Scholar] [CrossRef]
- Yu, L.-C.; Wu, J.-L.; Chang, P.-C.; Chu, H.-S. Using a contextual entropy model to expand emotion words and their intensity for the sentiment classification of stock market news. Knowl. Based Syst. 2013, 41, 89–97. [Google Scholar] [CrossRef]
- Hagenau, M.; Liebmann, M.; Neumann, D. Automated news reading: Stock price prediction based on financial news using context-capturing features. Decis. Support Syst. 2013, 55, 685–697. [Google Scholar] [CrossRef]
- Nuij, W.; Milea, V.; Hogenboom, F.; Frasincar, F.; Kaymak, U. An Automated Framework for Incorporating News into Stock Trading Strategies. IEEE Trans. Knowl. Data Eng. 2013, 26, 823–835. [Google Scholar] [CrossRef]
- Vicari, M.; Gaspari, M. Analysis of news sentiments using natural language processing and deep learning. AI Soc. 2021, 36, 931–937. [Google Scholar] [CrossRef] [PubMed]
- Ding, X.; Zhang, Y.; Liu, T.; Duan, J. Deep learning for event-driven stock prediction. In Twenty-Fourth International Joint Conference on Artificial Intelligence; AAAI Publications: Menlo Park, CA, USA, 2015. [Google Scholar]
- Di Persio, L.; Honchar, O. Artificial neural networks architectures for stock price prediction: Comparisons and applications. Int. J. Circuits Syst. Signal Process. 2016, 10, 403–413. [Google Scholar]
- Sousa, M.G.; Sakiyama, K.; Rodrigues, L.D.S.; Moraes, P.H.; Fernandes, E.R.; Matsubara, E.T. BERT for Stock Market Sentiment Analysis. In Proceedings of the 2019 IEEE 31st International Conference on Tools with Artificial Intelligence (ICTAI), Portland, OR, USA, 4–6 November 2019; pp. 1597–1601. [Google Scholar]
- Sanh, V.; Debut, L.; Chaumond, J.; Wolf, T. DistilBERT, a distilled version of BERT: Smaller, faster, cheaper and lighter. arXiv 2019, arXiv:1910.01108. [Google Scholar]
- Davis, A. The role of the mass media in investor relations. J. Commun. Manag. 2006, 10, 7–17. [Google Scholar] [CrossRef]
- Dogra, V. Banking news-events representation and classification with a novel hybrid model using DistilBERT and rule-based features. Turk. J. Comput. Math. Educ. (TURCOMAT) 2021, 12, 3039–3054. [Google Scholar]
- Devlin, J.; Chang, M.W.; Lee, K.; Toutanova, K. Bert: Pre-training of deep bidirectional transformers for language understanding. arXiv 2018, arXiv:1810.04805. [Google Scholar]
- Francis, S.; Van Landeghem, J.; Moens, M.-F. Transfer Learning for Named Entity Recognition in Financial and Biomedical Documents. Information 2019, 10, 248. [Google Scholar] [CrossRef]
- Sang, E.F.; De Meulder, F. Introduction to the CoNLL-2003 shared task: Language-independent named entity recognition. arXiv 2003, arXiv:cs/0306050. [Google Scholar]
- Dogra, V.; Singh, A.; Verma, S.; Jhanjhi, N.Z.; Talib, M.N. Analyzing DistilBERT for Sentiment Classification of Banking Financial News. In Intelligent Computing and Innovation on Data Science; Springer: Singapore, 2021; pp. 501–510. [Google Scholar]
- Bekaert, G.; Ehrmann, M.; Fratzscher, M.; Mehl, A. The Global Crisis and Equity Market Contagion. J. Financ. 2014, 69, 2597–2649. [Google Scholar] [CrossRef]
- Jagannathan, R.; Wang, Z. The CAPM Is Alive and Well; Federal Reserve Bank of Minneapolis: Minneapolis, MN, USA, 1993. [Google Scholar]
- De Winter, J.C. Using the Student’s t-test with extremely small sample sizes. Pract. Assess. Res. Eval. 2013, 18, 10. [Google Scholar]
- Tan, H.B.; Hooy, C.W. Bank merger and bank stock volatility: A post-announcement analysis. Manag. Financ. 2004, 30, 29–47. [Google Scholar] [CrossRef]
- Verma, S.; Dickerson, J.; Hines, K. Counterfactual Explanations for Machine Learning: Challenges Revisited. arXiv 2021, arXiv:2106.07756. [Google Scholar]
- Kumar, M.; Mukherjee, P.; Verma, K.; Verma, S.; Rawat, D.B. Improved Deep Convolutional Neural Network Based Malicious Node Detection and Energy-Efficient Data Transmission in Wireless Sensor Networks; IEEE Transactions on Network Science and Engineering: New York City, NY, USA, 2021. [Google Scholar]
- Rad, A.T.; Van Beek, L. Market valuation of European bank mergers. Eur. Manag. J. 1999, 17, 532–540. [Google Scholar] [CrossRef]


Publisher’s Note: MDPI stays neutral with regard to jurisdictional claims in published maps and institutional affiliations. |
© 2021 by the authors. Licensee MDPI, Basel, Switzerland. This article is an open access article distributed under the terms and conditions of the Creative Commons Attribution (CC BY) license (https://creativecommons.org/licenses/by/4.0/).