
Bi-Level Phase Load Balancing Methodology with Clustering-Based Consumers’ Selection Criterion for Switching Device Placement in Low Voltage Distribution Networks

 ,
,  ,
,  ,
,
Abstract
:
1. Introduction
- investments in the technical infrastructure of the actual EDNs to achieve flexibility able to adapt to new requirements;
- increasing the automation degree in the EDNs to ensure the resilience and integration of the distributed generation sources for an optimal operation;
- optimizing the topology to ensure continuity in the energy supply of the consumers.
1.1. Literature Review
1.2. Contributions
- From the literature review, our decision-making strategy, included in the first step of the methodology, for the placement of the switching devices in the LV distribution networks is the first that contains a clustering-based consumers’ selection criterion. A qualification index was defined to select the optimal number of the consumers’ candidate groups in the decision-making process. This strategy significantly reduces the investments and overheads involved in network management for the DNO.
- Developing a new PLB algorithm that aims minimization of the unbalance factor at the SP level while ensuring that the unbalance constraints are satisfied at all poles where selected consumers in the first level are connected. The fast convergence and high accuracy represent strengths compared with other algorithms. Hence, the conflicting goals of accuracy and convergence speed are simultaneously achieved.
- Presenting a comparative study between full and low implementation degrees of the PLBE to demonstrate the effectiveness of the proposed decision-making methodology in a real EDN with complex topology and a high number of consumers.
1.3. Paper Organization
2. Materials and Methods
- The first level integrates the K-means clustering-based algorithm to select the “candidate” groups containing 1-P consumers where the phase load balancing equipment (PLBE) could be installed, with a significant influence on the minimization of unbalance factor; the clustering simplifies the selection process leading at a relatively small number of 1-P consumers with the PLBE installed.
- The second level includes an improved iterative PLB algorithm to minimize the unbalance factor at the SP level, subject to the constraints where its value must be below an imposed limit by the decision-maker (DM) at poles with 1-P consumers from the “candidate” groups connected.
2.1. The First Level—Selecting “Candidate” Consumer Groups
2.1.1. Input Data
2.1.2. Clustering Process
- Calculation of the maximum number of clusters based on the formula [45]:
- Clustering: K-means clustering method is used for each partition in the Ck clusters, k = 2, …, Kmax, using the input data matrix.
- Evaluating the quality of partition: The evaluation is based on the silhouette coefficient calculated with the relation [46]:where: Nr and Ns—the number of the consumers assigned to the clusters r and s; dist(IDi, IDj)—the Euclidean distance in the two-dimensional space between the i-th and j-th rows from the matrix [ID*].
- Iterative process: Repeat Steps 2 and 3 (Clustering and Evaluating the quality of partition) to evaluate the quality of partitions between 2 and Kmax. The values of SC are recorded for each partition in the vector QP = [SC(2), SC(3), …, SC(Kmax)].
- Determining the optimal number of clusters through the calculation of the maximum value from the vector QP, SCmax. The partition with the value SCmax is associated with the optimal number of clusters, Ck,opt.
2.1.3. Selecting the “Candidate” Consumer Groups
2.2. The Second Level—Phase Load Balancing Process
- Applying in the real EDNs, with complex topologies and a high number of 1-P consumers.
- Use in the first level a clustering-based selection criterion, easy to implement in the decision-making strategies, to obtain the “candidate” groups of the 1-P consumers which participate in the PLB process, with significant influence on the minimization of the unbalance factor. This criterion is easy to implement in any decision-making strategy.
- Integration into the second level an iterative PLB algorithm that aims minimization of the unbalance factor at the SP level, subject to the constraints regarding its value below an imposed limit at the poles where the 1-P consumers from the “candidate” groups are connected. The fast computational time and convergence speed represent strengths compared with other algorithms.
2.3. Integration of the Methodology in a Smart Balancing System
- the communication infrastructure has a high-speed data transmission,
- the data concentrator located at the SP level, which integrates the decision-making module, has superior performances (high data acquisition and processing speed),
- the SD, integrated into the PLBE, performs fast switching between phases of the 1-P consumers.
3. Case Study
4. Conclusions
Supplementary Materials
Author Contributions
Funding
Conflicts of Interest
Nomenclature
| 1-P | Single-phase consumer; |
| 3-P | Three-phase consumer; |
| APL | Active power losses; |
| C | Constraint; |
| CO | Cost optimization; |
| CP | Consumption point associated with the 1-P and 3-P consumer; |
| DN | Distribution Network; |
| DNO | Distribution Grid Operator; |
| DM | Decision-Maker; |
| FID | Full implementation degree |
| LV | Low voltage; |
| MμG | Multiple-microgids; |
| OF | Objective function; |
| PEVs | Plug-in electric vehicles; |
| PLB | Phase load balancing; |
| PLBE | Phase load balancing equipment; |
| SBS | Smart balancing system; |
| SD | Switching device; |
| SMS | Smart Metering System; |
| SM | Smart meter; |
| SP | Supply point; |
| STS | Static Transfer Systems; |
| UC | Unbalance current; |
| UV | Unbalance voltage; |
| UF | Unbalance factor; |
| μG | Microgrid |
| Ck,opt | Optimal number of clusters; |
| dist(IDi,IDj) | Euclidean distance in the two-dimensional space between the i-th and j-th consumers; |
| Dmin, Dmax | Minimum and maximum values determined of all distances calculated for the consumers, [km]; |
| Dn | The distance between the supply point and the pole where the consumer n is connected, [km]; |
| Dn* | The normalized value of the distances between the pole to which the consumer n is connected and SP; |
| [D] | Vector of the distances; |
| GC | The “candidate” consumer groups for the PLBE placement; |
| GI | The ignored consumer groups (without PLBE); |
| Gi | The degree of importance; |
| h | The hour when the PLB process unfolds; |
| H | The analyzed period, [hours]; |
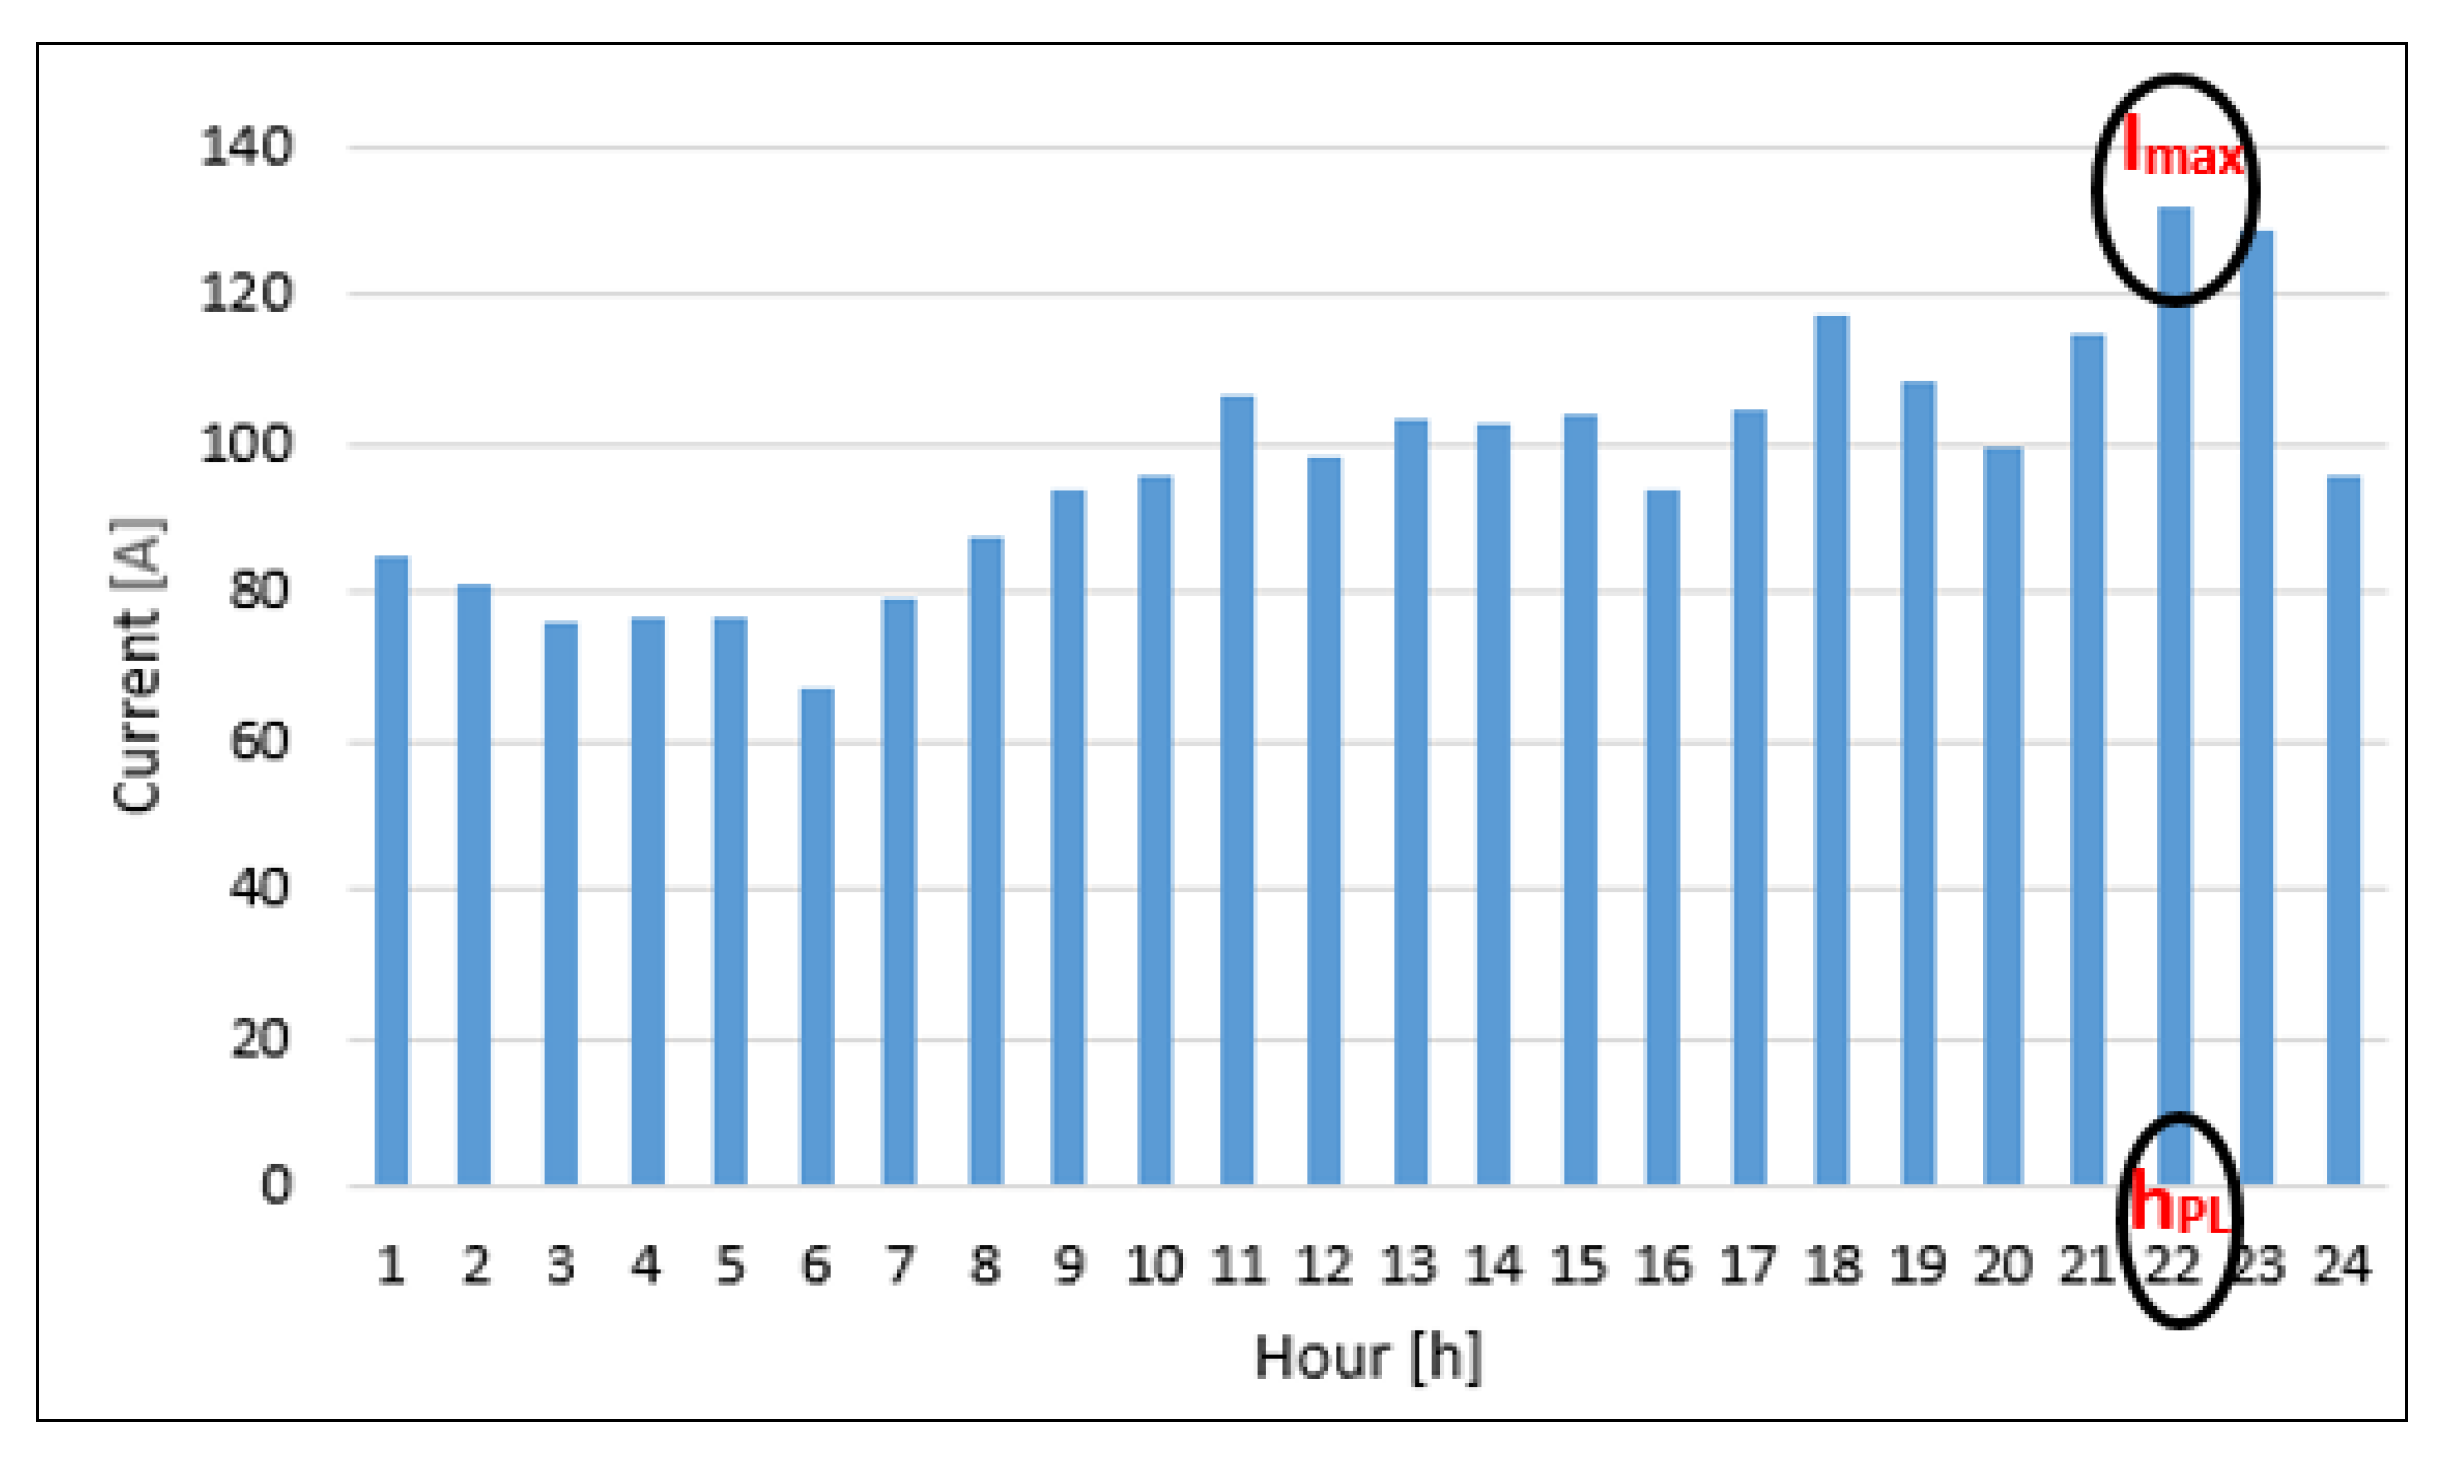
| I(SP)max | The maximum value of the total current at the LV level of SP, [A]; |
| Iav(hPL) | The average value of the phase currents at the SP level and hour hPL, [A]; |
| I(h)av,SP | The hourly average phase current at SP level, [A]; |
| I(h)av,P | The hourly average value of the phase currents at the pole P, [A]; |
| In,hPL | The requested current by the consumer n, at the hour hPL, [A]; |
| I*n,hPL | The normalized value of the requested current by a consumer n, at hour hPL, [A]; |
| IhPL,min | Minimum value from all requested currents by the consumers at hour hPL, [A]; |
| IhPL,max | Maximum value from all requested currents by the consumers at hour hPL, [A]; |
| Ip(hPL) | The total current on the phase p, at the LV level of SP and hour hPL, [A]; |
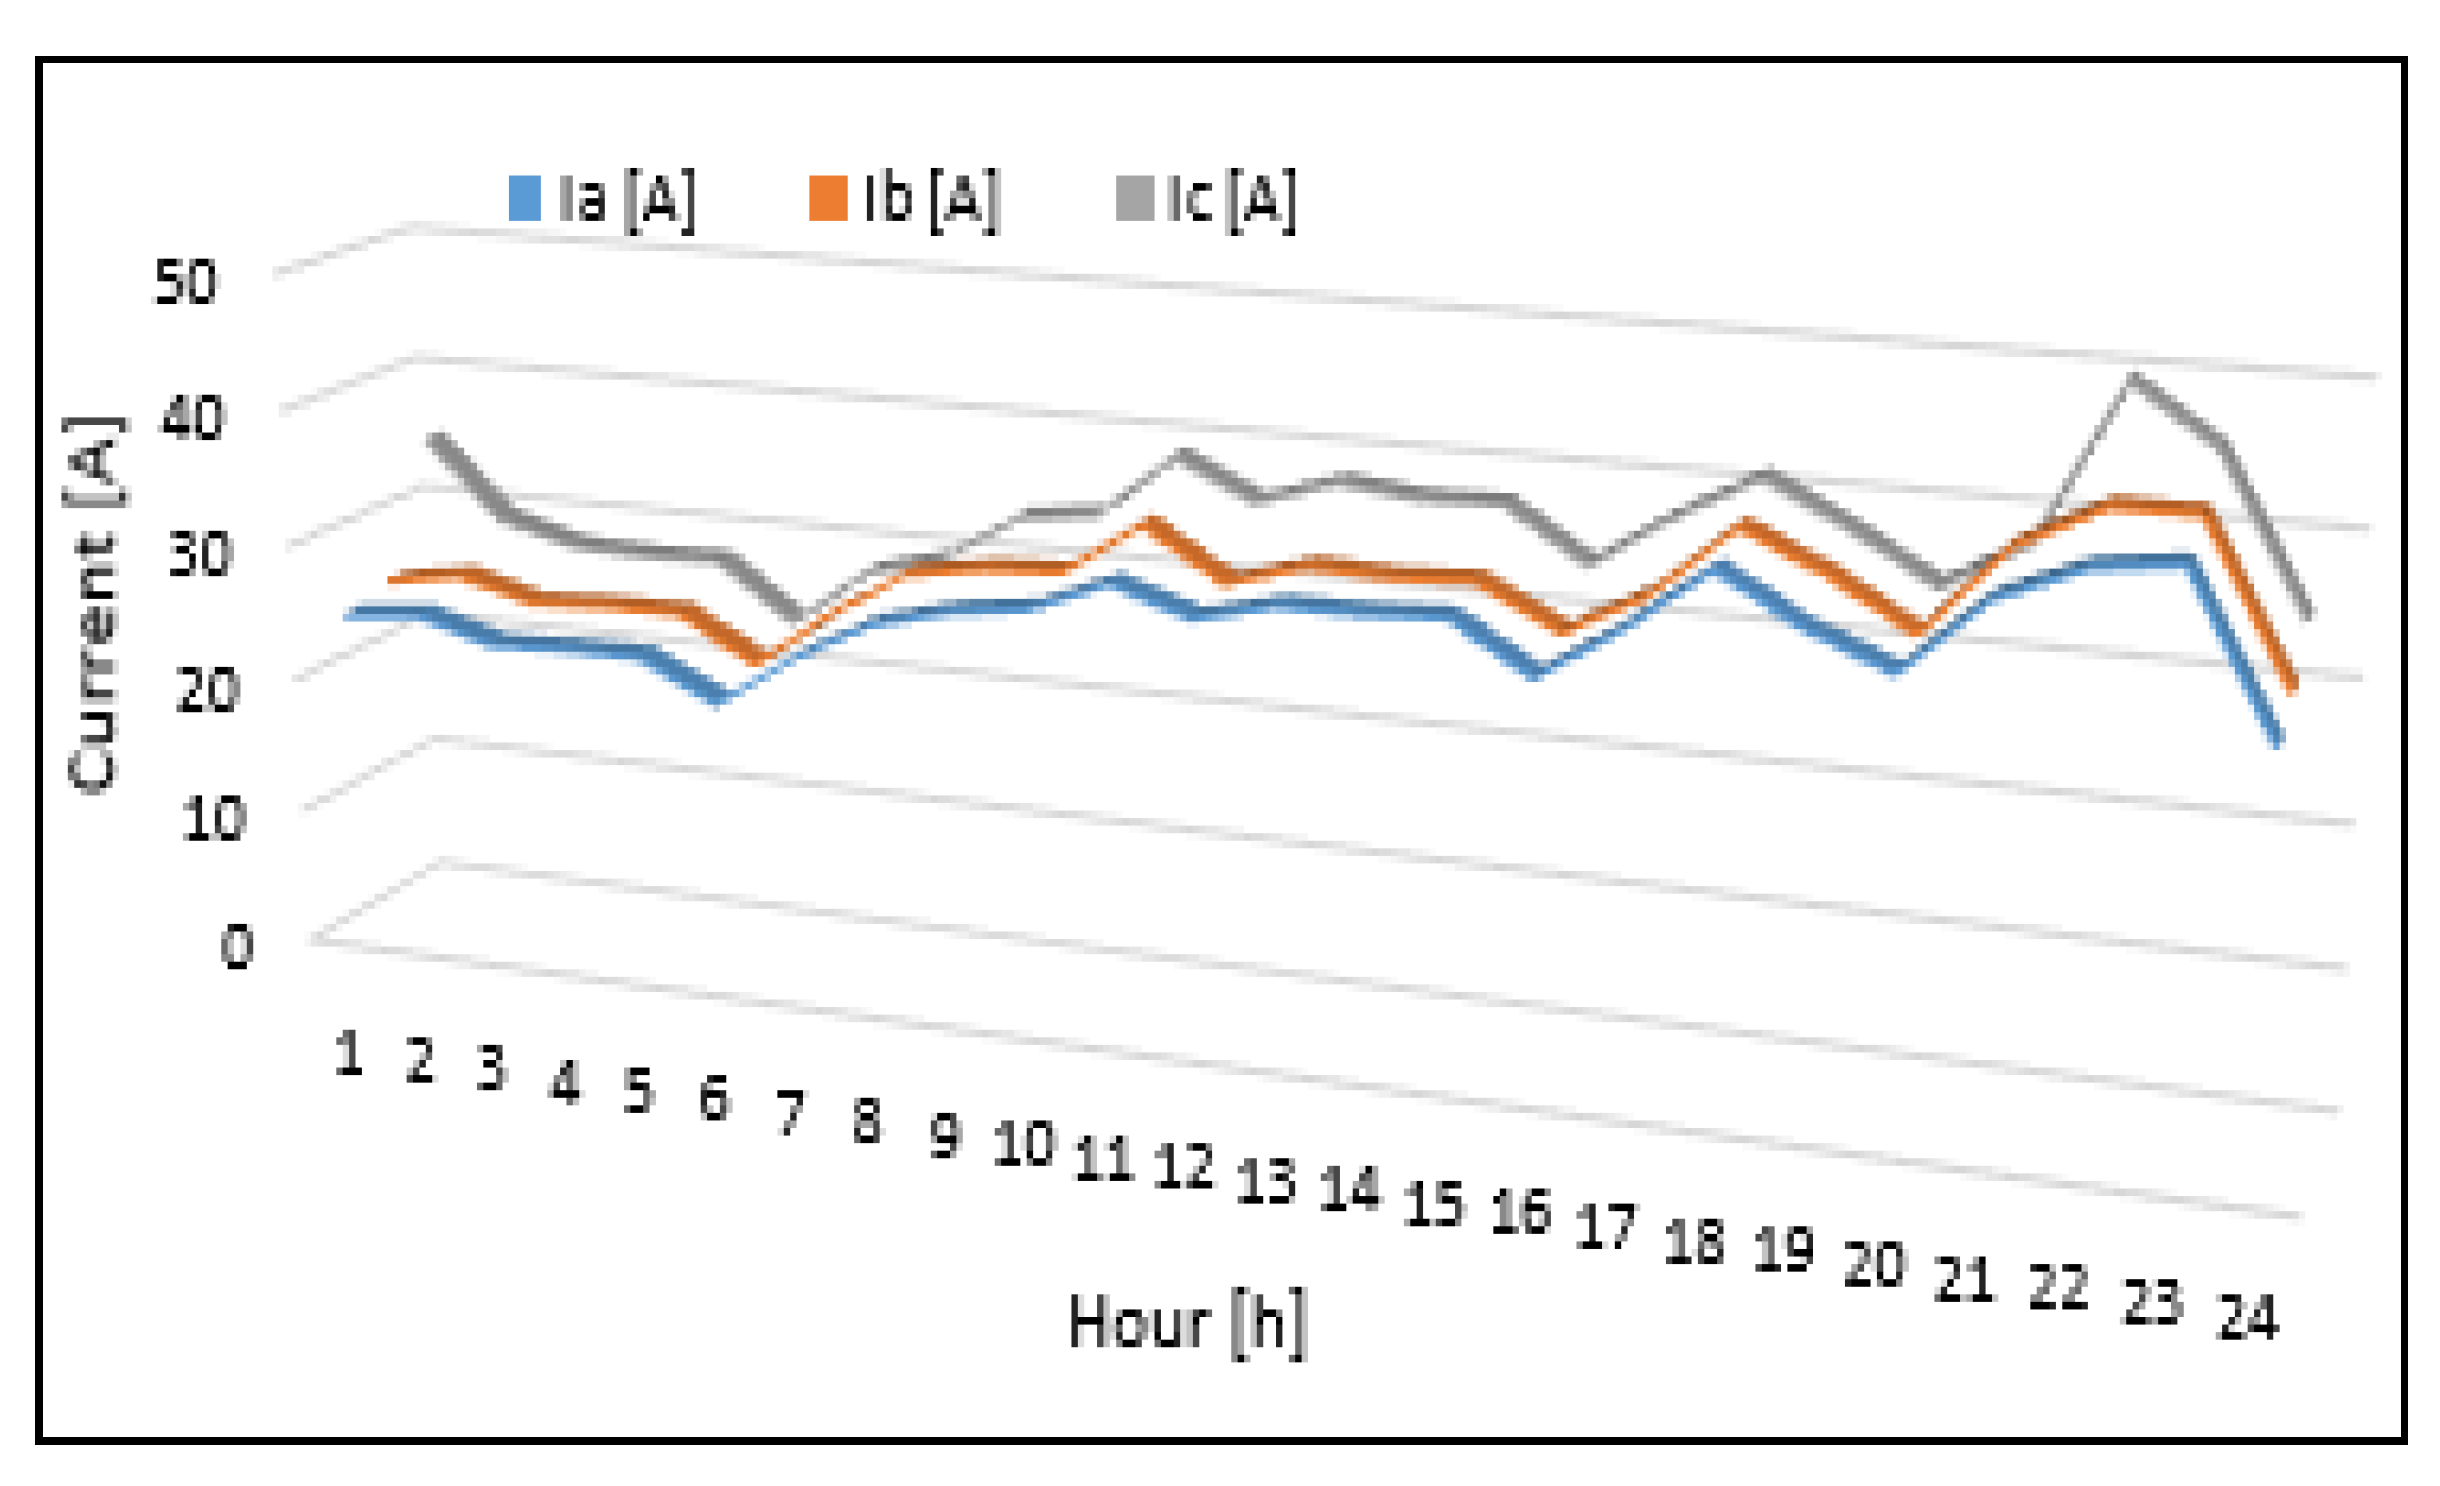
| I(h)a,SP, I(h)b,SP, I(h)c,SP | The hourly phase currents aggregated at the level (on the LV side), [A]; |
| I(h)a,GC,mi | The hourly requested current by the consumer mi belonging to the groups GC and allocated on the phase a at the pole P, [A]; |
| I(h)a,GC,q | The hourly requested current by the consumer q belonging to the groups GC and allocated on the phase a, [A]; |
| I(h)a,GI,ni | The hourly requested current by the consumer ni belonging to the groups GI and allocated on the phase a at the pole P, [A]; |
| I(h)a,GI,o | The hourly requested current by the consumer o belonging to the groups GI and allocated on the phase a, [A]; |
| I(h)b,GC,e | The hourly requested current by the consumer e belonging to the groups GC and allocated on the phase b, [A]; |
| I(h)b,GC,mj | The hourly requested current by the consumer mj belonging to the candidate groups GC and allocated on the phase b at the pole P, [A]; |
| I(h)b,GI,f | The hourly requested current by the consumer f belonging to the groups GI and allocated on the phase b, [A]; |
| I(h)b,GI,nj | The hourly requested current by the consumer nj belonging to the groups GI and allocated on the phase b at the pole P, [A]; |
| I(h)c,GC,ml | The hourly requested current by the consumer ml belonging to the candidate groups GC and allocated on the phase c at the pole P, [A]; |
| I(h)c,GC,w | The hourly requested current by the consumer w belonging to the groups GC and allocated on the phase c, [A]; |
| I(h)c,GI,nl | The hourly requested current by the consumer nl belonging to the groups GI and allocated on the phase c at the pole P, [A]; |
| I(h)c,GI,v | The hourly requested current by the consumer v belonging to the groups GI and allocated on the phase c, [A]; |
| I(h){p},GI,P | The hourly phase currents belonging to the groups GI and aggregated at the pole P, p = {a,b,c}, [A]; |
| I(h){p},GC,P | The hourly phase currents belonging to the groups GC and aggregated at the pole P, p = {a,b,c}, [A]; |
| I(h){p},GI,SP | The hourly phase currents of the consumers belonging to the groups GI and aggregated at SP level, p = {a,b,c}, [A]; |
| I(h){p},GC,SP | The hourly phase currents of the consumers belonging to the groups GC and aggregated at SP level, p = {a,b,c}, [A]; |
| I(h){p},P | The hourly phase currents aggregated at the pole P, p = {a,b,c}, [A]; |
| I(h){p},x | The hourly phase currents aggregated at the pole x⊆{PT} (placed after the pole P in the EDN), [A]; |
| [I] | Matrix containing the current profiles of the consumers from the day when the peak load was recorded in the EDN; |
| [I(SP)] | Vector of the currents aggregated at the LV level of SP for each hour h, [A]; |
| [ID] | The matrix with the consumers’ characteristics subjected to the clustering process; |
| Kmax | Maximum number of clusters; |
| l | Index of the iteration from the PLB process; |
| mk | Centroid of the cluster k, k = 1, …, K; |
| {M} | Set of the centroids; |
| nk | The number of consumers from the cluster Ck; |
| nph | The number of phases (nph = 3); |
| n(h){p} | The number of the consumers from the EDN allocated on each from the three phases, p = {a,b,c}; |
| N{p},GI | The number of the consumers from the EDN allocated on each from the three phases, p = {a,b,c}, belonging to the groups GI; |
| N(h){p},GC | The number of the consumers from the EDN allocated on each from the three phases, p = {a,b,c}, belonging to the groups GC, at the hour h; |
| N(h)P | The number of the consumers allocated at the pole P; |
| N(h)P,{p},GC | The number of the consumers allocated on each from the three phases of the EDN, p = {a,b,c}, belonging to the groups GC, at the pole P and hour h; |
| NP,{p},GI | The number of the consumers allocated on each from the three phases of the EDN, p = {a,b,c} belonging to the groups GI, at the pole P; |
| Nr, Ns | The number of the consumers assigned to the clusters r and s; |
| NP | The total number of the poles; |
| NS | The total number of the sections; |
| p | Set of the connection phase, p = {a, b, c, abc}; |
| [Ph] | Vector of connection phase; |
| {PGC} | Set of poles with least one consumer from the “candidate” groups GC; |
| [PT] | Vector of the poles from the EDN; |
| {PT} | Set of all poles from the EDN; |
| QP | Vector of the silhouette coefficient; |
| QI | Qualification index; |
| [S] | Vector of the sections from the EDN; |
| SC | Silhouette coefficient; |
| tb | Set of the branching type tb = {1-P, 3-P}; |
| [Tb] | Vector of branching type; |
| UF(hPL) | The unbalance factor calculate for the peak load hour, hPL, [p.u.] |
| UF(h)P | The hourly unbalance factor calculated at the pole P, [p.u.]; |
| UF(h)SP | The hourly unbalance factor calculated on the LV side of SP, [p.u.]; |
| UFav,SP | The average value of the unbalance factor on the LV side of SP, [p.u.]; |
| UFlim | Limit value agreed by the DNO for the UF in the EDN, [p.u.]; |
| [VS1], [VT2] | The structure-vectors to identify the topology of the EDN; |
| Δh | The sampling step (Δh = 1 h, in our analysis); |
| ΔWS | The energy-saving, [%] |
| ΔW0 | Energy losses in the unbalance case (0% implementation degree of the PLBE installed in the EDN), [kWh] |
| ΔWpg | Energy losses in the balanced cases (pg = 100% and 17.5%), [kWh] |
Appendix A

| Consumer ID | Pole ID | Initial Phase/Branching | Consumer ID | Pole ID | Initial Phase/Branching | Consumer ID | Pole ID | Initial Phase/Branching |
|---|---|---|---|---|---|---|---|---|
| 1 | 1 | b/1-P/1-P | 39 | 28 | c/1-P | 77 | 52 | b/1-P |
| 2 | 3 | a/1-P | 40 | 28 | c/1-P | 78 | 52 | b/1-P |
| 3 | 3 | b/1-P | 41 | 30 | c/1-P | 79 | 53 | b/1-P |
| 4 | 4 | b/1-P | 42 | 30 | a/1-P | 80 | 55 | c/1-P |
| 5 | 5 | b/1-P | 43 | 30 | c/1-P | 81 | 56 | a/1-P |
| 6 | 6 | b/1-P | 44 | 31 | c/1-P | 82 | 58 | b/1-P |
| 7 | 7 | c/1-P | 45 | 32 | c/1-P | 83 | 59 | a/1-P |
| 8 | 7 | c/1-P | 46 | 32 | c/1-P | 84 | 59 | b/1-P |
| 9 | 8 | b/1-P | 47 | 33 | c/1-P | 85 | 59 | b/1-P |
| 10 | 8 | c/1-P | 48 | 33 | c/1-P | 86 | 60 | b/1-P |
| 11 | 10 | a b c/3-P | 49 | 34 | c/1-P | 87 | 60 | b/1-P |
| 12 | 11 | c/1-P | 50 | 35 | c/1-P | 88 | 61 | b/1-P |
| 13 | 11 | c/1-P | 51 | 36 | c/1-P | 89 | 61 | b/1-P |
| 14 | 12 | a/1-P | 52 | 36 | c/1-P | 90 | 62 | a/1-P |
| 15 | 13 | a/1-P | 53 | 37 | c/1-P | 91 | 62 | b/1-P |
| 16 | 13 | a/1-P | 54 | 37 | b/1-P | 92 | 63 | b/1-P |
| 17 | 16 | a/1-P | 55 | 38 | c/1-P | 93 | 65 | b/1-P |
| 18 | 16 | a/1-P | 56 | 38 | c/1-P | 94 | 68 | b/1-P |
| 19 | 19 | c/1-P | 57 | 38 | c/1-P | 95 | 70 | b/1-P |
| 20 | 19 | c/1-P | 58 | 39 | c/1-P | 96 | 71 | a/1-P |
| 21 | 20 | c/1-P | 59 | 40 | b/1-P | 97 | 71 | b/1-P |
| 22 | 20 | c/1-P | 60 | 40 | b/1-P | 98 | 71 | b/1-P |
| 23 | 21 | b/1-P | 61 | 41 | a/1-P | 99 | 71 | b/1-P |
| 24 | 21 | c/1-P | 62 | 41 | b/1-P | 100 | 72 | b/1-P |
| 25 | 22 | c/1-P | 63 | 41 | b/1-P | 101 | 73 | b/1-P |
| 26 | 22 | c/1-P | 64 | 42 | b/1-P | 102 | 75 | b/1-P |
| 27 | 23 | c/1-P | 65 | 42 | b/1-P | 103 | 75 | b/1-P |
| 28 | 23 | c/1-P | 66 | 43 | c/1-P | 104 | 76 | a/1-P |
| 29 | 24 | c/1-P | 67 | 45 | b/1-P | 105 | 77 | b/1-P |
| 30 | 25 | c/1-P | 68 | 45 | b/1-P | 106 | 80 | b/1-P |
| 31 | 26 | c/1-P | 69 | 46 | b/1-P | 107 | 80 | b/1-P |
| 32 | 26 | c/1-P | 70 | 47 | b/1-P | 108 | 81 | b/1-P |
| 33 | 26 | c/1-P | 71 | 47 | b/1-P | 109 | 82 | b/1-P |
| 34 | 26 | c/1-P | 72 | 47 | b/1-P | 110 | 82 | b/1-P |
| 35 | 27 | c/1-P | 73 | 47 | b/1-P | 111 | 85 | b/1-P |
| 36 | 27 | c/1-P | 74 | 47 | b/1-P | 112 | 86 | b/1-P |
| 37 | 27 | a/1-P | 75 | 48 | b/1-P | 113 | 86 | b/1-P |
| 38 | 28 | a/1-P | 76 | 51 | a/1-P | 114 | 88 | b/1-P |
| Consumer ID | Candidate Group | Hour | Switching Operations | ||||||||||||||||||||||||
|---|---|---|---|---|---|---|---|---|---|---|---|---|---|---|---|---|---|---|---|---|---|---|---|---|---|---|---|
| 0 | 1 | 2 | 3 | 4 | 5 | 6 | 7 | 8 | 9 | 10 | 11 | 12 | 13 | 14 | 15 | 16 | 17 | 18 | 19 | 20 | 21 | 22 | 23 | 24 | |||
| 14 | Cluster C5 | a | b | b | b | b | b | b | b | b | b | b | b | b | b | b | b | b | b | b | b | a | a | b | b | b | 3 |
| 18 | Cluster C5 | a | a | b | b | b | b | a | a | a | a | a | b | a | a | a | a | b | a | a | a | a | a | a | a | b | 7 |
| 20 | Cluster C5 | c | b | a | a | a | a | b | a | a | a | b | a | b | b | b | b | a | b | b | b | a | a | b | b | a | 12 |
| 37 | Cluster C5 | a | a | b | b | b | b | b | c | a | c | b | b | b | a | b | b | b | b | b | b | c | a | b | b | b | 10 |
| 42 | Cluster C5 | a | b | b | b | b | b | b | a | a | a | a | b | b | b | b | b | c | b | c | a | c | c | a | c | c | 10 |
| 43 | Cluster C5 | c | a | c | c | b | b | a | c | c | c | c | b | a | b | a | a | b | a | a | b | a | a | b | a | b | 16 |
| 48 | Cluster C5 | c | b | b | b | a | a | a | a | a | a | a | a | b | a | b | a | b | a | a | a | a | a | a | a | a | 8 |
| 53 | Cluster C5 | c | b | c | c | a | a | a | a | a | a | a | a | a | a | a | a | c | a | a | a | a | a | a | c | c | 6 |
| 54 | Cluster C5 | b | a | c | c | a | a | a | a | a | a | a | a | a | b | a | b | b | b | a | a | a | a | a | c | c | 8 |
| 59 | Cluster C3 | b | c | b | b | b | b | b | b | b | b | c | b | b | b | b | b | b | b | c | c | b | b | c | b | b | 8 |
| 68 | Cluster C3 | b | a | a | a | c | c | c | c | c | c | b | c | c | c | c | c | a | c | b | b | c | c | b | a | a | 10 |
| 73 | Cluster C3 | b | c | c | c | a | a | a | a | a | a | a | a | a | a | a | a | c | a | a | a | a | a | a | c | c | 5 |
| 74 | Cluster C5 | b | a | a | a | c | c | c | b | b | b | c | c | c | c | c | c | a | c | c | c | b | b | c | a | a | 9 |
| 76 | Cluster C5 | a | a | a | a | a | a | a | a | a | a | a | a | a | a | a | a | a | a | a | a | a | a | a | a | a | 0 |
| 82 | Cluster C5 | b | a | a | a | a | a | a | a | a | a | a | a | a | a | a | a | a | a | a | a | a | a | a | a | a | 1 |
| 83 | Cluster C5 | a | a | a | a | a | a | a | a | a | a | a | a | a | a | a | a | a | a | a | a | a | a | a | a | a | 0 |
| 84 | Cluster C3 | b | c | c | c | c | c | c | c | c | c | c | c | c | c | c | c | c | c | c | c | c | c | c | c | c | 1 |
| 85 | Cluster C5 | b | a | a | a | a | a | a | a | a | a | a | a | a | a | a | a | a | a | a | a | a | a | a | a | a | 1 |
| 88 | Cluster C5 | b | a | c | c | c | c | c | c | c | c | c | c | c | c | c | c | c | c | c | c | c | c | c | c | c | 2 |
| 89 | Cluster C5 | b | c | c | c | c | c | c | c | c | c | c | c | c | c | c | c | c | c | c | c | c | c | c | c | c | 1 |
| 90 | Cluster C5 | a | c | c | c | c | c | c | c | c | c | c | c | c | c | c | c | c | c | c | c | c | c | c | c | c | 1 |
| 92 | Cluster C5 | b | c | c | c | c | c | c | c | c | c | c | c | c | c | c | c | c | c | c | c | c | c | c | c | c | 1 |
| Switching Operations | 0 | 18 | 8 | 0 | 7 | 0 | 3 | 5 | 1 | 1 | 5 | 6 | 4 | 4 | 4 | 2 | 9 | 9 | 4 | 2 | 8 | 1 | 8 | 8 | 3 | 120 | |
| Hour | Implementation Degree | |||||||||||
|---|---|---|---|---|---|---|---|---|---|---|---|---|
| 0% | 100% | 17.5% | ||||||||||
| Ia [A] | Ib [A] | Ic [A] | UF | Ia [A] | Ib [A] | Ic [A] | UF | Ia [A] | Ib [A] | Ic [A] | UF | |
| h1 | 14.9 | 51.3 | 20.0 | 1.29 | 28.3 | 28.2 | 28.2 | 1.00001 | 28.5 | 26.5 | 29.8 | 1.027 |
| h2 | 14.1 | 48.9 | 19.1 | 1.29 | 27.0 | 26.9 | 26.9 | 1.00001 | 25.1 | 26.4 | 29.3 | 1.004 |
| h3 | 13.3 | 45.8 | 18.2 | 1.29 | 25.4 | 25.4 | 25.4 | 1.00001 | 23.5 | 25.0 | 27.7 | 1.004 |
| h4 | 13.5 | 46.5 | 17.9 | 1.30 | 25.7 | 25.5 | 25.5 | 1.00001 | 23.8 | 25.3 | 27.6 | 1.004 |
| h5 | 13.7 | 46.0 | 18.4 | 1.28 | 25.6 | 25.7 | 25.7 | 1.00001 | 23.8 | 25.4 | 27.7 | 1.004 |
| h6 | 12.5 | 37.9 | 17.4 | 1.23 | 22.3 | 22.4 | 22.3 | 1.00001 | 21.0 | 22.2 | 23.7 | 1.002 |
| h7 | 16.9 | 43.5 | 20.0 | 1.18 | 26.5 | 26.4 | 26.4 | 1.00000 | 24.9 | 26.5 | 28.0 | 1.002 |
| h8 | 19.7 | 47.5 | 21.5 | 1.17 | 29.2 | 29.0 | 29.3 | 1.00001 | 28.0 | 30.0 | 29.5 | 1.001 |
| h9 | 19.9 | 52.7 | 22.5 | 1.20 | 31.1 | 31.3 | 31.2 | 1.00001 | 29.5 | 31.0 | 33.2 | 1.002 |
| h10 | 18.2 | 56.7 | 22.3 | 1.26 | 31.9 | 31.9 | 31.7 | 1.00000 | 30.3 | 31.3 | 33.9 | 1.002 |
| h11 | 19.4 | 65.7 | 23.9 | 1.30 | 35.6 | 35.4 | 35.7 | 1.00000 | 32.7 | 35.3 | 38.7 | 1.004 |
| h12 | 17.6 | 61.8 | 21.1 | 1.33 | 32.9 | 32.8 | 32.8 | 1.00000 | 30.8 | 31.7 | 35.9 | 1.004 |
| h13 | 18.1 | 65.8 | 22.0 | 1.35 | 34.4 | 34.7 | 34.6 | 1.00000 | 32.3 | 33.5 | 37.9 | 1.005 |
| h14 | 18.1 | 64.0 | 23.0 | 1.32 | 34.3 | 34.4 | 34.2 | 1.00000 | 32.4 | 33.3 | 37.3 | 1.004 |
| h15 | 18.1 | 65.1 | 22.9 | 1.33 | 34.5 | 34.6 | 34.7 | 1.00000 | 32.7 | 33.6 | 37.4 | 1.003 |
| h16 | 16.1 | 57.3 | 21.8 | 1.31 | 31.2 | 31.0 | 31.2 | 1.00000 | 29.2 | 30.6 | 33.7 | 1.003 |
| h17 | 18.6 | 65.1 | 23.2 | 1.32 | 34.7 | 35.1 | 34.8 | 1.00001 | 33.2 | 33.8 | 37.6 | 1.003 |
| h18 | 21.8 | 71.8 | 26.7 | 1.29 | 39.1 | 39.3 | 39.1 | 1.00000 | 37.7 | 39.0 | 40.9 | 1.001 |
| h19 | 21.6 | 63.2 | 26.0 | 1.23 | 36.2 | 36.2 | 36.3 | 1.00001 | 34.4 | 36.3 | 37.9 | 1.002 |
| h20 | 21.5 | 55.0 | 24.5 | 1.18 | 33.1 | 33.3 | 33.0 | 1.00000 | 32.0 | 32.9 | 34.5 | 1.001 |
| h21 | 26.0 | 62.9 | 28.1 | 1.17 | 38.1 | 38.4 | 38.3 | 1.00001 | 37.5 | 39.4 | 37.9 | 1.000 |
| h22 | 28.1 | 74.1 | 33.0 | 1.19 | 44.2 | 43.7 | 44.2 | 1.00001 | 40.1 | 42.6 | 49.4 | 1.008 |
| h23 | 25.2 | 74.7 | 32.0 | 1.22 | 42.9 | 42.9 | 43.0 | 1.00002 | 40.9 | 42.6 | 45.4 | 1.002 |
| h24 | 17.3 | 56.3 | 23.9 | 1.25 | 31.7 | 31.9 | 32.1 | 1.00002 | 29.7 | 31.5 | 34.5 | 1.004 |
| Hour | ΔPa | ΔPb | ΔPc | ΔPN | ΔPTotal |
|---|---|---|---|---|---|
| h1 | 0.033 | 0.555 | 0.109 | 0.441 | 1.138 |
| h2 | 0.029 | 0.505 | 0.099 | 0.402 | 1.035 |
| h3 | 0.026 | 0.446 | 0.089 | 0.355 | 0.916 |
| h4 | 0.027 | 0.457 | 0.087 | 0.363 | 0.933 |
| h5 | 0.027 | 0.449 | 0.092 | 0.357 | 0.925 |
| h6 | 0.023 | 0.314 | 0.081 | 0.252 | 0.670 |
| h7 | 0.042 | 0.421 | 0.108 | 0.332 | 0.902 |
| h8 | 0.056 | 0.505 | 0.125 | 0.395 | 1.081 |
| h9 | 0.057 | 0.605 | 0.137 | 0.474 | 1.273 |
| h10 | 0.049 | 0.680 | 0.135 | 0.535 | 1.399 |
| h11 | 0.055 | 0.895 | 0.154 | 0.706 | 1.810 |
| h12 | 0.046 | 0.791 | 0.121 | 0.622 | 1.579 |
| h13 | 0.048 | 0.892 | 0.131 | 0.703 | 1.775 |
| h14 | 0.048 | 0.848 | 0.143 | 0.671 | 1.711 |
| h15 | 0.048 | 0.875 | 0.142 | 0.691 | 1.757 |
| h16 | 0.039 | 0.686 | 0.129 | 0.546 | 1.400 |
| h17 | 0.051 | 0.877 | 0.146 | 0.691 | 1.765 |
| h18 | 0.070 | 1.069 | 0.193 | 0.842 | 2.174 |
| h19 | 0.068 | 0.854 | 0.183 | 0.672 | 1.777 |
| h20 | 0.068 | 0.670 | 0.164 | 0.527 | 1.429 |
| h21 | 0.099 | 0.882 | 0.214 | 0.693 | 1.888 |
| h22 | 0.115 | 1.195 | 0.292 | 0.949 | 2.551 |
| h23 | 0.093 | 1.189 | 0.276 | 0.949 | 2.507 |
| h24 | 0.044 | 0.675 | 0.155 | 0.542 | 1.415 |
| ΔW[kWh] | 1.260 | 17.335 | 3.504 | 13.712 | 35.811 |
| Hour | ΔPa | ΔPb | ΔPc | ΔPN | ΔPTotal |
|---|---|---|---|---|---|
| h1 | 0.120 | 0.143 | 0.146 | 0.021 | 0.431 |
| h2 | 0.110 | 0.134 | 0.130 | 0.020 | 0.393 |
| h3 | 0.097 | 0.119 | 0.116 | 0.018 | 0.350 |
| h4 | 0.116 | 0.118 | 0.103 | 0.019 | 0.356 |
| h5 | 0.115 | 0.119 | 0.104 | 0.018 | 0.356 |
| h6 | 0.086 | 0.080 | 0.089 | 0.012 | 0.268 |
| h7 | 0.121 | 0.130 | 0.110 | 0.025 | 0.387 |
| h8 | 0.147 | 0.148 | 0.146 | 0.034 | 0.475 |
| h9 | 0.182 | 0.166 | 0.155 | 0.040 | 0.543 |
| h10 | 0.182 | 0.176 | 0.162 | 0.032 | 0.551 |
| h11 | 0.223 | 0.199 | 0.227 | 0.041 | 0.691 |
| h12 | 0.194 | 0.170 | 0.195 | 0.038 | 0.596 |
| h13 | 0.176 | 0.226 | 0.217 | 0.044 | 0.663 |
| h14 | 0.209 | 0.212 | 0.185 | 0.038 | 0.644 |
| h15 | 0.179 | 0.224 | 0.215 | 0.038 | 0.656 |
| h16 | 0.172 | 0.154 | 0.175 | 0.028 | 0.528 |
| h17 | 0.181 | 0.226 | 0.218 | 0.037 | 0.663 |
| h18 | 0.228 | 0.283 | 0.274 | 0.046 | 0.832 |
| h19 | 0.199 | 0.241 | 0.233 | 0.041 | 0.715 |
| h20 | 0.189 | 0.208 | 0.171 | 0.037 | 0.603 |
| h21 | 0.253 | 0.252 | 0.253 | 0.056 | 0.815 |
| h22 | 0.332 | 0.297 | 0.364 | 0.063 | 1.056 |
| h23 | 0.322 | 0.327 | 0.289 | 0.050 | 0.989 |
| h24 | 0.153 | 0.186 | 0.183 | 0.026 | 0.547 |
| ΔW[kWh] | 4.287 | 4.539 | 4.461 | 0.820 | 14.107 |
| Hour | ΔPa | ΔPb | ΔPc | ΔPN | ΔPTotal |
|---|---|---|---|---|---|
| h1 | 0.122 | 0.120 | 0.188 | 0.043 | 0.472 |
| h2 | 0.115 | 0.109 | 0.160 | 0.036 | 0.420 |
| h3 | 0.100 | 0.097 | 0.144 | 0.032 | 0.373 |
| h4 | 0.106 | 0.099 | 0.134 | 0.023 | 0.362 |
| h5 | 0.106 | 0.100 | 0.135 | 0.022 | 0.363 |
| h6 | 0.082 | 0.077 | 0.099 | 0.016 | 0.275 |
| h7 | 0.113 | 0.113 | 0.144 | 0.036 | 0.405 |
| h8 | 0.140 | 0.143 | 0.163 | 0.043 | 0.490 |
| h9 | 0.157 | 0.153 | 0.200 | 0.050 | 0.560 |
| h10 | 0.170 | 0.175 | 0.185 | 0.046 | 0.576 |
| h11 | 0.202 | 0.187 | 0.265 | 0.047 | 0.701 |
| h12 | 0.181 | 0.151 | 0.230 | 0.044 | 0.607 |
| h13 | 0.199 | 0.170 | 0.255 | 0.049 | 0.672 |
| h14 | 0.198 | 0.169 | 0.244 | 0.044 | 0.655 |
| h15 | 0.203 | 0.172 | 0.248 | 0.045 | 0.667 |
| h16 | 0.156 | 0.145 | 0.210 | 0.044 | 0.554 |
| h17 | 0.206 | 0.174 | 0.250 | 0.044 | 0.676 |
| h18 | 0.264 | 0.270 | 0.269 | 0.071 | 0.874 |
| h19 | 0.219 | 0.227 | 0.231 | 0.045 | 0.721 |
| h20 | 0.184 | 0.180 | 0.220 | 0.062 | 0.645 |
| h21 | 0.251 | 0.254 | 0.271 | 0.081 | 0.857 |
| h22 | 0.297 | 0.312 | 0.387 | 0.067 | 1.063 |
| h23 | 0.296 | 0.287 | 0.389 | 0.097 | 1.069 |
| h24 | 0.158 | 0.157 | 0.223 | 0.052 | 0.591 |
| ΔW[kWh] | 4.222 | 4.040 | 5.245 | 1.140 | 14.648 |
References
- Nikmehr, N.; Najafi Ravadanegh, S. Optimal Power Dispatch of Multi-Microgrids at Future Smart Distribution Grids. IEEE Trans. Smart Grid 2015, 6, 1648–1657. [Google Scholar] [CrossRef]
- Wang, C.; Li, X.; Tian, T.; Xu, Z.; Chen, R. Coordinated Control of Passive Transition from Grid-Connected to Islanded Operation for Three/Single-Phase Hybrid Multimicrogrids Considering Speed and Smoothness. IEEE Trans. Ind. Electron. 2020, 67, 1921–1931. [Google Scholar] [CrossRef]
- Khalid, M.; Akram, U.; Shafiq, S. Optimal Planning of Multiple Distributed Generating Units and Storage in Active Distribution Networks. IEEE Access 2018, 6, 55234–55244. [Google Scholar] [CrossRef]
- Grigoras, G.; Ivanov, O.; Neagu, B.C.; Pragma, K. Smart Metering Based Strategies for Improving Energy Efficiency in Microgrids. In Microgrid Architectures, Control and Protection Methods; Mahdavi Tabatabaei, N., Kabalci, E., Bizon, N., Eds.; Springer: Berlin, Germany, 2020; pp. 463–490. [Google Scholar]
- Liu, B.; Meng, K.; Dong, Z.; Wong, P.K.C.; Li, X. Load Balancing in Low-voltage Distribution Network via Phase Reconfiguration: An Efficient Sensitivity-based Approach. IEEE Trans. Pow. Deliv. 2020. [Google Scholar] [CrossRef]
- Haq, S.U.; Arif, B.; Khan, A.; Ahmed, J. Automatic Three Phase Load Balancing System by Using Fast Switching Relay in Three Phase Distribution System. In Proceedings of the International Conference on Power, Energy and Smart Grid (ICPESG), Mirpur, Pakistan, 9–10 April 2018; pp. 1–6. [Google Scholar] [CrossRef]
- Narayanan, K.N.; Umanand, L. A Novel Active Phase Router for Dynamic Load Balancing in a Three Phase Microgrid. In Proceedings of the 2017 IEEE PES Asia-Pacific Power and Energy Engineering Conference (APPEEC), Bangalore, India, 8–10 November 2017; pp. 1–5. [Google Scholar] [CrossRef]
- SinePuls, Single Phase STS Prepaid Meter. Available online: https://sinepulse.com/sites/default/files/smart-meter/SP_SINGLE_PHASE_STS_PREPAID_METER.pdf (accessed on 21 November 2020).
- Londian, Smart Prepaid Meter. Available online: http://www.londian.com.cn/en/index.php?s=/cms/209 (accessed on 21 November 2020).
- Novatek-Electro, Universal Automatic Electronic Phase Switch Pef-319. Available online: https://novatek-electro.com/en/products/phase-selector-switch/universal-automatic-electronic-phase-switch-pef-301.html (accessed on 21 November 2020).
- Yongxia, L.; Yulei, G. Design of Three Phase Load Unbalance Automatic Regulating System for Low Voltage Power Distribution Grids. In Proceedings of the MATEC Web of Conferences, Nanjing, China, 24–26 May 2018; Volume 173. [Google Scholar] [CrossRef] [Green Version]
- Siti, M.W.; Jimoh, A.A.; Nicolae, D.V. Distribution network phase load balancing as a combinatorial optimization problem using fuzzy logic and Newton–Raphson. Electr. Power Syst. Res. 2011, 81, 1079–1087. [Google Scholar] [CrossRef]
- Iyappan, M.; Karpagam, M.; Raviram, P. Automatic load sharing in Industrial Plant With Monitoring System Using Microcontroller. Int. J. App. Eng. Res. 2015, 114–120. [Google Scholar]
- Ofualagba, G.; Udoha, E.E. Design and Simulation of Automatic Phase Selector and Changeover Switch for 3-Phase Supply. Int. J. Nov. Res. Elec. Mech. Eng. 2017, 4, 28–35. [Google Scholar]
- Rashid, A.T.; Rashid, M.T. Design and Implementation of Load Balancing System for a Smart Home. In Proceedings of the 3rd International Scientific Conference for Renewable Energy (ISCRE’ 2018), Basrah, Iraq, 14–15 March 2018; pp. 1–6. [Google Scholar]
- Shakeel, M.O.B.; Jaffar, S.A.; Ali, M.F.; Zaidi, S.S. LV Three Phase Automatic Load Balancing System. In Proceedings of the International Conference on Energy, Environment and Sustainable Development 2016 (EESD 2016), Jamshoro, Pakistan, 1–3 November 2016. [Google Scholar]
- Bao, G.; Ke, S. Load Transfer Device for Solving a Three-Phase Unbalance Problem Under a Low-Voltage Distribution Network. Energies 2019, 12, 2842. [Google Scholar] [CrossRef] [Green Version]
- Homaee, O.; Najafi, A.; Dehghanian, M.; Attar, M.; Falaghi, H. A Practical Approach for Distribution Network Load Balancing by Optimal Re-Phasing of Single-Phase Customers Using Discrete Genetic Algorithm. Int. Trans. Electr. Energy Syst. 2019, 29, e2834. [Google Scholar] [CrossRef]
- Liu, Y.-W.; Rau, S.-H.; Wu, C.-J.; Lee, W.-J. Improvement of Power Quality by Using Advanced Reactive Power Compensation. IEEE Trans. Ind. Appl. 2018, 54, 18–24. [Google Scholar] [CrossRef]
- Kalesar, B.M. Customers Swapping Between Phases for Loss Reduction Considering Daily Load Profile Modeling Smart Grid. In Proceedings of the CIRED Workshop 2016, Helsinki, Finland, 14–15 June 2016; pp. 1–4. [Google Scholar]
- Jianguo, Z.; Qiuye, S.; Huaguang, Z.; Yan, Z. Load Balancing and Reactive Power Compensation Based on Capacitor Banks Shunt Compensation in Low Voltage Distribution Networks. In Proceedings of the 31st Chinese Control Conference, Hefei, China, 20–22 July 2012; pp. 6681–6686. [Google Scholar]
- Arias, J.; Calle, M.; Turizo, D.; Guerrero, J.; Candelo-Becerra, J.E. Historical Load Balance in Distribution Systems Using the Branch and Bound Algorithm. Energies 2019, 12, 1219. [Google Scholar] [CrossRef] [Green Version]
- Granada Echeverri, M.; Gallego Rendón, R.A.; López Lezama, J.M. Optimal Phase Balancing Planning for Loss Reduction in Distribution Systems Using a Specialized Genetic Algorithm. Ing. Y Cienc. 2012, 8, 121–140. [Google Scholar] [CrossRef] [Green Version]
- Al-Kharsan, I.H. A New Strategy for Phase Swapping Load Balancing Relying on a Meta-Heuristic MOGWO Algorithm. J. Mech. Contin. Math. Sci. 2020, 15, 84–102. [Google Scholar] [CrossRef]
- Mahendran, G.; Govindaraju, C. Flower Pollination Algorithm for Distribution System Phase Balancing Considering Variable Demand. Microprocess. Microsyst. 2020, 74, 103008. [Google Scholar] [CrossRef]
- Saffar, A.; Hooshmand, R.; Khodabakhshian, A. A New Fuzzy Optimal Reconfiguration of Distribution Systems for Loss Reduction and Load Balancing Using Ant Colony Search-Based Algorithm. App. Soft Comp. 2011, 11, 4021–4028. [Google Scholar] [CrossRef]
- Hooshmand, R.; Soltani, S.H. Simultaneous Optimization of Phase Balancing and Reconfiguration in Distribution Networks Using BF–NM Algorithm. Int. J. Electr. Power Energy Syst. 2012, 41, 76–86. [Google Scholar] [CrossRef]
- Olek, B.; Wierzbowski, M. Local Energy Balancing and Ancillary Services in Low-Voltage Networks with Distributed Generation, Energy Storage, and Active Loads. IEEE Trans. Ind. Electr. 2014, 62, 2499–2508. [Google Scholar] [CrossRef]
- Kikhavani, M.R.; Hajizadeh, A.; Shahirinia, A. Charging Coordination and Load Balancing of Plug-In Electric Vehicles in Unbalanced Low-Voltage Distribution Systems. IET Gen. Transm. Distrib. 2020, 14, 389–399. [Google Scholar] [CrossRef]
- Weckx, S.; Driesen, J. Load Balancing with EV Chargers and PV Inverters in Unbalanced Distribution Grids. IEEE Trans. Sustain. Energy 2015, 6, 635–643. [Google Scholar] [CrossRef] [Green Version]
- Evzelman, M.; Ur Rehman, M.M.; Hathaway, K.; Zane, R.; Costinett, D.; Maksimovic, D. Active Balancing System for Electric Vehicles with Incorporated Low-Voltage Bus. IEEE Trans. Power Electr. 2015, 31, 7887–7895. [Google Scholar] [CrossRef]
- Faessler, B.; Schuler, M.; Preißinger, M.; Kepplinger, P. Battery Storage Systems as Grid-Balancing Measure in Low-Voltage Distribution Grids with Distributed Generation. Energies 2017, 10, 2161. [Google Scholar] [CrossRef] [Green Version]
- De Carne, G.; Buticchi, G.; Liserre, M.; Yoon, C.; Blaabjerg, F. Voltage and Current Balancing in Low and Medium Voltage Grid by Means of Smart Transformer. In Proceedings of the IEEE Power & Energy Society General Meeting, Denver, CO, USA, 26–30 July 2015; pp. 1–5. [Google Scholar]
- Pasdar, A.; Mehne, H.H. Intelligent Three-Phase Current Balancing Technique for Single-Phase Load Based on Smart Metering. Int. J. Electr. Power Energy Syst. 2011, 33, 693–698. [Google Scholar] [CrossRef]
- Wang, C.; Tian, T.; Xu, Z.; Cheng, S.; Liu, S.; Chen, R. Optimal Management for Grid-Connected Three/Single-Phase Hybrid Multimicrogrids. IEEE Trans. Sustain. Energy 2020, 11, 1870–1882. [Google Scholar] [CrossRef]
- Hong, T.; de León, F. Controlling Non-Synchronous Microgrids for Load Balancing of Radial Distribution Systems. IEEE Trans. Smart Grid 2017, 8, 2608–2616. [Google Scholar] [CrossRef]
- Fränti, P.; Sieranoja, S. How Much Can K-Means Be Improved by Using Better Initialization and Repeats? Pattern Recognit. 2019, 93, 95–112. [Google Scholar] [CrossRef]
- Liang, J.; Bai, L.; Dang, C.; Cao, F. The K-Means-Type Algorithms Versus Imbalanced Data Distributions. IEEE Trans. Fuzzy Syst. 2012, 20, 728–745. [Google Scholar] [CrossRef]
- Li, M.J.; Ng, M.K.; Cheung, Y.; Huang, J.Z. Agglomerative Fuzzy K-Means Clustering Algorithm with Selection of Number of Clusters. IEEE Trans. Knowl. Data Eng. 2008, 20, 1519–1534. [Google Scholar] [CrossRef] [Green Version]
- Romanian Energy Regulatory Authority, Technical Norm Regarding the Determination of Own Technological Consumption in Electricity Networks-NTE-013/16/00 (in Romanian). 2016. Available online: https://legeaz.net/mo/anexa-ordin-anre-26-2016.pdf (accessed on 21 November 2020).
- Grigoras, G.; Neagu, B.-C. Smart Meter Data-Based Three-Stage Algorithm to Calculate Power and Energy Losses in Low Voltage Distribution Networks. Energies 2019, 12, 3008. [Google Scholar] [CrossRef] [Green Version]
- Li, T.; Ma, Y.; Endoh, T. Normalization-Based Validity Index of Adaptive K-Means Clustering for Multi-Solution Application. IEEE Access 2020, 8, 9403–9419. [Google Scholar] [CrossRef]
- Noroc, L.; Grigoras, G. Clustering-Based Consumers’ Selection to Optimal Placement of the Phase Load Balancing Devices. In Proceedings of the 11th International Conference and Exposition on Electrical and Power Engineering, Iasi, Romania, 22–23 October 2020; pp. 1–4. [Google Scholar]
- Sinaga, K.; Yang, M.S. Unsupervised K-Means Clustering Algorithm. IEEE Access 2020, 8, 80716–80727. [Google Scholar] [CrossRef]
- Xu, F.; Shu, X.; Zhang, X.; Fan, B. Automatic Diagnosis of Microgrid Networks’ Power Device Faults Based on Stacked Denoising Autoencoders and Adaptive Affinity Propagation Clustering. Complexity 2020, 8509142. [Google Scholar] [CrossRef]
- Rousseeuw, P. Silhouettes: A Graphical Aid to the Interpretation and Validation of Cluster Analysis. J. Comput. Appl. Math. 1987, 20, 53–65. [Google Scholar] [CrossRef] [Green Version]
- Grigoras, G.; Neagu, B.C.; Gavrilas, M.; Tristiu, I.; Bulac, C. Optimal Phase Load Balancing in Low Voltage Distribution Networks Using a Smart Meter Data-Based Algorithm. Mathematics 2020, 8, 549. [Google Scholar] [CrossRef] [Green Version]
- Ivanov, O.; Grigoras, G.; Neagu, B.C. Smart Metering based Approaches to Solve the Load Phase Balancing Problem in Low Voltage Distribution Networks. In Proceedings of the International Symposium on Fundamentals of Electrical Engineering (ISFEE), Bucharest, Romania, 1–3 November 2018; pp. 1–6. [Google Scholar]
- Ivanov, O.; Neagu, B.C.; Gavrilas, M.; Grigoras, G.; Sfintes, C. Phase Load Balancing in Low Voltage Distribution Networks Using Metaheuristic Algorithms. In Proceedings of the International Conference on Electromechanical and Energy Systems (SIELMEN), Craiova, Romania, 9–11 October 2019; pp. 1–6. [Google Scholar]


| Authors, Reference Number | Type of EDN | Balancing Point | Balancing Mode | Mathematic Model | Evaluation of Benefits | |||
|---|---|---|---|---|---|---|---|---|
| Pole | Supply Point | OF | C | Switching Operations | Energy Savings | |||
| Liu B. et al. [5] Mahendran B. et al. [25] | Real | No | Yes | Automatic | UC | Yes | Yes | Yes |
| Haq S.U. et al. [6]; Narayanan K.N. et. al. [7] | Test | No | No | Automatic | UC | No | No | No |
| Homaee O. et al. [18] | Real | Yes | No | Manual | APL | Yes | No | Yes |
| Liu Y.W. et al. [19] | Test | No | No | Mixed | UV | No | No | No |
| Kalesar B.M. [20] Evzelman M. et al. [31] | Test | No | Yes | Automatic | APL | Yes | Yes | Yes |
| Jianguo Z. et al. [21] | Test | No | No | Manual | UC | No | Yes | No |
| Arias J. et al. [22] Al-Kharsan I.H. [24] | Test | No | Yes | Mixed | UF | No | No | Yes |
| Echeverri G.M. et al. [23] Faessler B. et al. [32] | Test | No | No | Manual | APL | No | No | Yes |
| Saffar A. et al. [26] Hooshmand R. et al. [27] | Test | No | Yes | Manual | APL | Yes | No | Yes |
| Olek B. et al. [28] | Test | No | No | None | UV | No | No | No |
| Kikhavani M.R. et al. [29] Weckx S. et al. [30] | Test | No | Yes | Automatic | APL | Yes | No | No |
| De Carne G. et al. [33] Pasdar A. et al. [34] | Test | No | Yes | Automatic | UC | Yes | No | No |
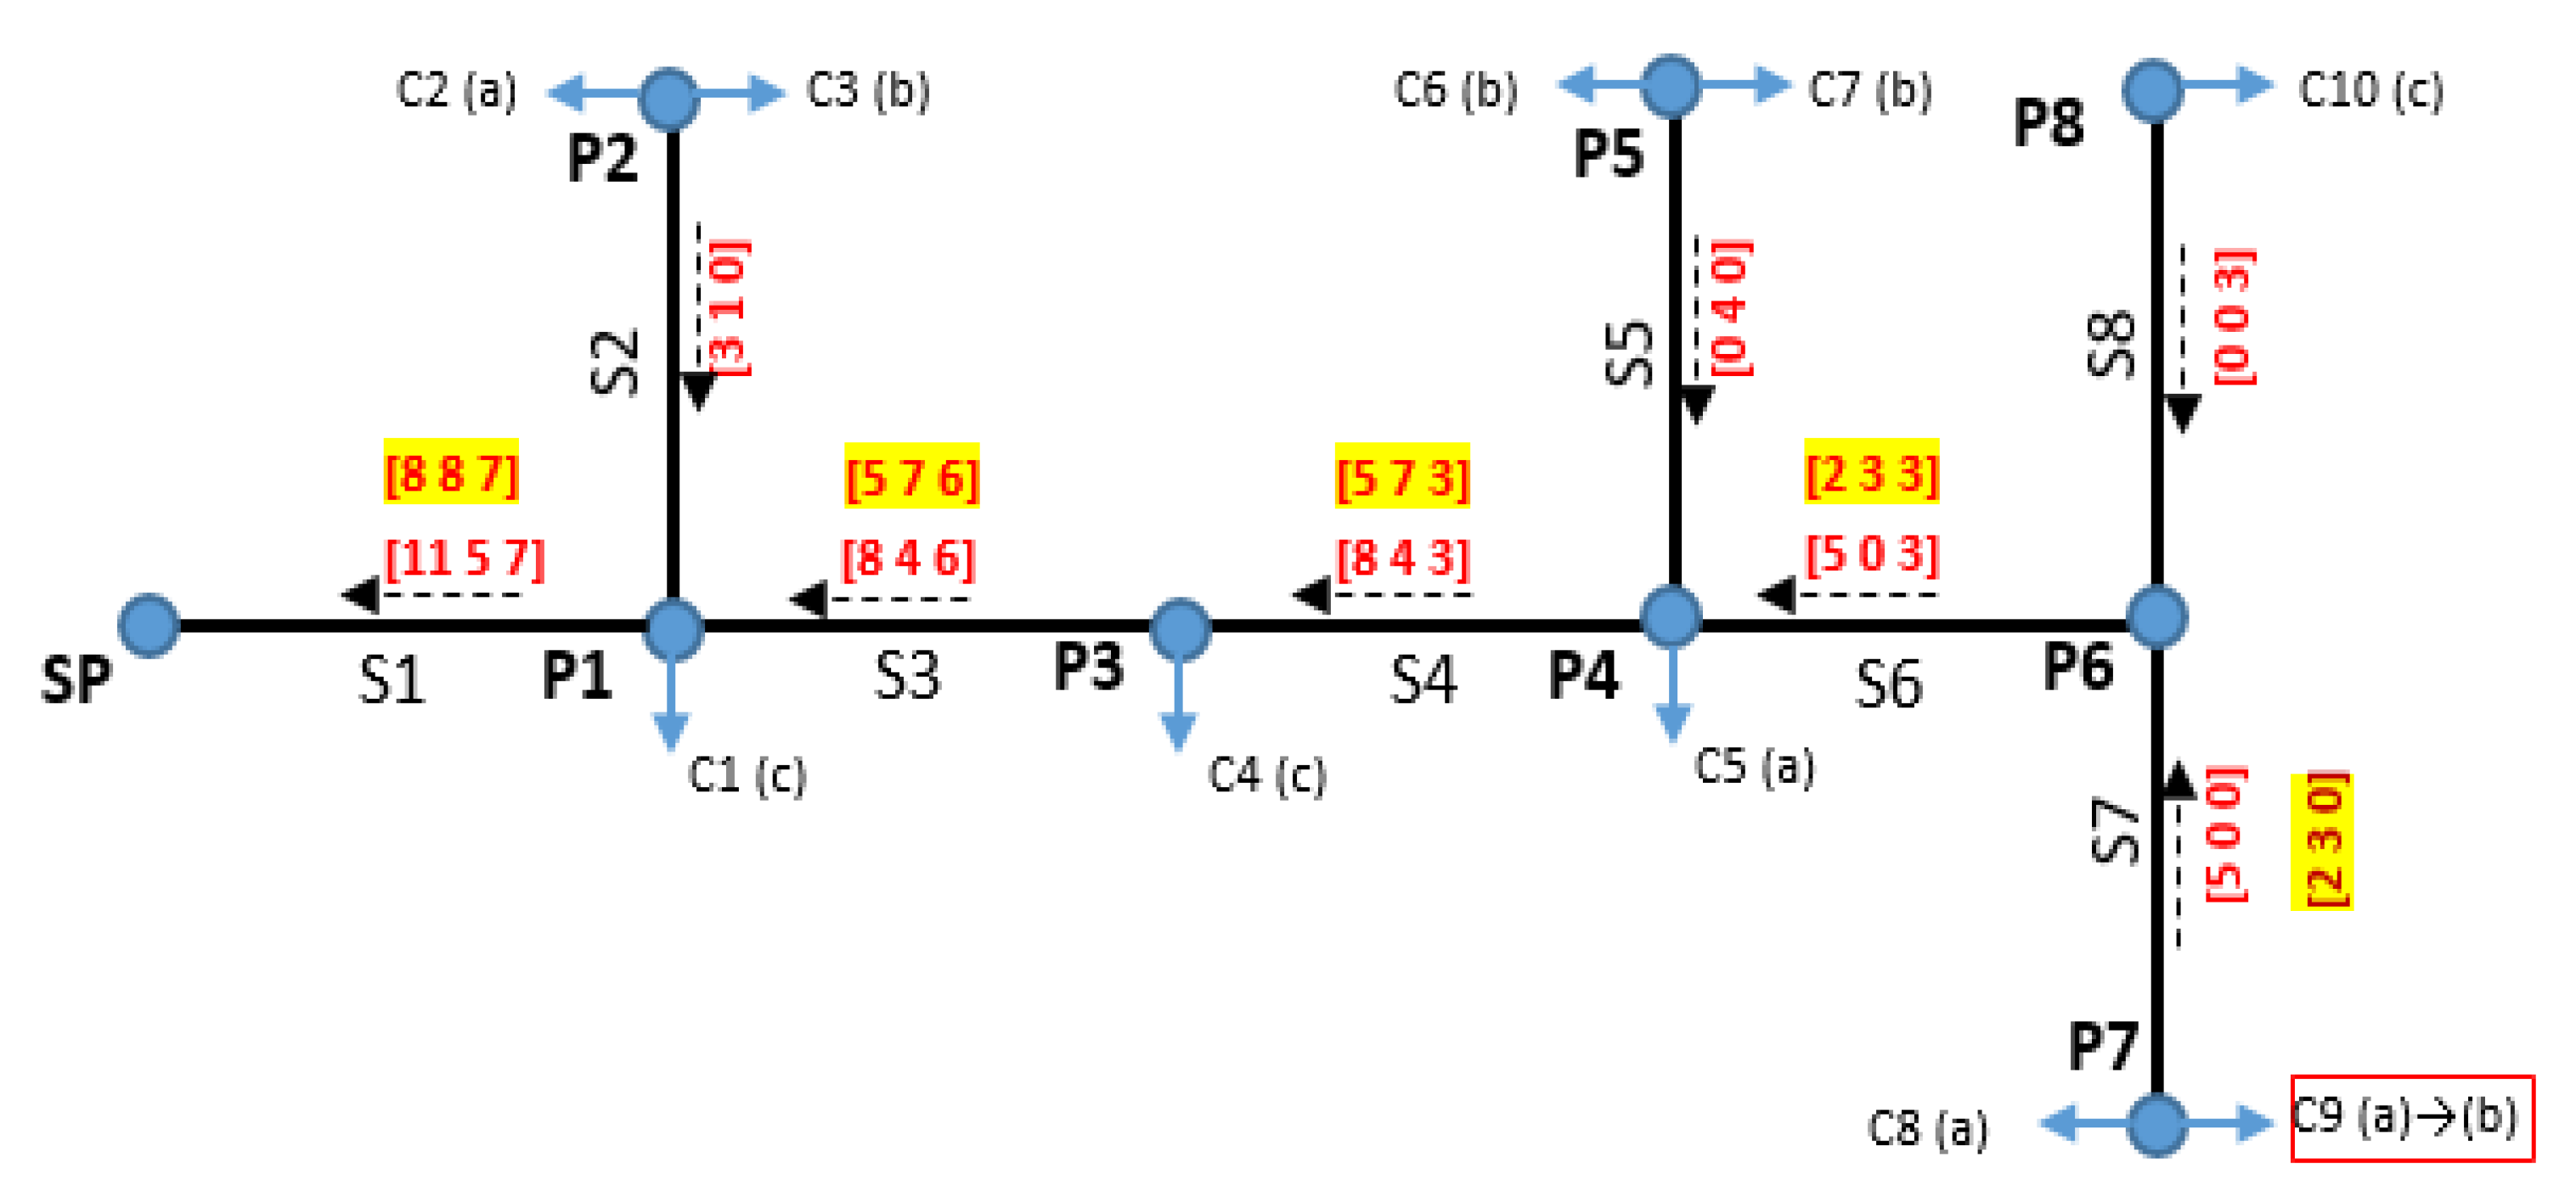
| Pole | P1 | P2 | P3 | P4 | P5 | P7 | P8 | |||
|---|---|---|---|---|---|---|---|---|---|---|
| Consumer | C1 | C2 | C3 | C4 | C5 | C6 | C7 | C8 | C9 | C10 |
| Phase | c | a | b | c | a | b | b | a | b | c |
| Distance, [km] | 0.04 | 0.08 | 0.08 | 0.08 | 0.12 | 0.16 | 0.16 | 0.20 | 0.20 | 0.20 |
| No. | Cross-Section | Type | Length [km] | |
|---|---|---|---|---|
| Phase Conductor | Neutral Conductor | |||
| 1 | 3 × 50 | 50 | Classical | 2.08 |
| 2 | 3 × 50 | 50 | Stranded | 0.12 |
| 3 | 3 × 35 | 35 | Classical | 0.68 |
| 4 | 1 × 35 | 35 | Classical | 0.28 |
| 5 | 1 × 25 | 25 | Classical | 0.28 |
| 6 | 1 × 25 | 16 | Classical | 0.08 |
| Total | 3.52 | |||
| Statistical Indicators | Variables | Cluster | ||||
|---|---|---|---|---|---|---|
| C1 | C2 | C3 | C4 | C5 | ||
| Mean | D [km] | 0.56 | 0.29 | 0.39 | 0.96 | 0.60 |
| I [A] | 0.48 | 0.63 | 8.25 | 0.69 | 1.60 | |
| Standard deviation | D [km] | 0.09 | 0.10 | 0.19 | 0.15 | 0.11 |
| I [A] | 0.19 | 0.43 | 2.33 | 0.53 | 0.65 | |
| Maximum value | D [km] | 0.72 | 0.40 | 0.64 | 1.28 | 0.76 |
| I [A] | 1.01 | 2.33 | 11.70 | 2.33 | 3.10 | |
| Minimum value | D [km] | 0.44 | 0.04 | 0.20 | 0.76 | 0.40 |
| I [A] | 0.34 | 0.21 | 6.66 | 0.34 | 1.01 | |
| Number | 32 | 34 | 4 | 26 | 18 | |
| Zones of the Current | Zones of the Distance [km] | Qualification Index | ||
|---|---|---|---|---|
| 0–0.4 km | 0.4–0.8 km | 0.8–1.2 km | ||
| 0–1.5 A | 1 | 2 | 3 | Low |
| 1.5–4.5 A | 4 | 5 | 6 | Medium |
| >4.5 A | 7 | 8 | 9 | High |
| Implementation Degree [%] | Algorithm | Computational Time [Seconds] | UF | ΔW [kWh] | ΔWS [%] |
|---|---|---|---|---|---|
| 0 | - | - | 1.260 | 35.8 | - |
| 100 | [AG algorithm] | 291 | 1.0017 | 14.2 | 60.3 |
| [PSO algorithm] | 348 | 1.0022 | 13.9 | 61.1 | |
| [Heuristic algorithm] | 1.26 | 1.0001 | 14.1 | 60.6 | |
| 17.5 | [Proposed algorithm] | 0.72 | 1.0030 | 14.6 | 59.2 |
Publisher’s Note: MDPI stays neutral with regard to jurisdictional claims in published maps and institutional affiliations. |
© 2021 by the authors. Licensee MDPI, Basel, Switzerland. This article is an open access article distributed under the terms and conditions of the Creative Commons Attribution (CC BY) license (http://creativecommons.org/licenses/by/4.0/).
Share and Cite
Grigoraș, G.; Neagu, B.-C.; Scarlatache, F.; Noroc, L.; Chelaru, E. Bi-Level Phase Load Balancing Methodology with Clustering-Based Consumers’ Selection Criterion for Switching Device Placement in Low Voltage Distribution Networks. Mathematics 2021, 9, 542. https://doi.org/10.3390/math9050542
Grigoraș G, Neagu B-C, Scarlatache F, Noroc L, Chelaru E. Bi-Level Phase Load Balancing Methodology with Clustering-Based Consumers’ Selection Criterion for Switching Device Placement in Low Voltage Distribution Networks. Mathematics. 2021; 9(5):542. https://doi.org/10.3390/math9050542
Chicago/Turabian StyleGrigoraș, Gheorghe, Bogdan-Constantin Neagu, Florina Scarlatache, Livia Noroc, and Ecaterina Chelaru. 2021. "Bi-Level Phase Load Balancing Methodology with Clustering-Based Consumers’ Selection Criterion for Switching Device Placement in Low Voltage Distribution Networks" Mathematics 9, no. 5: 542. https://doi.org/10.3390/math9050542