Abstract
Exploration and exploitation are the two main concepts of success for searching algorithms. Controlling exploration and exploitation while executing the search algorithm will enhance the overall performance of the searching algorithm. Exploration and exploitation are usually controlled offline by proper settings of parameters that affect the population-based algorithm performance. In this paper, we proposed a dynamic controller for one of the most well-known search algorithms, which is the Genetic Algorithm (GA). Population Diversity Controller-GA (PDC-GA) is proposed as a novel feature-selection algorithm to reduce the search space while building a machine-learning classifier. The PDC-GA is proposed by combining GA with k-mean clustering to control population diversity through the exploration process. An injection method is proposed to redistribute the population once 90% of the solutions are located in one cluster. A real case study of a bankruptcy problem obtained from UCI Machine Learning Repository is used in this paper as a binary classification problem. The obtained results show the ability of the proposed approach to enhance the performance of the machine learning classifiers in the range of to .
1. Introduction
The concept of exploration and exploitation plays a vital role in the effectiveness of any searching algorithm. In general, exploration is the process of visiting a new area in the search space, while exploitation is visiting a specific area within the neighborhood of previously visited points [1]. In order to find a good search algorithm, a good ratio between exploration and exploitation should be defined. The performance of population-based algorithms such as genetic algorithms, genetic programming, particle swarm optimization, brainstorm optimization algorithms, and other algorithms, is determined by the relationship between exploitation and exploration processes. Many researchers believe that population-based algorithms are effective due to the good ratio between exploitation and exploration [2,3].
In general, exploration and exploitation are usually controlled offline by proper settings of parameters that affect the population-based algorithm performance. However, the development process of such algorithms depends on the problem itself, which needs different amounts of exploration and exploitation. Since the problem nature is not known in advance, it is needed to find a controller to determine the amount of exploration and exploitation that are to be dynamically changed during a run. This motivates us to propose a novel approach that is able to control the exploration and exploitation processes inside GA. We employed GA as a binary feature selection approach to select the most valuable features for the bankruptcy prediction problem. The bankruptcy problem is one of the most critical economic problems in the world, which economic decision makers have to face. Small or large companies that are related to the local community play a vital role in decisions for policymakers and the directions for global economic growth. Therefore, the performance of these companies and the prediction of bankruptcies attract researchers due to its effluence on social economics [4,5]. Moreover, bankruptcy reflects on companies and individuals based on several factors such as reputation, potential loss of customer base, and credit history.
In the field of risk management for the bank’s sector, the bankruptcy problem is one of the most critical problems that face the financial department every day. Predicting bankruptcy in advance plays a key role in evaluating credit loan systems since it helps banks to prevent them from insolvency due to bad loans. Moreover, predicting corporate bankruptcy in an accurate way can contribute to the community by giving the right loan to successful companies. In general, a bankruptcy problem depends on a set of input features that are collected carefully from customer information (see Table 1). Moreover, this problem is a binary classification problem, where the main objective is to predict if the customer will have bankruptcy or not. Due to a large number of input features, finding a rigid wrapper algorithm is needed to enhance the overall performance of machine learning classifiers. As a result, we propose an enhanced version of the GA (i.e., Population Diversity Controller-GA (PDC-GA)) to explore the search space in a good manner and prevent premature convergence of the standard GA.

Table 1.
Dataset features descriptions.
In general, the bankruptcy problem is still a complex hard problem due to two main factors: (i) a complex relationship between a large number of variables, and (ii) imbalanced datasets, where the collected data for this problem usually are imbalanced (i.e., number of bankrupt cases are less than positive cases). The first factor makes the search space of this problem very high, where optimization methods try to reduce it as a feature selection problem, while the second factor affects the performance of ML methods. As a result, it is important to examine the collected data before building the prediction method and solving the imbalanced data problem first.
Recently, machine learning (ML) and optimization methods have shown promising performance while tackling the bankruptcy prediction problem [6,7]. ML solved the bankruptcy prediction problem as a binary classification problem (i.e., bankrupt and non-bankrupt), while optimization methods addressed this problem as a feature selection (FS) problem [8,9]. ML and optimization methods are able to solve the bankruptcy prediction problem due to their ability to handle big data and a large number of features (i.e., input data) [7]. In contrast, statistical methods have a set of limitations while solving this problem, such as solving the problem as a linear one, shortage in exploring the hidden relations between all input data, and sensitivity to outliers [10].
Many research papers have been proposed using ML to solve the bankruptcy prediction problem. For example, artificial neural networks (ANN) [11], genetic programming [12], support vector machines [13], and ensemble learning [6], while optimization methods such as genetic algorithm (GA) [14], ant colony optimization (ACO) [9], particle swarm optimization (PSO) [15], and Grey wolf optimization (GWO) [16] are employed successfully for the bankruptcy prediction problem. In general, optimization algorithms should have a balance between exploration and exploitation processes while solving complex problems to reach the optimal or near-optimal solutions. This balance can be achieved by controlling the diversity of the optimization algorithm [17].
The main contribution of this paper involves employing an enhanced version of GA that is able to control the population diversity during the search process. The main idea works by injecting the search space with new solutions to enhance the balance between exploration and exploitation processes to avoid being trapped in local optima.
In what follows, Section 2 presents the related works of bankruptcy prediction problem and diversity control for optimization algorithms. Section 3 presents the dataset used in this research, which is a public dataset obtained from the UCI Machine Learning Repository. Section 4 explores the proposed PDC-GA method in detail. Section 5 investigates the obtained results and our findings. Finally, Section 6 presents the conclusion and future works of this research.
2. Related Works
2.1. Diversity Control
All searching algorithms have two main concepts, which are Exploration and Exploitation processes [3]. Exploration refers to exploring or visiting all points in the search space, while Exploitation means visiting the surrounding points for a specific area. In general, finding a balance between Exploration and Exploitation is considered the main criterion to evaluate the overall performance of optimization algorithms. Many research papers highlight the concept of exploration and exploitation to gain a good ratio between both criteria. Sun et al. [18] propose a clustering method (i.e., k-mean method) to achieve a good ratio between exploration and exploitation for multi-objective optimization problems. Mittal et al. [19] enhanced the overall performance of Grey Wolf Optimizer (GWO) to prevent the premature convergence of the GWO algorithm. In the original GWO, half of the iterations work on exploration, while the second half work on exploitation, which is considered as a weak point of the GWO algorithm. The authors address this problem by finding a proper ratio between exploration and exploitation. Lynn and Suganthan [20] modified the Particle Swarm Optimization (PSO) by generating two subpopulations from the main population pool to enhance the exploration and exploitation processes. The main idea is that each sub-population focuses on exploration or exploitation based on the current distribution of solutions in the search space. Chen et al. [21] employed a sigmoid function that controls the velocity update process for PSO to overcome the premature convergence.
Shojaedini et al. [22] enhanced the performance of GA based on an adaptive genetic operator for selection and mutation. The proposed approach tries to find a good ratio between exploration and exploitation based on the number of outliers. Kelly et al. [23] control the exploration and exploitation processes for genetic programming (GP) by proposing a new selection method called knobelty. Mirsaleh and Meybodi [24] studied the premature convergence for GA and memetic algorithms.
2.2. Bankruptcy Prediction Problem
The bankruptcy prediction problem is a challenging problem that is related to companies’ evaluation and organizations’ solvency. Bankruptcy prediction was initially solved based on statistical methods [25] and Multiple Discriminant Analysis [26]. However, statistical methods are not able to explore all factors of the financial data or discover the hidden information inside it.
To overcome the weaknesses of statistical methods, machine learning methods show a great ability to address this problem [6,27]. Several methods have been adopted, such as support vector machines (SVMs) [28], artificial neural networks (ANNs) [29], Decision Tree [8], ensemble models [6], and deep learning methods [30]. Recently, many research papers have focused on ensemble models due to their ability to model bankruptcy problem in a good manner due to their ability to handle a large amount of financial data and produce lower error frequency [31]. Moreover, ensemble models are able to handle imbalance data [32].
2.3. Classification Models for Bankruptcy Prediction Problem
There are many machine learning methods that have been employed to predict the bankruptcy problem. We will list the methods that have been employed in the literature for this problem. Linear discriminant analysis (LDA) is a well-known classifier that has been employed successfully for many real-world applications. LDA was firstly employed for feature extraction, feature selection, and classification [33]. Altman [34] applied LDA in 1968 to predict the bankruptcy problem. Multilayer perceptron (MLP) is the most well-known model of artificial neural networks (ANNs), which consists of three layers (i.e., input, hidden, and output layers) [35]. MLP has been widely employed to predict the bankruptcy problem [29,36]. The JRip algorithm refers to Repeated Incremental Pruning to Produce Error Reduction (RIPPER), which enhances the correctness of a set of rules by tuning individual rules [37]. JRip algorithm works as an incremental learner that builds a set of rules in the training process. The error is evaluated based on the number of misclassified records for the training dataset [38]. JRip algorithm has been employed successfully in financial prediction problems [39,40].
The decision tree classifier (J48) is a well-known classifier constructed as a hierarchical model that consists of three main components (i.e., internal nodes, leaf nodes, and branches). The J48 model is very simple to implement, and the obtained trees are readily interpretable, while the weakness of this model is that it does not support multiple outputs and is susceptible to noisy data [41]. Logistic regression (LR) is a statistical classification model in ML, which is suitable for a binary class (bankruptcy and non-bankruptcy). LR has been employed successfully in different fields, such as medical, engineering, and social science [42]. Support vector machine (SVM) is an excellent classification method for data classification and regression [43]. However, the main weakness of SVM is high computational complexity.
Boosting is an ensemble learning method on ML for binary classification problems. In general, boosting comes in many flavors, such as bagging and random forest. There are many versions of boosting methods that have been employed successfully for binary classification problems (e.g., XGB and EXGB [4]). AdaBoost (Adaptive Boosting) is a simple ML classifier based on boosting algorithms. In AdaBoost, the decision trees are employed for weak learners with trees with a single split termed as decision stumps. The samples are weighted in AdaBoost. The weights are increased for samples that are difficult to classify, while the weights are decreased for weights that are simple to classify [44]. Random forest (RF) is an ensemble machine learning method that involves construction (growing) of multiple decision trees via bootstrap aggregation [45]. In simple terms, the input of RF is passed down each of the constituent decision trees. Each tree classifies the input values and “votes” for the corresponding class. The majority of the votes decide the overall RF prediction [46].
Recently, many research studies have focused on reducing the number of variables of bankruptcy prediction to enhance the overall performance of machine learning classifiers. Wrapper feature selection methods are one of the most applicable methods that are able to reduce the search space [47,48]. Therefore, we believe employing feature selection methods will help decision-makers to explore the financial data and extract valuable features that play an important role in bankruptcy cases.
3. Dataset
The dataset used in this research is adopted from [4], which represents several of Polish companies. Since 2004, many Poland companies in the manufacturing sector went to bankruptcy state, which makes this problem valuable to study and analyze. The dataset was extracted from the Emerging Markets Information Service (EMIS) database. In general, the dataset has information on emerging markets around the world, including the Polish one, such as financial information, political, macroeconomic, and companies’ news in Polish and English for 540 publications.
In this dataset, there are two periods of time. One is for bankruptcy, which is between 2007 and 2013, and the other period, which is between 2000 and 2012, without bankruptcy, for companies that are still working based on the reported data in EMIS. Therefore, this dataset has imbalanced samples. The dataset presents a binary classification problem with 64 features (inputs) and a single output (i.e., 0 means bankruptcy or 1 means no bankruptcy). Table 1 demonstrates the 64 features for this dataset.
4. Proposed Approach: PDC-GA
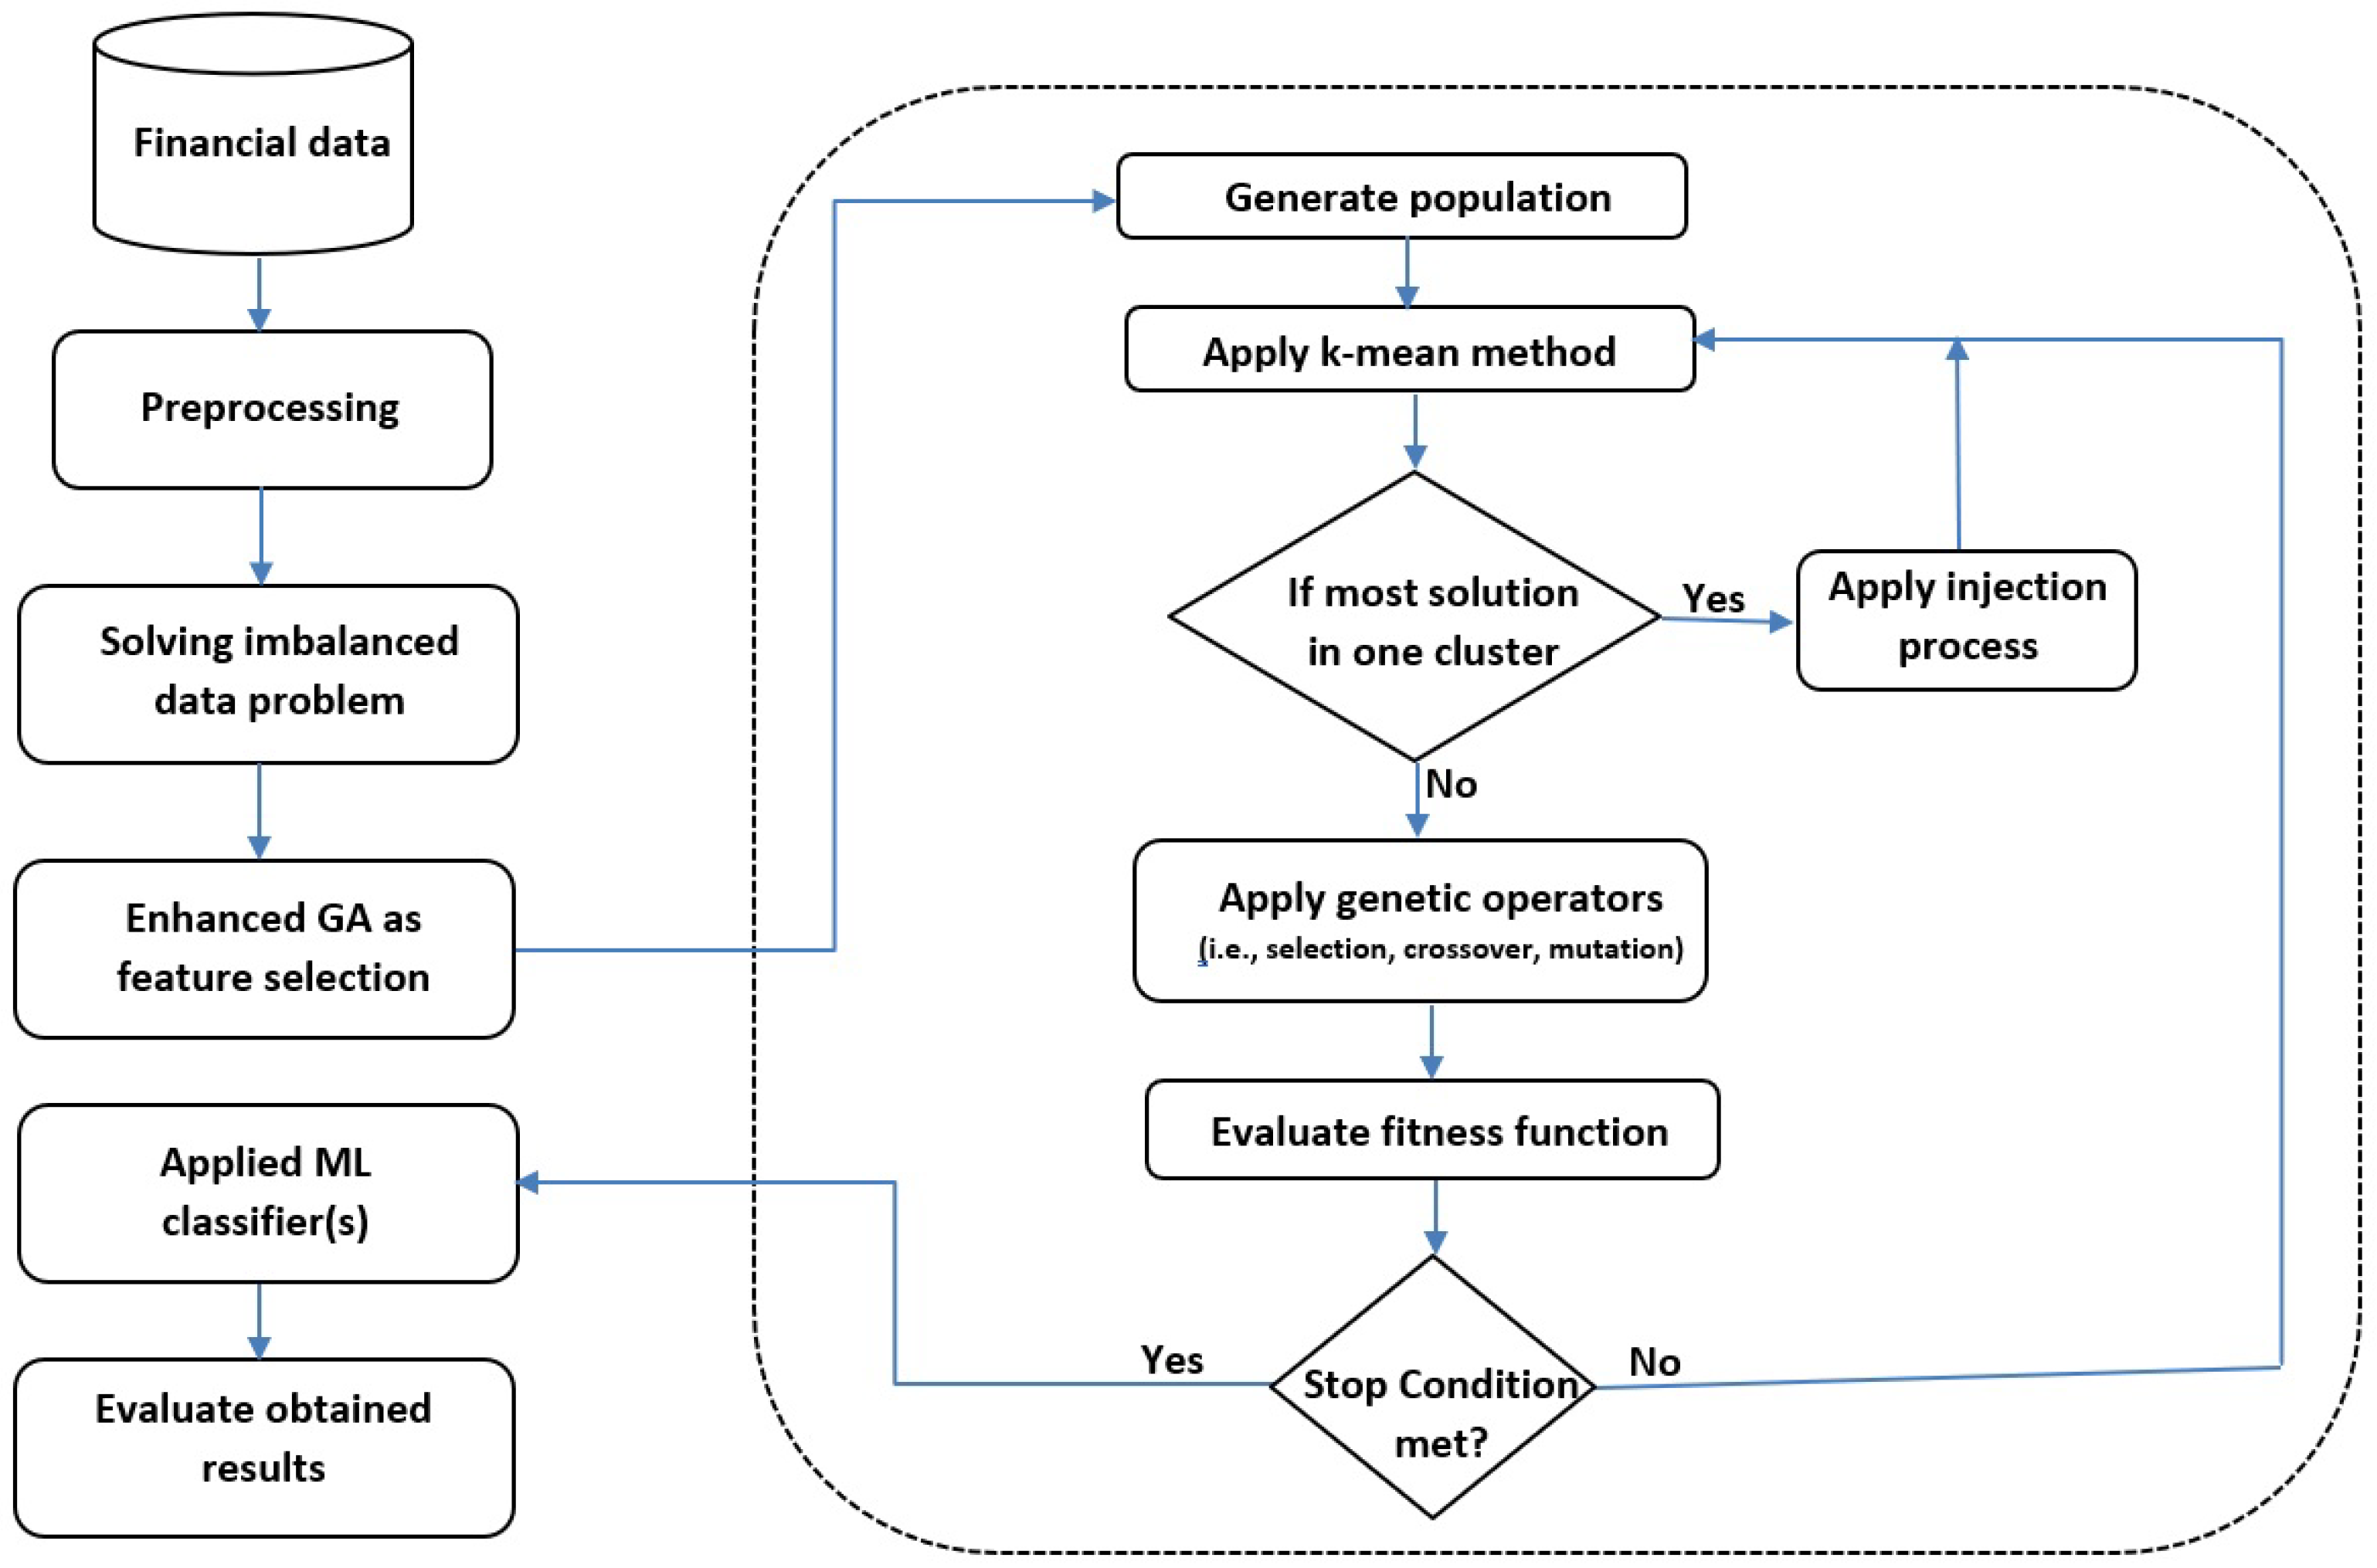
The proposed method of this work is depicted in Figure 1. The PDC-GA enhances the performance of GA by controlling the population diversity of GA. In this work, GA works as a feature selection method. After collecting the financial data for companies based on historical data, eliminating the weak features will enhance the overall performance of ML classifier(s) by reducing the search space of this problem. The population diversity is controlled by clustering the population based on k-means method and redistributing the solutions once most of the solutions are related to one cluster. An adaptive injection process is proposed to balance the exploration and exploitation of GA. Five different ML classifiers are employed to evaluate the selected features. Moreover, we applied the K-fold cross-validation with k-fold = 10 to avoid the overfitting problem. The following subsections explore the proposed method in more detail.
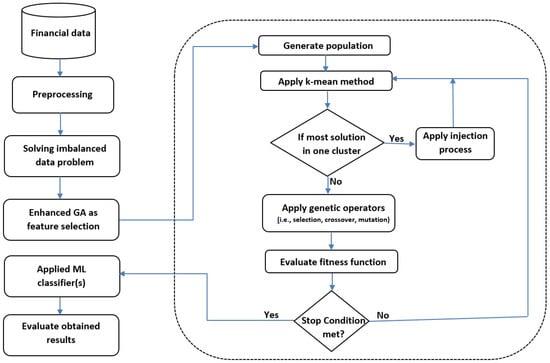
Figure 1.
Population Diversity Controller–Genetic Algorithm (PDC-GA) method.
4.1. Preprocessing
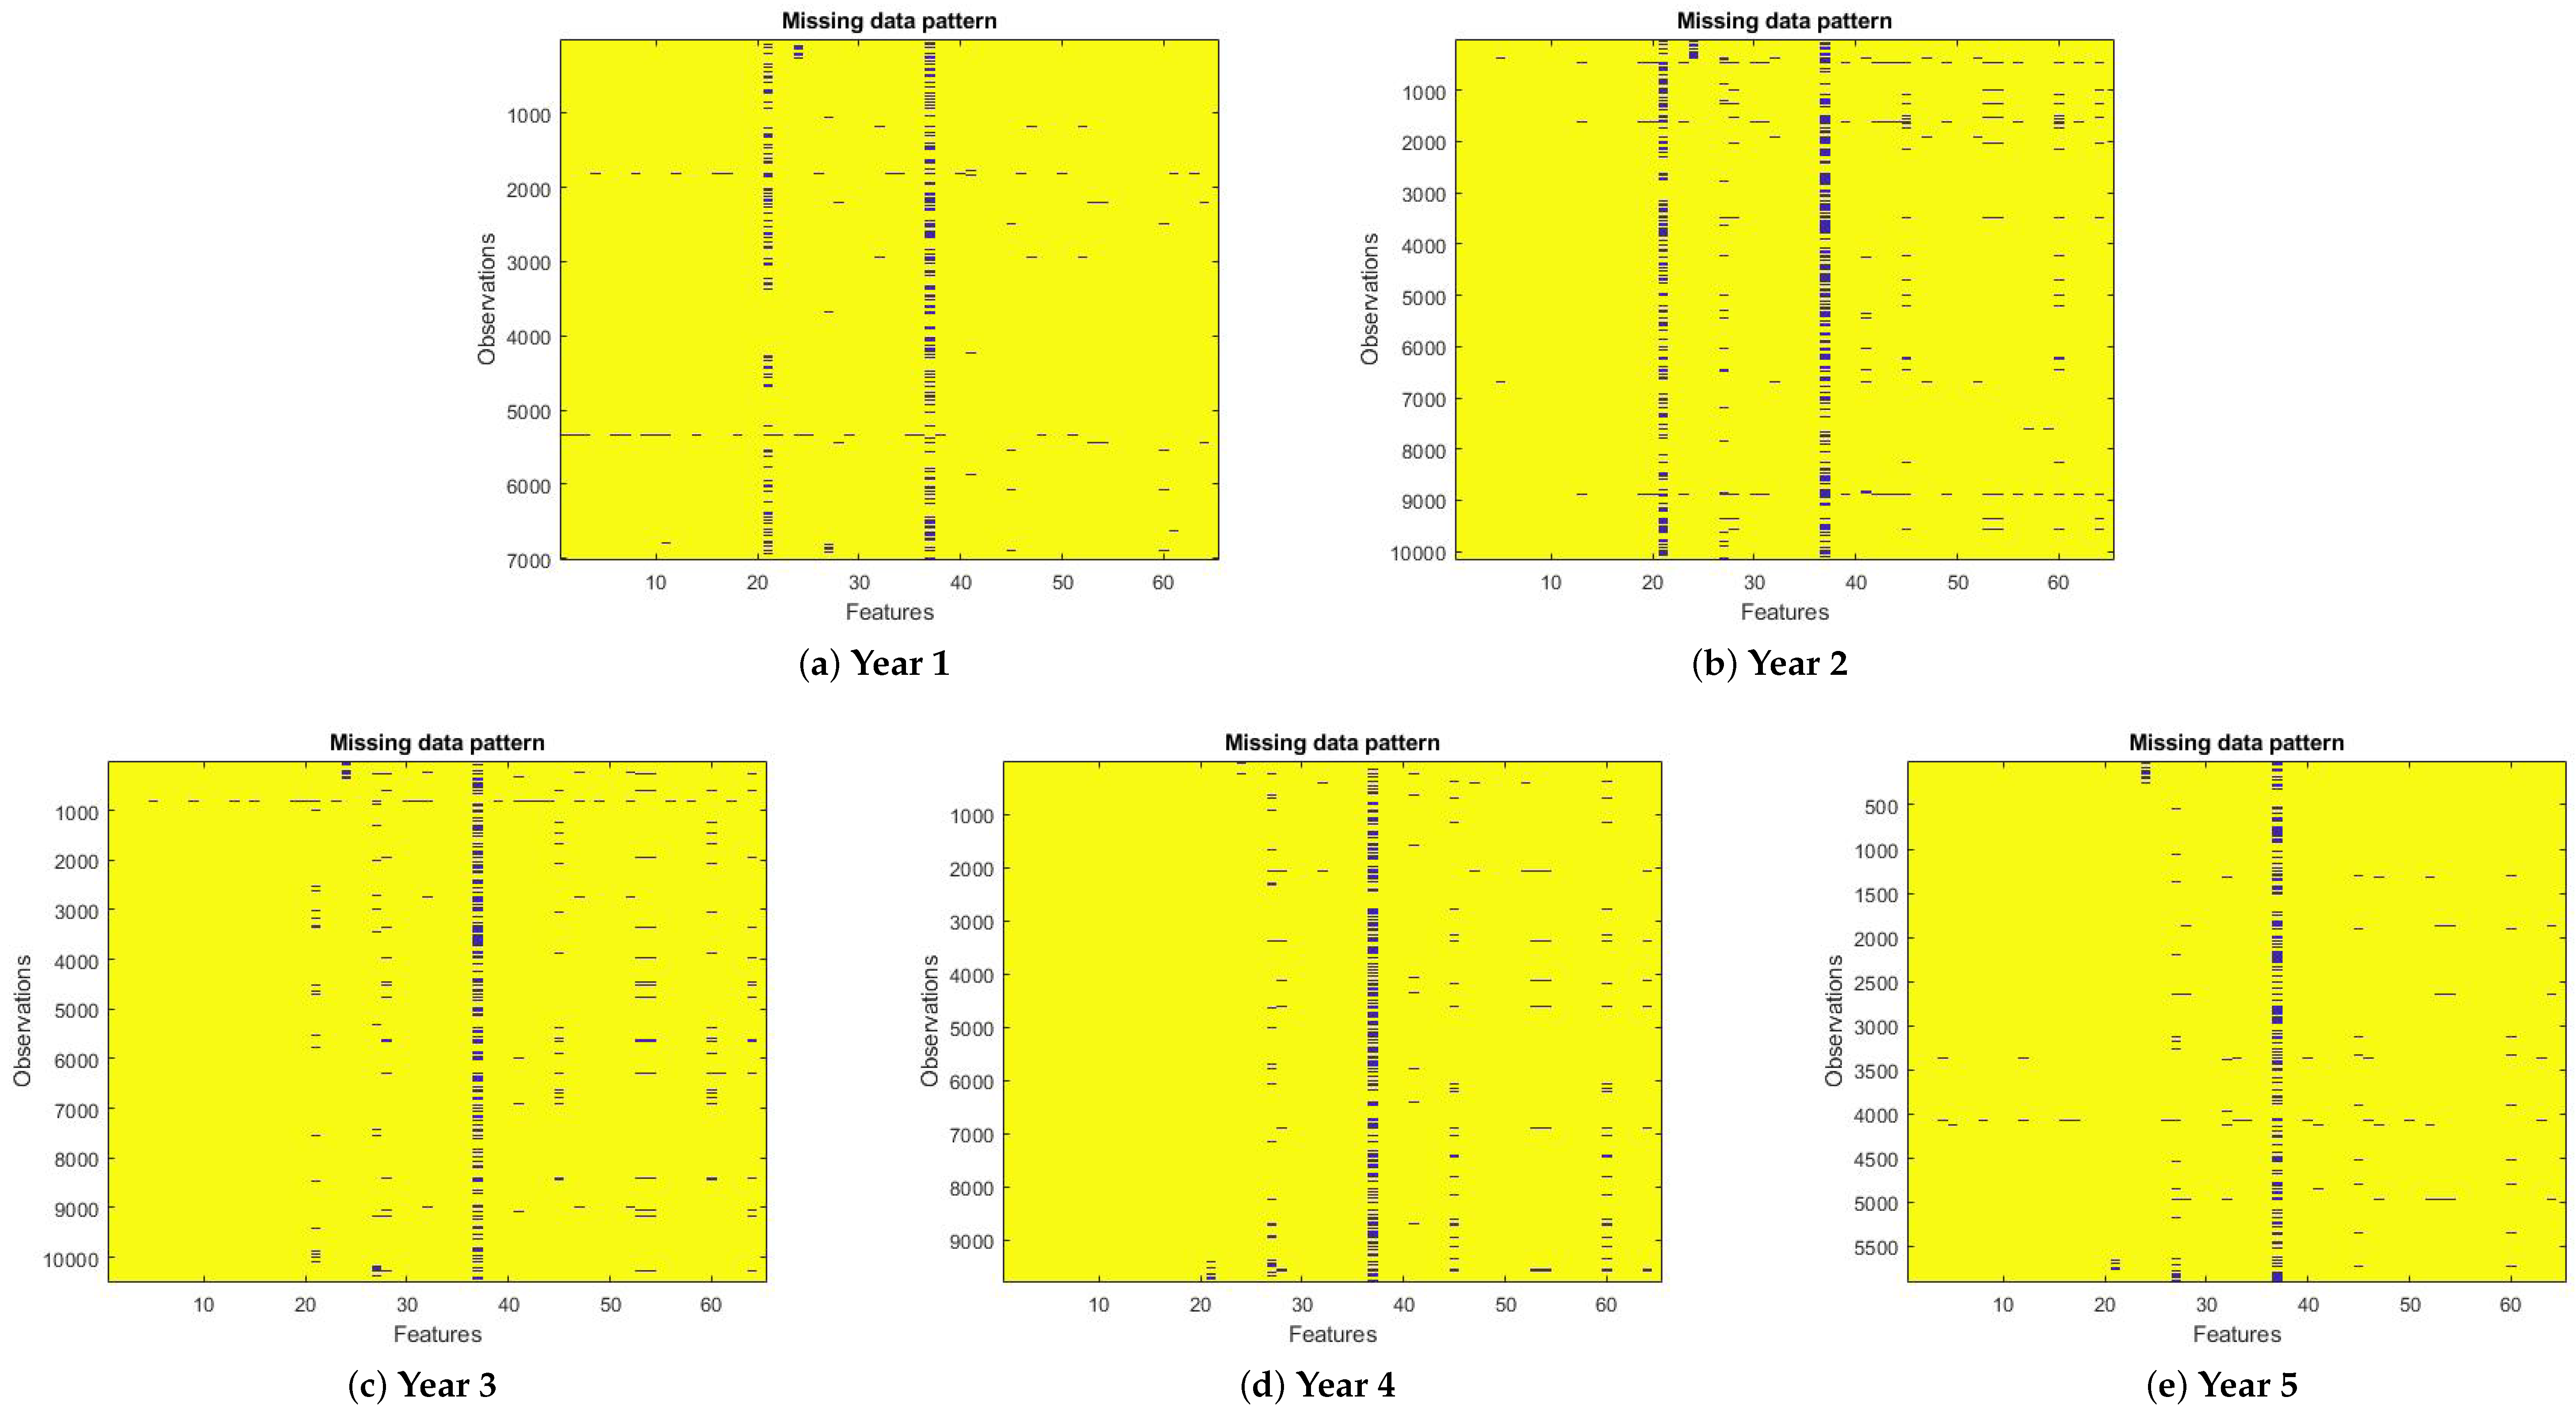
The nature of financial data is very complex and may suffer from several problems due to several reasons, such as missing data, imbalanced cases, human error, or corrupted data. Therefore, building an accurate model is a challenging task. In this paper, to build an accurate model, we examine the collected data, and we found that there are some records that have missing data, as shown in Table 2. Figure 2 demonstrates the missing data patterns for the dataset. It is clear that the distribution of missing data overall are input features. Moreover, we performed two types of experiments: without missing data and with imputting missing data. We employed Synthetic Minority Oversampling Technique (SMOTE) to address imbalanced data. To ensure that all the data were consistent, we normalized all features to be within the range of [0,1].

Table 2.
Missing data percentage.
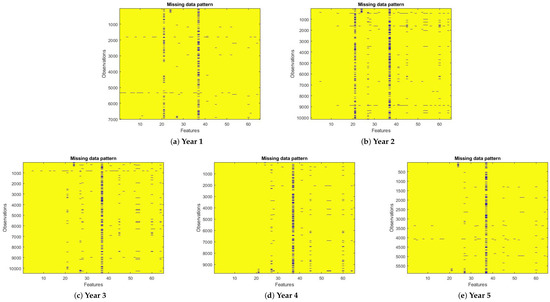
Figure 2.
Pictorial maps for missing data patterns in all years.
4.2. Imbalanced Dataset
The performance of ML classifiers and optimization methods is affected by two factors: number of class type and number of samples. The major problem is called an imbalance problem when the class of interest is quite small compared to the normal one. In general, ML performance is based on a dataset skewed toward the normal class (i.e., majority class). In reality, financial data suffer from imbalanced data problem, which reduces the overall performance of ML classifiers [49].
There are two main approaches to handle the imbalanced data problem: algorithm perspective and data perspective [50]. The data perspective works based on re-sampling the data space. Resampling works using either over-sampling for the minority class or under-sampling instances for the majority class. Moreover, the re-sampling method address the imbalanced data problem randomly or deterministically.
SMOTE is a well-known method used to address imbalanced data, which creates synthetic samples between positive samples and the closest samples to it [50]. Adaptive synthetic sampling (ADASYN) generates a weighted distribution for several minority class based on their difficulty during the learning process [49]. ADASYN is able to reduce the bias toward the minority class and adaptively learn. In this work, we employed the ADASYN method to handle the imbalanced financial data.
4.3. Enhanced Genetic Algorithm
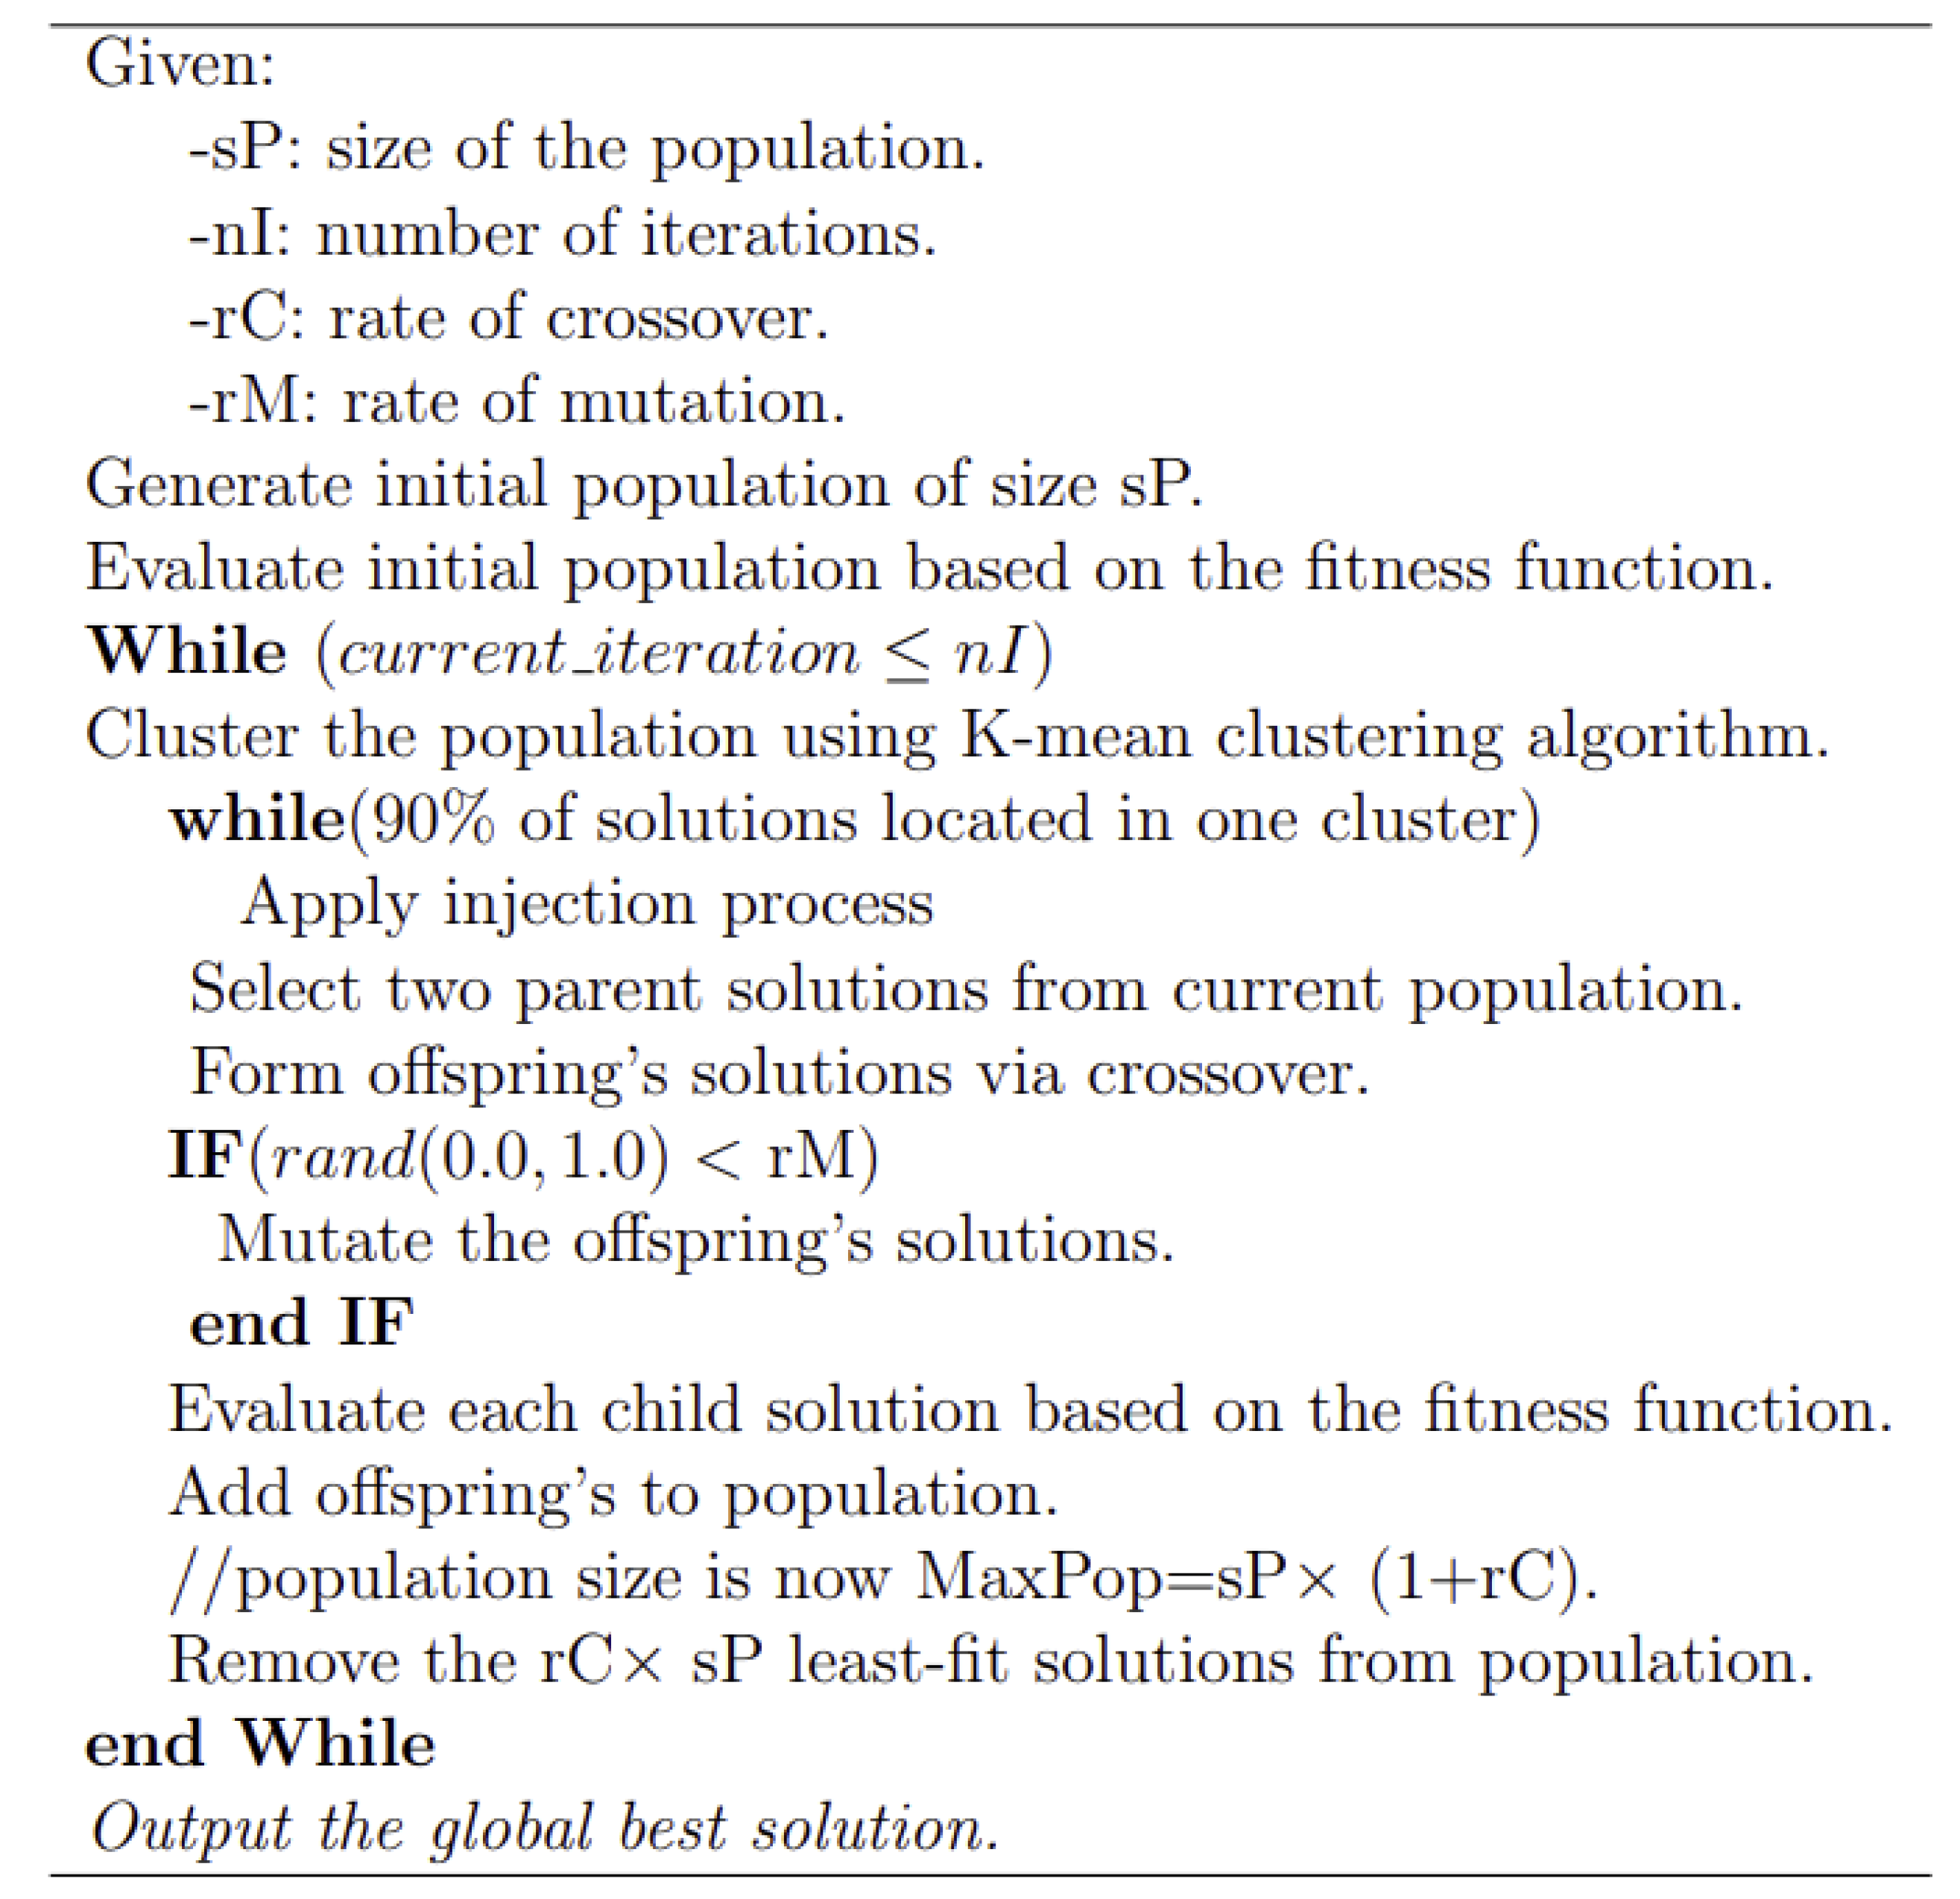
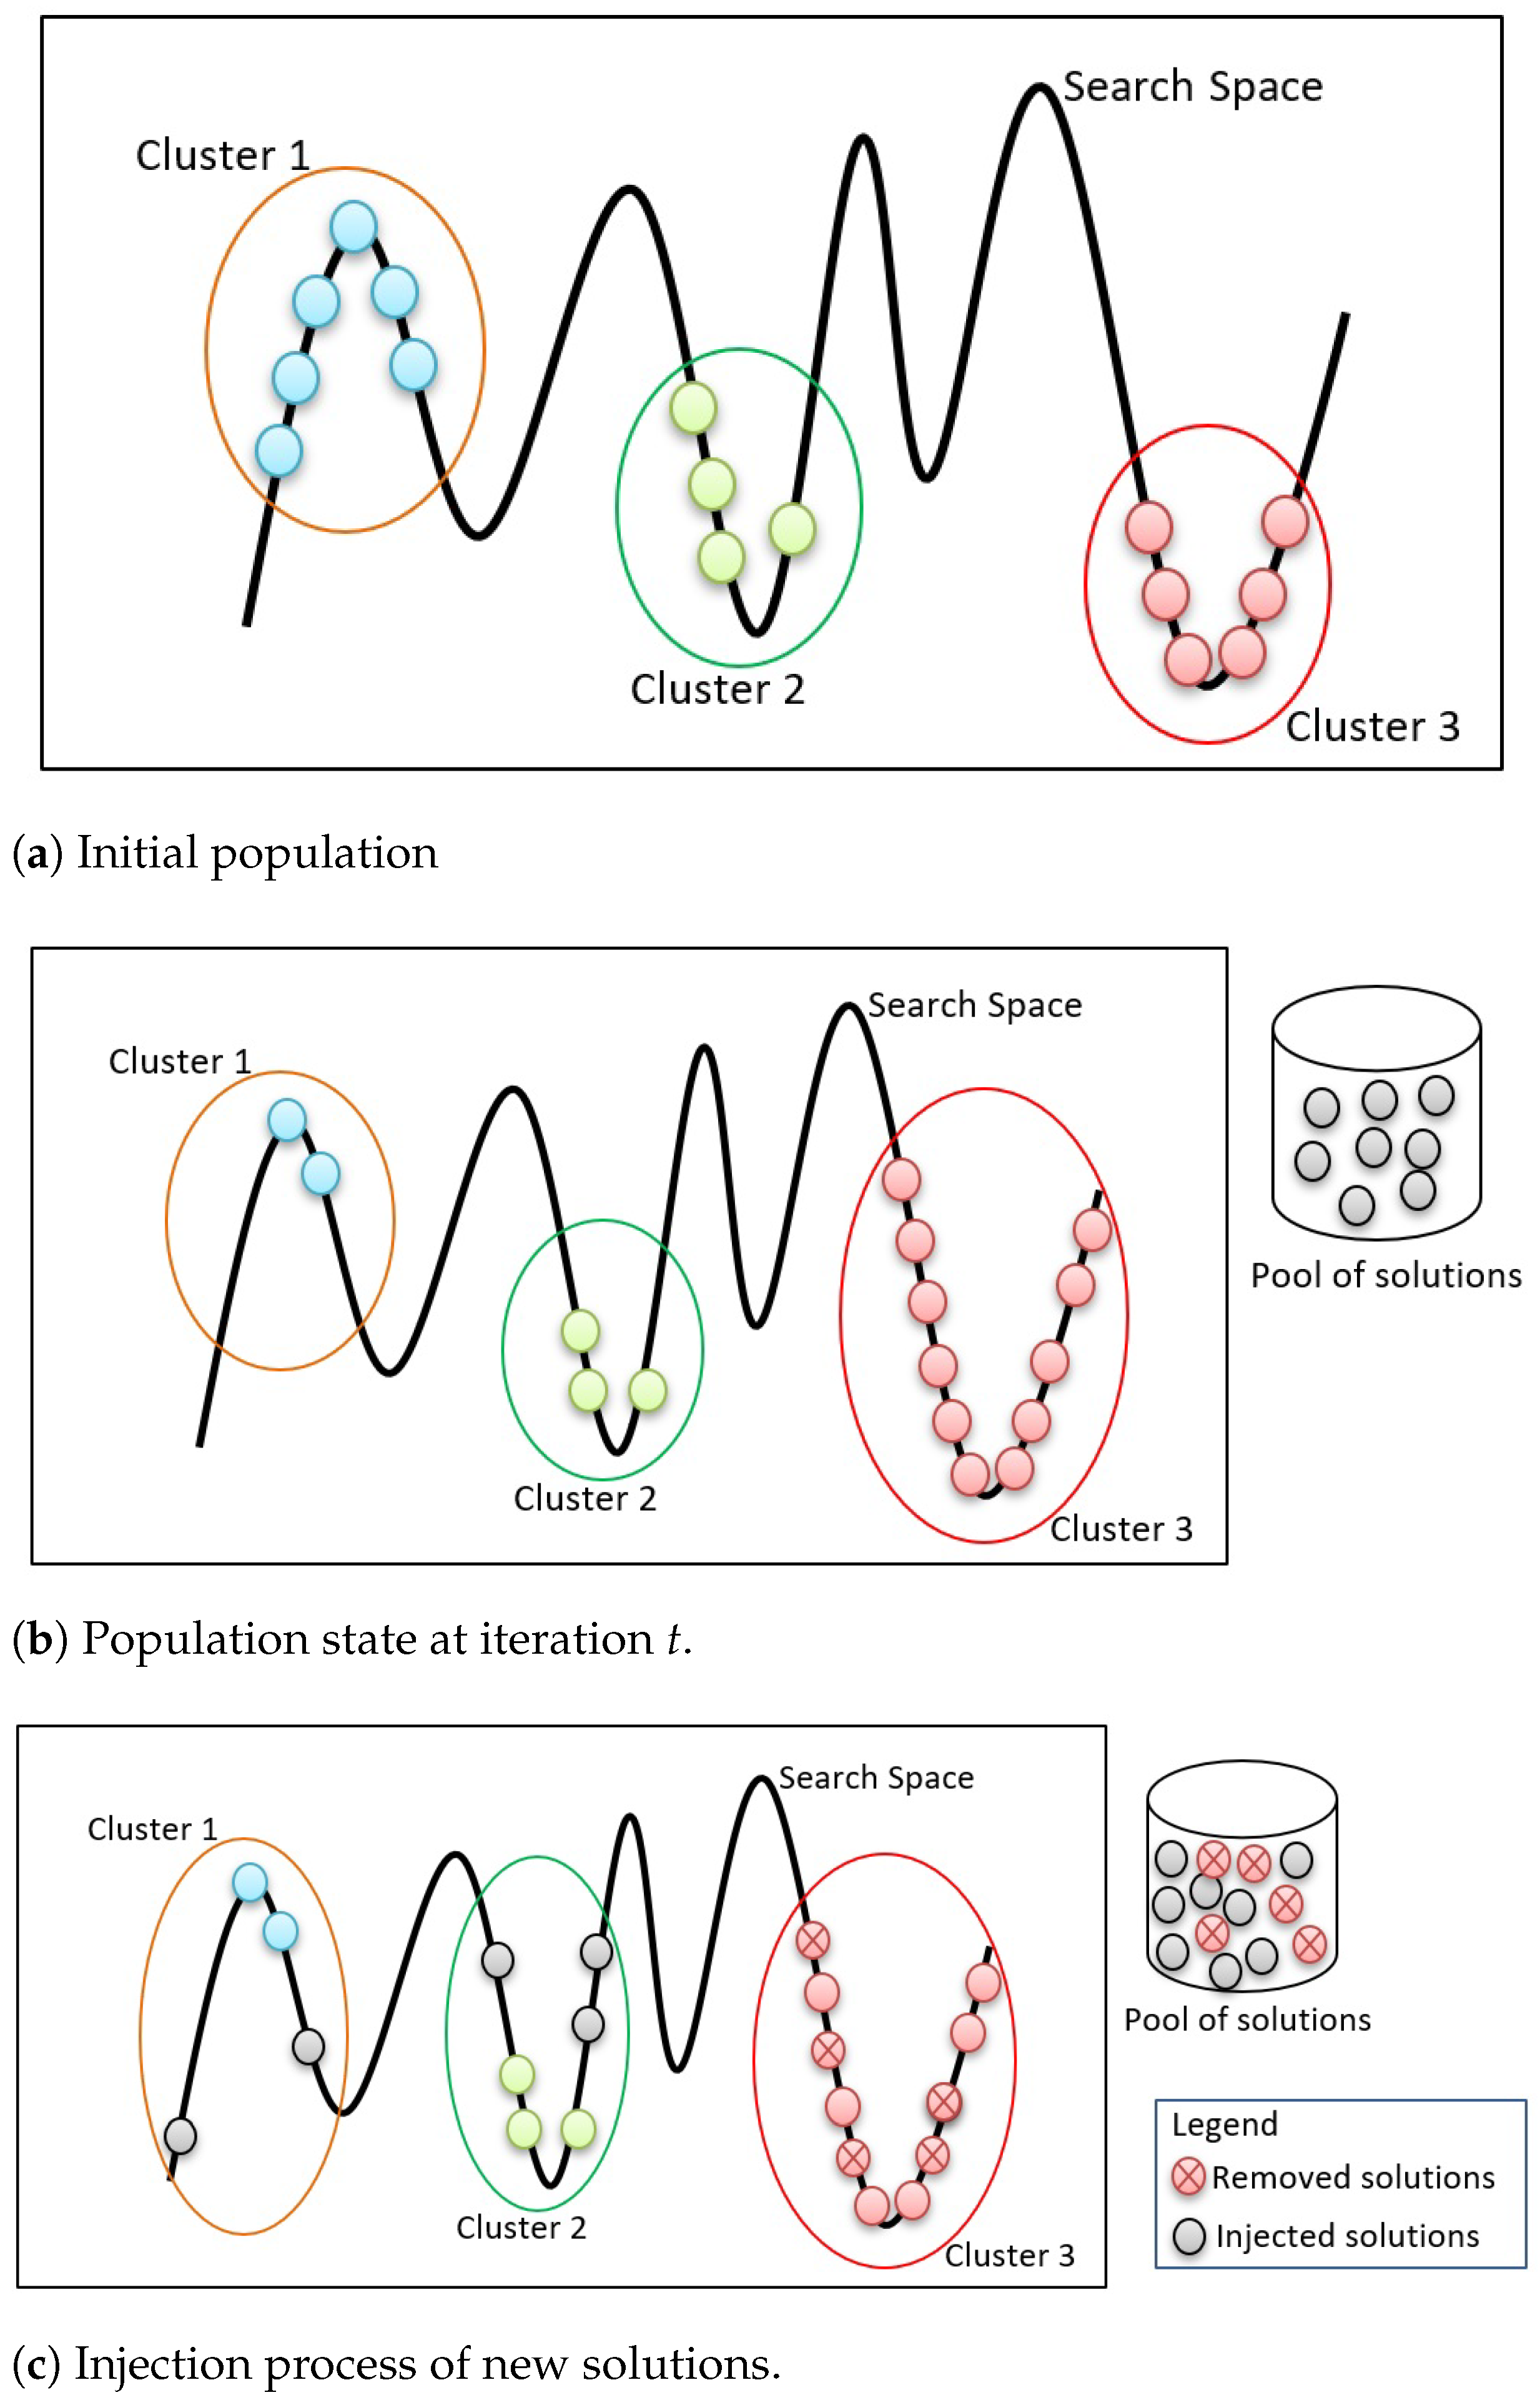
In this paper, we proposed a clustered genetic algorithm, as shown in Figure 3. The proposed approach works based on hybridization between k-means algorithm and the genetic algorithm. To prevent the local optima problem, at each iteration, we performed k-means clustering with k = 3. The process of injecting is demonstrated in Figure 4. The initial population of GA is clustered using k-means method, as shown in Figure 4a. At iteration t, all the solutions are converged (i.e., most solutions are located in one cluster), as shown in Figure 4b. Once most of the solutions are located in one cluster, an injection process of new solutions is obtained from a pool of solutions (i.e., worst solutions from previous genetic operations).
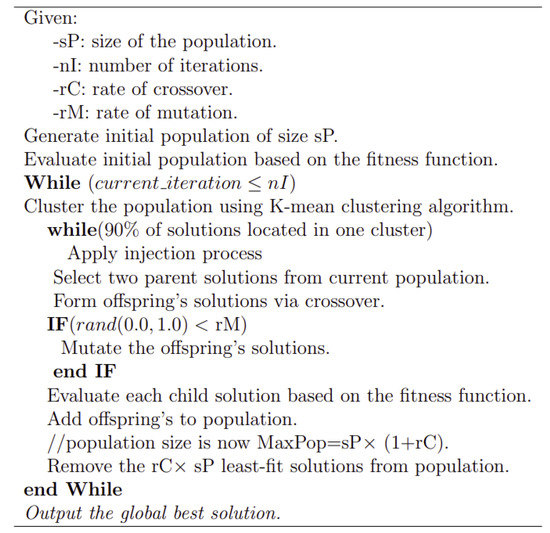
Figure 3.
The pseudo-code for enhanced Genetic Algorithm.
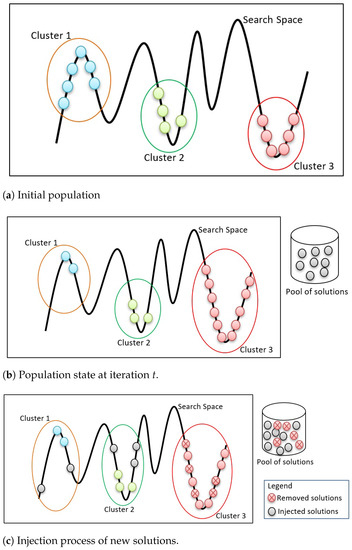
Figure 4.
Injection process for new solutions.
Figure 5 presents the pseudo-code for the injection process, which presents the redistribution process of the solutions in the search space once 90% of the solutions are located in one cluster. Since the population size is fixed in GA, the number of injected solutions should be equal to the number of removed solutions. This number is determined based on Equation (2), where presents the highest number of solutions located in clusters, presents the lowest number of solutions located in clusters, presents the maximum number of iterations, and presents the population size. All injected solutions are obtained from a pool of solutions (i.e., generated randomly) to make sure they are distributed over the search space.

Figure 5.
The pseudo-code for injection process.
We employed an internal classifier based on the k-Nearest Neighbors (kNN) algorithm to evaluate the selected features. The reason behind selecting kNN as an internal classifier is that the time complexity of kNN is , where n means the number of training samples, while s means the number of selected features. The fitness function of kNN is presented in Equation (1), where the accuracy of kNN classification is used as a fitness function, where TP, FP, TN, and FN are the calculated values of true positive, false positive, and true negative, and false negative, respectively.
4.4. Machine Learning Classifier(S)
There are many classification methods that can be employed on binary classification problems. However, in this work, the 10-fold cross-validation technique was employed using five classification methods, namely K nearest neighbor (kNN), linear discriminant (LD), decision tree (DT), support vector machine (SVM), and logistic regression (LR). Each classifier works in a different manner, so examining the performance of these classifiers over the bankruptcy problem using the 10-fold cross-validation technique is investigated in this work. Moreover, the cross-validation method reduces the possibility of over-fitting and redundancy of the data, so it enables us to generate a robust model.
4.5. Evaluation Process
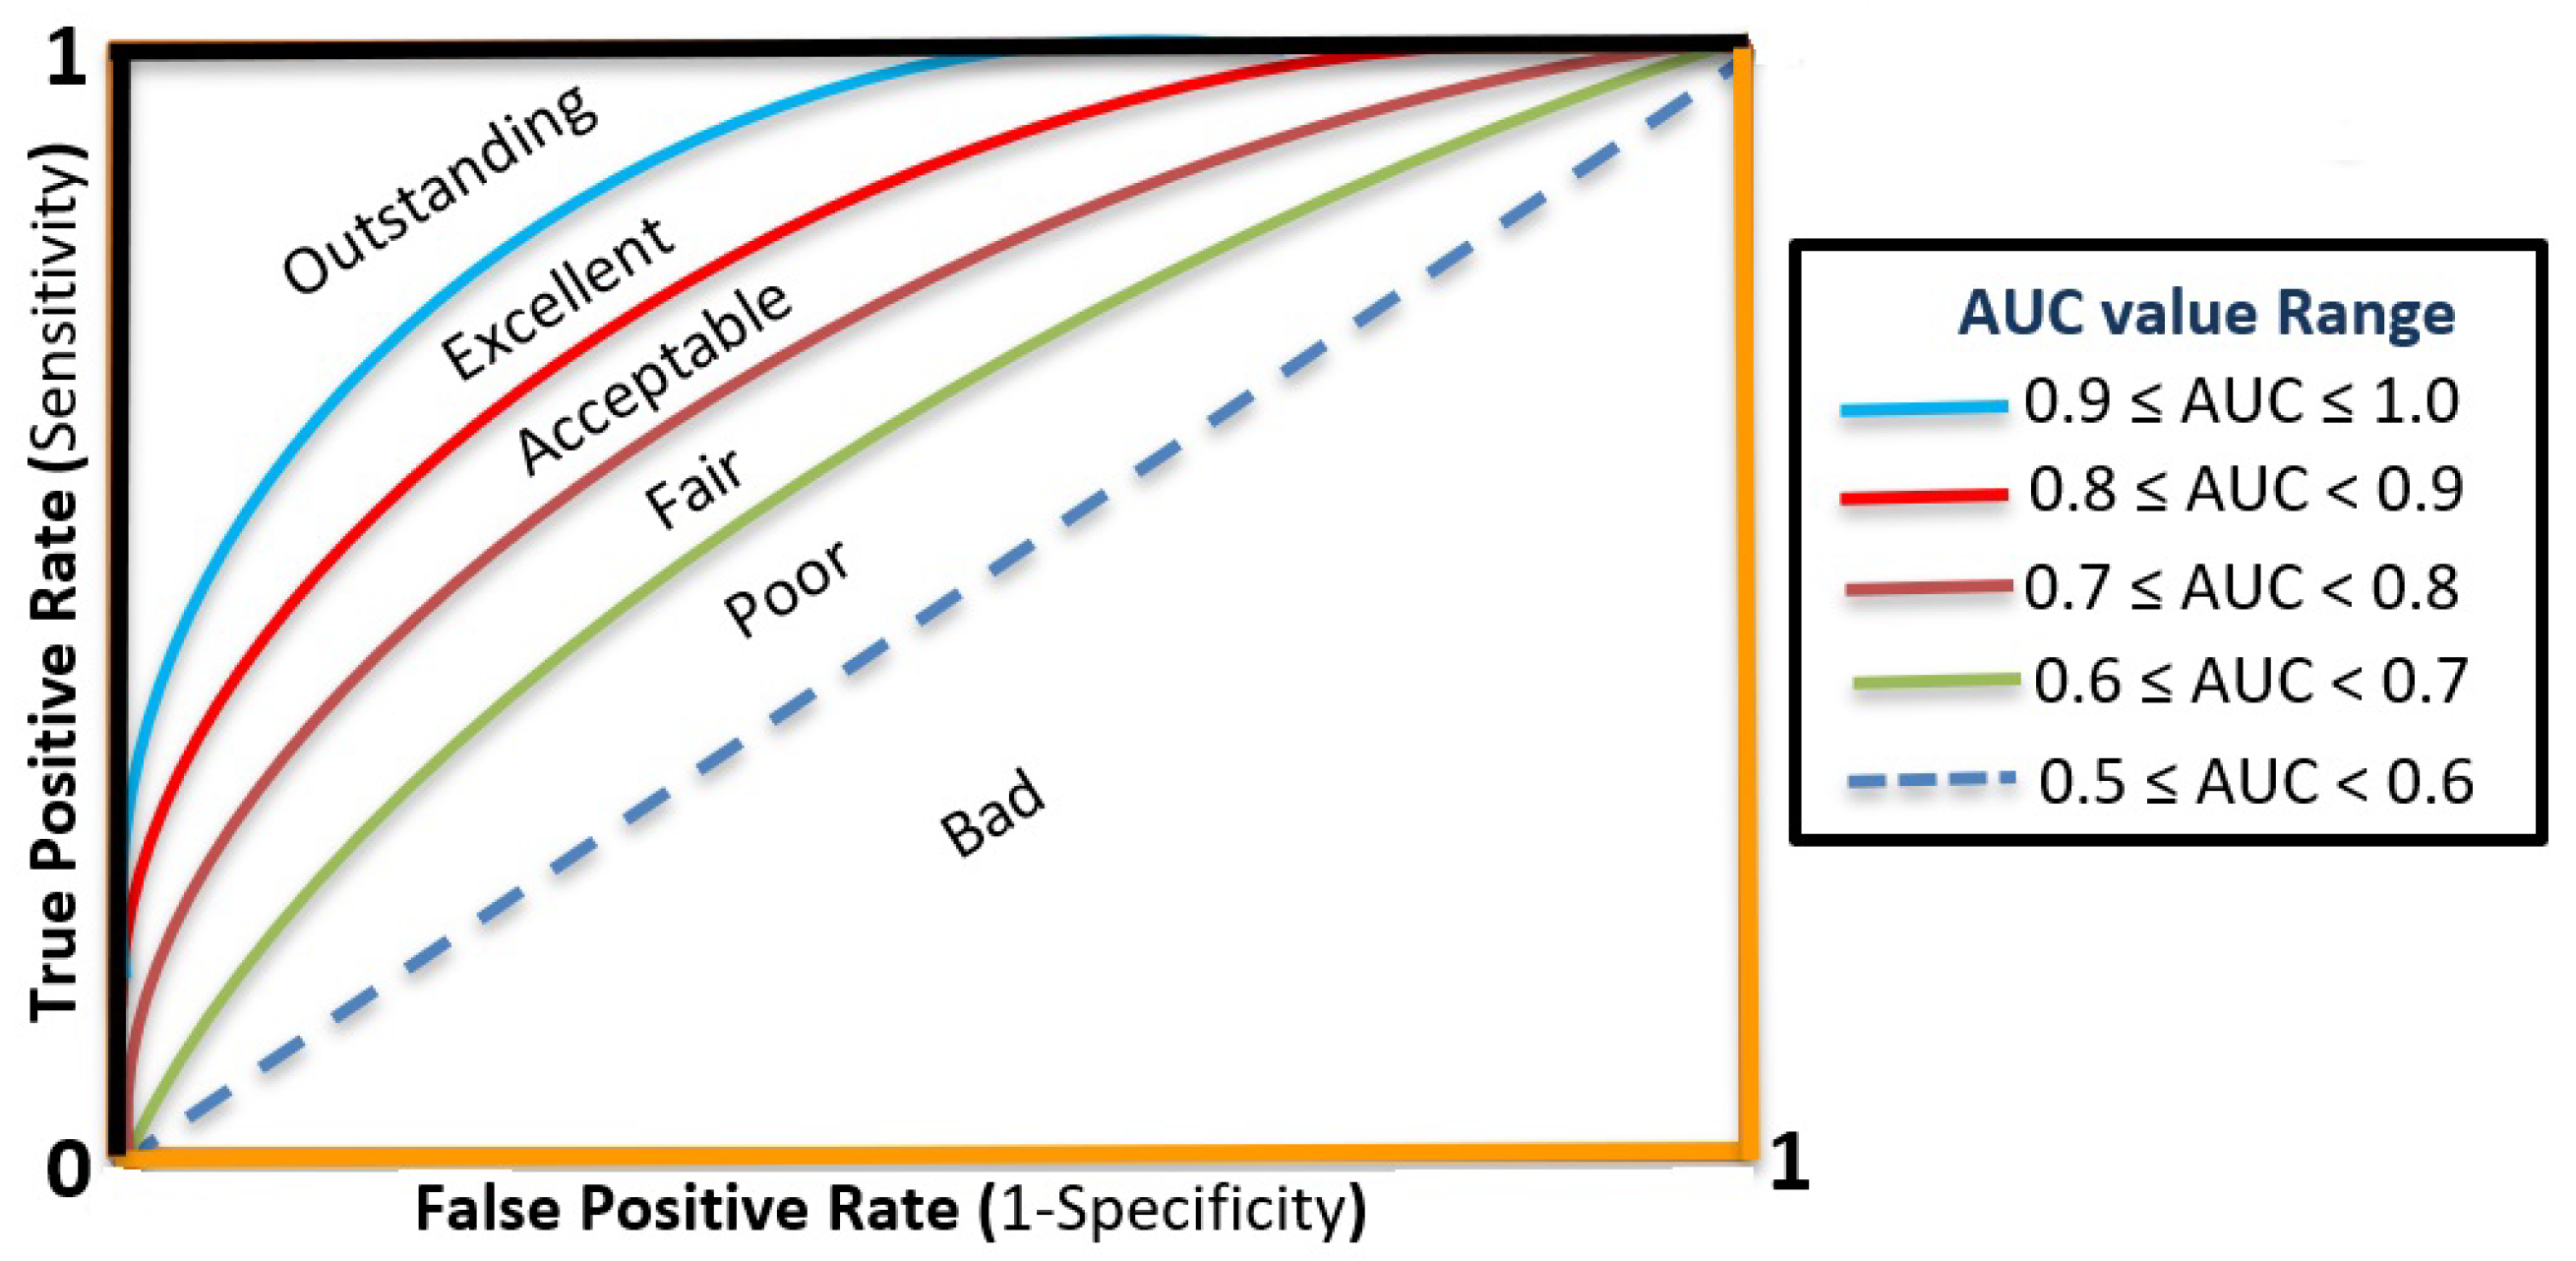
Since the bankruptcy problem is a binary classification, we employed the area under the receiver operating characteristics curve (AUC) as an evaluation criterion. The AUC value reports the ratio between the number of correctly classified samples to the total number of testing samples. Equation (3) presents an over average for the k-fold cross-validation method.
where CV represents the cross-validation accuracy, k represents the number of folds (i.e., k-fold = 10), and A represents the AUC value for each fold. Figure 6 demonstrates a pictorial diagram for AUC curves with its meanings.
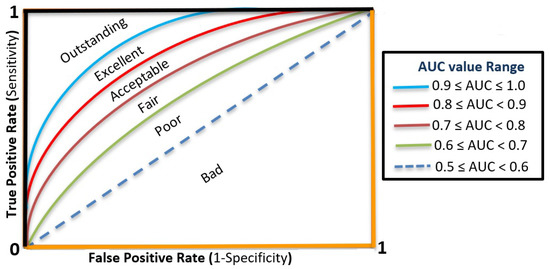
Figure 6.
A pictorial diagram for the ROC curves and AUC values.
5. Results and Analysis
The proposed approach was implemented in MATLAB R2019b environment, and the simulations were executed on an Intel Core i5- M40 2.4-GHz processor with 4 GB RAM. The parameters adopted in all experiments, either for standard GA or the proposed enhanced GA, are listed in Table 3. In this work, we performed two types of experiments: (i) standard genetic algorithm based on the pseudo-code, and (ii) enhanced genetic algorithm. Both experiments employed the same fitness function as shown in Equation (1). To evaluate the overall performance of selected features either from standard or enhanced genetic algorithm, we executed four different classifiers (i.e., KNN, LD, DT, SVM, and LR). Each classifier is evaluated based on the average AUC value as shown in Equation (3). The following subsections demonstrate the obtained results and analysis.

Table 3.
Parameters setting of standard GA and enhanced GA.
5.1. Feature Selection Results
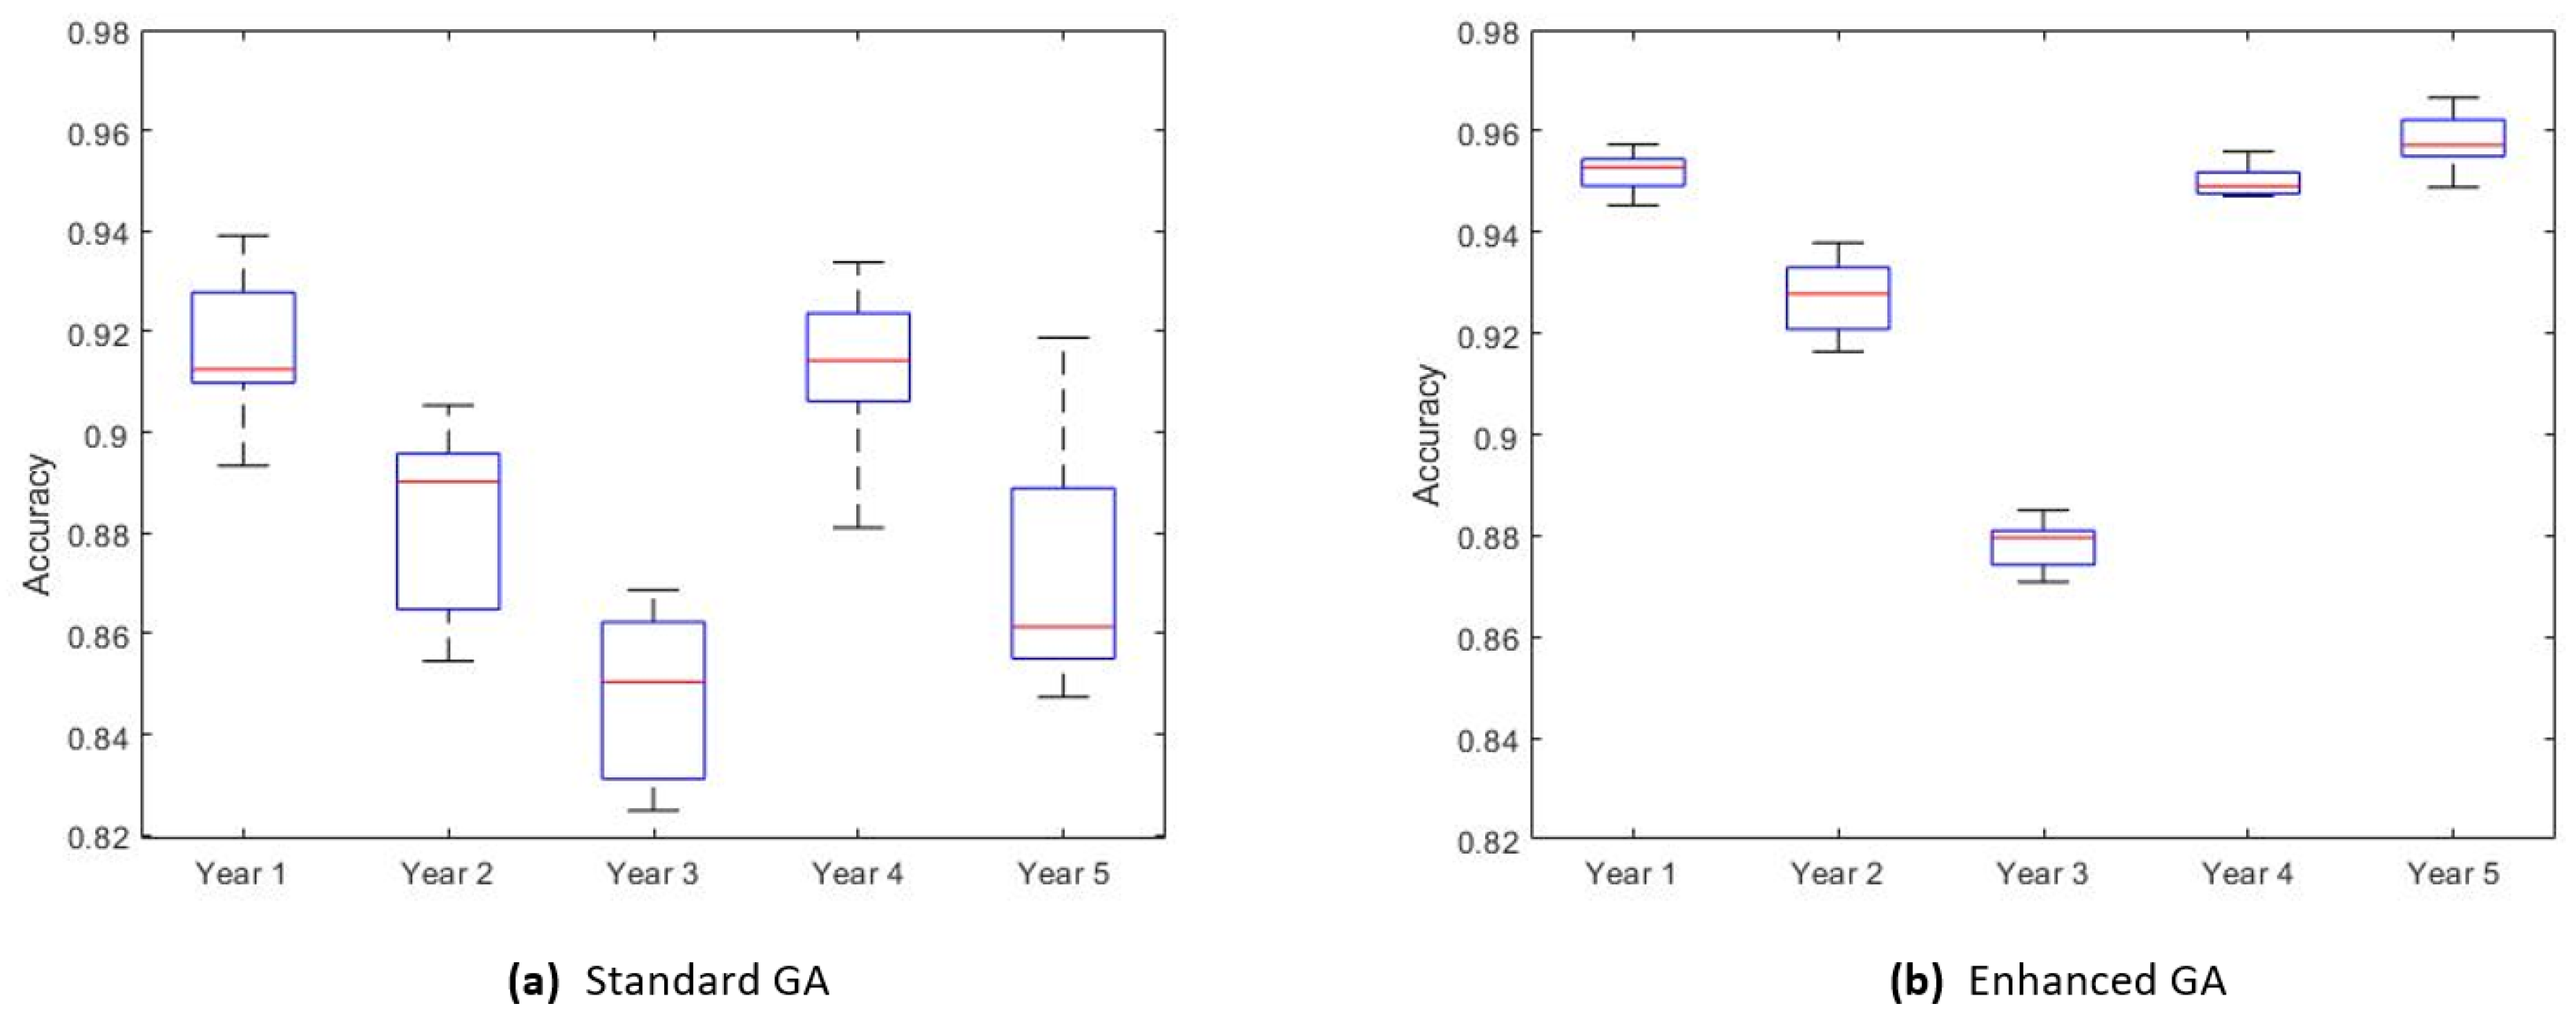
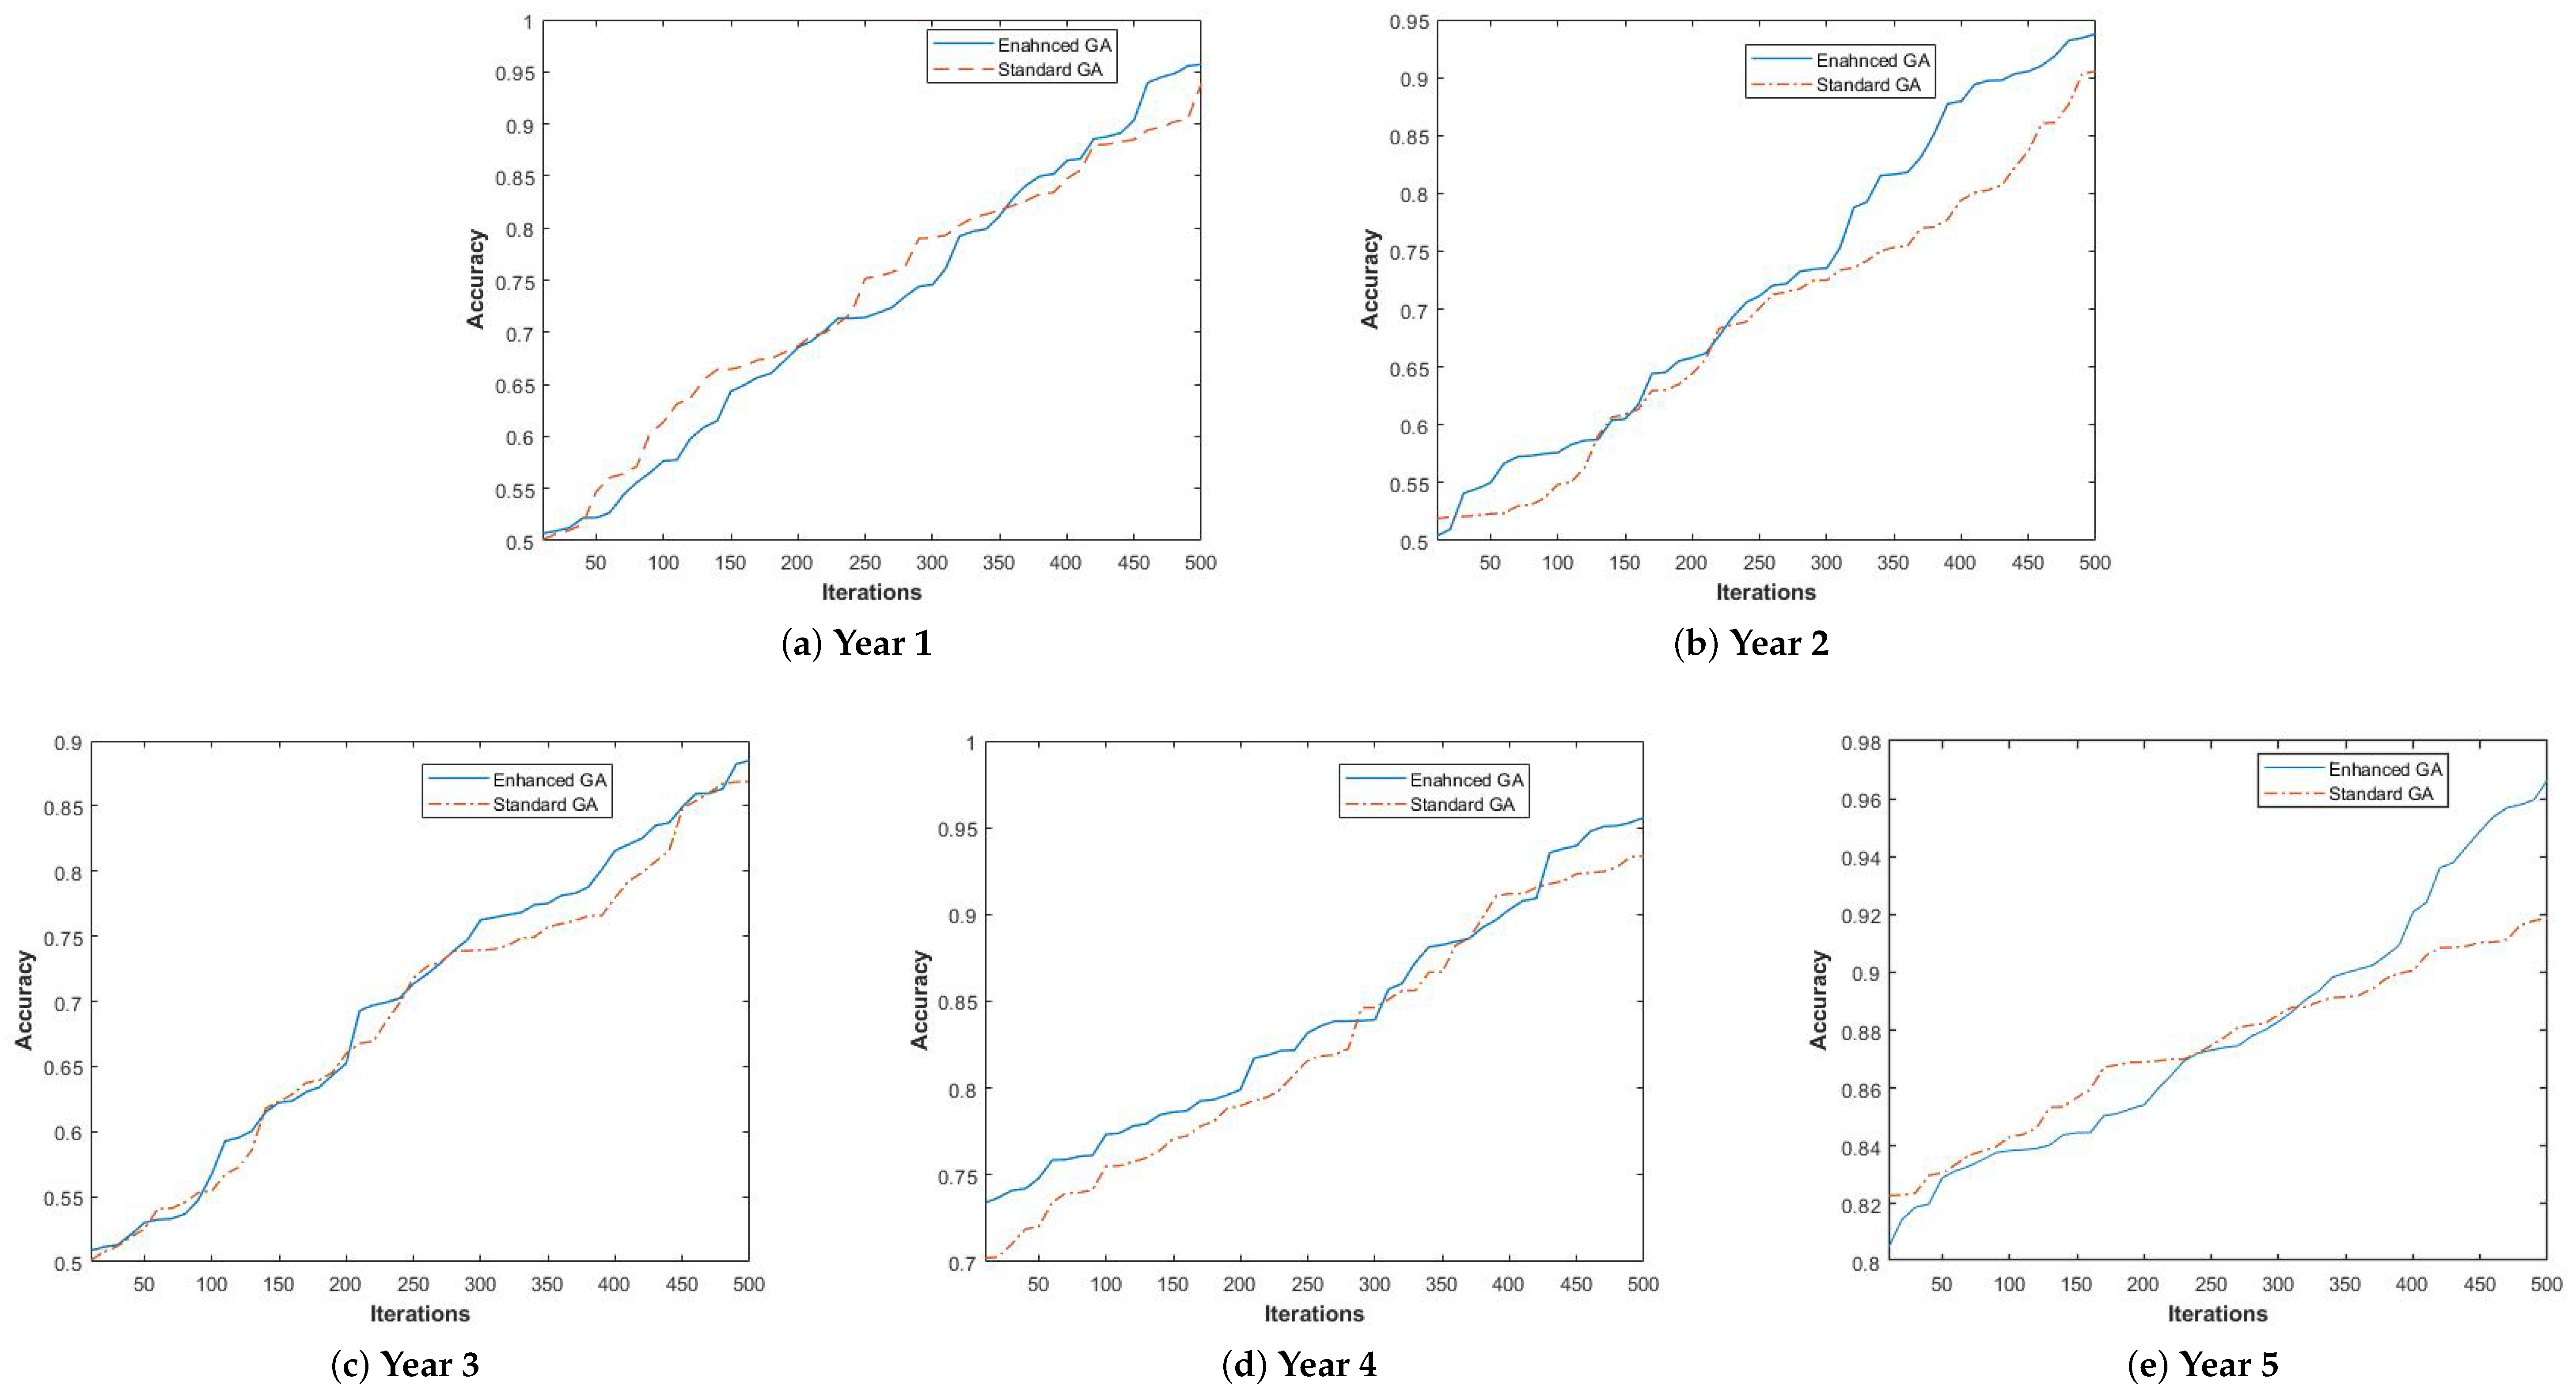
Finding the most important features for the bankruptcy problem gives us more information about this problem. We executed 21 different independent runs for each year. Table 4 explores the obtained results for standard and enhanced genetic algorithm without imputing missing data (i.e., removing missing data). It is obvious that the proposed approach outperforms the standard genetic algorithm based on fitness value and the number of selected features. For example, the year 1 results show that the performance of enhanced GA is , which outperforms the standard GA, which is . Moreover, the number of selected features is improved for all datasets. For example, there are 18 features selected using standard GA for year 5, while enhanced GA selects 14 features. The reported selected features are the best features out of 21 independent runs. Reducing the number of features will reduce the computational time for machine learning and remove the redundant/irrelevant features. Boxplot diagrams for enhanced GA and standard GA are presented in Figure 7. It is obvious that the performance of enhanced GA for all years has more robust performance compared to the standard GA during the 21 independent runs and able to overcome the premature convergence during the search space. Figure 8 demonstrates the performance of the exploration process for both methods. It is clear that an enhanced genetic algorithm is able to explore the search space better than standard GA.

Table 4.
Obtained results for standard and enhanced GA as a feature selection.
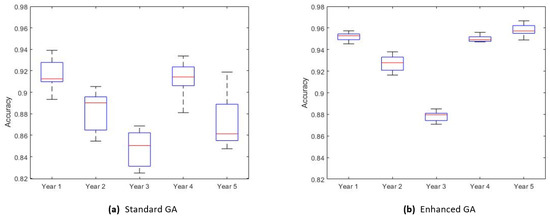
Figure 7.
Boxplot diagrams for 21 independent runs.
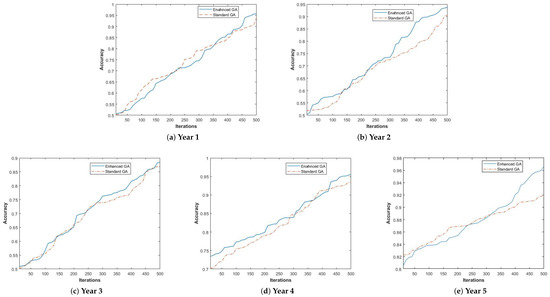
Figure 8.
The exploration performance for enhanced and standard GA.
5.2. Classifiers Models Results
To evaluate the best feature selected in the previous section, we employed five different binary classifiers (i.e., KNN, LD, DT, SVM, and LR), Since the datasets used in this work have missing data, we employed two types of experiments: (i) without imputing missing data, and (ii) with imputing missing data. We executed each classifier 21 times using a 10-fold cross-validation method. All reported results represent the mean value of AUC. Table 5 shows the obtained results for all years without imputing. It is clear that SVM with enhanced GA outperforms other methods in three datasets (i.e., year 2, year 3, and year 4), while KNN with enhanced GA outperforms in two datasets (i.e., year 1 and year 5). It is clear that our proposed approach is able to enhance the performance of machine learning classifiers.

Table 5.
Obtained mean results with feature selection without imputing missing data.
Table 6 shows the obtained results with imputing missing data. We employed the average method to impute the missing data. The obtained results show that the enhanced genetic algorithm outperforms the standard GA in four datasets (i.e., year 1, year 2, year 4, and year 5), while the performance of standard GA outperforms the enhanced GA only in one dataset (i.e., year 3). Moreover, from comparing the obtained results from Table 5 and Table 6, it is clear that imputing missing data reduces the overall performance of classifiers. Four datasets (i.e., year 1, year 2, year 4, and year 5) gain less accurate values after imputing missing data. We believe that imputing missing is not valuable in our case for two reasons: (i) percentage of missing data is small (less than 2%), and (ii) imputing missing data based on average value is not a sufficient method.

Table 6.
Obtained mean results with feature selection with imputing missing data.
Table 7 shows the obtained results without a feature selection algorithm. We executed all classifiers in two different ways: without imputing missing data, and with imputing missing data. The algorithm with imputing missing data outperforms that without imputing missing data in all datasets except the year 5 dataset. Moreover, the reported results in Table 6 show that applying feature selection improves the overall performance of machine learning classifiers since the search space is reduced.

Table 7.
Obtained mean results without feature selection.
Table 8 compares the obtained results with a set of algorithms from the literature. It is clear that the proposed feature selection is able to enhance the obtained results in three datasets (i.e., year 3, year 4, and year 5), while imputing missing data without a feature selection approach (i.e., Approach 4) outperforms all other methods in Year 2 using SVM method. However, the EXGB method that is proposed by Zięba et al. [4] outperforms all other methods in Year 1.

Table 8.
Comparison results of the literature.
where
- LDA: linear discriminant analysis.
- MLP: multilayer perceptron with a hidden layer.
- JRip: decision rules inducer.
- CJRip:cost-sensitive variation of JRip.
- J48: decision tree model.
- CJ48: cost-sensitive variation of J48.
- LR: Logistic Regression.
- CLR: cost-sensitive variation of Logistic Regression.
- AB: AdaBoost.
- AC: AdaCost.
- SVM: Support Vector Machines.
- CSVM: Cost-sensitive Support Vector Machines (CSVM)
- RF: Random Forest.
- XGB: Boosted trees trained with Extreme Gradient Boosting.
- EXGB: Ensemble of boosted trees.
- Approach 1: With feature selection and without imputing missing data.
- Approach 2: With feature selection and with imputing missing data.
- Approach 3: Without feature selection without imputing missing data.
- Approach 4: Without feature selection with imputing missing data.
Finally, employing feature selection based on enhanced GA is able to enhance the overall performance of machine learning classifiers. Moreover, controlling the population diversity of GA will help the searching algorithm to overcome the local optima problem.
6. Conclusions and Future Works
In this work, we present a novel approach to control the population diversity for genetic algorithm while searching for optimal solutions. The PDC-GA method is presented as a feature selection method. The genetic algorithm is hybridized with k-means clustering method to cluster the population while performing genetic operators. An injection method is proposed to redistribute the population once 90% of the solutions are located in one cluster. Predicting bankruptcy cases in advance is a challenging task for banks and companies, due to its importance for financial sectors in all countries. As a result, finding a robust method to predict bankruptcy cases is needed. PDC-GA method has been employed successfully in this domain. The obtained results of the PDC-GA outperform the standard GA as a feature selection. Moreover, we employed five machine learning classifiers (i.e., KNN, LD, DT, SVM, and LR) to evaluate the obtained results of the proposed algorithm. The performance of the proposed PDC-GA enhanced the original performance of standard GA between 1 and . In our future work, we will apply the proposed method to optimize several real problems in industrial and research fields.
Author Contributions
Methodology, N.A.-M.; Software, N.A.-M.; Supervision, A.H. and N.O.; Validation, N.A.-M., A.H. and N.O.; Writing—original draft, N.A.-M., A.H. and N.O. All authors have read and agreed to the published version of the manuscript.
Funding
This research received no external funding.
Acknowledgments
We would like to acknowledge the anonymous reviewers for the valuable comments that improved the quality of this paper. Moreover, we would also like to thank the Editors for their generous comments and support during the review process.
Conflicts of Interest
The authors declare no conflict of interest.
References
- Lin, L.; Gen, M. Auto-tuning strategy for evolutionary algorithms: Balancing between exploration and exploitation. Soft Comput. 2009, 13, 157–168. [Google Scholar] [CrossRef]
- Alba, E.; Dorronsoro, B. The exploration/exploitation tradeoff in dynamic cellular genetic algorithms. IEEE Trans. Evol. Comput. 2005, 9, 126–142. [Google Scholar] [CrossRef]
- Črepinšek, M.; Liu, S.H.; Mernik, M. Exploration and Exploitation in Evolutionary Algorithms: A Survey. ACM Comput. Surv. 2013, 45, 35:1–35:33. [Google Scholar] [CrossRef]
- Zięba, M.; Tomczak, S.K.; Tomczak, J.M. Ensemble boosted trees with synthetic features generation in application to bankruptcy prediction. Expert Syst. Appl. 2016, 58, 93–101. [Google Scholar] [CrossRef]
- Soui, M.; Smiti, S.; Mkaouer, M.W.; Ejbali, R. Bankruptcy Prediction Using Stacked Auto-Encoders. Appl. Artif. Intell. 2020, 34, 80–100. [Google Scholar] [CrossRef]
- Chen, Z.; Chen, W.; Shi, Y. Ensemble learning with label proportions for bankruptcy prediction. Expert Syst. Appl. 2020, 146, 113155. [Google Scholar] [CrossRef]
- Zoričák, M.; Gnip, P.; Drotár, P.; Gazda, V. Bankruptcy prediction for small- and medium-sized companies using severely imbalanced datasets. Econ. Model. 2020, 84, 165–176. [Google Scholar] [CrossRef]
- Boucher, T.R.; Msabaeka, T. Trained Synthetic Features in Boosted Decision Trees with an Application to Polish Bankruptcy Data. In Advances in Information and Communication; Arai, K., Kapoor, S., Bhatia, R., Eds.; Springer International Publishing: Cham, Switzerland, 2020; pp. 295–309. [Google Scholar]
- Uthayakumar, J.; Metawa, N.; Shankar, K.; Lakshmanaprabu, S. Financial crisis prediction model using ant colony optimization. Int. J. Inf. Manag. 2020, 50, 538–556. [Google Scholar] [CrossRef]
- Chen, N.; Chen, A.; Ribeiro, B. Influence of Class Distribution on Cost-Sensitive Learning: A Case Study of Bankruptcy Analysis. Intell. Data Anal. 2013, 17, 423–437. [Google Scholar] [CrossRef]
- Wilson, R.L.; Sharda, R. Bankruptcy prediction using neural networks. Decis. Support Syst. 1994, 11, 545–557. [Google Scholar] [CrossRef]
- Lee, W.C. Genetic Programming Decision Tree for Bankruptcy Prediction. In 9th Joint International Conference on Information Sciences (JCIS-06); Atlantis Press: Paris, France, 2006. [Google Scholar] [CrossRef]
- Min, S.H.; Lee, J.; Han, I. Hybrid genetic algorithms and support vector machines for bankruptcy prediction. Expert Syst. Appl. 2006, 31, 652–660. [Google Scholar] [CrossRef]
- Chou, C.H.; Hsieh, S.C.; Qiu, C.J. Hybrid genetic algorithm and fuzzy clustering for bankruptcy prediction. Appl. Soft Comput. 2017, 56, 298–316. [Google Scholar] [CrossRef]
- Azayite, F.Z.; Achchab, S. Topology Design of Bankruptcy Prediction Neural Networks Using Particle Swarm Optimization and Backpropagation. In Proceedings of the International Conference on Learning and Optimization Algorithms: Theory and Applications, LOPAL ’18, Rabat, Morocco, 2–5 May 2018; Association for Computing Machinery: New York, NY, USA, 2018. [Google Scholar] [CrossRef]
- Wang, M.; Chen, H.; Li, H.; Cai, Z.; Zhao, X.; Tong, C.; Li, J.; Xu, X. Grey wolf optimization evolving kernel extreme learning machine: Application to bankruptcy prediction. Eng. Appl. Artif. Intell. 2017, 63, 54–68. [Google Scholar] [CrossRef]
- Kimura, S.; Konagaya, A. A Genetic Algorithm with Distance Independent Diversity Control for High Dimensional Function Optimization. Trans. Jpn. Soc. Artif. Intell. 2003, 18, 193–202. [Google Scholar] [CrossRef][Green Version]
- Sun, J.; Zhang, H.; Zhang, Q.; Chen, H. Balancing Exploration and Exploitation in Multiobjective Evolutionary Optimization. In Proceedings of the Genetic and Evolutionary Computation Conference Companion, GECCO ’18, Kyoto, Japan, 15–19 July 2018; ACM: New York, NY, USA, 2018; pp. 199–200. [Google Scholar] [CrossRef]
- Mittal, N.; Singh, U.; Sohi, B.S. Modified Grey Wolf Optimizer for Global Engineering Optimization. Appl. Comp. Intell. Soft Comput. 2016, 2016, 8. [Google Scholar] [CrossRef]
- Lynn, N.; Suganthan, P.N. Heterogeneous comprehensive learning particle swarm optimization with enhanced exploration and exploitation. Swarm Evol. Comput. 2015, 24, 11–24. [Google Scholar] [CrossRef]
- Chen, F.; Sun, X.; Wei, D.; Tang, Y. Tradeoff strategy between exploration and exploitation for PSO. In Proceedings of the 2011 Seventh International Conference on Natural Computation, Shanghai, China, 26–28 July 2011; Volume 3, pp. 1216–1222. [Google Scholar] [CrossRef]
- Shojaedini, E.; Majd, M.; Safabakhsh, R. Novel adaptive genetic algorithm sample consensus. Appl. Soft Comput. 2019, 77, 635–642. [Google Scholar] [CrossRef]
- Kelly, J.; Hemberg, E.; O’Reilly, U.M. Improving Genetic Programming with Novel Exploration - Exploitation Control. In Genetic Programming; Sekanina, L., Hu, T., Lourenço, N., Richter, H., García-Sánchez, P., Eds.; Springer International Publishing: Cham, Switzerland, 2019; pp. 64–80. [Google Scholar]
- Rezapoor Mirsaleh, M.; Meybodi, M.R. Balancing exploration and exploitation in memetic algorithms: A learning automata approach. Comput. Intell. 2018, 34, 282–309. [Google Scholar] [CrossRef]
- Collins, R.A.; Green, R.D. Statistical methods for bankruptcy forecasting. J. Econ. Bus. 1982, 34, 349–354. [Google Scholar] [CrossRef]
- Lee, S.; Choi, W.S. A multi-industry bankruptcy prediction model using back-propagation neural network and multivariate discriminant analysis. Expert Syst. Appl. 2013, 40, 2941–2946. [Google Scholar] [CrossRef]
- Barboza, F.; Kimura, H.; Altman, E. Machine learning models and bankruptcy prediction. Expert Syst. Appl. 2017, 83, 405–417. [Google Scholar] [CrossRef]
- Eygi Erdogan, B.; Özöğür Akyüz, S.; Karadayı Ataş, P. A novel approach for panel data: An ensemble of weighted functional margin SVM models. Inf. Sci. 2019. [Google Scholar] [CrossRef]
- Hosaka, T. Bankruptcy prediction using imaged financial ratios and convolutional neural networks. Expert Syst. Appl. 2019, 117, 287–299. [Google Scholar] [CrossRef]
- Qu, Y.; Quan, P.; Lei, M.; Shi, Y. Review of bankruptcy prediction using machine learning and deep learning techniques. Procedia Comput. Sci. 2019, 162, 895–899. [Google Scholar] [CrossRef]
- Son, H.; Hyun, C.; Phan, D.; Hwang, H. Data analytic approach for bankruptcy prediction. Expert Syst. Appl. 2019, 138, 112816. [Google Scholar] [CrossRef]
- Brown, I.; Mues, C. An experimental comparison of classification algorithms for imbalanced credit scoring data sets. Expert Syst. Appl. 2012, 39, 3446–3453. [Google Scholar] [CrossRef]
- Rathi, V.P.G.P.; Palani, S. Brain tumor MRI image classification with feature selection and extraction using linear discriminant analysis. CoRR 2012, abs/1208.2128. [Google Scholar]
- Altman, E.I. Financial ratios, discriminant analysis and the prediction of corporate bankruptcy. J. Financ. 1968, 23, 589–609. [Google Scholar] [CrossRef]
- Taud, H.; Mas, J. Multilayer Perceptron (MLP). In Geomatic Approaches for Modeling Land Change Scenarios; Camacho Olmedo, M.T., Paegelow, M., Mas, J.F., Escobar, F., Eds.; Springer International Publishing: Cham, Switzerland, 2018; pp. 451–455. [Google Scholar] [CrossRef]
- Inam, F.; Inam, A.; Mian, M.A.; Sheikh, A.A.; Awan, H.M. Forecasting Bankruptcy for organizational sustainability in Pakistan. J. Econ. Adm. Sci. 2019, 35, 183–201. [Google Scholar] [CrossRef]
- Kalmegh, S.; Ghogare, M.S. Performance comparison of rule based classifier: Jrip and decisiontable using weka data mining tool on car reviews. Int. Eng. J. Res. Dev. 2019, 4, 5. [Google Scholar]
- Cohen, W.W. Fast Effective Rule Induction. In Machine Learning Proceedings 1995; Prieditis, A., Russell, S., Eds.; Morgan Kaufmann: San Francisco, CA, USA, 1995; pp. 115–123. [Google Scholar] [CrossRef]
- Boytcheva, S.; Tagarev, A. Company Investment Recommendation Based on Data Mining Techniques. In Business Information Systems Workshops; Abramowicz, W., Corchuelo, R., Eds.; Springer International Publishing: Cham, Switzerland, 2019; pp. 73–84. [Google Scholar]
- Amuda, K.A.; Adeyemo, A.B. Customers Churn Prediction in Financial Institution Using Artificial Neural Network. arXiv 2019, arXiv:1912.11346. [Google Scholar]
- Zhao, Y.; Zhang, Y. Comparison of decision tree methods for finding active objects. Adv. Space Res. 2008, 41, 1955–1959. [Google Scholar] [CrossRef]
- Briceño-Arias, L.M.; Chierchia, G.; Chouzenoux, E.; Pesquet, J.C. A random block-coordinate Douglas–Rachford splitting method with low computational complexity for binary logistic regression. Comput. Optim. Appl. 2019, 72, 707–726. [Google Scholar] [CrossRef]
- Vapnik, V. The Nature of Statistical Learning Theory; Springer: Berlin/Heidelberg, Germany, 2013. [Google Scholar]
- Bahad, P.; Saxena, P. Study of AdaBoost and Gradient Boosting Algorithms for Predictive Analytics. In International Conference on Intelligent Computing and Smart Communication 2019; Singh Tomar, G., Chaudhari, N.S., Barbosa, J.L.V., Aghwariya, M.K., Eds.; Springer: Singapore, 2020; pp. 235–244. [Google Scholar]
- Opitz, D.; Maclin, R. Popular ensemble methods: An empirical study. J. Artif. Intell. Res. 1999, 11, 169–198. [Google Scholar] [CrossRef]
- Weed, N.; Bakken, T.; Graddis, N.; Gouwens, N.; Millman, D.; Hawrylycz, M.; Waters, J. Identification of genetic markers for cortical areas using a Random Forest classification routine and the Allen Mouse Brain Atlas. PLoS ONE 2019, 14, e0212898. [Google Scholar] [CrossRef]
- Farooq, U.; Qamar, M.A.J. Predicting multistage financial distress: Reflections on sampling, feature and model selection criteria. J. Forecast. 2019, 38, 632–648. [Google Scholar] [CrossRef]
- Xiaomao, X.; Xudong, Z.; Yuanfang, W. A Comparison of Feature Selection Methodology for Solving Classification Problems in Finance. J. Physics: Conf. Ser. 2019, 1284, 012026. [Google Scholar] [CrossRef]
- He, H.; Bai, Y.; Garcia, E.A.; Li, S. (Eds.) ADASYN: Adaptive synthetic sampling approach for imbalanced learning. In Proceedings of the 2008 IEEE International Joint Conference on Neural Networks (IEEE World Congress on Computational Intelligence), Hong Kong, China, 1–8 June 2008; 2008; pp. 1322–1328. [Google Scholar] [CrossRef]
- Bowyer, K.W.; Chawla, N.V.; Hall, L.O.; Kegelmeyer, W.P. SMOTE: Synthetic Minority Over-sampling Technique. CoRR 2011, 16, 321–357. [Google Scholar]
Publisher’s Note: MDPI stays neutral with regard to jurisdictional claims in published maps and institutional affiliations. |
© 2021 by the authors. Licensee MDPI, Basel, Switzerland. This article is an open access article distributed under the terms and conditions of the Creative Commons Attribution (CC BY) license (https://creativecommons.org/licenses/by/4.0/).

