
Analyzing the within and between Players Variability of Heart Rate and Locomotor Responses in Small-Sided Soccer Games Performed Repeatedly over a Week

 ,
, 
 ,
,  ,
,  ,
, 
 ,
,  and
and 
Abstract
:1. Introduction
2. Materials and Methods
2.1. Experimental Approach to the Problem
2.2. Participants
2.3. Physical Fitness Assessment
2.4. Small-Sided Games
2.5. Heart Rate (HR) and Locomotor Demands
2.6. Statistical Procedures
3. Results
4. Discussion
4.1. Study Limitations
4.2. Practical Applications
5. Conclusions
Author Contributions
Funding
Institutional Review Board Statement
Informed Consent Statement
Conflicts of Interest
References
- Lacome, M.; Simpson, B.M.; Cholley, Y.; Lambert, P.; Buchheit, M. Small-Sided Games in Elite Soccer: Does One Size Fit All? Int. J. Sports Physiol. Perform. 2018, 13, 568–576. [Google Scholar] [CrossRef] [PubMed]
- Olthof, S.B.H.; Frencken, W.G.P.; Lemmink, K.A.P.M. A Match-Derived Relative Pitch Area Facilitates the Tactical Representativeness of Small-Sided Games for the Official Soccer Match. J. strength Cond. Res. 2019, 33, 523–530. [Google Scholar] [CrossRef] [PubMed] [Green Version]
- Riboli, A.; Esposito, F.; Coratella, G. Small-Sided Games in Elite Football: Practical Solutions to Replicate the 4-min Match-Derived Maximal Intensities. Available online: https://pubmed.ncbi.nlm.nih.gov/35333202/ (accessed on 1 June 2022).
- Aquino, R.; Melli-Neto, B.; Ferrari, J.V.S.; Bedo, B.L.S.; Vieira, L.H.P.; Santiago, P.R.P.; Gonçalves, L.G.C.; Oliveira, L.P.; Puggina, E.F. Validity and reliability of a 6-a-side small-sided game as an indicator of match-related physical performance in elite youth Brazilian soccer players. J. Sports Sci. 2019, 37, 2639–2644. [Google Scholar] [CrossRef] [PubMed]
- Bennett, K.J.M.; Novak, A.R.; Pluss, M.A.; Stevens, C.J.; Coutts, A.J.; Fransen, J. The use of small-sided games to assess skill proficiency in youth soccer players: A talent identification tool. Sci. Med. Footb. 2018, 2, 231–236. [Google Scholar] [CrossRef]
- Clemente, F.M.; Afonso, J.; Sarmento, H.; Manuel, F.; Id, C.; Clemente, F.M.; Afonso, J.; Sarmento, H. Small-sided games: An umbrella review of systematic reviews and meta-analyses. PLoS ONE 2021, 16, e0247067. [Google Scholar] [CrossRef]
- Clemente, F.M. The Threats of Small-Sided Soccer Games. Strength Cond. J. 2020, 42, 100–105. [Google Scholar] [CrossRef]
- Clemente, F.; Aquino, R.; Praça, G.M.; Rico-González, M.; Oliveira, R.; Filipa Silva, A.; Sarmento, H.; Afonso, J. Variability of internal and external loads and technical/tactical outcomes during small-sided soccer games: A systematic review. Biol. Sport 2022, 39, 647–672. [Google Scholar] [CrossRef]
- Hill-Haas, S.; Rowsell, G.; Coutts, A.; Dawson, B.; Rowsell, G.; Dawson, B. The Reproducibility of Physiological Responses and Performance Profiles of Youth Soccer Players in Small-Sided Games. Int. J. Sports Physiol. Perform. 2008, 3, 393–396. [Google Scholar] [CrossRef] [Green Version]
- Dellal, A.; Drust, B.; Lago-Penas, C. Variation of Activity Demands in Small-Sided Soccer Games. Int. J. Sports Med. 2012, 33, 370–375. [Google Scholar] [CrossRef]
- Köklü, Y.; Asçi, A.; Koçak, F.Ü.; Alemdaroglu, U.; Dündar, U.; Aşçi, A.; Koçak, F.Ü.; Alemdaroğlu, U.; Dündar, U. Comparison of the Physiological Responses to Different Small-Sided Games in Elite Young Soccer Players. J. Strength Cond. Res. 2011, 25, 1522–1528. [Google Scholar] [CrossRef] [Green Version]
- Palucci Vieira, L.H.; Lastella, M.; da Silva, J.P.; Cesário, T.; Santinelli, F.B.; Moretto, G.F.; Santiago, P.R.P.; Barbieri, F.A. Low sleep quality and morningness-eveningness scale score may impair ball placement but not kicking velocity in youth academy soccer players. Sci. Med. Footb. 2021, 1–11. [Google Scholar] [CrossRef]
- Bredt, S.d.G.T.; Praça, G.M.; Figueiredo, L.S.; Paula, L.V.d.; Silva, P.C.R.; Andrade, A.G.P.d.; Greco, P.J.; Chagas, M.H. Reliability of physical, physiological and tactical measures in small-sided soccer Games with numerical equality and numerical superiority. Brazilian J. Kinanthropometry Hum. Perform. 2016, 18, 602. [Google Scholar]
- Clemente, F.M.; Sarmento, H.; Costa, I.T.; Enes, A.R.; Lima, R. Variability of Technical Actions During Small-Sided Games in Young Soccer Players. J. Hum. Kinet. 2019, 69, 201–212. [Google Scholar] [CrossRef] [PubMed] [Green Version]
- Hill-Haas, S.; Coutts, A.; Rowsell, G.; Dawson, B. Variability of acute physiological responses and performance profiles of youth soccer players in small-sided games. J. Sci. Med. Sport 2008, 11, 487–490. [Google Scholar] [CrossRef] [PubMed]
- McLean, S.; Kerhervé, H.; Naughton, M.; Lovell, G.; Gorman, A.; Solomon, C. The Effect of Recovery Duration on Technical Proficiency during Small Sided Games of Football. Sports 2016, 4, 39. [Google Scholar] [CrossRef] [Green Version]
- Arcos, A.L.; Vázquez, J.S.; Martín, J.; Lerga, J.; Sánchez, F.; Villagra, F.; Zulueta, J.J. Effects of Small-Sided Games vs. Interval Training in Aerobic Fitness and Physical Enjoyment in Young Elite Soccer Players. PLoS ONE 2015, 10, e0137224. [Google Scholar] [CrossRef] [Green Version]
- Palucci Vieira, L.H.; Aquino, R.; Moura, F.A.; Barros, R.M.d.; Arpini, V.M.; Oliveira, L.P.; Bedo, B.L.; Santiago, P.R. Team Dynamics, Running, and Skill-Related Performances of Brazilian U11 to Professional Soccer Players During Official Matches. J. Strength Cond. Res. 2019, 33, 2202–2216. [Google Scholar] [CrossRef]
- Sanchez-Sanchez, J.; Hernández, D.; Casamichana, D.; Martínez-Salazar, C.; Ramirez-Campillo, R.; Sampaio, J. Heart Rate, Technical Performance, and Session-RPE in Elite Youth Soccer Small-Sided Games Played With Wildcard Players. J. Strength Cond. Res. 2017, 31, 2678–2685. [Google Scholar] [CrossRef]
- Bizzini, M.; Impellizzeri, F.M.; Dvorak, J.; Bortolan, L.; Schena, F.; Modena, R.; Junge, A. Physiological and performance responses to the “FIFA 11+” (part 1): Is it an appropriate warm-up? J. Sports Sci. 2013, 31, 1481–1490. [Google Scholar] [CrossRef]
- Akyildiz, Z.; Yildiz, M.; Clemente, F.M. The Reliability and Accuracy of Polar Team Pro GPS Units. Available online: https://journals.sagepub.com/doi/abs/10.1177/1754337120976660 (accessed on 1 June 2022).
- Sagiroglu, İ.; Akyildiz, Z.; Yildiz, M.; Clemente, F.M. Validity and Reliability of Polar Team Pro GPS Units for Assessing Maximum Sprint Speed in Soccer Players. Available online: https://journals.sagepub.com/doi/abs/10.1177/17543371211047224 (accessed on 1 June 2022).
- Stevens, T.G.A.; De Ruiter, C.J.; Beek, P.J.; Savelsbergh, G.J.P. Validity and reliability of 6-a-side small-sided game locomotor performance in assessing physical fitness in football players. J. Sports Sci. 2016, 34, 527–534. [Google Scholar] [CrossRef] [Green Version]
- Younesi, S.; Rabbani, A.; Clemente, F.M.; Sarmento, H.; Figueiredo, A.J. Session-to-session variations of internal load during different small-sided games: A study in professional soccer players. Res. Sport. Med. 2021, 29, 462–474. [Google Scholar] [CrossRef] [PubMed]
- Clemente, F.M.F.M.; Lourenço Martins, F.M.; Mendes, R.S.R.S.; Martins, F.M.; Mendes, R.S.R.S. Developing Aerobic and Anaerobic Fitness Using Small-Sided Soccer Games: Methodological Proposals. Strength Cond. J. 2014, 36, 76–87. [Google Scholar] [CrossRef] [Green Version]
- Younesi, S.; Rabbani, A.; Clemente, F.M.; Sarmento, H.; Figueiredo, A.J. Session-to-session variations in external load measures during small-sided games in professional soccer players. Biol. Sport 2021, 38, 185–193. [Google Scholar] [CrossRef] [PubMed]
- Clemente, F.M.; Chen, Y.-S.; Bezerra, P.; Guiomar, J.; Lima, R. Between-format differences and variability of technical actions during small-sided soccer games played by young players. Hum. Mov. 2018, 19, 114–120. [Google Scholar] [CrossRef]
- Clemente, F.M.; Afonso, J.; Castillo, D.; Arcos, A.L.; Silva, A.F.; Sarmento, H. The effects of small-sided soccer games on tactical behavior and collective dynamics: A systematic review. Chaos Solitons Fractals 2020, 134, 109710. [Google Scholar] [CrossRef]
- Paul, D.J.; Bradley, P.S.; Nassis, G.P. Factors Affecting Match Running Performance of Elite Soccer Players: Shedding Some Light on the Complexity. Int. J. Sports Physiol. Perform. 2015, 10, 516–519. [Google Scholar] [CrossRef] [Green Version]


| Day 1 | Day 2 | Day 3 | Day 4 | Day 1 | Day 2 | Day 3 | Day 4 | |||||
|---|---|---|---|---|---|---|---|---|---|---|---|---|
| Match day | Day off | Warm-up FIFA 11+ | Warm-up FIFA 11+ | Warm-up FIFA 11+ | Warm-up FIFA 11+ | Day off | Match day | Day off | Warm-up FIFA 11+ | Warm-up FIFA 11+ | Warm-up FIFA 11+ | Warm-up FIFA 11+ |
| Format: 5v5 Pitch: 50 × 31 m Area per player: 155 m2 Length per width ratio: 1.6 Time: 5 min Small goal in the center No offside | Format: 5v5 Pitch: 40 × 25 m Area per player: 100 m2 Length per width ratio: 1.6 Time: 5 min Small goal in the center No offside | Format: 5v5 Pitch: 50 × 31 m Area per player: 155 m2 Length per width ratio: 1.6 Time: 5 min Small goal in the center No offside | Format: 5v5 Pitch: 40 × 25 m Area per player: 100 m2 Length per width ratio: 1.6 Time: 5 min Small goal in the center No offside | Format: 3v3 Pitch: 39 × 24 m Area per player: 156 m2 Length per width ratio: 1.6 Time: 3 min Small goal in the center No offside | Format: 3v3 Pitch: 32 × 19 m Area per player: 101 m2 Length per width ratio: 1.7 Time: 3 min Small goal in the center No offside | Format: 3v3 Pitch: 39 × 24 m Area per player: 156 m2 Length per width ratio: 1.6 Time: 3 min Small goal in the center No offside | Format: 3v3 Pitch: 32 × 19 m Area per player: 101 m2 Length per width ratio: 1.7 Time: 3 min Small goal in the center No offside | |||||
| Recovery 3 min | Recovery 3 min | Recovery 3 min | Recovery 3 min | Recovery 3 min | Recovery 3 min | Recovery 3 min | Recovery 3 min | |||||
| Format: 5v5 Pitch: 40 × 25 m Area per player: 100 m2 Length per width ratio: 1.6 Time: 5 min Small goal in the center No offside | Format: 5v5 Pitch: 50 × 31 m Area per player: 155 m2 Length per width ratio: 1.6 Time: 5 min Small goal in the center No offside | Format: 5v5 Pitch: 40 × 25 m Area per player: 100 m2 Length per width ratio: 1.6 Time: 5 min Small goal in the center No offside | Format: 5v5 Pitch: 50 × 31 m Area per player: 155 m2 Length per width ratio: 1.6 Time: 5 min Small goal in the center No offside | Format: 3v3 Pitch: 32 × 19 m Area per player: 101 m2 Length per width ratio: 1.7 Time: 3 min Small goal in the center No offside | Format: 3v3 Pitch: 39 × 24 m Area per player: 156 m2 Length per width ratio: 1.6 Time: 3 min Small goal in the center No offside | Format: 3v3 Pitch: 32 × 19 m Area per player: 101 m2 Length per width ratio: 1.7 Time: 3 min Small goal in the center No offside | Format: 3v3 Pitch: 39 × 24 m Area per player: 156 m2 Length per width ratio: 1.6 Time: 3 min Small goal in the center No offside |
| 3v3 (39 × 24 m) Day1 BPV (CV%) | 3v3 (39 × 24 m) Day2 BPV (CV%) | 3v3 (39 × 24 m) Day3 BPV (CV%) | 3v3 (39 × 24 m) Day4 BPV (CV%) | 3v3 (32 × 19 m) Day1 BPV (CV%) | 3v3 (32 × 19 m) Day 2 BPV (CV%) | 3v3 (32 × 19 m) Day 3 BPV (CV%) | 3v3 (32 × 19 m) Day 4 BPV (CV%) | |
|---|---|---|---|---|---|---|---|---|
| HRmean (bpm) | 11.0 | 7.1 | 5.8 | 4.6 | 9.7 | 6.8 | 9.2 | 9.4 |
| HRpeak (bpm) | 11.1 | 3.5 | 5.1 | 3.2 | 3.1 | 5.1 | 8.9 | 3.5 |
| Total distance (m) | 33.6 | 29.0 | 30.7 | 20.1 | 20.8 | 27.0 | 14.8 | 16.4 |
| Distance at Z1 (m) | 32.3 | 50.3 | 104.4 | 27.7 | 41.7 | 60.0 | 68.5 | 17.5 |
| Distance at Z2 (m) | 28.3 | 56.1 | 41.5 | 47.7 | 36.3 | 48.9 | 30.2 | 16.4 |
| Distance at Z3 (m) | 94.7 | 40.0 | 39.4 | 26.5 | 104.4 | 28.9 | 60.3 | 54.1 |
| Distance at Z4 (m) | 118.4 | 58.1 | 48.9 | 75.2 | 113.8 | 58.6 | 48.2 | 72.0 |
| Distance at Z5 (m) | 289.8 | 149.2 | 82.5 | 245.0 | 195.7 | 148.5 | 91.1 | 156.3 |
| Peak speed (km/h) | 29.1 | 16.1 | 17.5 | 12.8 | 34.7 | 16.2 | 22.0 | 17.9 |
| 5v5 (50 × 31 m) Day1 BPV (CV%) | 5v5 (50 × 31 m) Day2 BPV (CV%) | 5v5 (50 × 31 m) Day3 BPV (CV%) | 5v5 (50 × 31 m) Day4 BPV (CV%) | 5v5 (40 × 25 m) Day1 BPV (CV%) | 5v5 (40 × 25 m) Day 2 BPV (CV%) | 5v5 (40 × 25 m) Day 3 BPV (CV%) | 5v5 (40 × 25 m) Day 4 BPV (CV%) | |
|---|---|---|---|---|---|---|---|---|
| HRmean (bpm) | 10.5 | 7.4 | 19.7 | 8.3 | 8.5 | 16.5 | 13.6 | 8.5 |
| HRpeak (bpm) | 8.6 | 8.5 | 16.9 | 6.6 | 7.0 | 15.2 | 12.4 | 8.5 |
| Total distance (m) | 21.6 | 14.1 | 23.6 | 13.4 | 18.6 | 21.0 | 32.1 | 17.4 |
| Distance at Z1 (m) | 19.8 | 17.3 | 24.9 | 17.6 | 13.9 | 16.4 | 26.7 | 15.6 |
| Distance at Z2 (m) | 40.6 | 29.0 | 33.7 | 25.0 | 38.5 | 34.3 | 40.2 | 27.5 |
| Distance at Z3 (m) | 50.4 | 40.0 | 74.8 | 38.5 | 42.2 | 64.2 | 65.1 | 51.1 |
| Distance at Z4 (m) | 68.0 | 65.2 | 84.5 | 61.7 | 62.9 | 73.3 | 87.5 | 70.3 |
| Distance at Z5 (m) | 103.7 | 221.1 | 111.1 | 116.8 | 127.1 | 134.0 | 156.8 | 94.0 |
| Peak speed (km/h) | 11.9 | 13.3 | 30.6 | 16.6 | 13.8 | 24.6 | 19.3 | 11.8 |
| 3v3 (39 × 24 m) All WPV (CV%) | 3v3 (32 × 19 m) All WPV (CV%) | 5v5 (50 × 31 m) All WPV (CV%) | 5v5 (40 × 25 m) All WPV (CV%) | Repeated Measures ANOVA | |
|---|---|---|---|---|---|
| HRmean (bpm) | 7.9 ± 4.0 | 8.7 ± 4.1 | 11.9 ± 6.5 | 11.1 ± 7.1 | 0.089|0.126 |
| HRpeak (bpm) | 6.0 ± 4.3 | 6.5 ± 4.1 | 10.3 ± 6.7 | 10.4 ± 6.3 | 0.032|0.172 |
| Total distance (m) | 34.8 ± 10.5 b,c,d | 23.0 ± 7.2 a | 18.4 ± 8.4 a,d | 26.0 ± 8.2 a,c | <0.001|0.441 |
| Distance at Z1 (m) | 60.3 ± 13.8 c,d | 53.1 ± 19.1 c,d | 19.6 ± 10.1 a,b | 20.4 ± 7.7 a,b | <0.001|0.745 |
| Distance at Z2 (m) | 52.8 ± 14.0 c,d | 46.3 ± 14.4 c,d | 32.2 ± 13.5 a,b | 32.7 ± 12.7 a,b | <0.001|0.444 |
| Distance at Z3 (m) | 51.2 ± 20.5 | 62.8 ± 20.9 | 51.1 ± 24.7 | 52.9 ± 21.9 | 0.208|0.076 |
| Distance at Z4 (m) | 77.5 ± 31.7 | 83.0 ± 29.1 | 68.3 ± 23.8 | 79.4 ± 33.9 | 0.457|0.044 |
| Distance at Z5 (m) | 170.5 ± 27.6 c,d | 158.6 ± 32.3 c | 113.7 ± 38.5 a,b | 139.7 ± 33.9 a | <0.001|0.394 |
| Peak speed (km/h) | 22.1 ± 9.5 | 25.0 ± 9.9 | 17.0 ± 10.5 | 18.6 ± 8.8 | 0.052|0.146 |
| 3v3 (39 × 24 m) Day1 | 3v3 (39 × 24 m) Day2 | 3v3 (39 × 24 m) Day3 | 3v3 (39 × 24 m) Day4 | Repeated Measures ANOVA | |
| HRmean (bpm) | 157.0 ± 17.3 c,d | 170.4 ± 12.1 | 172.8 ± 10.1 a | 174.8 ± 8.0 a | 0.001|0.303 |
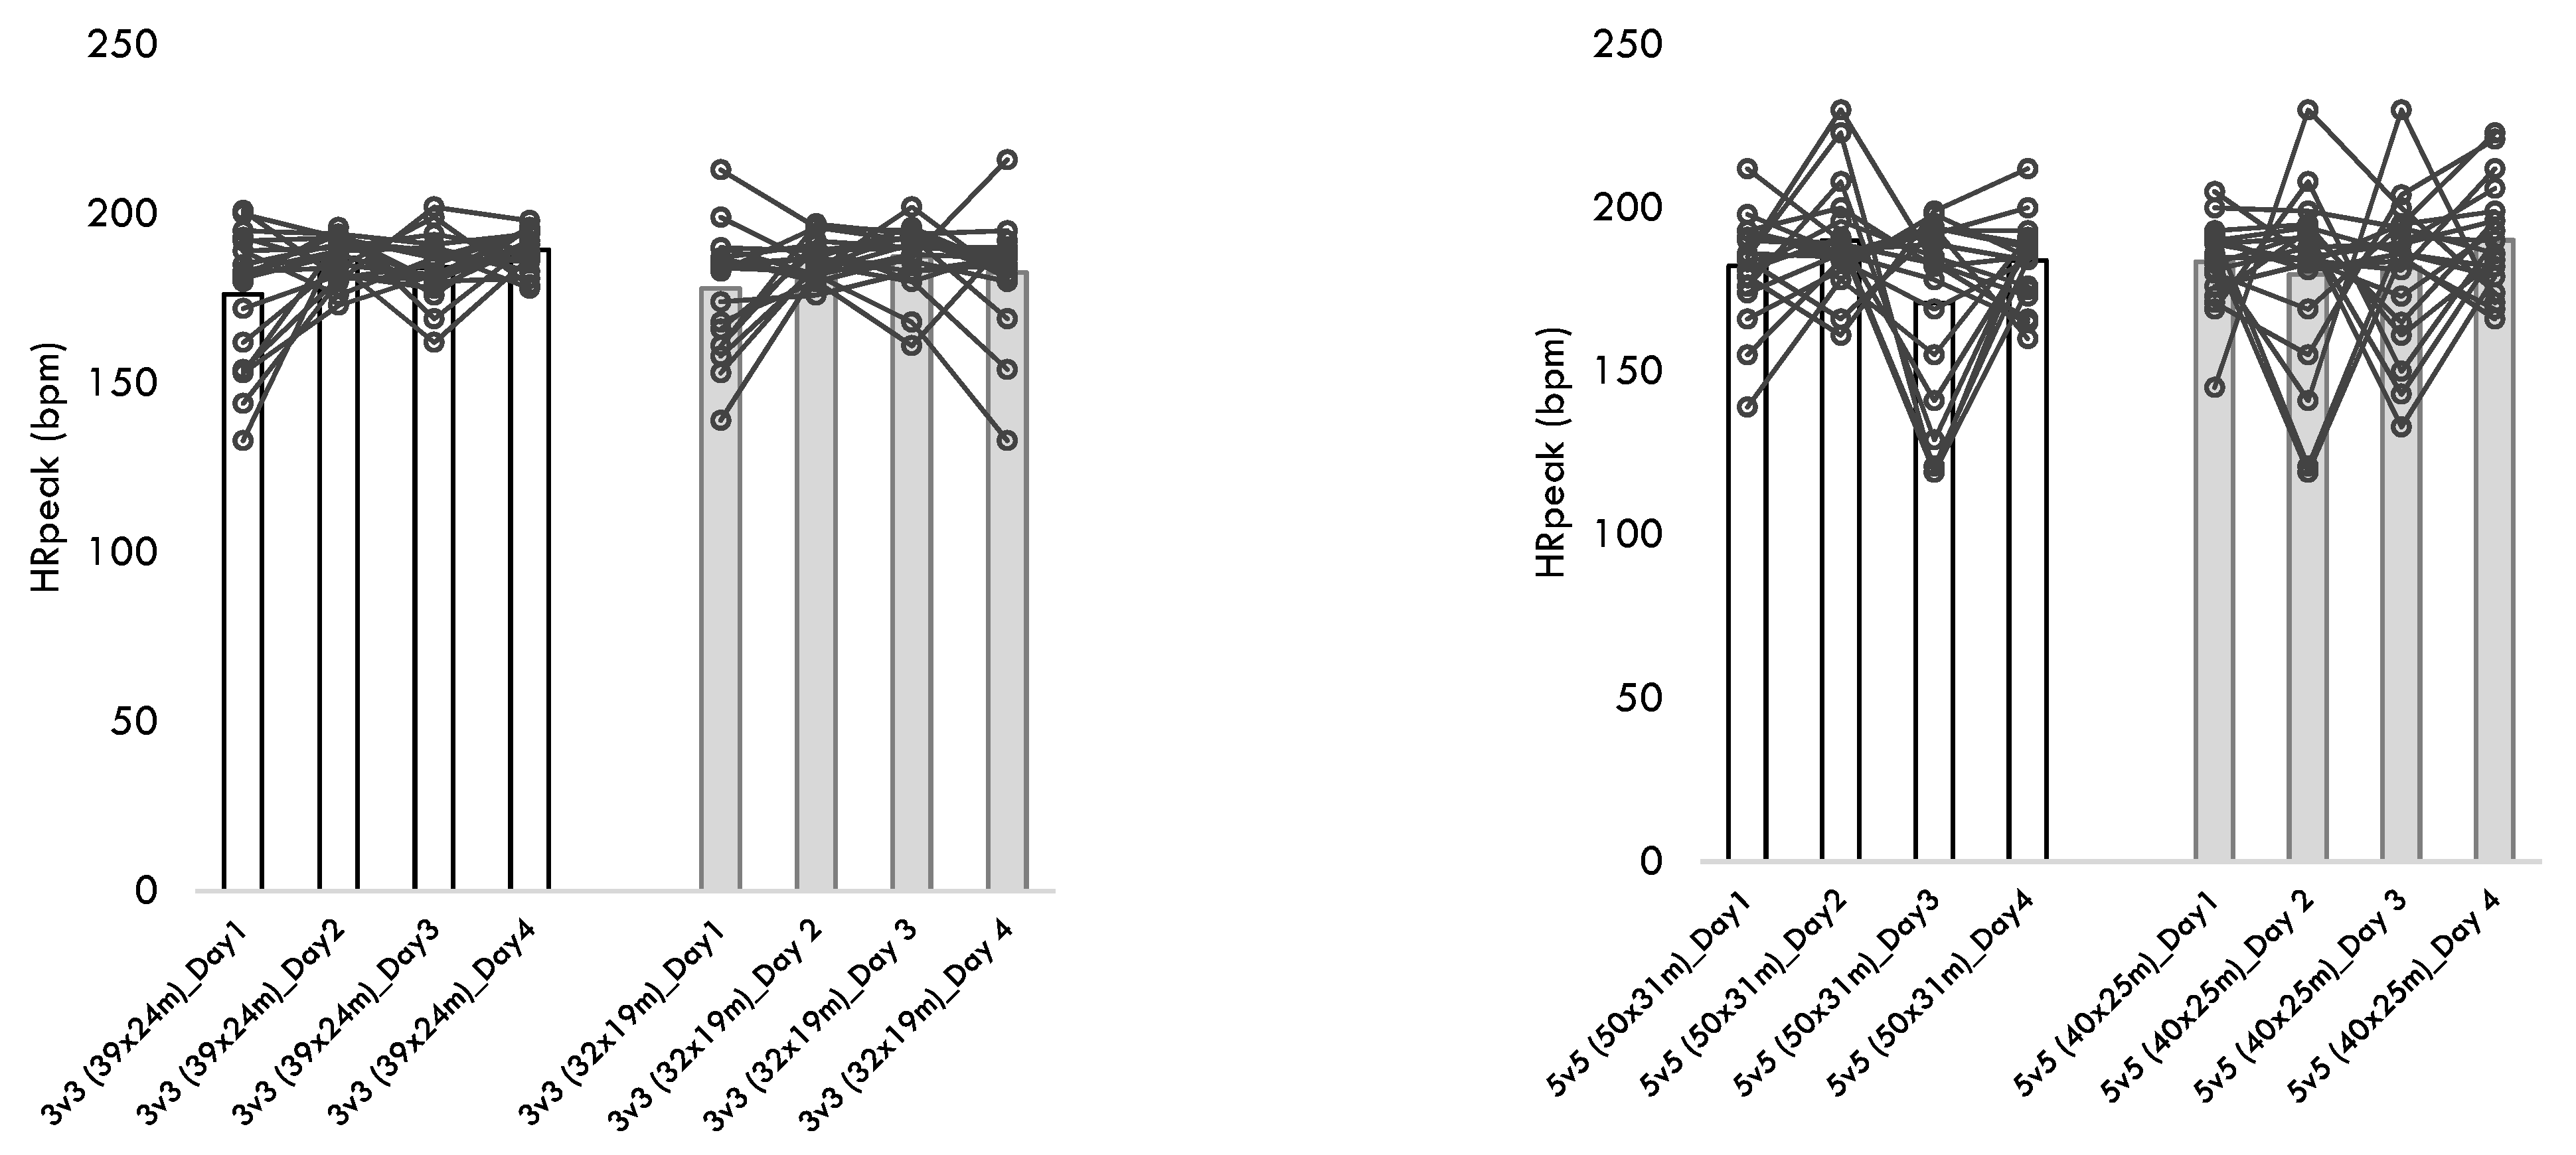
| Hrpeak (bpm) | 176.2 ± 19.6 | 187.0 ± 6.5 | 184.2 ± 9.4 | 189.4 ± 6.1 | 0.023|0.189 |
| Total distance (m) | 324.3 ± 108.9 c | 384.6 ± 111.7 | 489.5 ± 150.4 a,d | 343.9 ± 69.1 c | 0.005|0.281 |
| Distance at Z1 (m) | 79.0 ± 25.5 c,d | 78.2 ± 39.3 d | 41.1 ± 42.9 a,d | 115.2 ± 31.8 a,b,c | 0.001|0.422 |
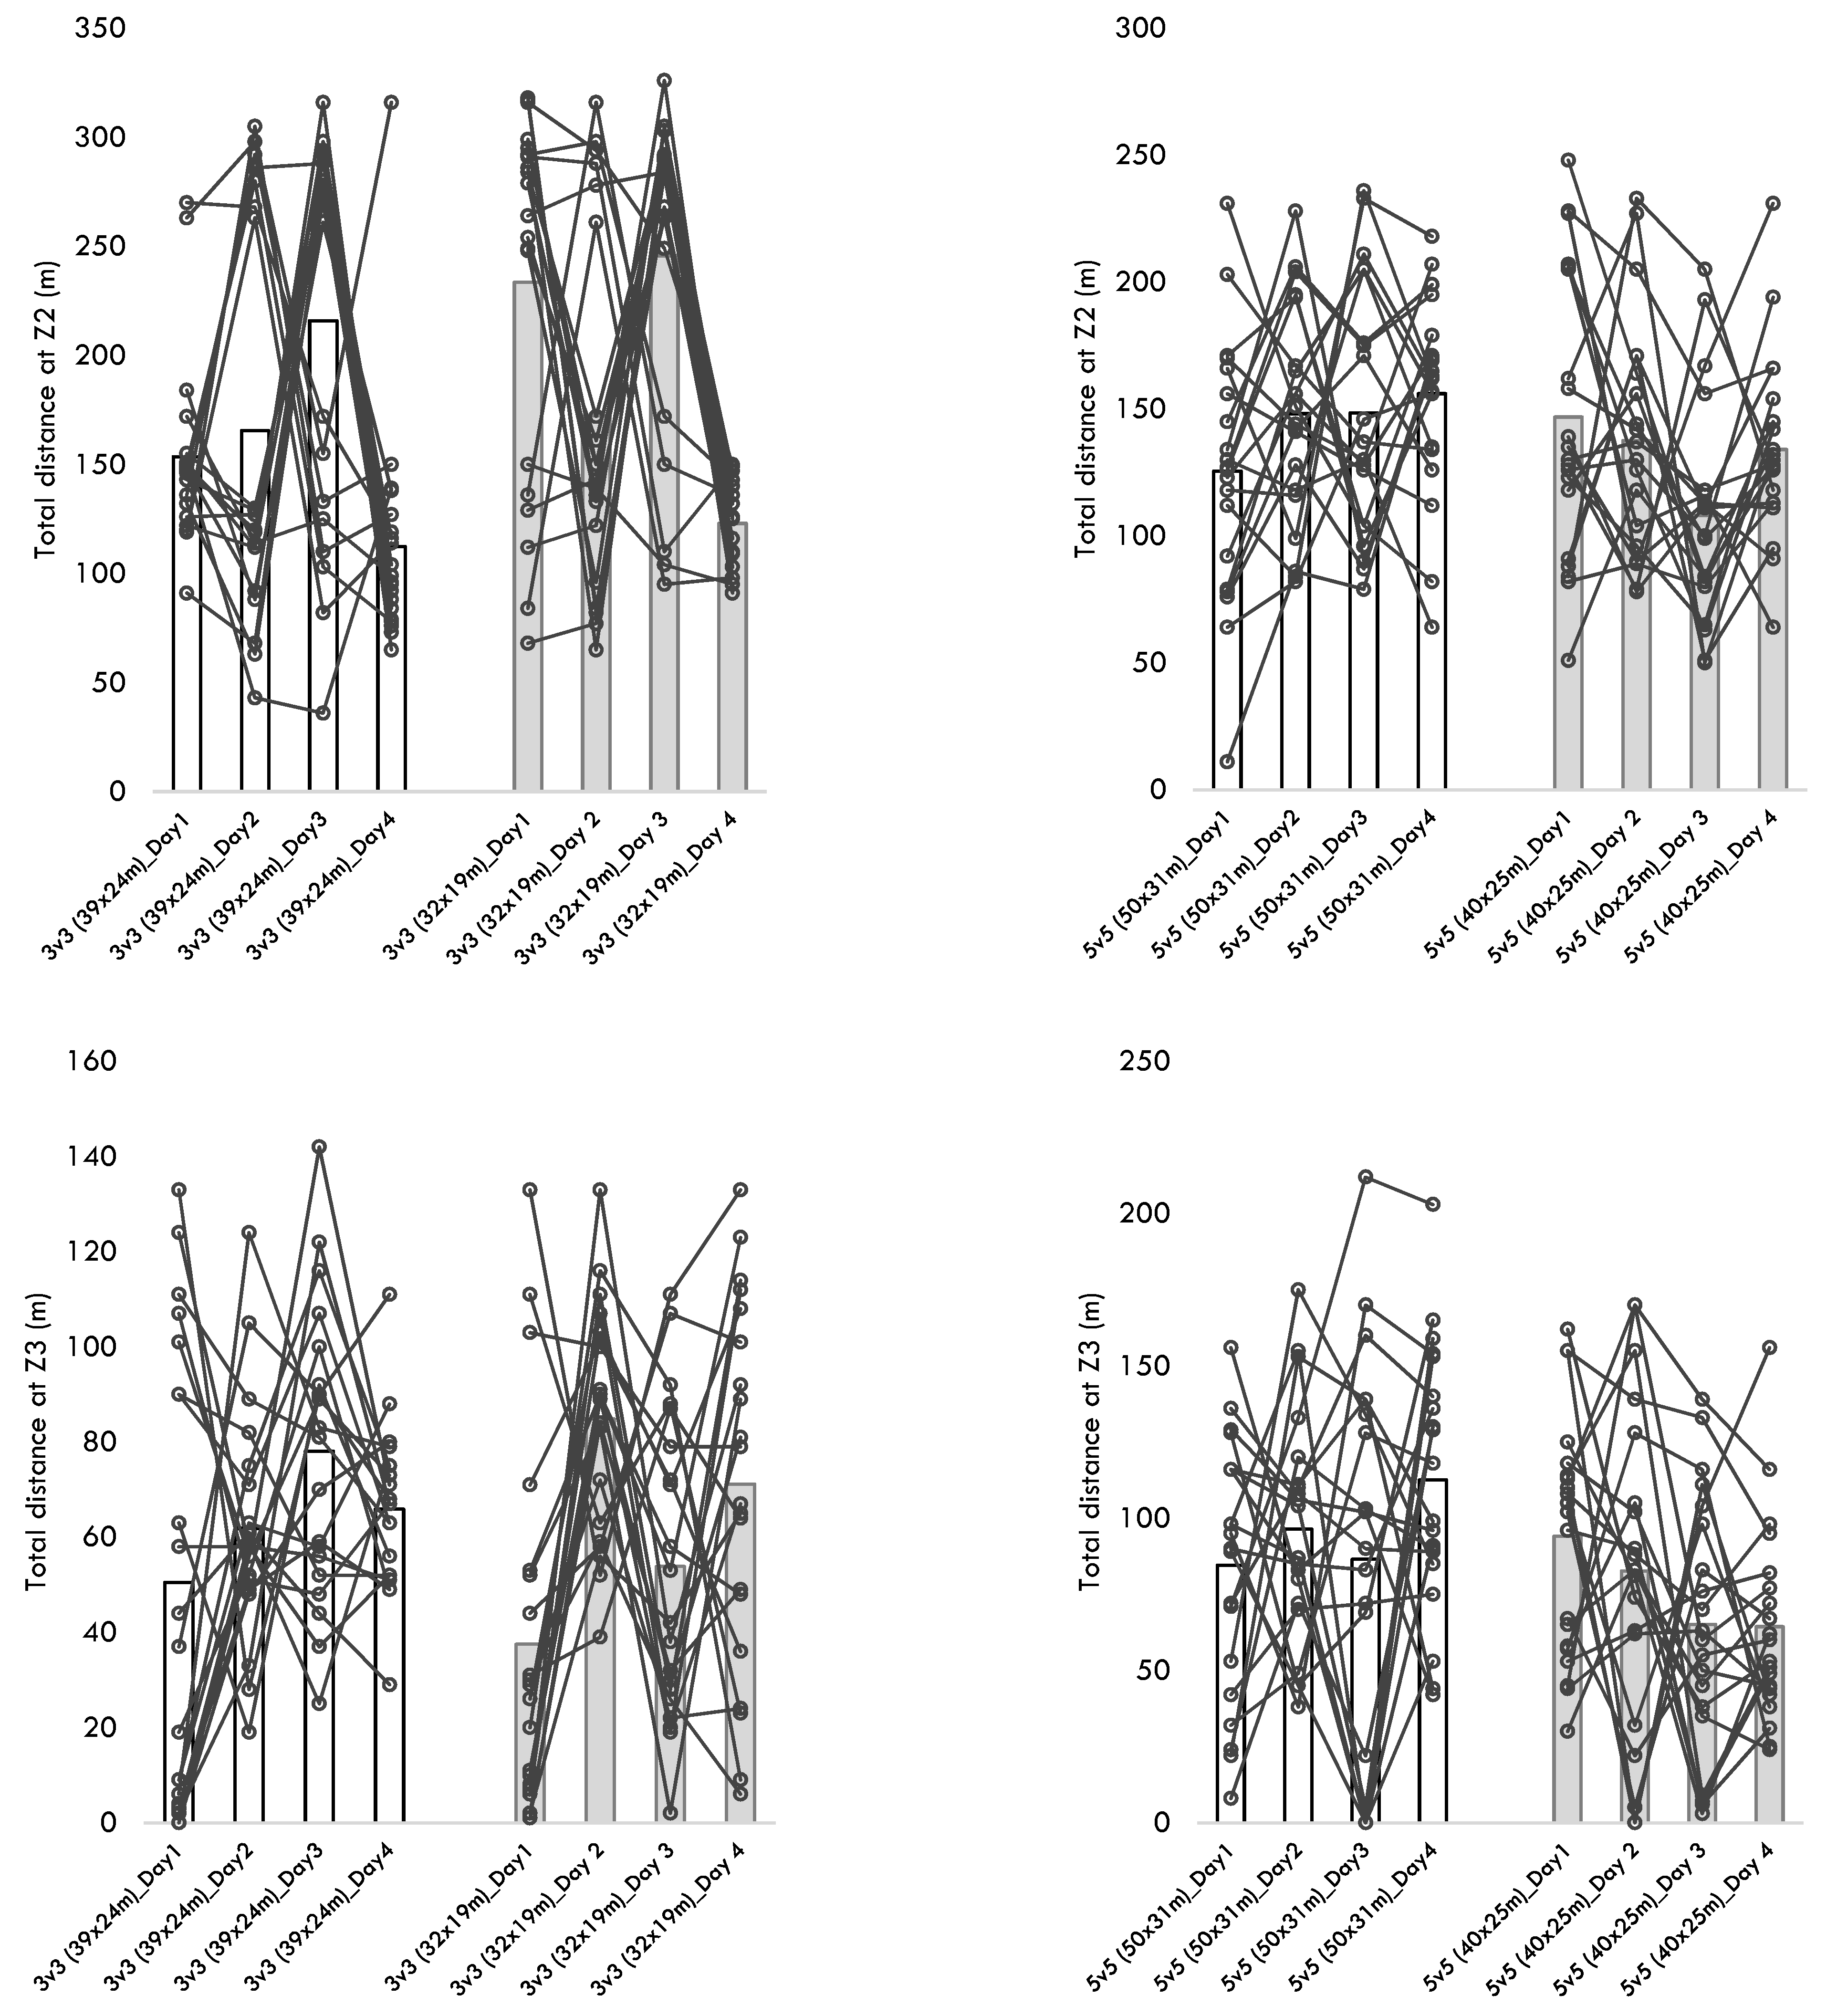
| Distance at Z2 (m) | 153.6 ± 43.5 d | 165.5 ± 92.8 | 215.9 ± 89.5 d | 112.4 ± 53.6 a,c | 0.007|0.255 |
| Distance at Z3 (m) | 50.5 ± 47.8 | 61.9 ± 24.7 | 78.1 ± 30.8 | 65.9 ± 17.5 | 0.092|0.116 |
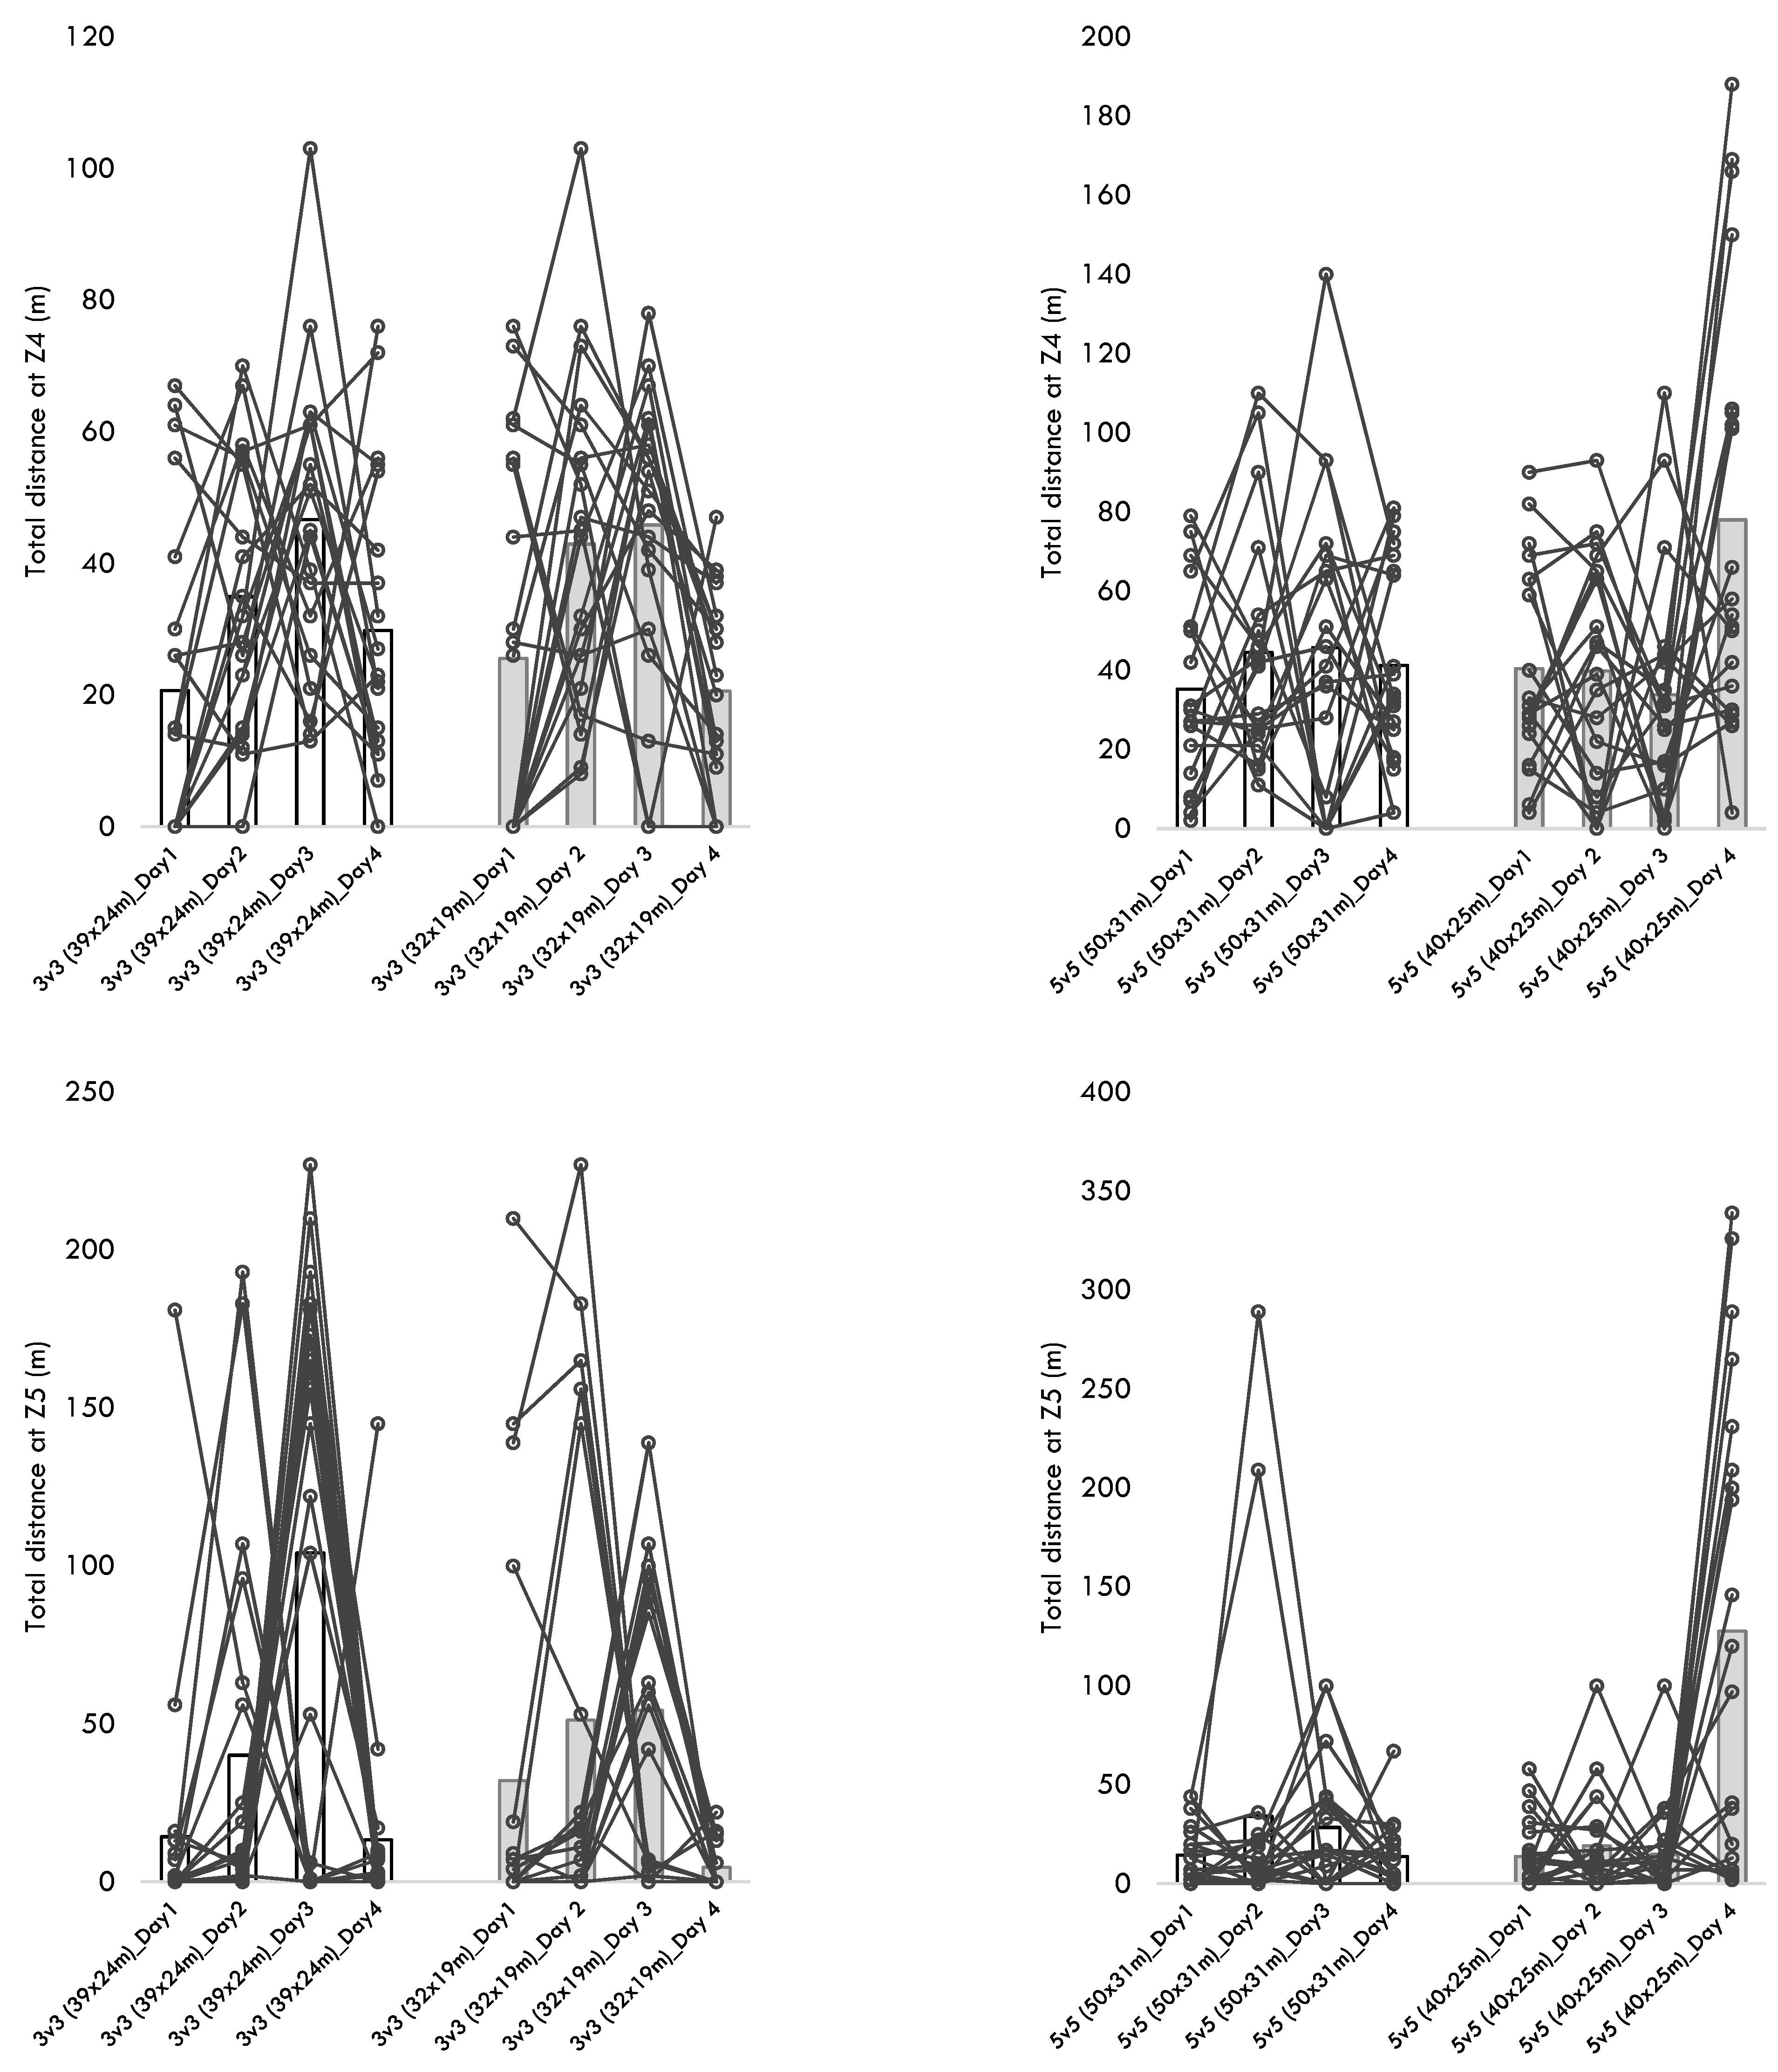
| Distance at Z4 (m) | 20.7 ± 24.5 c | 35.0 ± 20.3 | 46.7 ± 22.8 a | 29.8 ± 22.4 | 0.006|0.196 |
| Distance at Z5 (m) | 14.3 ± 41.3 c | 40.1 ± 59.8 | 104.1 ± 85.8 a,d | 13.3 ± 32.5 c | 0.002|0.324 |
| Peak speed (km/h) | 17.1 ± 5.0 b,c | 22.0 ± 3.6 a | 23.5 ± 4.1 a,d | 20.0 ± 2.6 c | <0.001|0.330 |
| 3v3 (32 × 19 m) Day1 | 3v3 (32 × 19 m) Day 2 | 3v3 (32 × 19 m) Day 3 | 3v3 (32 × 19 m) Day 4 | Repeated Measures ANOVA | |
| Hrmean (bpm) | 162.6 ± 15.8 | 169.0 ± 11.4 | 173.1 ± 15.9 | 168.2 ± 15.9 | 0.213|0.075 |
| Hrpeak (bpm) | 177.9 ± 17.6 | 186.7 ± 5.8 | 187.3 ± 9.6 | 182.7 ± 16.3 | 0.138|0.100 |
| Total distance (m) | 409.9 ± 85.4 d | 435.8 ± 117.7 d | 454.8 ± 67.4 d | 331.3 ± 54.3 a,b,c | 0.003|0.301 |
| Distance at Z1 (m) | 76.5 ± 31.9 d | 76.8 ± 46.1 | 53.4 ± 36.6 d | 103.1 ± 18.1 a,c | 0.007|0.259 |
| Distance at Z2 (m) | 233.6 ± 84.9 d | 172.3 ± 84.1 | 245.7 ± 74.2 d | 123.0 ± 20.2 a,c | 0.001|0.404 |
| Distance at Z3 (m) | 37.5 ± 39.2 b | 84.9 ± 24.5 a,c | 53.9 ± 32.5 b | 71.2 ± 38.5 | 0.001|0.289 |
| Distance at Z4 (m) | 25.6 ± 29.1 | 43.0 ± 25.2 d | 45.9 ± 22.1 d | 20.6 ± 14.8 b,c | 0.009|0.220 |
| Distance at Z5 (m) | 32.0 ± 62.6 | 51.2 ± 76.0 | 54.3 ± 49.5 d | 4.6 ± 7.1 c | 0.066|0.151 |
| Peak speed (km/h) | 17.8 ± 6.2 b | 21.5 ± 3.5 a,d | 22.1 ± 4.9 d | 18.0 ± 3.2 b,c | 0.037|0.180 |
| 5v5 (50 × 31 m) Day1 | 5v5 (50 × 31 m) Day2 | 5v5 (50 × 31 m) Day3 | 5v5 (50 × 31 m) Day4 | Repeated Measures ANOVA | |
| HRmean (bpm) | 164.6 ± 17.3 | 165.4 ± 12.2 | 154.9 ± 30.5 | 160.8 ± 13.3 | 0.357|0.053 |
| Hrpeak (bpm) | 182.3 ± 15.7 | 190.0 ± 16.1 | 170.9 ± 28.9 | 183.9 ± 12.2 | 0.062|0.136 |
| Total distance (m) | 486.2 ± 104.9 | 555.8 ± 78.3 | 529.8 ± 124.8 | 531.8 ± 71.0 | 0.197|0.078 |
| Distance at Z1 (m) | 199.8 ± 39.5 | 212.8 ± 36.8 | 207.5 ± 51.6 | 181.9 ± 32.1 | 0.128|0.100 |
| Distance at Z2 (m) | 125.6 ± 51.0 | 148.1 ± 43.0 | 148.5 ± 50.0 | 156.0 ± 38.9 | 0.187|0.080 |
| Distance at Z3 (m) | 84.6 ± 42.6 | 96.5 ± 38.6 | 86.5 ± 64.7 | 112.6 ± 43.4 | 0.263|0.067 |
| Distance at Z4 (m) | 35.3 ± 24.0 | 44.5 ± 29.0 | 45.7 ± 38.6 | 41.3 ± 25.5 | 0.703|0.024 |
| Distance at Z5 (m) | 14.4 ± 14.9 | 34.1 ± 75.3 | 28.4 ± 31.6 | 13.8 ± 16.1 | 0.323|0.056 |
| Peak speed (km/h) | 20.9 ± 2.5 | 21.5 ± 2.9 | 19.7 ± 6.0 | 21.5 ± 3.6 | 0.389|0.049 |
| 5v5 (40 × 25 m) Day1 | 5 v5 (40 × 25 m) Day 2 | 5v5 (40 × 25 m) Day 3 | 5v5 (40 × 25 m) Day 4 | Repeated Measures ANOVA | |
| Hrmean (bpm) | 168.6 ± 14.3 | 160.8 ± 26.6 | 163.4 ± 22.3 | 166.4 ± 14.1 | 0.668|0.027 |
| Hrpeak (bpm) | 183.6 ± 12.9 | 179.7 ± 27.2 | 181.7 ± 22.4 | 190.1 ± 16.2 | 0.464|0.044 |
| Total distance (m) | 522.0 ± 97.0 | 522.6 ± 109.7 | 413.9 ± 132.9 | 596.8 ± 103.8 | <0.001|0.291 |
| Distance at Z1 (m) | 207.1 ± 28.8 | 227.2 ± 37.4 | 174.4 ± 46.5 | 176.9 ± 27.6 | <0.001|0.377 |
| Distance at Z2 (m) | 146.8 ± 56.5 | 137.5 ± 47.2 | 108.1 ± 43.5 | 134.0 ± 36.8 | 0.054|0.124 |
| Distance at Z3 (m) | 94.1 ± 39.7 d | 82.6 ± 53.1 | 65.1 ± 42.4 | 64.4 ± 32.9 a | 0.075|0.113 |
| Distance at Z4 (m) | 40.4 ± 25.4 | 39.8 ± 29.2 | 33.9 ± 29.6 | 78.0 ± 54.8 | 0.008|0.225 |
| Distance at Z5 (m) | 13.8 ± 17.5 d | 19.2 ± 25.7 d | 14.8 ± 23.2 d | 127.6 ± 119.9 a,b,c | <0.001|0.438 |
| Peak speed (km/h) | 20.7 ± 2.9 d | 20.0 ± 4.9 d | 20.1 ± 3.9 d | 23.7 ± 2.8 a,b,c | 0.012|0.174 |
Publisher’s Note: MDPI stays neutral with regard to jurisdictional claims in published maps and institutional affiliations. |
© 2022 by the authors. Licensee MDPI, Basel, Switzerland. This article is an open access article distributed under the terms and conditions of the Creative Commons Attribution (CC BY) license (https://creativecommons.org/licenses/by/4.0/).
Share and Cite
Silva, A.F.; González-Fernández, F.T.; Aquino, R.; Akyildiz, Z.; Vieira, L.P.; Yıldız, M.; Birlik, S.; Nobari, H.; Praça, G.; Clemente, F.M. Analyzing the within and between Players Variability of Heart Rate and Locomotor Responses in Small-Sided Soccer Games Performed Repeatedly over a Week. Healthcare 2022, 10, 1412. https://doi.org/10.3390/healthcare10081412
Silva AF, González-Fernández FT, Aquino R, Akyildiz Z, Vieira LP, Yıldız M, Birlik S, Nobari H, Praça G, Clemente FM. Analyzing the within and between Players Variability of Heart Rate and Locomotor Responses in Small-Sided Soccer Games Performed Repeatedly over a Week. Healthcare. 2022; 10(8):1412. https://doi.org/10.3390/healthcare10081412
Chicago/Turabian StyleSilva, Ana Filipa, Francisco Tomás González-Fernández, Rodrigo Aquino, Zeki Akyildiz, Luiz Palucci Vieira, Mehmet Yıldız, Sabri Birlik, Hadi Nobari, Gibson Praça, and Filipe Manuel Clemente. 2022. "Analyzing the within and between Players Variability of Heart Rate and Locomotor Responses in Small-Sided Soccer Games Performed Repeatedly over a Week" Healthcare 10, no. 8: 1412. https://doi.org/10.3390/healthcare10081412
APA StyleSilva, A. F., González-Fernández, F. T., Aquino, R., Akyildiz, Z., Vieira, L. P., Yıldız, M., Birlik, S., Nobari, H., Praça, G., & Clemente, F. M. (2022). Analyzing the within and between Players Variability of Heart Rate and Locomotor Responses in Small-Sided Soccer Games Performed Repeatedly over a Week. Healthcare, 10(8), 1412. https://doi.org/10.3390/healthcare10081412