
Volume–Outcome Relationship in Cancer Survival Rates: Analysis of a Regional Population-Based Cancer Registry in Japan
 ,
,
Abstract
:1. Introduction
2. Materials and Methods
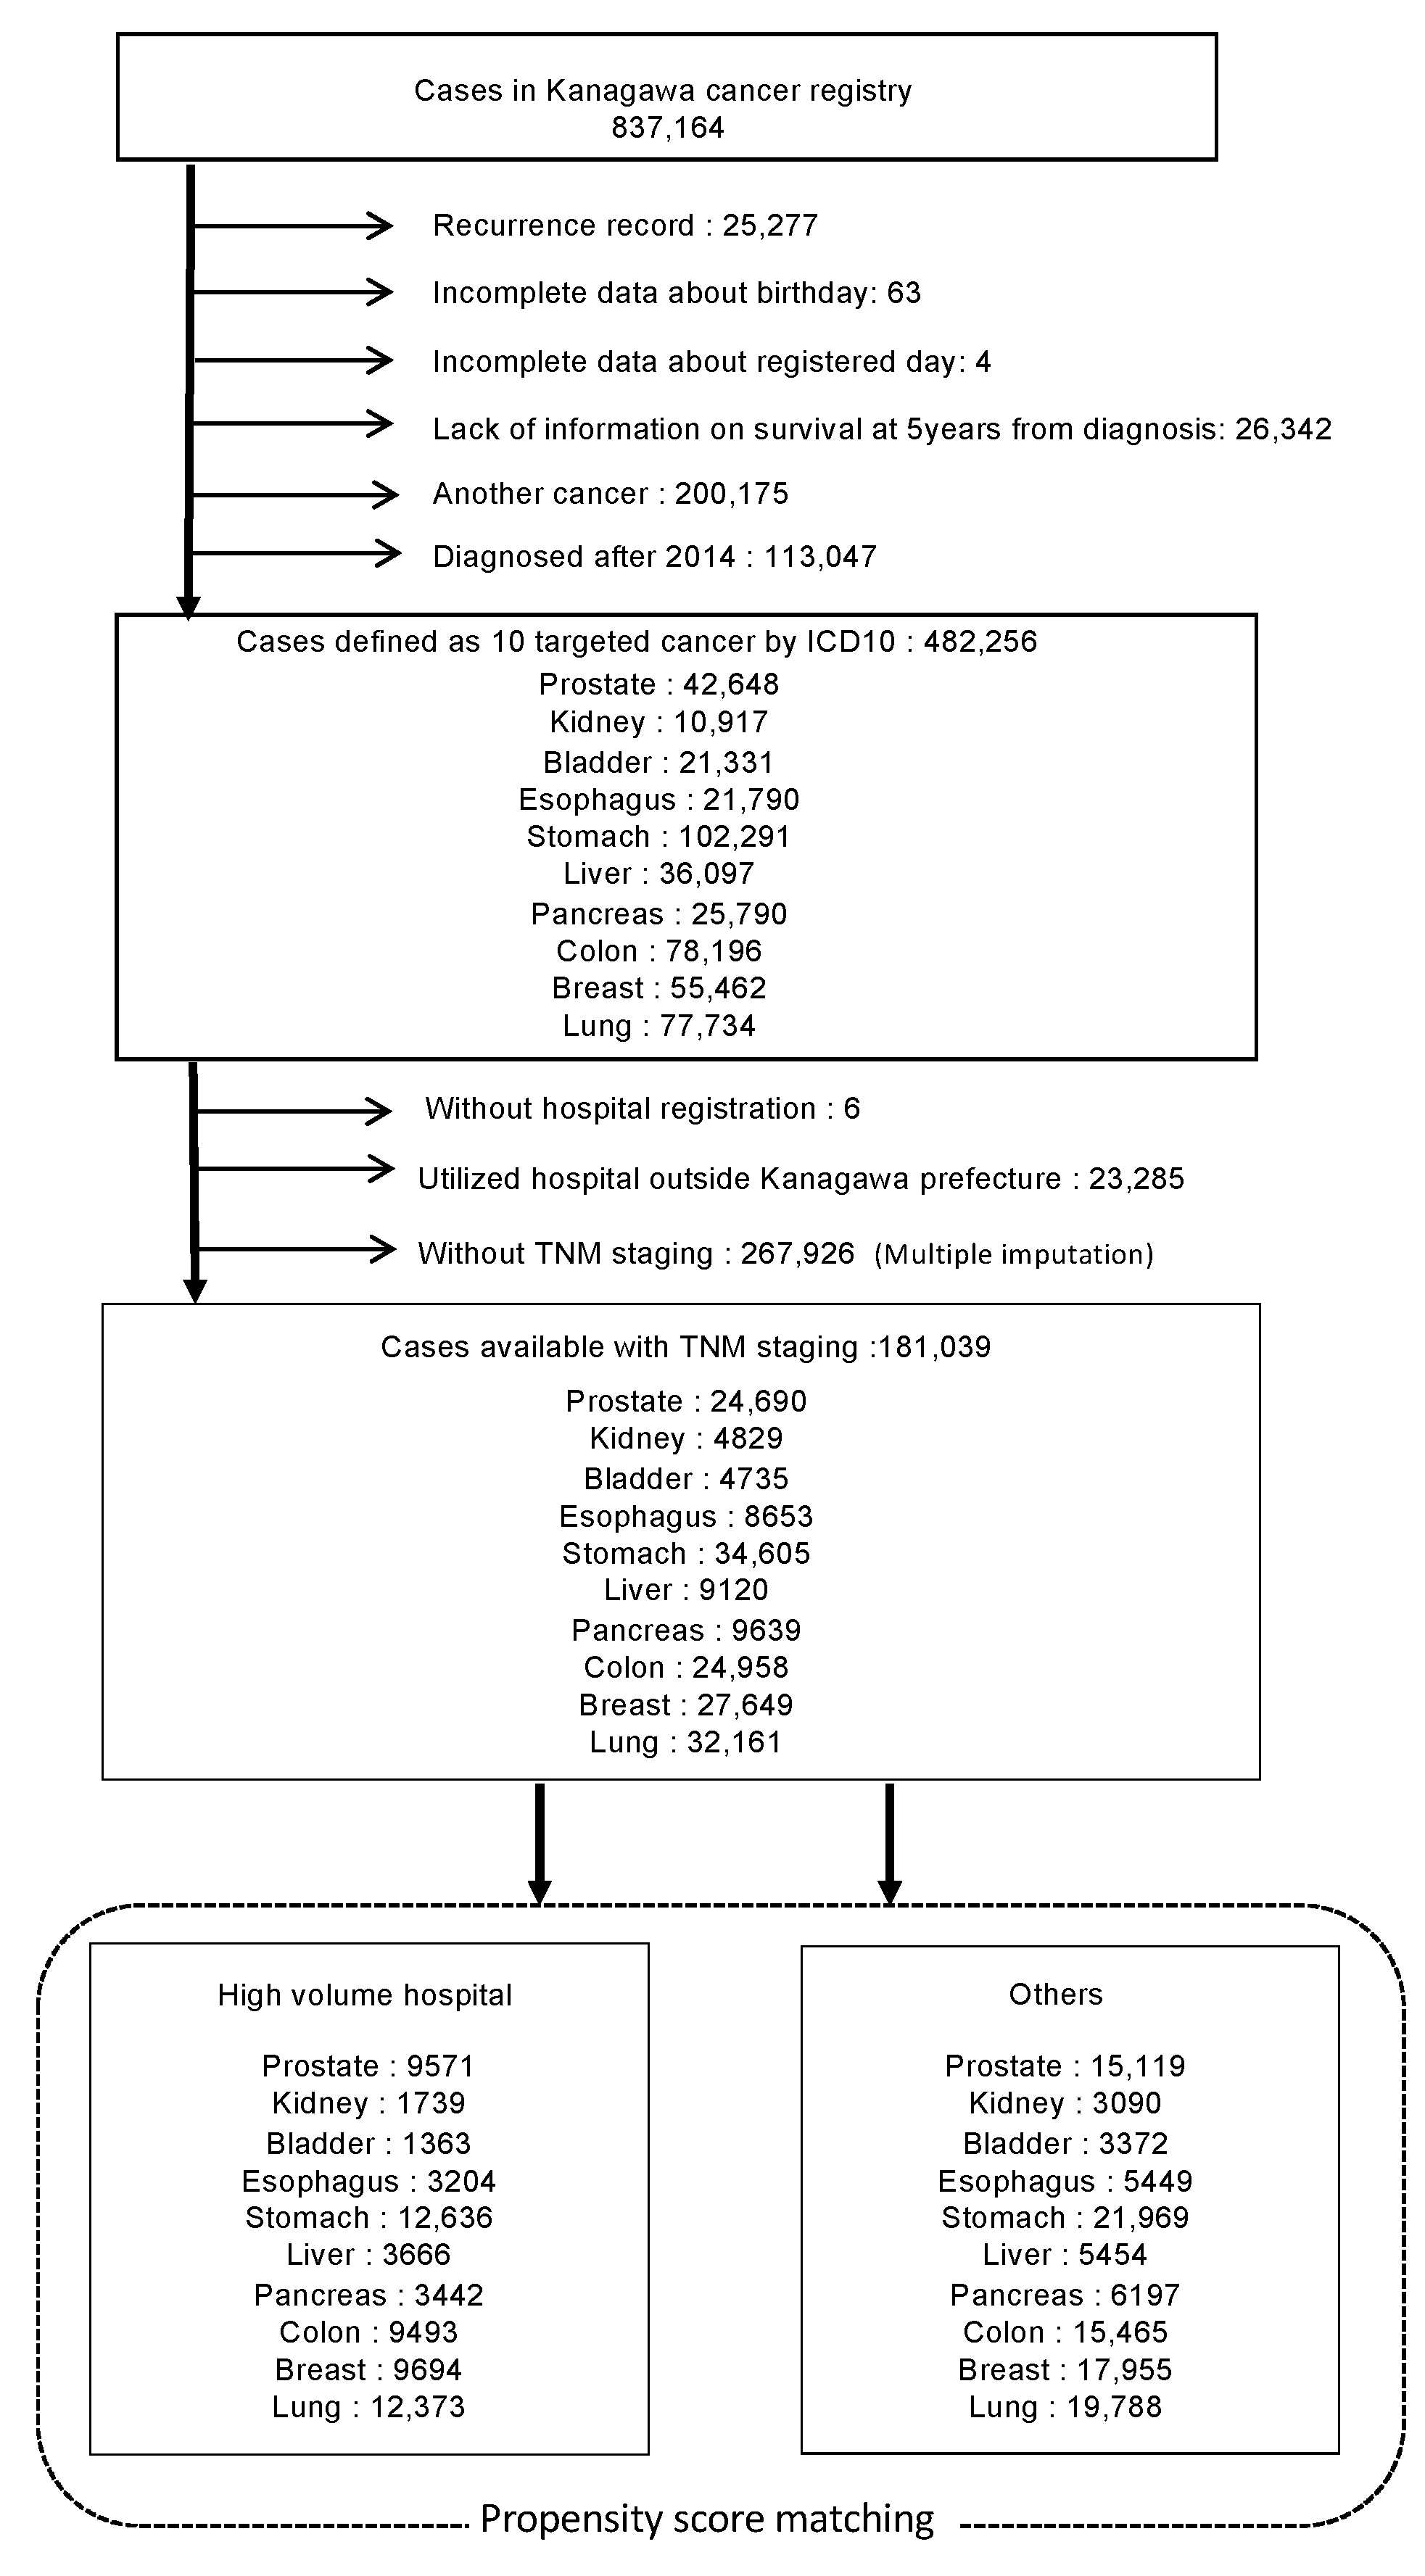
2.1. Data
2.2. Statistical Analysis
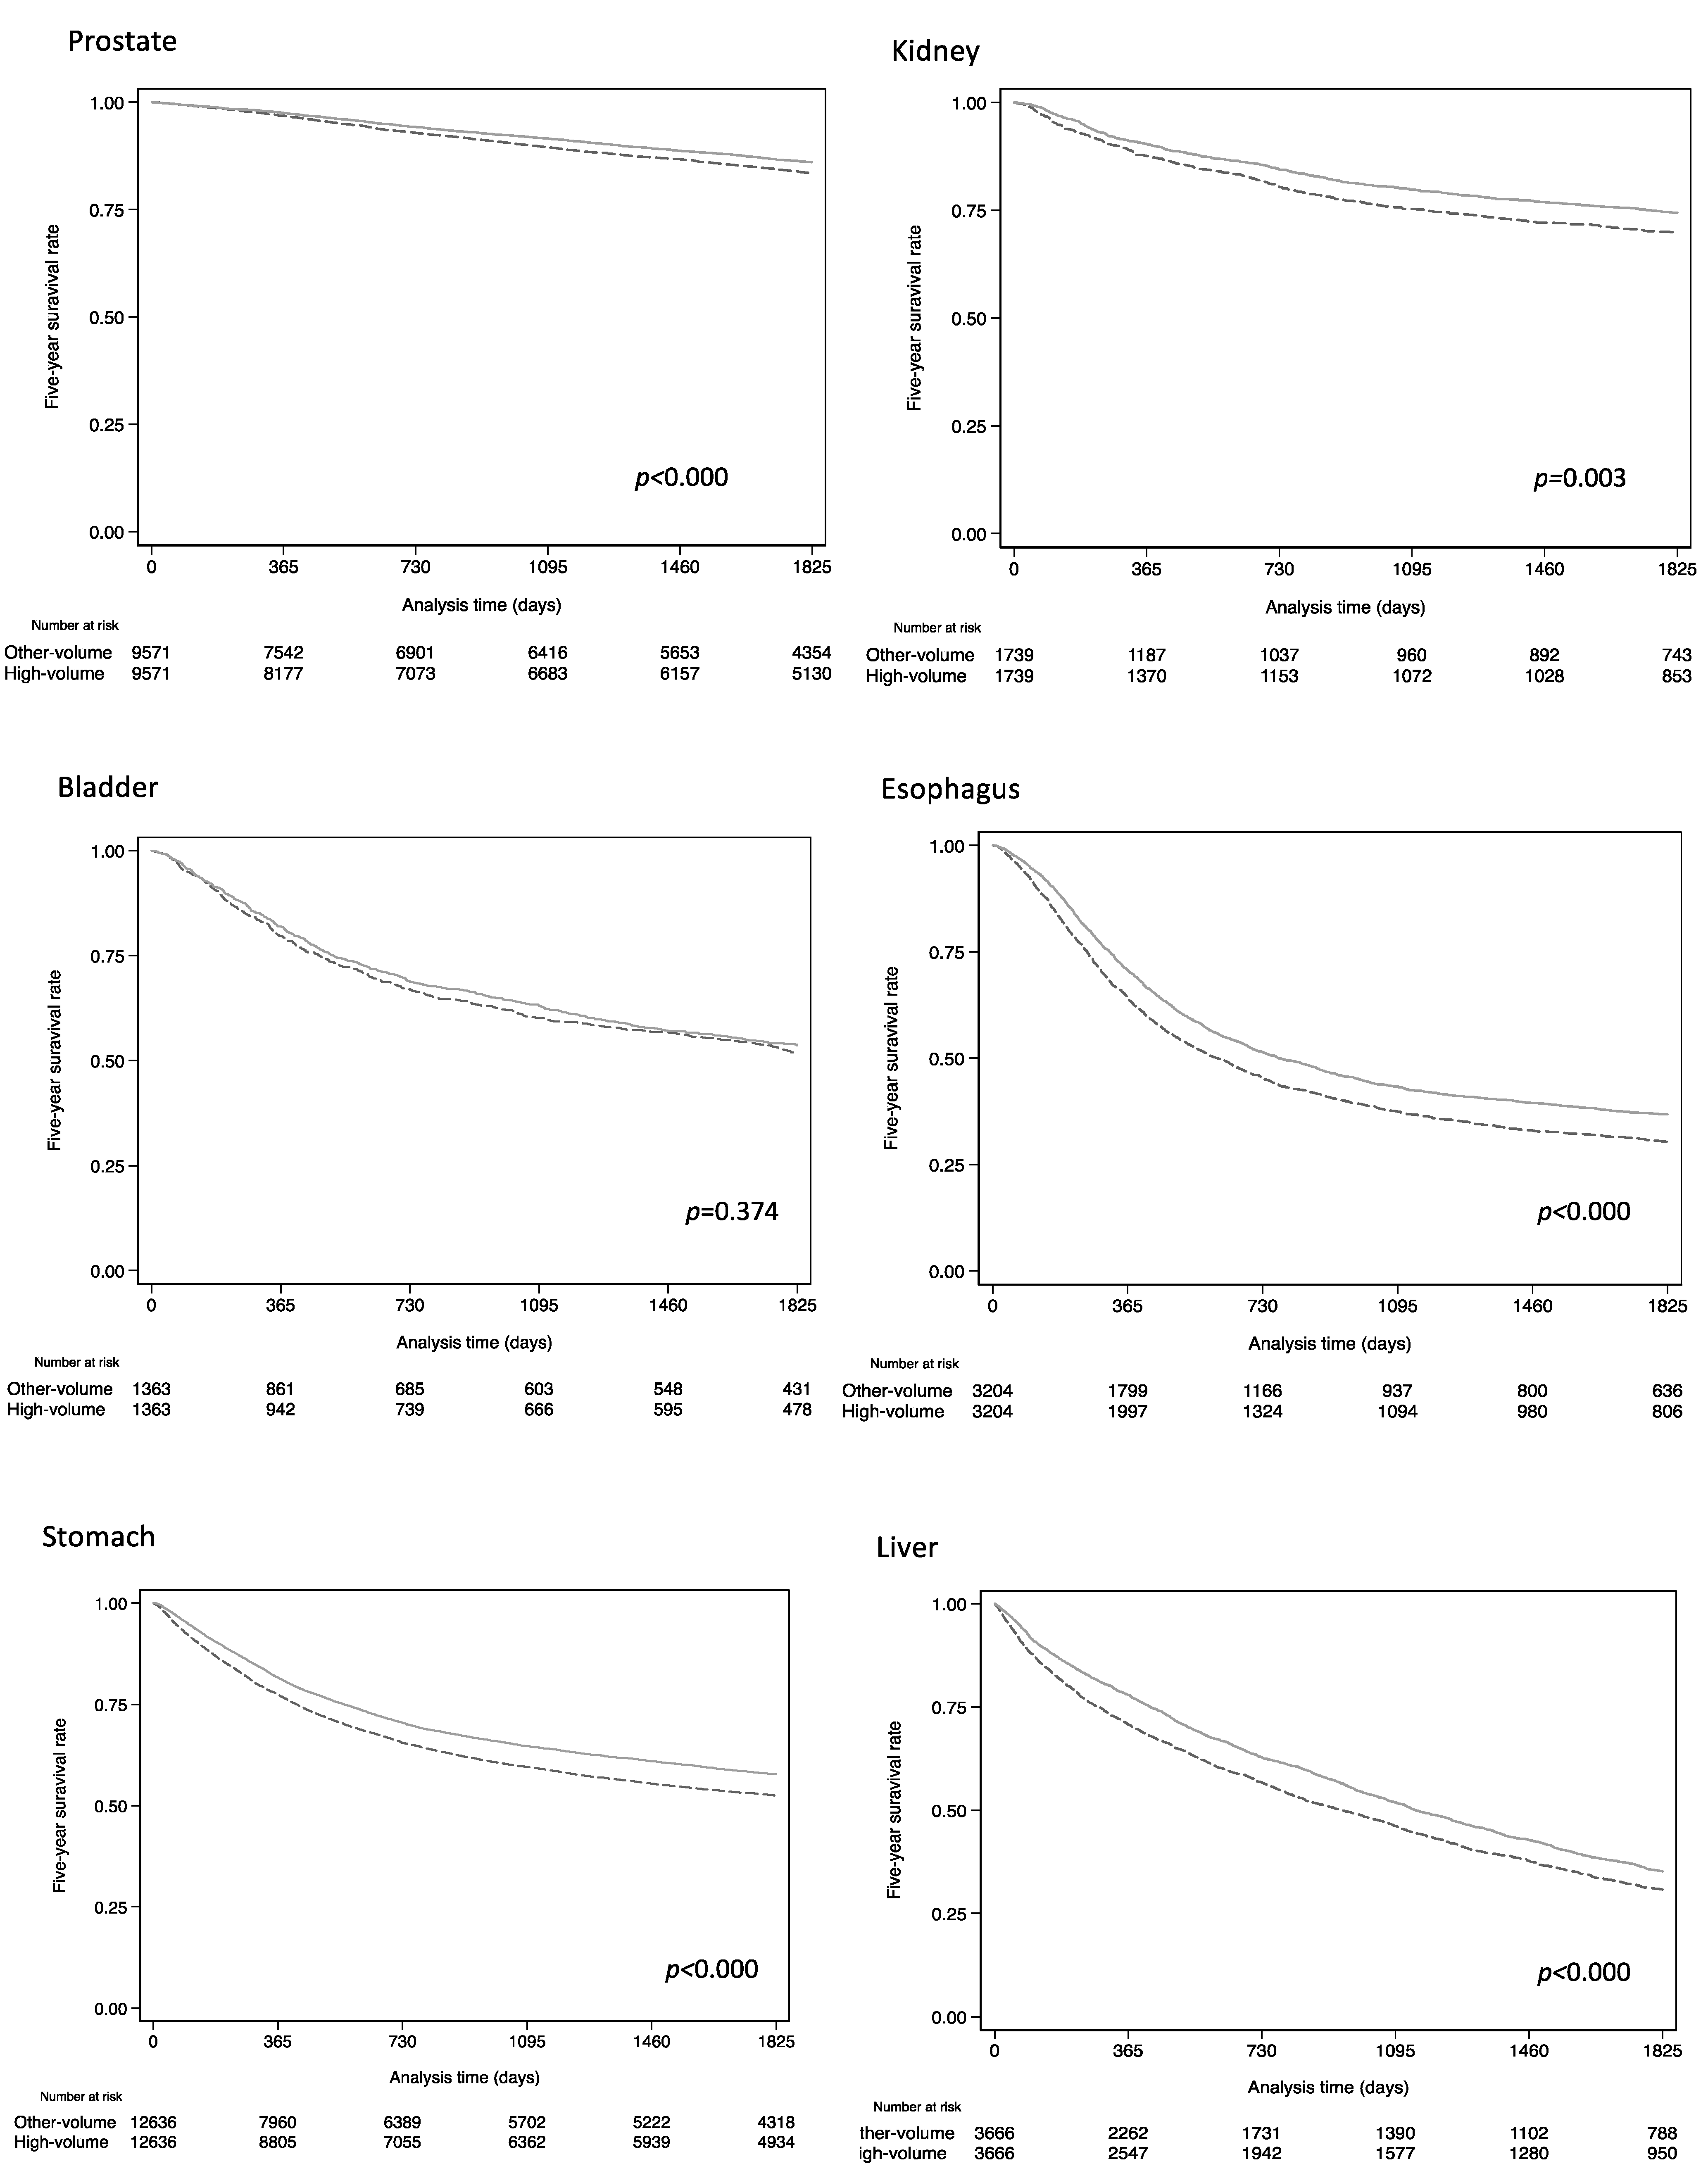
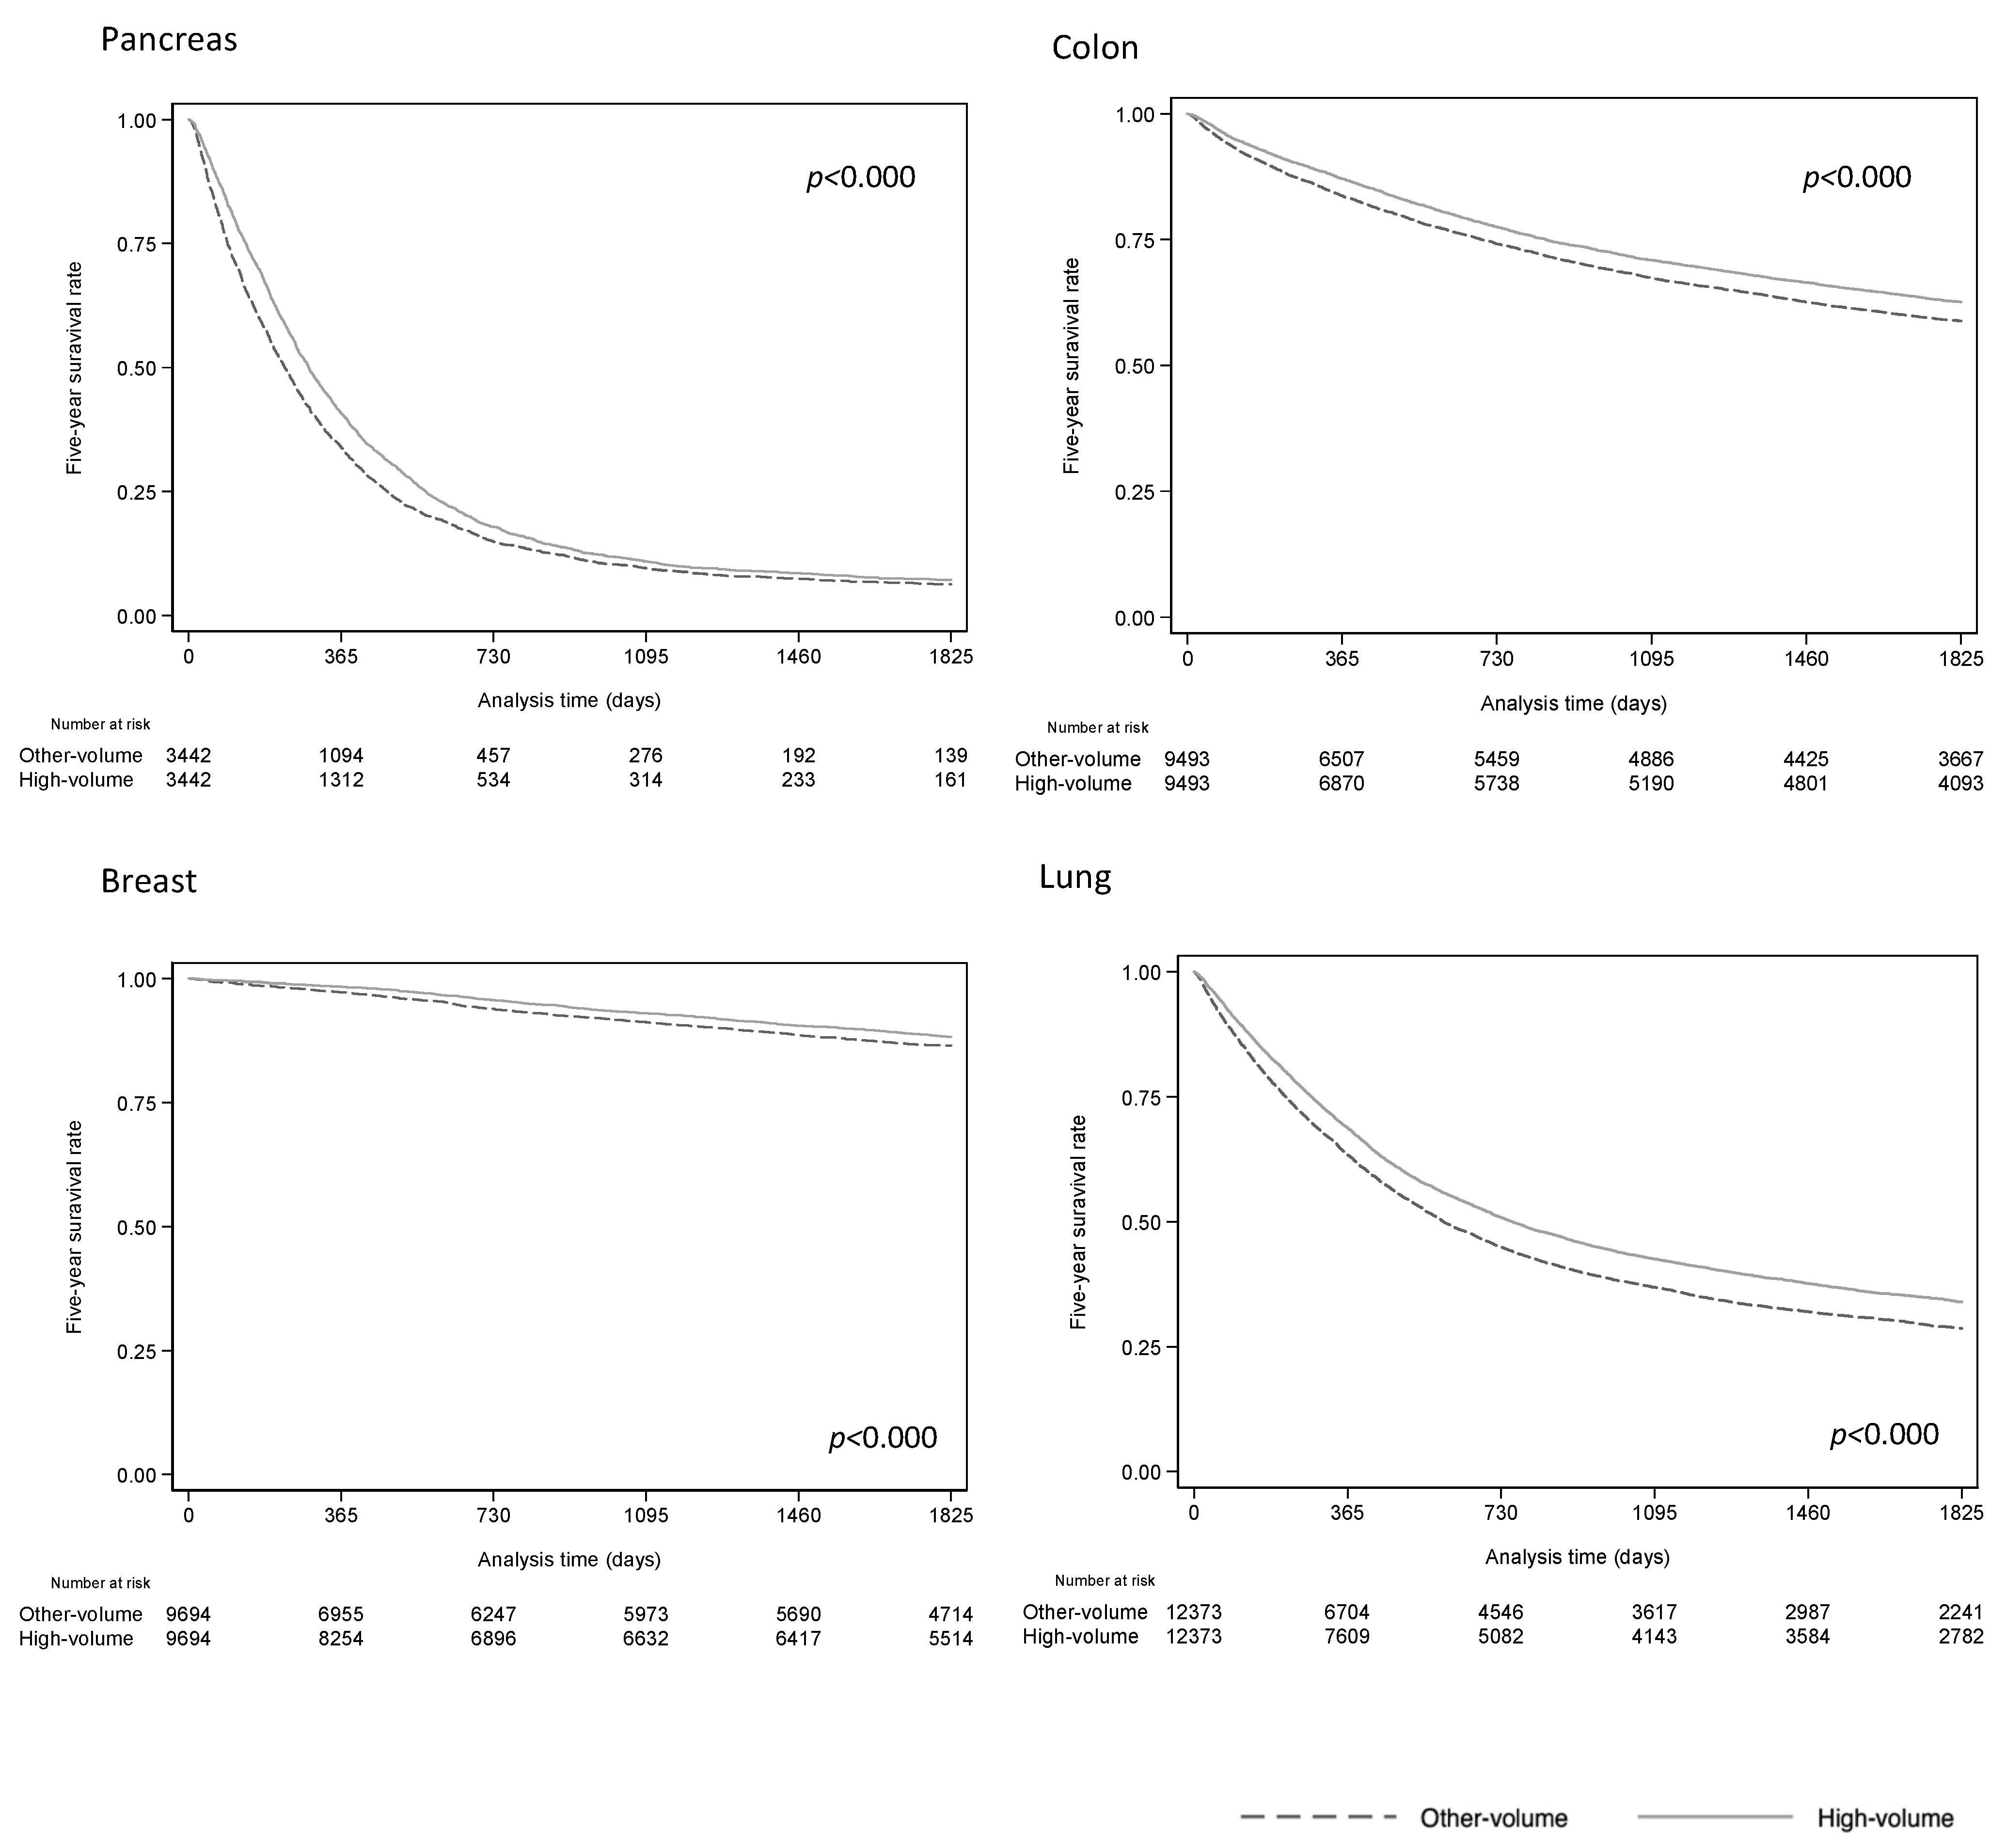
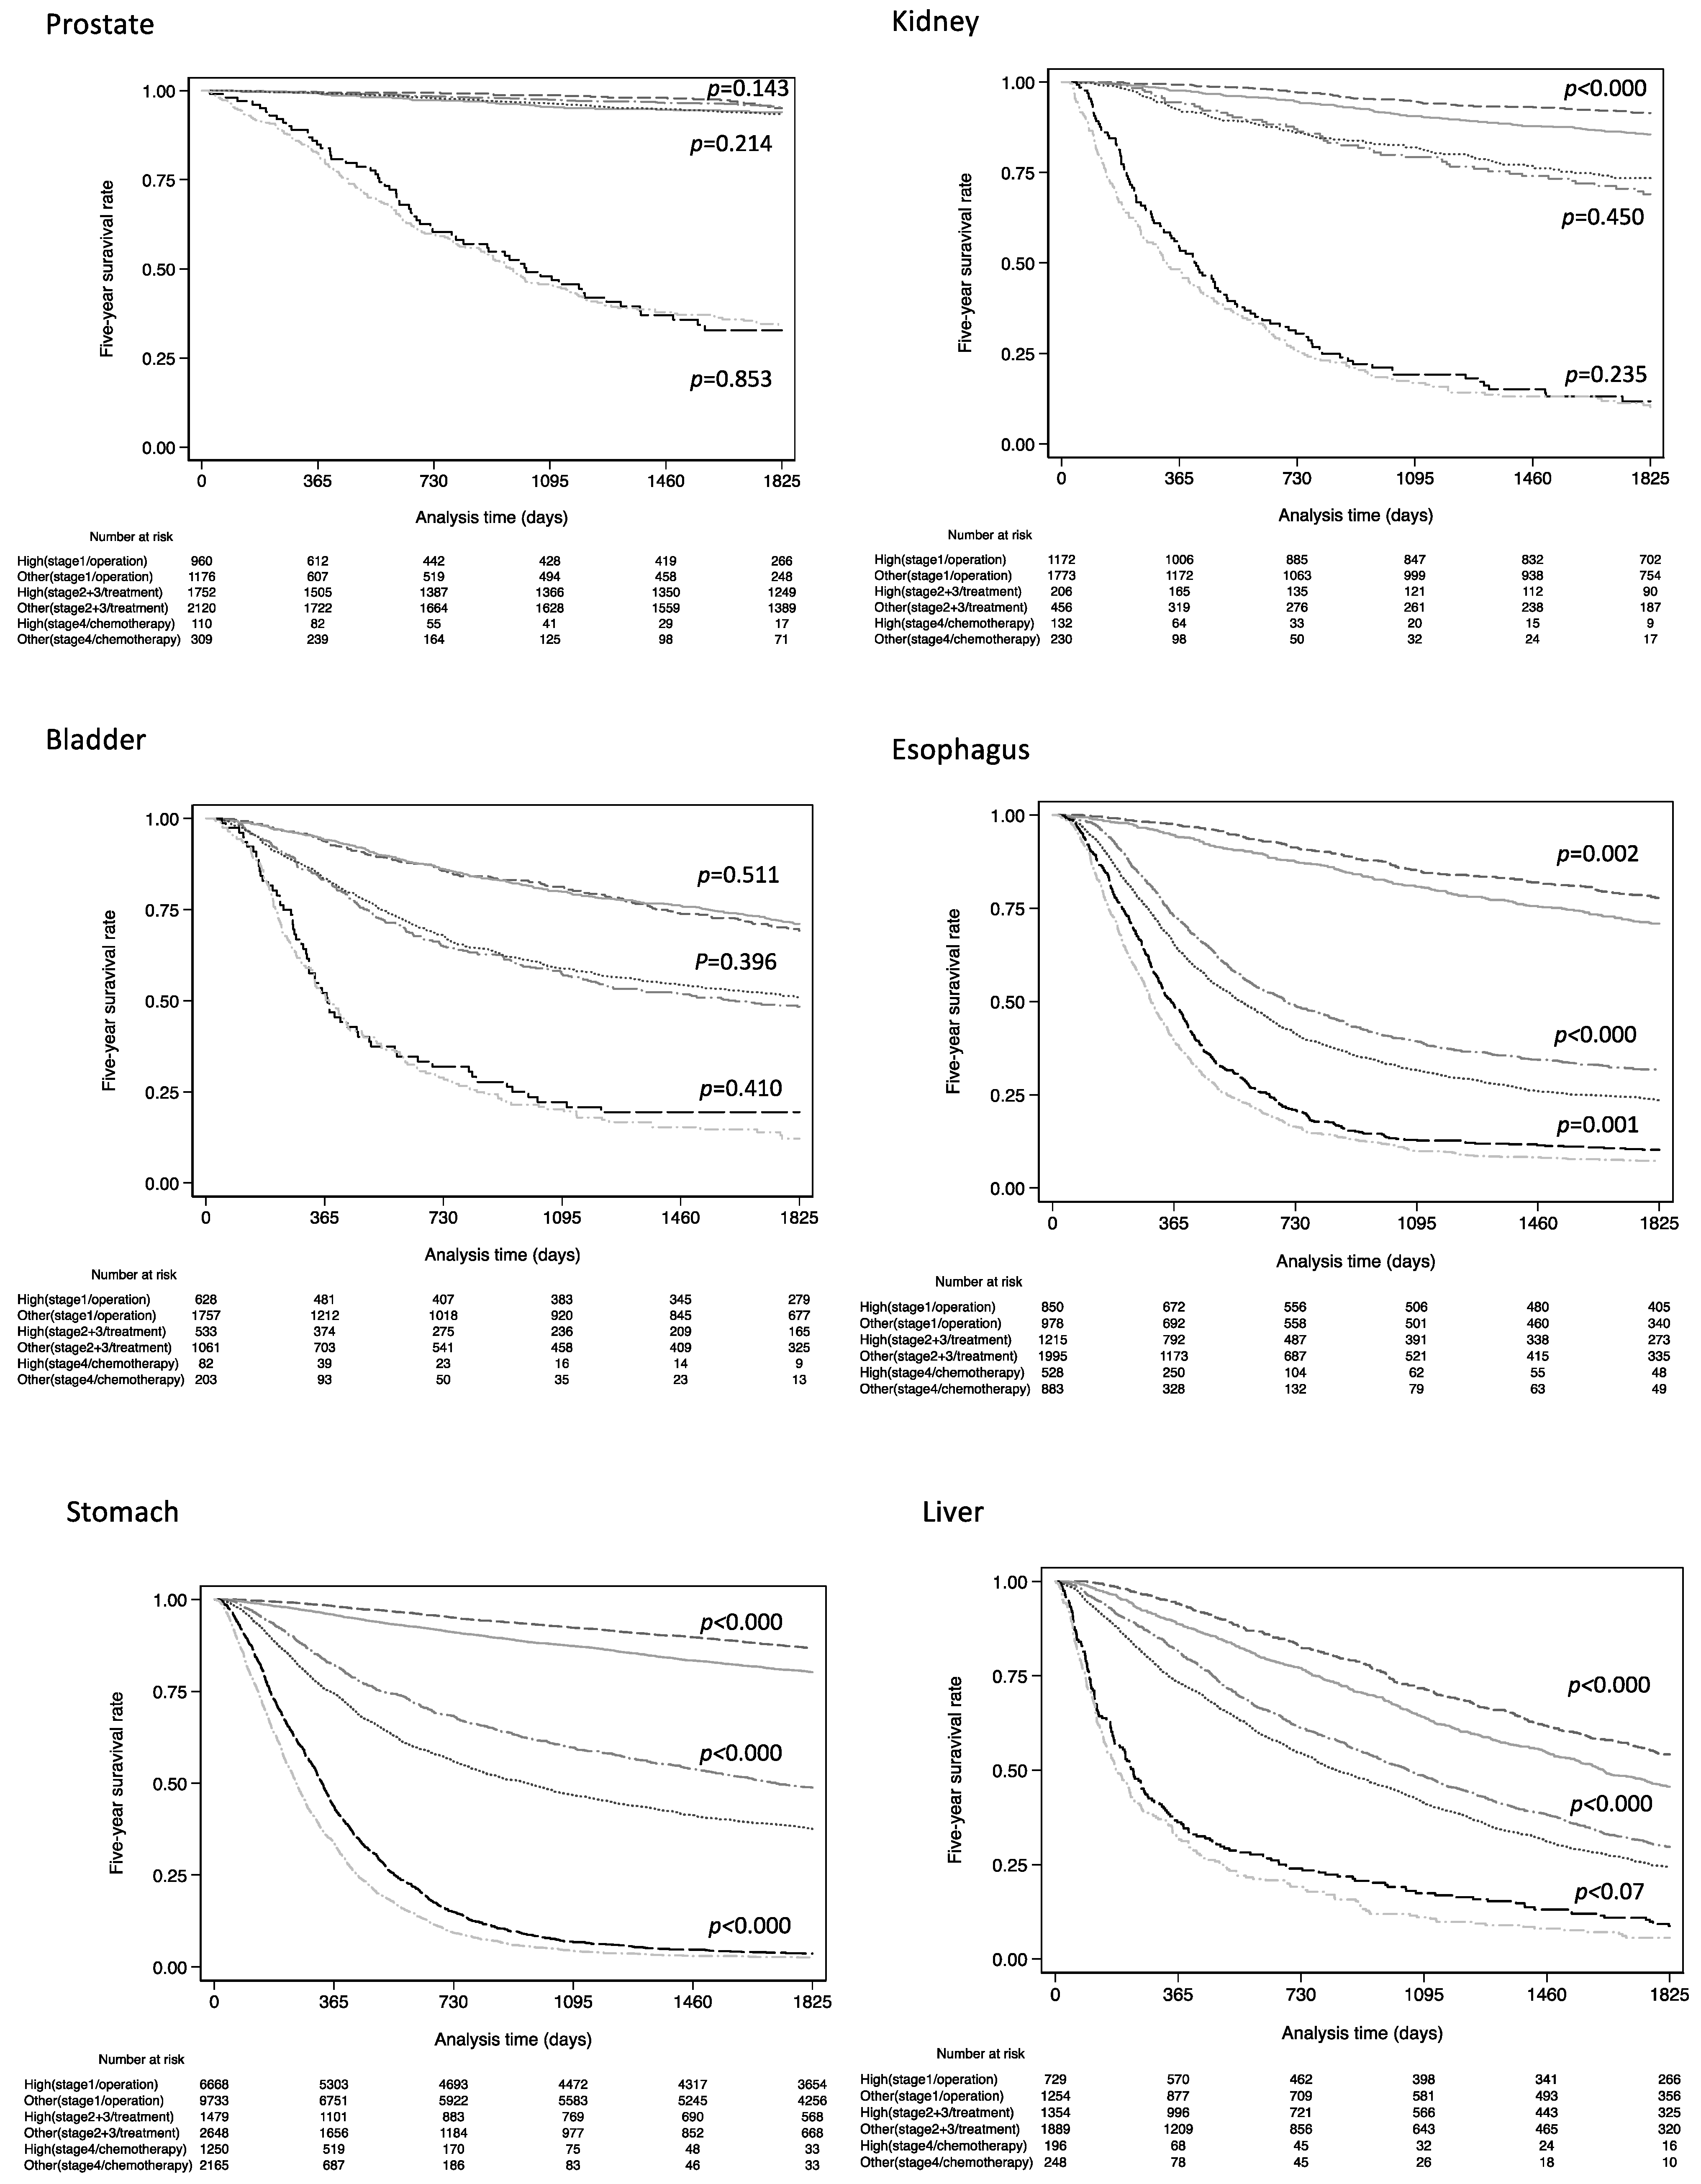
3. Results
4. Discussion
5. Conclusions
Author Contributions
Funding
Institutional Review Board Statement
Informed Consent Statement
Data Availability Statement
Conflicts of Interest
Appendix A

| Adjusted Hazard Ratio for High-Volume Hospital (95%CI) | ||||
|---|---|---|---|---|
| Size of the Samples to Be Drawn | ||||
| Cancer Category | 5000 | 3000 | 1000 | 500 |
| Prostate (C619) | 0.84 (0.75–0.94) | 0.84 (0.74–0.95) | 0.83 (0.62–1.13) | 0.84 (0.53–1.32) |
| Kidney (C649) | N.A | 0.79 (0.66–0.94) | 0.79 (0.56–1.10) | 0.79 (−0.30–2.05) |
| Bladder (C670/679) | N.A | N.A | 0.96 (0.81–1.13) | 0.96 (0.76–1.20) |
| Esophagus (C150/159) | 0.79 (0.75–0.85) | 0.79 (0.71–0.89) | 0.79 (0.66–0.95) | 0.79 (0.53–1.19) |
| Stomach (C160/169) | 0.76 (0.71–0.83) | 0.77 (0.79–0.84) | 0.76 (0.64–0.91) | N.A |
| Liver (C220) | N.A | 0.82 (0.77–0.89) | 0.83 (0.72–0.95) | 0.83 (0.79–0.96) |
| Pancreas (C250/259) | N.A | 0.84 (0.79–0.90) | 0.84 (0.76–0.93) | 0.84 (0.75–0.94) |
| Colon (C180/189) | 0.86 (0.79–0.93) | 0.85 (0.78–0.94) | 0.86 (0.74–0.98) | 0.86 (0.69–1.06) |
| Breast (C500/509) | 0.83 (0.73–0.95) | 0.83 (0.68–0.99) | 0.83 (0.61–1.13) | 0.83 (0.56–1.23) |
| Lung (C340/349) | 0.84 (0.78–0.89) | 0.84 (0.78–0.90) | 0.84 (0.74–0.95) | 0.84 (0.60–1.13) |
References
- Luft, H.S.; Hunt, S.S.; Maerki, S.C. The volume-outcome relationship: Practice-makes-perfect or selective-referral patterns? Health Serv. Res. 1987, 22, 157–182. [Google Scholar] [PubMed]
- Nakao, T.; Kaneko, R.; Tanaka, H.; Kobayashi, S.; Omori, R.; Yano, Y.; Kamada, K.; Ikehara, T.; Sato, Y.; Igarashi, Y. Contribution of chemotherapy to improved prognosis in stage 4 gastric cancer: Trend analysis of a regional population-based cancer registry in Japan. Int. J. Clin. Oncol. 2021, 26, 378–386. [Google Scholar] [CrossRef] [PubMed]
- Monden, M. The basic plan to promote cancer control in Japan. Gan To Kagaku Ryoho 2013, 40, 559–564. [Google Scholar] [PubMed]
- Yamaguchi, K. Challenges and prospects for cancer treatment base hospitals. Kousyu Eisei 2013, 77, 961–967. (In Japanese) [Google Scholar] [CrossRef]
- Ministry of Health, Labor and Welfare, Japan. Overview of the Basic Plan to Promote Cancer Control Programs. Available online: https://www.mhlw.go.jp/english/wp/wp-hw3/dl/2-078.pdf (accessed on 12 September 2022).
- Sobue, T. Recent progress and future direction of cancer epidemiological research in Japan. Jpn. J. Clin. Oncol. 2015, 45, 509–512. [Google Scholar] [CrossRef] [Green Version]
- Toomey, P.G.; Teta, A.F.; Patel, K.D.; Ross, S.B.; Rosemurgy, A.S. High-volume surgeons vs high-volume hospitals: Are best outcomes more due to who or where? Am. J. Surg. 2016, 211, 59–63. [Google Scholar] [CrossRef]
- Goodney, P.P.; Stukel, T.A.; Lucas, F.L.; Finlayson, E.V.; Birkmeyer, J.D. Hospital volume, length of stay, and readmission rates in high-risk surgery. Ann. Surg. 2003, 238, 161–167. [Google Scholar] [CrossRef]
- Metcalfe, D.; Salim, A.; Olufajo, O.; Gabbe, B.; Zogg, C.; Harris, M.B.; Perry, D.C.; Costa, M.L. Hospital case volume and outcomes for proximal femoral fractures in the USA: An observational study. BMJ Open 2016, 6, e010743. [Google Scholar] [CrossRef] [Green Version]
- Hentschker, C.; Mennicken, R. The volume-outcome relationship and minimum volume standards—Empirical evidence for Germany. Health Econ. 2015, 24, 644–658. [Google Scholar] [CrossRef]
- Chassin, M.R. Explaining geographic variations. The enthusiasm hypothesis. Med. Care 1993, 31, Ys37–Ys44. [Google Scholar] [CrossRef]
- Tsukada, Y.; Nakamura, F.; Iwamoto, M.; Nishimoto, H.; Emori, Y.; Terahara, A.; Higashi, T. Are hospitals in Japan with larger patient volume treating younger and earlier-stage cancer patients? An analysis of hospital-based cancer registry data in Japan. Jpn. J. Clin. Oncol. 2015, 45, 719–726. [Google Scholar] [CrossRef] [PubMed] [Green Version]
- Ock, M.; Choi, W.J.; Jo, M.W. Trend analysis of major cancer statistics according to sex and severity levels in Korea. PLoS ONE 2018, 13, e0203110. [Google Scholar] [CrossRef] [Green Version]
- Murata, A.; Muramatsu, K.; Ichimiya, Y.; Kubo, T.; Fujino, Y.; Matsuda, S. Influence of hospital volume on outcomes of laparoscopic gastrectomy for gastric cancer in patients with comorbidity in Japan. Asian J. Surg. 2015, 38, 33–39. [Google Scholar] [CrossRef] [PubMed] [Green Version]
- Ioka, A.; Tsukuma, H.; Ajiki, W.; Oshima, A. Hospital procedure volume and survival of cancer patients in Osaka, Japan: A population-based study with latest cases. Jpn. J. Clin. Oncol. 2007, 37, 544–553. [Google Scholar] [CrossRef] [Green Version]
- Odagiri, H.; Yasunaga, H.; Matsui, H.; Matsui, S.; Fushimi, K.; Kaise, M. Hospital volume and adverse events following esophageal endoscopic submucosal dissection in Japan. Endoscopy 2017, 49, 321–326. [Google Scholar] [CrossRef] [PubMed]
- Nomura, E.; Tsukuma, H.; Ajiki, W.; Ishikawa, O.; Oshima, A. Population-based study of the relationship between hospital surgical volume and 10-year survival of breast cancer patients in Osaka, Japan. Cancer Sci. 2006, 97, 618–622. [Google Scholar] [CrossRef]
- Nishigori, T.; Miyata, H.; Okabe, H.; Toh, Y.; Matsubara, H.; Konno, H.; Seto, Y.; Sakai, Y. Impact of hospital volume on risk-adjusted mortality following oesophagectomy in Japan. Br. J. Surg. 2016, 103, 1880–1886. [Google Scholar] [CrossRef] [Green Version]
- Okawa, S.; Tabuchi, T.; Morishima, T.; Koyama, S.; Taniyama, Y.; Miyashiro, I. Hospital volume and postoperative 5-year survival for five different cancer sites: A population-based study in Japan. Cancer Sci. 2020, 111, 985–993. [Google Scholar] [CrossRef] [Green Version]
- Okamoto, N. A history of the cancer registration system in Japan. Int. J. Clin. Oncol. 2008, 13, 90–96. [Google Scholar] [CrossRef]
- Government of Kanagawa Prefecture. Annual Report of Kanagawa Cancer Registry 44th Edition. 2021. Available online: https://www.pref.kanagawa.jp/documents/65245/nennou-1.pdf (accessed on 12 September 2022).
- Liver Cancer Study Group of Japan. The General Rules for the Clinical and Pathological Study of Primary Liver Cancer, 6th ed.; Kanehara & Co. Ltd.: Tokyo, Japan, 2015. [Google Scholar]
- National Cancer Center Japan. Cancer Information Service. Cancer Statistics in Japan; Table Download. Available online: https://ganjoho.jp/reg_stat/statistics/stat/summary.html (accessed on 12 September 2022).
- Inoue, M.; Sawada, N.; Matsuda, T.; Iwasaki, M.; Sasazuki, S.; Shimazu, T.; Shibuya, K.; Tsugane, S. Attributable causes of cancer in Japan in 2005--systematic assessment to estimate current burden of cancer attributable to known preventable risk factors in Japan. Ann. Oncol. Off. J. Eur. Soc. Med. Oncol. 2012, 23, 1362–1369. [Google Scholar] [CrossRef]
- Hori, M.; Matsuda, T.; Shibata, A.; Katanoda, K.; Sobue, T.; Nishimoto, H. Cancer incidence and incidence rates in Japan in 2009: A study of 32 population-based cancer registries for the Monitoring of Cancer Incidence in Japan (MCIJ) project. Jpn. J. Clin. Oncol. 2015, 45, 884–891. [Google Scholar] [CrossRef] [PubMed]
- Zaitsu, M.; Kaneko, R.; Takeuchi, T.; Sato, Y.; Kobayashi, Y.; Kawachi, I. Occupational inequalities in female cancer incidence in Japan: Hospital-based matched case-control study with occupational class. SSM-Popul. Health 2018, 5, 129–137. [Google Scholar] [CrossRef] [PubMed]
- Yasunaga, H. Introduction to Applied Statistics—Chapter 1 Propensity Score Analysis. Ann. Clin. Epidemiol. 2020, 2, 33–37. [Google Scholar] [CrossRef]
- Rosenbaum, P.R.; Rubin, D.B. Constructing a control group using multivariate matched sampling methods. That incorporate the propensity score. Am. Stat. 1985, 39, 33–38. [Google Scholar]
- Royston, P. Multiple Imputation of Missing Values: Further Update of Ice, with an Emphasis on Categorical Variables. Stata J. 2009, 9, 466–477. [Google Scholar] [CrossRef] [Green Version]
- Kakizoe, T. Ten Years after Implementation of Cancer Control Act. Gan To Kagaku Ryoho 2016, 43, 1023–1026. [Google Scholar] [PubMed]
- Kaneko, R.; Nakazaki, N.; Omori, R.; Yano, Y.; Ogawa, M.; Sato, Y. The Effect of New Therapeutic and Diagnostic Agents on the Prognosis of Hepatocellular Carcinoma in Japan—An Analysis of Data from the Kanagawa Cancer Registry. Asian Pac. J. Cancer Prev. APJCP 2017, 18, 2471–2476. [Google Scholar] [CrossRef]
- Morishima, T.; Matsumoto, Y.; Koeda, N.; Shimada, H.; Maruhama, T.; Matsuki, D.; Nakata, K.; Ito, Y.; Tabuchi, T.; Miyashiro, I. Impact of Comorbidities on Survival in Gastric, Colorectal, and Lung Cancer Patients. J. Epidemiol. 2019, 29, 110–115. [Google Scholar] [CrossRef] [Green Version]
- National Cancer Center Japan. Cancer Survival (1993–2011). Cancer Information Service. Cancer Statistics in Japan; Table Download. Available online: https://ganjoho.jp/reg_stat/statistics/data/dl/index.html#a30 (accessed on 12 September 2022).
- Gourin, C.G.; Stewart, C.M.; Frick, K.D.; Fakhry, C.; Pitman, K.T.; Eisele, D.W.; Austin, J.M. Association of Hospital Volume with Laryngectomy Outcomes in Patients with Larynx Cancer. JAMA Otolaryngol. Head Neck Surg. 2019, 145, 62–70. [Google Scholar] [CrossRef]
- Pieper, D.; Mathes, T.; Neugebauer, E.; Eikermann, M. State of evidence on the relationship between high-volume hospitals and outcomes in surgery: A systematic review of systematic reviews. J. Am. Coll. Surg. 2013, 216, 1015–1025.e1018. [Google Scholar] [CrossRef]
- Halm, E.A.; Lee, C.; Chassin, M.R. Is volume related to outcome in health care? A systematic review and methodologic critique of the literature. Ann. Intern. Med. 2002, 137, 511–520. [Google Scholar] [CrossRef] [PubMed]
- Jazieh, A.R.; Al-Saggabi, A.H.; McClung, M.; Carlson, R.; Schnipper, L.E.; Eniu, A.; Blauvelt, B.; Zafar, Y.; Kerr, D. Facing the Global Challenges of Access to Cancer Medication. J. Glob. Oncol. 2018, 4, 1–7. [Google Scholar] [CrossRef] [PubMed]
- Madley-Dowd, P.; Hughes, R.; Tilling, K.; Heron, J. The proportion of missing data should not be used to guide decisions on multiple imputation. J. Clin. Epidemiol. 2019, 110, 63–73. [Google Scholar] [CrossRef] [PubMed] [Green Version]
- Ioka, A.; Tsukuma, H.; Ajiki, W.; Oshima, A. Influence of hospital procedure volume on uterine cancer survival in Osaka, Japan. Cancer Sci. 2005, 96, 689–694. [Google Scholar] [CrossRef] [PubMed]
- Ioka, A.; Tsukuma, H.; Ajiki, W.; Oshima, A. Influence of hospital procedure volume on ovarian cancer survival in Japan, a country with low incidence of ovarian cancer. Cancer Sci. 2004, 95, 233–237. [Google Scholar] [CrossRef]
| Cancer Category | High Volume | Others | p |
|---|---|---|---|
| Prostate (C619), N | 9571 | 15,119 | |
| The number of hospitals | 7 | 82 | |
| Hospital volume: mean (range) ** | 129.3 (106.1–155.4) | 10.3 (0.6–84.2) | |
| Gender (male/female), % * | 100/0 | 100/0 | - |
| Age (median:IQR §) | 71.2 (66.1:75.9) | 73.1 (67.9:78.0) | <0.000 ‡ |
| Period of diagnosis (1/2/3/4/5) ¶, % * | 0.0/0.1/0.7/32.0/67.2 | 0.0/0.1/1.6/25.4/72.3 | <0.000 ‡ |
| Stage (1/2/3/4), % * | 29.9/45.6/12.2/12.3 | 29.8/40.5/11.9/17.8 | <0.000 ‡ |
| Kidney (C649), N | 1739 | 3090 | |
| The number of hospitals | 4 | 69 | |
| Hospital volume: mean (range) ** | 39.9(32.2–43.4) | 2.5(0.6–26.8) | |
| Gender (male/female), % * | 72.3/27.7 | 72.2/27.8 | 0.898 |
| Age (median:IQR §) | 65.4 (56.5:72.4) | 68.5 (60.4:70.6) | <0.000 ‡ |
| Period of diagnosis (1/2/3/4/5) ¶, % * | 0/0.1/1.7/39.3/58.9 | 0/0.3/1.6/22.9/75.2 | <0.000 ‡ |
| Stage (1/2/3/4), % * | 70.6/5.2/7.5/16.7 | 64.0/7.0/9.4/9.6 | <0.000 ‡ |
| Bladder (C670/679), N | 1363 | 3372 | |
| The number of hospitals | 7 | 67 | |
| Hospital volume: mean(range) ** | 51.9 (45.5–63.3) | 2.7 (0.6–40.5) | |
| Gender (male/female), % * | 77.8/22.2 | 78.7/21.3 | 0.498 |
| Age (median:IQR§) | 74.2 (66.2:80.9) | 73.8 (66.1:80.3) | 0.047 † |
| Period of diagnosis (1/2/3/4/5) ¶, % * | 0/0.1/0.5/33/66.4 | 0.1/0.2/1.7/25.3/72.7 | <0.000 ‡ |
| Stage (1/2/3/4), % * | 47.5/27.2/13.9/11.4 | 54/21.7/11.9/12.4 | <0.000 ‡ |
| Esophagus (C150/159), N | 3204 | 5449 | |
| The number of hospitals | 3 | 100 | |
| Hospital volume: mean(range) ** | 117.2 (72.6–156.1) | 3.1 (0.6–47.2) | |
| Gender (male/female), % * | 86.3/13.7 | 84.6/15.4 | 0.030 † |
| Age (median:IQR §) | 70.5 (64.1:76.6) | 68.4 (63.1:74.3) | <0.000 ‡ |
| Period of diagnosis (1/2/3/4/5) ¶, % * | 0/0.1/5.7/38.0/56.2 | 0/0.5/4.5/26.8/68.1 | <0.000 ‡ |
| Stage (1/2/3/4), % * | 34.8/13.5/30.7/21.0 | 27.5/16.1/30.0/26.3 | <0.000 ‡ |
| Stomach (C160/169), N | 12,636 | 21,969 | |
| The number of hospitals | 7 | 153 | |
| Hospital volume: mean(range) ** | 222.6 (168.5–331.3) | 8.2 (0.6–112.6) | |
| Gender (male/female), % * | 70.6/29.4 | 70.9/29.1 | 0.492 |
| Age (median:IQR §) | 70.8 (63.8:77.1) | 72.7 (65.4:79.1) | <0.000 ‡ |
| Period of diagnosis (1/2/3/4/5) ¶, % * | 0.0/1.0/7.6/35.7/55.7 | 0.0/0.5/4.3/26.8/68.4 | <0.000 ‡ |
| Stage (1/2/3/4), % * | 58.4/10.1/11.8/19.7 | 51.5/12.1/10.8/25.6 | <0.000 ‡ |
| Liver (C220), N | 3666 | 5454 | |
| The number of hospitals | 8 | 86 | |
| Hospital volume: mean(range) ** | 65.5 (49.0–78.5) | 3.2 (0.6–34.1) | |
| Gender (male/female), % * | 70.8/29.1 | 70.1/29.9 | 0.485 |
| Age (median:IQR §) | 71.5 (64.4:77.4) | 73.3 (65.8:79.3) | <0.000 ‡ |
| Period of diagnosis (1/2/3/4/5) ¶, % * | 0.2/0.8/5.7/35.7/57.6 | 0.0/0.3/2.2/29.3/68.2 | <0.000 ‡ |
| Stage (1/2/3/4), % * | 40.5/27.8/22.2/9.5 | 37.4/27.1/22.4/13.1 | <0.000 ‡ |
| Pancreas (C250/259), N | 3442 | 6197 | |
| The number of hospitals | 6 | 103 | |
| Hospital volume: mean(range) ** | 57.8 (40.7–93.2) | 3.4 (0.6–30.9) | |
| Gender (male/female), % * | 57.0/43.0 | 55.5/44.5 | 0.166 |
| Age (median:IQR §) | 69.6 (63.0:75.8) | 73.4 (66.1:80.5) | <0.000 ‡ |
| Period of diagnosis (1/2/3/4/5) ¶, % * | 0.0/0.0/4.2/35.0/60.7 | 0/0.3/2.9/23.1/73.7 | <0.000 ‡ |
| Stage (1/2/3/4), % * | 5.8/20.1/21.3/52.8 | 6.8/15.6/15.4/62.1 | <0.000 ‡ |
| Colon (C180/189), N | 9493 | 15,465 | |
| The number of hospitals | 8 | 123 | |
| Hospital volume: mean(range) ** | 163.5 (124.8–271.8) | 7.1 (0.6–109.7) | |
| Gender (male/female), % * | 54.6/45.4 | 55.3/44.7 | 0.257 |
| Age (median:IQR §) | 70.9 (63.1:77.7) | 72.6 (65.1:79.6) | <0.000 ‡ |
| Period of diagnosis (1/2/3/4/5) ¶, % * | 0.2/1.5/6.4/36.7/55.3 | 0.0/0.4/4.5/24.7/70.4 | <0.000 ‡ |
| Stage (1/2/3/4), % * | 30.0/19.4/31.1/19.3 | 26.5/21.5/27.9/24.1 | <0.000 ‡ |
| Breast (C500/509), N | 9694 | 17,955 | |
| The number of hospitals | 4 | 106 | |
| Hospital volume: mean(range) * | 262.4 (168.5–324.1) | 9.8 (0.6–136.8) | |
| Gender (male/female), % * | 0.3/99.7 | 0.6/99.4 | <0.000 ‡ |
| Age (median:IQR §) | 57.3(47.1:67.1) | 60.9(50.0:71.6) | <0.000 ‡ |
| Period of diagnosis (1/2/3/4/5) ¶, % * | 0.0/0.5/5.5/34.9/59.1 | 0.1/1.3/5.6/26.8/66.3 | <0.000 ‡ |
| Stage (1/2/3/4), % * | 44.9/38.9/10.6/5.6 | 41.6/40.3/11.1/7.0 | <0.000 ‡ |
| Lung (C340/349), N | 12,373 | 19,788 | |
| The number of hospitals | 6 | 125 | |
| Hospital volume: mean(range) ** | 217.4 (166.5–375.7) | 8.8 (0.6–121.9) | |
| Gender (male/female), % * | 68.0/32.0 | 70.4/29.6 | <0.000 ‡ |
| Age (median:IQR §) | 70.5 (63.6:76.5) | 72.7 (65.8:79.1) | <0.000 ‡ |
| Period of diagnosis (1/2/3/4/5) ¶, % * | 0.0/0.5/6.7/36.4/56.4 | 0.0/0.5/4.8/25.0/69.7 | <0.000 ‡ |
| Stage (1/2/3/4), % * | 37.4/8.7/21.4/32.5 | 25.8/6.6/21.5/46.1 | <0.000 ‡ |
| Cancer Category | High Volume | Others | SD |
|---|---|---|---|
| Prostate (C619), N | 9571 | 9571 | |
| Gender (male/female), % * | 100/0 | 100/0 | N.A |
| Age (median:IQR §) | 71.2 (66.1:75.9) | 71.3 (66.2:76.2) | −0.006 |
| Period of diagnosis (1/2/3/4/5) ¶, % * | 0.0/0.1/0.7/32.0/67.2 | 0.0/0.2/2.1/29.2/68.6 | 0.002 |
| Stage (1/2/3/4), % * | 29.9/45.6/12.2/12.3 | 32.9/43.2/10.2/13.8 | 0.022 |
| Kidney (C649), N | 1739 | 1739 | |
| Gender (male/female), % * | 72.3/27.7 | 72.2/27.8 | −0.003 |
| Age (median:IQR§) | 65.4 (56.5:72.4) | 64.8 (55.7:72.7) | 0.020 |
| Period of diagnosis (1/2/3/4/5) ¶, % * | 0/0.1/1.7/39.3/58.9 | 0/0.5/2.9/34.0/62.6 | −0.030 |
| Stage (1/2/3/4), % * | 70.6/5.2/7.5/16.7 | 67.9/7.9/8.3/15.8 | −0.005 |
| Bladder (C670/679), N | 1363 | 1363 | |
| Gender (male/female), % * | 77.8/22.2 | 78.0/22.2 | 0.005 |
| Age (median:IQR §) | 74.2 (66.2:80.9) | 74.5 (66.8:80.4) | −0.015 |
| Period of diagnosis (1/2/3/4/5) ¶, % * | 0/0.1/0.5/33/66.4 | 0/0/2.1/29.1/68.8 | −0.019 |
| Stage (1/2/3/4), % * | 47.5/27.2/13.9/11.4 | 49.8/23.2/12.9/14.1 | −0.017 |
| Esophagus (C150/159), N | 3204 | 3204 | |
| Gender (male/female), % * | 86.3/13.7 | 86.5/13.5 | 0.005 |
| Age (median:IQR §) | 70.5 (64.1:76.6) | 68.6 (62.5:74.8) | 0.014 |
| Period of diagnosis (1/2/3/4/5) ¶, % * | 0/0.1/5.7/38.0/56.2 | 0/0.9/6.7/33.1/59.3 | −0.006 |
| Stage (1/2/3/4), % * | 34.8/13.5/30.7/21.0 | 33.4/17.2/27.6/21.8 | 0.000 |
| Stomach (C160/169), N | 12,636 | 12,636 | |
| Gender (male/female), % * | 70.6/29.4 | 70.9/29.1 | 0.014 |
| Age (median:IQR §) | 70.8 (63.8:77.1) | 70.8 (63.5:77.2) | 0.011 |
| Period of diagnosis (1/2/3/4/5) ¶, % * | 0.0/1.0/7.6/35.7/55.7 | 0.1/0.9/7.0/34.7/57.4 | −0.037 |
| Stage (1/2/3/4), % * | 58.4/10.1/11.8/19.7 | 59.3/11.8/9.5/19.4 | 0.032 |
| Liver (C220), N | 3666 | 3666 | |
| Gender (male/female), % * | 70.8/29.1 | 70.5/29.5 | −0.008 |
| Age (median:IQR §) | 71.5 (64.4:77.4) | 71.6 (63.9:77.7) | −0.010 |
| Period of diagnosis (1/2/3/4/5) ¶, % * | 0.2/0.8/5.7/35.7/57.6 | 0.0/0.4/3.3/38.3/58.0 | −0.062 |
| Stage (1/2/3/4), % * | 40.5/27.8/22.2/9.5 | 41.5/28.8/19.4/10.4 | 0.020 |
| Pancreas (C250/259), N | 3442 | 3442 | |
| Gender (male/female), % * | 57.0/43.0 | 57.8/42.2 | 0.018 |
| Age (median:IQR §) | 69.6 (63.0:75.8) | 69.0 (62.6:75.8) | 0.012 |
| Period of diagnosis (1/2/3/4/5) ¶, % * | 0.0/0.0/4.2/35.0/60.7 | 0/0.4/4.9/30.7/63.9 | −0.030 |
| Stage (1/2/3/4), % * | 5.8/20.1/21.3/52.8 | 8.9/18.3/17.0/55.8 | 0.013 |
| Colon (C180/189), N | 9493 | 9493 | |
| Gender (male/female), % * | 54.6/45.4 | 52.2/44.8 | 0.012 |
| Age (median:IQR §) | 70.9 (63.1:77.7) | 70.9 (63.3:77.8) | −0.006 |
| Period of diagnosis (1/2/3/4/5) ¶, % * | 0.2/1.5/6.4/36.7/55.3 | 0.0/0.6/7.3/35.7/56.4 | −0.035 |
| Stage (1/2/3/4), % * | 30.0/19.4/31.1/19.3 | 29.0/22.7/27.6/20.7 | −0.006 |
| Breast (C500/509), N | 9694 | 9694 | |
| Gender (male/female), % * | 0.3/99.7 | 0.3/99.7 | −0.004 |
| Age (median:IQR §) | 57.3 (47.1:67.1) | 57.1 (47.4:66.9) | −0.001 |
| Period of diagnosis (1/2/3/4/5) ¶, % * | 0.0/0.5/5.5/34.9/59.1 | 0.2/1.6/6.7/28.2/63.3 | −0.002 |
| Stage (1/2/3/4), % * | 44.9/38.9/10.6/5.6 | 44.8/39.8/9.6/5.7 | 0.006 |
| Lung (C340/349), N | 12,373 | 12,373 | |
| Gender (male/female), % * | 68.0/32.0 | 68.9/31.1 | 0.020 |
| Age (median:IQR §) | 70.5 (63.6:76.5) | 70.5 (63.7:76.7) | −0.014 |
| Period of diagnosis (1/2/3/4/5) ¶, % * | 0.0/0.5/6.7/36.4/56.4 | 0.1/0.8/7.5/30.6/61.0 | −0.048 |
| Stage (1/2/3/4), % * | 37.4/8.7/21.4/32.5 | 0.0/0.5/6.7/36.4/56.4 | 0.000 |
| 5 Year Survival Rate (%) | Hazard Ratio | |||||
|---|---|---|---|---|---|---|
| Cancer Category * | High Volume | Other Volumes | Crude HR | 95%CI | Adjusted HR ** | 95%CI |
| Prostate (C619) | ||||||
| PSM | ||||||
| All | 87.2 | 83.7 | 0.83 | 0.76–0.90 | 0.84 | 0.77–0.91 |
| 1990–2005 | 86.0 | 83.4 | 0.63 | 0.29–1.36 | 0.71 | 0.33–1.54 |
| 2006–2013 | 89.9 | 84.2 | 0.83 | 0.76–0.90 | 0.84 | 0.77–0.91 |
| Stage | ||||||
| Stage 1/operation | 95.1 | 94.0 | 0.66 | 0.38–1.15 | 0.77 | 0.46–1.35 |
| Stages 2+3/treatment | 95.4 | 93.4 | 0.70 | 0.52–0.95 | 0.98 | 0.72–1.34 |
| Stage 4/chemotherapy | 32.7 | 34.0 | 0.97 | 0.73–1.29 | 1.00 | 0.75–1.34 |
| Multiple imputation | - | - | 0.84 | 0.76–0.91 | 0.85 | 0.78–0.92 |
| Kidney (C649) | ||||||
| PSM | ||||||
| All | 74.4 | 69.9 | 0.81 | 0.71–0.94 | 0.79 | 0.69–0.92 |
| 1990–2005 | 58.1 | 58.6 | 1.06 | 0.54–2.09 | 1.12 | 0.46–2.73 |
| 2006–2013 | 74.8 | 70.0 | 0.81 | 0.70–0.88 | 0.94 | 0.66–0.89 |
| Stage | ||||||
| Stage 1/operation | 91.4 | 85.5 | 0.56 | 0.43–0.74 | 0.81 | 0.68–0.95 |
| Stages 2+3/treatment | 69.9 | 73.4 | 1.14 | 0.81–1.62 | 0.81–1.62 | 0.87–1.76 |
| Stage 4/chemotherapy | 11.8 | 10.1 | 0.86 | 0.67–1.10 | 0.91 | 0.72–1.17 |
| Multiple imputation | - | - | 0.79 | 0.69–0.91 | 0.81 | 0.71–0.94 |
| Bladder (C670/679) | ||||||
| PSM | ||||||
| All | 53.6 | 51.9 | 0.94 | 0.83–1.06 | 0.95 | 0.85–1.08 |
| 1990–2005 | 53.5 | 51.1 | 2.08 | 0.52–8.34 | 0.61 | 0.09–3.87 |
| 2006–2013 | 62.5 | 79.3 | 0.92 | 0.82–1.04 | 0.95 | 0.84–1.08 |
| Stage | ||||||
| Stage 1/operation | 69.2 | 71.0 | 1.06 | 0.88–1.29 | 1.00 | 0.83–1.22 |
| Stages 2+3/treatment | 48.4 | 50.1 | 1.07 | 0.91–1.26 | 1.04 | 0.89–1.23 |
| Stage 4/chemotherapy | 12.4 | 12.2 | 0.88 | 0.66–1.19 | 0.89 | 0.67–1.20 |
| Multiple imputation | - | - | 0.94 | 0.83–1.06 | 0.95 | 0.84–1.08 |
| Esophagus (C150/159) | ||||||
| PSM | ||||||
| All | 36.8 | 30.1 | 0.82 | 0.77–0.87 | 0.79 | 0.74–0.85 |
| 1990–2005 | 36.5 | 25.5 | 0.63 | 0.50–0.81 | 0.71 | 0.56–0.90 |
| 2006–2013 | 40.8 | 30.7 | 0.83 | 0.78–0.89 | 0.81 | 0.75–0.86 |
| Stage | ||||||
| Stage 1/operation | 77.5 | 70.8 | 0.71 | 0.57–0.88 | 0.75 | 0.59–0.94 |
| Stages 2+3/treatment | 31.8 | 23.5 | 0.78 | 0.71–0.85 | 0.83 | 0.76–0.91 |
| Stage 4/chemotherapy | 10.2 | 7.1 | 0.83 | 0.74–0.93 | 0.85 | 0.75–0.95 |
| Multiple imputation | - | - | 0.82 | 0.77–0.88 | 0.79 | 0.75–0.85 |
| Stomach (C160/169) | ||||||
| PSM | ||||||
| All | 57.8 | 52.4 | 0.83 | 0.79–0.86 | 0.76 | 0.74–0.79 |
| 1990–2005 | 57.7 | 50.7 | 0.76 | 0.67–0.86 | 0.82 | 0.72–0.93 |
| 2006–2013 | 59.1 | 52.6 | 0.84 | 0.80–0.88 | 0.76 | 0.73–0.79 |
| Stage | ||||||
| Stage 1/operation | 86.8 | 80.2 | 0.62 | 0.57–0.69 | 0.69 | 0.64–0.77 |
| Stages 2+3/treatment | 48.0 | 37.5 | 0.71 | 0.64–0.78 | 0.80 | 0.73–0.88 |
| Stage 4/chemotherapy | 36.4 | 24.8 | 0.78 | 0.72–0.84 | 0.78 | 0.72–0.84 |
| Multiple imputation | - | - | 0.83 | 0.79–0.86 | 0.76 | 0.74–0.79 |
| Liver (C220) | ||||||
| PSM | ||||||
| All | 35.2 | 30.7 | 0.85 | 0.79–0.89 | 0.83 | 0.78–0.88 |
| 1990–2005 | 33.9 | 29.5 | 1.17 | 0.86–1.61 | 1.16 | 0.84–1.60 |
| 2006–2013 | 57.0 | 50.6 | 0.85 | 0.79–0.90 | 0.82 | 0.77–0.87 |
| Stage | ||||||
| Stage 1/operation | 54.2 | 45.6 | 0.76 | 0.66–0.88 | 0.80 | 0.69–0.93 |
| Stages 2+3/treatment | 29.7 | 24.6 | 0.82 | 0.76–0.90 | 0.90 | 0.83–0.98 |
| Stage 4/chemotherapy | 8.7 | 5.6 | 0.83 | 0.86–1.02 | 1.05 | 0.86–1.29 |
| Multiple imputation | - | - | 0.84 | 0.81–0.90 | 0.83 | 0.78–0.88 |
| Pancreas (C250/259) | ||||||
| PSM | ||||||
| All | 6.3 | 5.5 | 0.86 | 0.81–0.90 | 0.81–0.90 | 0.81–0.90 |
| 1990–2005 | 2.0 | 2.3 | 1.02 | 0.81–1.28 | 0.90 | 0.71–1.13 |
| 2006–2013 | 6.3 | 5.2 | 0.84 | 0.81–0.89 | 0.84 | 0.79–0.88 |
| Stage | ||||||
| Stage 1/operation | 5.0 | 3.0 | 0.58 | 0.44–0.79 | 0.67 | 0.48–0.89 |
| Stages 2+3/treatment | 0.96 | 0.84 | 0.82 | 0.75–0.88 | 0.84 | 0.78–0.91 |
| Stage 4/chemotherapy | 0.03 | 0.03 | 0.93 | 0.86–1.00 | 0.95 | 0.89–1.03 |
| Multiple imputation | - | - | 0.85 | 0.82–0.89 | 0.84 | 0.79–0.88 |
| Colon (C180/189) | ||||||
| PSM | ||||||
| All | 63.6 | 58.8 | 0.86 | 0.82–0.92 | 0.85 | 0.81–0.90 |
| 1990–2005 | 62.1 | 58.5 | 0.82 | 0.69–0.97 | 0.88 | 0.84–1.05 |
| 2006–2013 | 64.6 | 62.1 | 0.87 | 0.83–0.91 | 0.85 | 0.81–0.89 |
| Stage | ||||||
| Stage 1/operation | 84.8 | 81.5 | 0.78 | 0.68–0.91 | 0.89 | 0.77–1.02 |
| Stages 2+3/treatment | 70.3 | 65.8 | 0.75 | 0.69–0.81 | 0.80 | 0.74–0.88 |
| Stage 4/chemotherapy | 14.3 | 14.6 | 0.94 | 0.86–1.03 | 0.96 | 0.88–1.05 |
| Multiple imputation | - | - | 0.87 | 0.83–0.91 | 0.86 | 0.82–0.90 |
| Breast (C500/509) | ||||||
| PSM | ||||||
| All | 88.2 | 86.5 | 0.83 | 0.76–0.92 | 0.83 | 0.76–0.92 |
| 1990–2005 | 84.9 | 86.4 | 1.18 | 0.89–1.56 | 1.21 | 0.90–1.63 |
| 2006–2013 | 88.6 | 87.3 | 0.81 | 0.73–0.89 | 0.85 | 0.74–0.89 |
| Stage | ||||||
| Stage 1/operation | 96.7 | 95.1 | 0.65 | 0.51–0.82 | 0.84 | 0.66–1.06 |
| Stages 2+3/treatment | 88.9 | 84.4 | 0.68 | 0.61–0.77 | 0.79 | 0.71–0.90 |
| Stage 4/chemotherapy | 31.5 | 29.5 | 0.86 | 0.73–1.02 | 0.87 | 0.73–1.03 |
| Multiple imputation | - | - | 0.83 | 0.76–0.92 | 0.84 | 0.76–0.92 |
| Lung (C340/349) | ||||||
| PSM | ||||||
| All | 33.9 | 28.6 | 0.85 | 0.82–0.87 | 0.84 | 0.81–0.87 |
| 1990–2005 | 28.6 | 21.2 | 0.79 | 0.72–0.88 | 0.90 | 0.82–0.99 |
| 2006–2013 | 34.5 | 29.5 | 0.85 | 0.82–0.88 | 0.83 | 0.81–0.86 |
| Stage | ||||||
| Stage 1/operation | 77.5 | 70.2 | 0.72 | 0.65–0.79 | 0.78 | 0.70–0.87 |
| Stages 2+3/treatment | 28.5 | 20.4 | 0.77 | 0.72–0.81 | 0.80 | 0.75–0.85 |
| Stage 4/chemotherapy | 5.5 | 4.8 | 0.87 | 0.83–0.92 | 0.89 | 0.85–0.95 |
| Multiple imputation | - | - | 0.84 | 0.81–0.87 | 0.84 | 0.82–0.87 |
Disclaimer/Publisher’s Note: The statements, opinions and data contained in all publications are solely those of the individual author(s) and contributor(s) and not of MDPI and/or the editor(s). MDPI and/or the editor(s) disclaim responsibility for any injury to people or property resulting from any ideas, methods, instructions or products referred to in the content. |
© 2022 by the authors. Licensee MDPI, Basel, Switzerland. This article is an open access article distributed under the terms and conditions of the Creative Commons Attribution (CC BY) license (https://creativecommons.org/licenses/by/4.0/).
Share and Cite
Sato, Y.; Kaneko, R.; Yano, Y.; Kamada, K.; Kishimoto, Y.; Ikehara, T.; Sato, Y.; Matsuda, T.; Igarashi, Y. Volume–Outcome Relationship in Cancer Survival Rates: Analysis of a Regional Population-Based Cancer Registry in Japan. Healthcare 2023, 11, 16. https://doi.org/10.3390/healthcare11010016
Sato Y, Kaneko R, Yano Y, Kamada K, Kishimoto Y, Ikehara T, Sato Y, Matsuda T, Igarashi Y. Volume–Outcome Relationship in Cancer Survival Rates: Analysis of a Regional Population-Based Cancer Registry in Japan. Healthcare. 2023; 11(1):16. https://doi.org/10.3390/healthcare11010016
Chicago/Turabian StyleSato, Yoichiro, Rena Kaneko, Yuichiro Yano, Kentaro Kamada, Yuui Kishimoto, Takashi Ikehara, Yuzuru Sato, Takahisa Matsuda, and Yoshinori Igarashi. 2023. "Volume–Outcome Relationship in Cancer Survival Rates: Analysis of a Regional Population-Based Cancer Registry in Japan" Healthcare 11, no. 1: 16. https://doi.org/10.3390/healthcare11010016