Article

A Panel-Agnostic Strategy ‘HiPPo’ Improves Diagnostic Efficiency in the UK Genomic Medicine Service

1
Human Development and Health, Faculty of Medicine, University Hospital Southampton, Southampton SO16 6YD, Hampshire, UK
2
Program in Medical and Population Genetics, Broad Institute of MIT and Harvard, Cambridge, MA 02142, USA
3
Division of Genetics and Genomics, Boston Children’s Hospital, Boston, MA 02115, USA
4
Paediatric Infectious Diseases, Imperial College London, London W2 1NY, UK
5
Wessex Regional Genomics Laboratory, Salisbury NHS Foundation Trust, Salisbury SP2 8BJ, UK
6
Center for Genomic Medicine, Massachusetts General Hospital, Boston, MA 02114, USA
*
Author to whom correspondence should be addressed.
These authors contributed equally to this work.
Healthcare 2023, 11(24), 3179; https://doi.org/10.3390/healthcare11243179
Submission received: 5 November 2023 / Revised: 12 December 2023 / Accepted: 13 December 2023 / Published: 15 December 2023
(This article belongs to the Section Health Informatics and Big Data)

Abstract

:
Genome sequencing is available as a clinical test in the UK through the Genomic Medicine Service (GMS). The GMS analytical strategy predominantly filters genome data on preselected gene panels. Whilst this reduces variants requiring assessment by reporting laboratories, pathogenic variants outside applied panels may be missed, and variants in genes without established disease–gene relationships are largely ignored. This study compares the analysis of a research exome to a GMS clinical genome for the same patients. For the research exome, we applied a panel-agnostic approach filtering for variants with High Pathogenic Potential (HiPPo) using ClinVar, allele frequency, and in silico prediction tools. We then restricted HiPPo variants to Gene Curation Coalition (GenCC) disease genes. These results were compared with the GMS genome panel-based approach. Twenty-four participants from eight families underwent parallel research exome and GMS genome sequencing. Exome HiPPo analysis identified a similar number of variants as the GMS panel-based approach. GMS genome analysis returned two pathogenic variants and one de novo variant. Exome HiPPo analysis returned the same variants plus an additional pathogenic variant and three further de novo variants in novel genes, where case series are underway. When HiPPo was restricted to GenCC disease genes, statistically fewer variants required assessment to identify more pathogenic variants than reported by the GMS, giving a diagnostic rate per variant assessed of 20% for HiPPo versus 3% for the GMS. With UK plans to sequence 5 million genomes, strategies are needed to optimise genome analysis beyond gene panels whilst minimising the burden of variants requiring clinical assessment.

1. Introduction

Genome sequencing is now available as a diagnostic test on the National Health Service (NHS) in the UK, offered through their Genomic Medicine Service (GMS). With the cost of genome sequencing becoming ever-competitive, genome sequencing is beginning to supersede exome sequencing in some institutes, including in the NHS [1]. However, one of the challenges in diagnosing patients with rare diseases is the expanded scope of analysis and the need to correlate results with phenotype [2]. Genome sequencing produces 3–4 million variants per individual; therefore, strategies to reduce noise and focus on the most salient regions of DNA have been adopted, including the use of virtual gene panels [3,4]. For the NHS, this is their primary analytical strategy, meaning that despite sequencing and storing an entire genome, only a fraction of the genome is actually analysed. Consequently, this risks missing pathogenic variants that would have been identified if more regions of the genome had been assessed.
All that said, there remains a trade-off between utilising the breadth of sequencing data available (such as for a genome) and the number of variants that require assessment by clinical laboratories. Filtering is necessary to reduce the number of variants identified to a manageable number that NHS laboratories can analyse, classify with respect to pathogenicity, and interpret with respect to the causality of the patient’s symptoms in a reasonable and acceptable timeframe.
The GMS, which primarily sequences trios, adopts a workflow similar to that used in the 100,000 Genomes Project, which predated the GMS [1,5]. First, the data are filtered by inheritance pattern(s), data quality, and allele frequency. Following this, the remaining variants are filtered by a gene panel(s) selected by the clinician when the test is ordered, meaning that only coding regions are considered. Short variants and copy number variants (CNVs) overlapping the gene panel are returned for analysis (“Tiered variants”). The only variants mandated to be assessed outside of the gene panel(s) are ‘gene-agnostic variants’ comprising de novo coding variants and Exomiser [6] top three ranked variants, which are not filtered on quality (Figure 1).
In contrast to genome sequencing, exome sequencing targets only coding regions of DNA. However, most variants filtered in the GMS strategy (Tier 1, Tier 2, and gene-agnostic variants) would be captured by an exome. Given the method limitations of exome sequencing, genomes offer better coverage (even for coding regions) than exomes do and are far superior for identifying CNVs and other structural variants [7]. All that said, genome data are costly to store and process computationally, and this should be considered alongside the benefits to having access of noncoding data, particularly if those data are mostly ignored.
Pane- based approaches that restrict analyses to clinically relevant genes clearly have merit, yet 26% of diagnoses made through the 100,000 Genomes Project were not on the original gene panel applied [8]. Therefore, complementary approaches that look beyond gene panels are warranted. However, this must be balanced with the potential of increasing the number of variants that require assessment by reporting laboratories. Currently, the GMS assess every variant that is in a ‘green’ gene in the PanelApp [4] gene panel applied, regardless of in silico predictions. Metrics such as CADD [9], REVEL [10], and SpliceAI [11] can help reduce noise, facilitating the assessment of variants across a wider spectrum of genes without too much additional burden. We sought to exploit this principle by adopting a panel agnostic approach that filters variants of High Pathogenic Potential (HiPPo) across the exome by utilising in silico prediction scores, allele frequency, and ClinVar [12] (Figure 2).
This study compares two different filtering approaches: one applied to exome sequencing data performed in a research setting, and another applied to genome sequencing performed on the same patients through the GMS in a clinical setting. To exome data, we apply a gene-agnostic approach, HiPPo, and compare the diagnostic yield of this approach with the strategy applied by the GMS. We aim to improve upon both the efficiency and diagnostic rates of current GMS standards whilst trying to minimise the number of variants requiring assessment by clinical laboratories.

2. Methods

2.1. Recruitment and Patient Demographics

Clinical geneticists at University Hospital Southampton were invited to recruit patients and families with suspected monogenic disease to a research study ‘Use of NGS technologies for resolving clinical phenotypes’ (IRAS: 212945; REC: 17/YH/0069). Recruited individuals were eligible for a research exome through the Center for Mendelian Genomics [13] at the Broad Institute.
Twenty-five individuals from eight families recruited and consented to the research exome study were also recruited for genome sequencing on the NHS through the GMS, facilitating a parallel comparison study (Figure 3) and providing an opportunity to evaluate these two sequencing and analysis strategies. All participants consented to their data being shared.
For the research exome study, patient phenotypes were extracted by a single researcher from the clinical notes and recorded as Human Phenotype Ontology (HPO) terms in a manually encrypted database. The patients’ clinicians also separately recorded HPO terms when requesting the GMS genome sequencing test. Both clinicians and researchers were blinded to each other’s curated HPO terms. The family structures of the 8 families (7 trios and a quad), individual IDs, and phenotypes are described in Table 1.

2.2. Research Exome Sequencing and Pipeline

Following quality control of the DNA from the 25 samples, the mother (FAM_4_12) in the family comprising a quad of parents and monozygotic twins (FAM_4) had insufficient DNA quality, and we were unable to obtain a repeat sample in time for inclusion in the research exome portion of this study. However, this participant had genome sequencing through the GMS. In the GMS, quads are sequenced as two separate trios. Therefore, family FAM_4 was exome sequenced without maternal data (father, twin A, twin B) for the research portion of the study but was genome-sequenced through the GMS as two separate trios (mother, father, twin A) and (mother, father, twin B).
A total of 24 samples from 8 families met the quality standards necessary for research exome sequencing at the Broad Institute (Supplementary Table S1). Libraries from DNA samples were created with an Illumina exome capture (37 Mb target) and sequenced on a NovaSeq 6000 machine using the NovaSeq XP workflow to cover >85% of targets at >20×, comparable to ~55× mean coverage. The samples underwent QC as previously described and were processed through the GATK best practices pipeline [14]. The samples were joint-called with >15,000 other samples and added to seqr v1.0 [15] (https://seqr.broadinstitute.org), an exome/genome analysis software hosted on the cloud platform Terra (https://app.terra.bio).

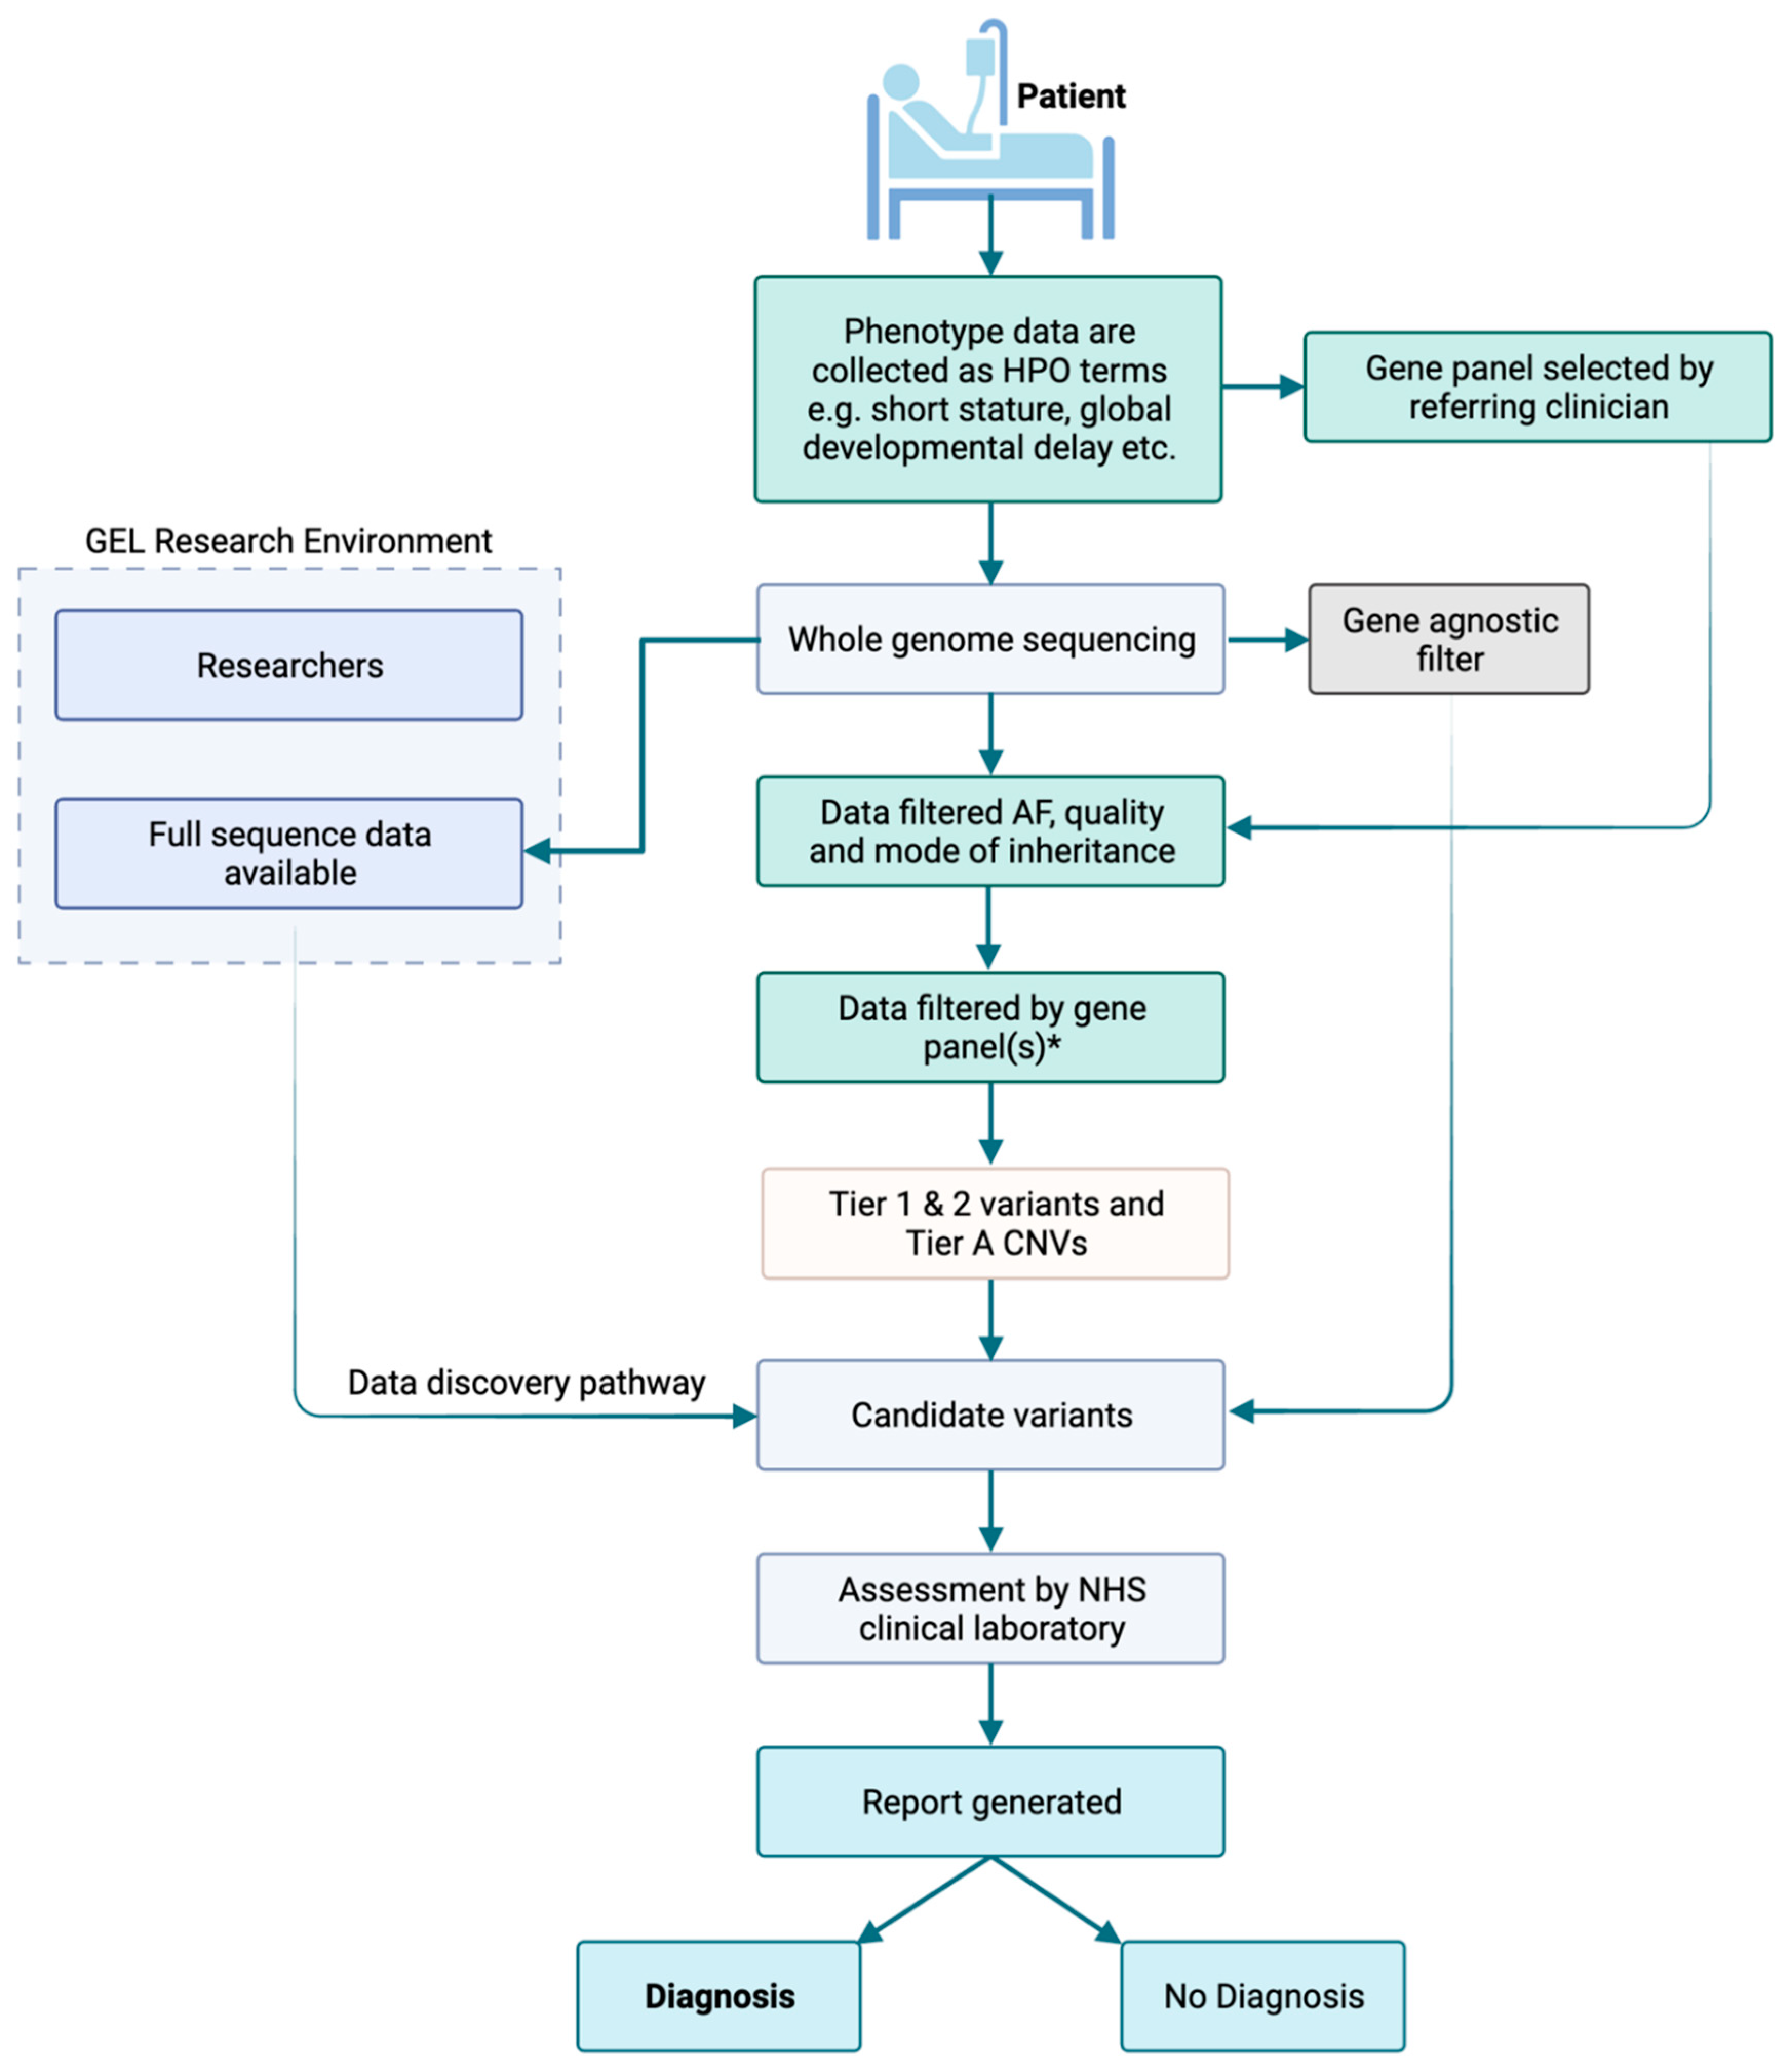
2.3. Genomic Medicine Service Pipeline

In total, 25 patients in 8 families were consented for GMS clinical genome sequencing; however, as one family (FAM_4) comprised a quad, the parents were sequenced with each child as two independent trios. Sequencing was performed on an Illumina NovaSeq 6000 machine, with ≥95% of the autosomal genome covered at ≥15× calculated from reads with mapping quality >10 and >85 × 109 bases with Q ≥ 30, after removing duplicate reads and overlapping bases after adaptor and quality trimming. Cross-sample contamination was checked using VerifyBamID, and samples with >3% contamination failed QC. Sequencing alignment was performed using the DRAGEN aligner, with ALT-aware mapping and variant calling to improve specificity. Detection of small variants (single-nucleotide variants (SNVs) and indels) and CNVs were performed using the DRAGEN small variant caller and DRAGEN CNV, respectively. Short tandem repeat expansions were detected using ExpansionHunter (v2.5.6) as part of the DRAGEN software. The DRAGEN software v3.2.22 was used for alignment and variant calling, and structural variants were detected using Manta (v1.5).

2.4. Data Analysis

Different filtering strategies were applied to the research exome and the GMS genome data (Table 2). The research exome adopted the HiPPo strategy, and the GMS adopted a panel-based approach. The research filtering strategy collates and filters more information than the GMS approach. The GMS does not consider cohort allele frequency, ClinVar status or in silico metrics in its filtering strategy (Table 2).

2.5. Research Exome Analysis

For the research exome, each family was analysed as a unit to utilise segregation data. We applied the same de novo/dominant and recessive filtering strategies to all families, applying a gene-agnostic filtering strategy by selecting variants with the highest pathogenic potential (HiPPo) using allele frequency, in silico prediction scores, and ClinVar (Table 2). We later restricted the HiPPo strategy to GenCC [16] genes with a definitive or strong disease association.

2.6. Reporting on Exome Variants

Variants remaining following HiPPo filtering were reviewed in seqr [15] using a wealth of inbuilt annotations. Variants that did not meet any of the below exclusion criteria were considered ‘reportable’ and returned to the referring clinician following the application of ACMG-AMP guidelines [17]. Because the exome data were obtained in a research setting, we were able to include novel discoveries which would not meet diagnostic criteria in a clinical setting. Any novel discoveries were discussed with the referring clinician before submission to the Matchmaker Exchange (MME) [18,19,20].
Exclusion criteria:
1.
The variant was heterozygous in a known autosomal recessive disease gene, and no second hit (coding or noncoding) was identified;
2.
The variant was found in a disease gene and was not associated with the phenotype presented by the patient, as assessed using OMIM [21], GenCC [16] and the medical literature and the variant is not likely pathogenic/pathogenic in ClinVar [12];
3.
The variant is in a known disease gene, but that gene is poorly expressed, as indicated in GTEx [22], in the tissue relevant to the patient’s phenotype or in an exon of the gene with poor expression, as determined by the per base expression metric, pext [23];
4.
The variant was in a novel gene (currently unassociated with disease), and the gene is poorly expressed in the relevant disease tissue, as indicated in GTEx [22], or the gene is explicitly not involved in the relevant biological pathway, as evidenced in Monarch [24];
5.
A predicted loss-of-function (LoF) variant as called by Variant Effect Predictor [25] that was deemed as ‘not LoF’ or ‘likely not LoF’ after application of LoF manual curation guidance, as recommended by Karczewski et al. [26];
6.
The variant appeared artefactual upon visualisation of the read data in Integrative Genomics Viewer (IGV) [27].

2.7. Taking Novel Exome Candidates forward

Where the referring clinician agreed, candidate variants in novel genes were submitted by the researcher to MME, sharing anonymised genotype and phenotype data. Any potential matches were discussed in detail with the patient’s clinician, and explicit consent was obtained from the participants prior to joining the case series.

2.8. GMS Clinical Genome Analysis Pipeline

Variants called through the GMS pipeline were prefiltered on mode of inheritance, quality, and allele frequency. These variants were then restricted to ‘green’ genes on the preselected PanelApp [4] gene panels for review (Table 2). A complementary gene-agnostic filter was also applied to the data, which included all de novo variants and Exomiser [6] top 3 ranked coding variants (of any quality). Variants passing filtering were returned to the Wessex Regional Genetics Laboratory for reporting.

2.9. Reporting of GMS Genome Variants

GMS variant classification was carried out according to the ACMG/AMP guidelines with ACGS [28] modifications. This included an assessment of the gene-phenotype match based on the HPO [29] terms supplied. Variants in genes with no known disease association (determined using OMIM [21], HGMDPro, ClinGen [30] and PanelApp [4]) were discounted and not assessed. Classified variants were reported according to standard ACMG/AMP guidelines, i.e., pathogenic and likely pathogenic variants were always reported, and variants of uncertain significance (VUS) were only reported if there was significant evidence for pathogenicity and/or with the prior agreement of the clinician following a multidisciplinary team discussion (typically via email).

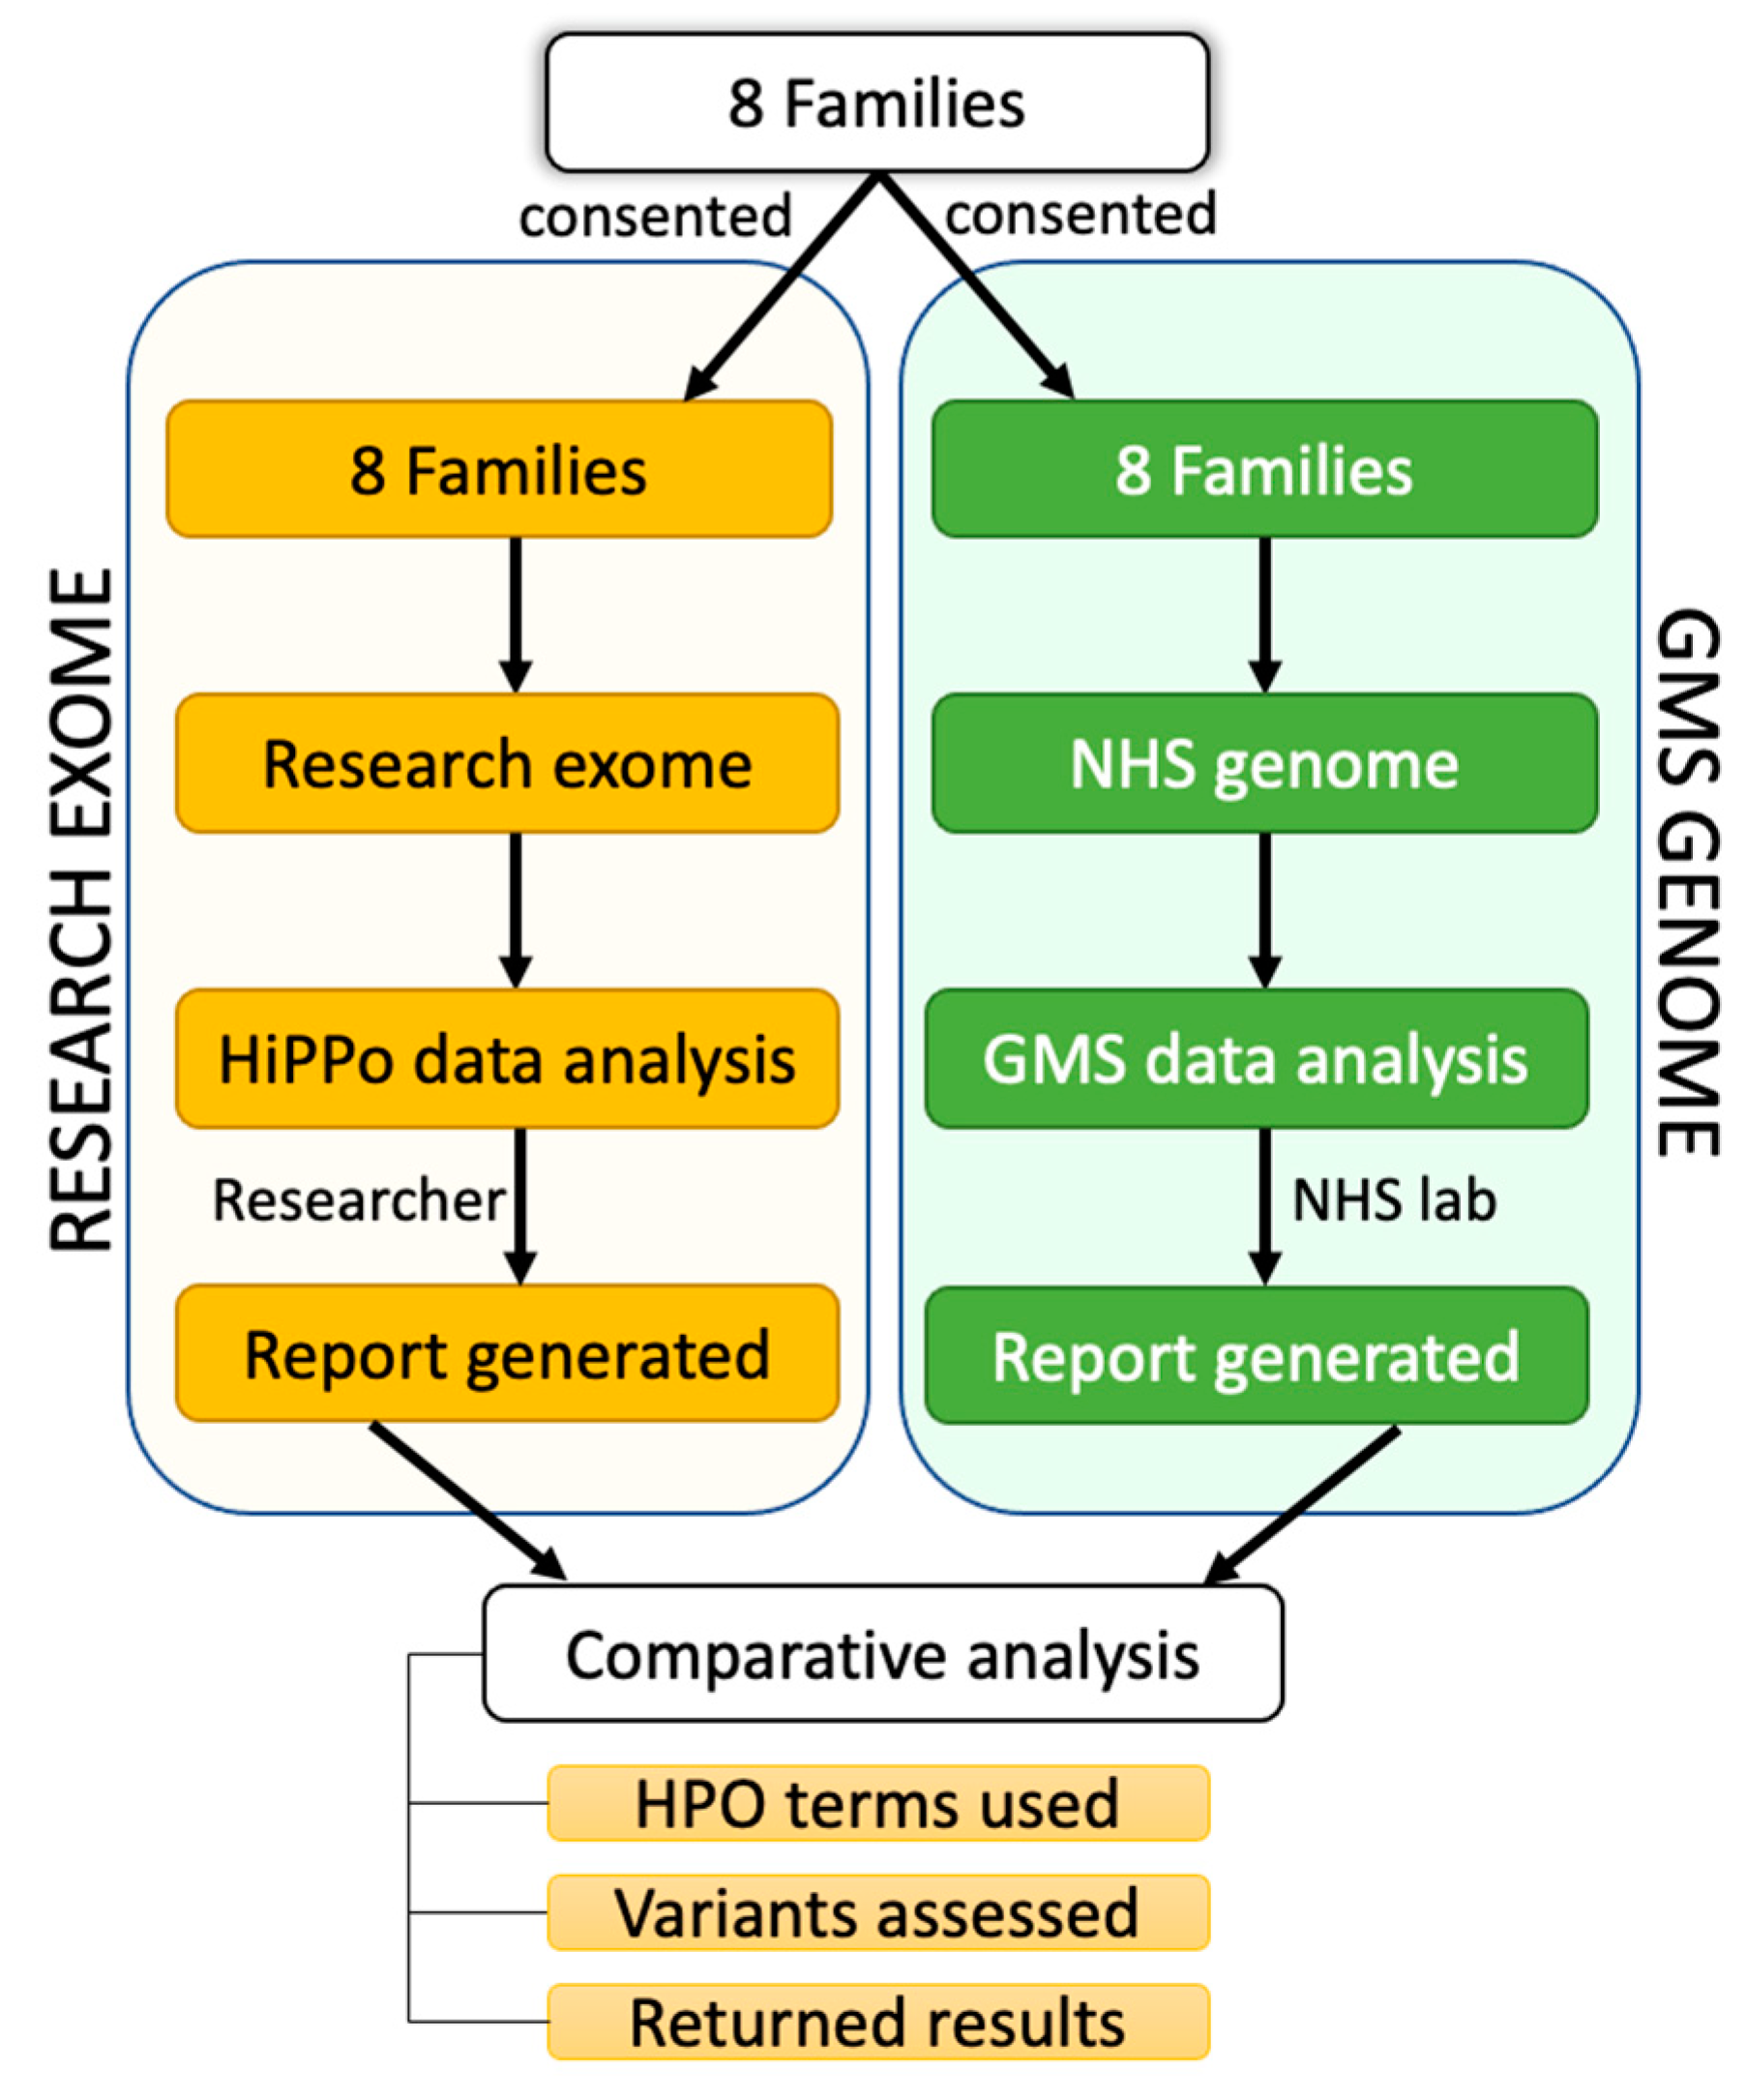
2.10. Comparison of Two Filtering Approaches

We compared the diagnostic yield and the number of variants requiring assessment after variant filtering for both the research exome HiPPo approach (which included novel discoveries) and GMS clinical genome panel-based approach, which was restricted to reporting variants that met diagnostic standards only. Specifically, we counted the number of variants passing HiPPo filtering criteria in the research exome study and compared these with the number of Tier 1 and 2 variants for the same patients’ GMS genome results, in addition to the ‘gene agnostic’ variants (de novo and Exomiser [6] Top 3 hits) as provided in an anonymised spreadsheet by the Wessex Regional Genetics Laboratory. We omitted CNVs since these were not assessed in the exome data, and no diagnoses were made from structural variants in the GMS clinical genome data. We then compared the variants reported from the research exome with the variants interpreted and reported by the NHS on the patient’s GMS genome report. For the GMS, the reporting threshold is high with novel genes and nearly all VUS not reported. However as part of the GMS, patients have their deidentified data deposited into a genomics library for researchers to access. Therefore, to test the efficiency of the methods applied, we calculated the diagnostic rate per number of variants assessed across the cohort.

3. Results

3.1. GMS Clinical Genome Analysis Strategy

In the eight families who underwent GMS clinical genome sequencing, a total of 77 single-nucleotide and indel variants were returned for analysis as ‘Tiered variants’, including the gene-agnostic variants (Exomiser and de novo variants). A further 108 CNVs passed filtering. Five variants in total from four patients were included in the final reports issued by the NHS: two diagnoses, one variant of uncertain significance, and compound heterozygous variants (pathogenic and VUS); all five reported variants were also identified by HiPPo in the research exome (Table 3).

3.2. Research Exome HiPPo Strategy

HiPPo identified a total of 109 variants (Supplementary Table S2) from eight families (eight trios) passing filtering criteria as outlined in Table 2. However, one family, FAM_4, comprising a mother, father and monozygotic twins, was sequenced as a trio (father, twin A and twin B) in the research exome study as there was insufficient maternal DNA. For the genome performed through the GMS, there was available maternal DNA, and thus, the twin daughters were sequenced as separate trios, with the parents sequenced twice in accordance with GMS policy. This meant more variants were identified in the research exome than the GMS genome (68 vs. 11, respectively) for this family, given that no maternal DNA was available for segregation analysis in the exome.
Of the 109 variants identified by HiPPo across the eight families, 38 variants were in genes reported as definitive or strong evidence for disease association, as classified by GenCC.
In addition to the two pathogenic variants identified by the GMS and deemed causal, HiPPo identified a further pathogenic variant in a known disease gene (ABCC8), representing a partial diagnosis that was filtered out by the GMS strategy due to not being on the chosen gene panel. HiPPo also identified compound heterozygous variants in a known disease gene, INTS1, in participant FAM_2_4, which is known to cause an autosomal recessive neurodevelopmental disorder with cataracts, poor growth, and dysmorphic facies (MIM: 618571). These variants were discounted by the GMS as weak VUS with limited evidence but remain under review by the clinical team.
HiPPo detected a further six VUS in five novel (currently unassociated with disease) genes, in addition to the same compound heterozygous variants in SDCCAG8 and the VUS in HMGB1 reported by the GMS (Table 3). In total, the research exome identified 109 variants using HiPPo, of which 38/109 (34.9%) were in GenCC disease genes. After the application of exclusion criteria to all HiPPo variants, independent of GenCC disease status, a total of 14 variants from the research exome were curated against ACMG/AMP criteria and returned, as shown in Table 4.
On average, more HPO terms were recorded in the research exome study compared to the GMS genome (Table 1 and Figure 4) although this was not statistically significant (p-value = 0.1, Wilcox signed rank test).
When comparing the eight families who underwent parallel research exome and GMS clinical genome sequencing, we removed one family (FAM_4) from analysis as the mother was not sequenced in the research study but was sequenced by the GMS. There was no statistical difference between the number of variants (excluding CNVs) assessed by the GMS panel-based strategy and the HiPPo method (p-value = 0.35, Wilcoxon signed rank test), although HiPPo identified more reportable variants (Table 4), of which six variants in five unique genes were taken forward as candidates to MME. Three of these variants were identified but discounted by the GMS as disease gene discovery is outside of the remit of clinical reporting. However, when restricting the HiPPo analysis to GenCC strong and definitive genes, there was a statistical difference between groups (p-value = 0.022, Wilcoxon signed rank test), with the research study assessing fewer variants overall (Figure 4) yet still identifying an additional pathogenic variant in ABCC8 that did not pass filtering thresholds by the GMS.

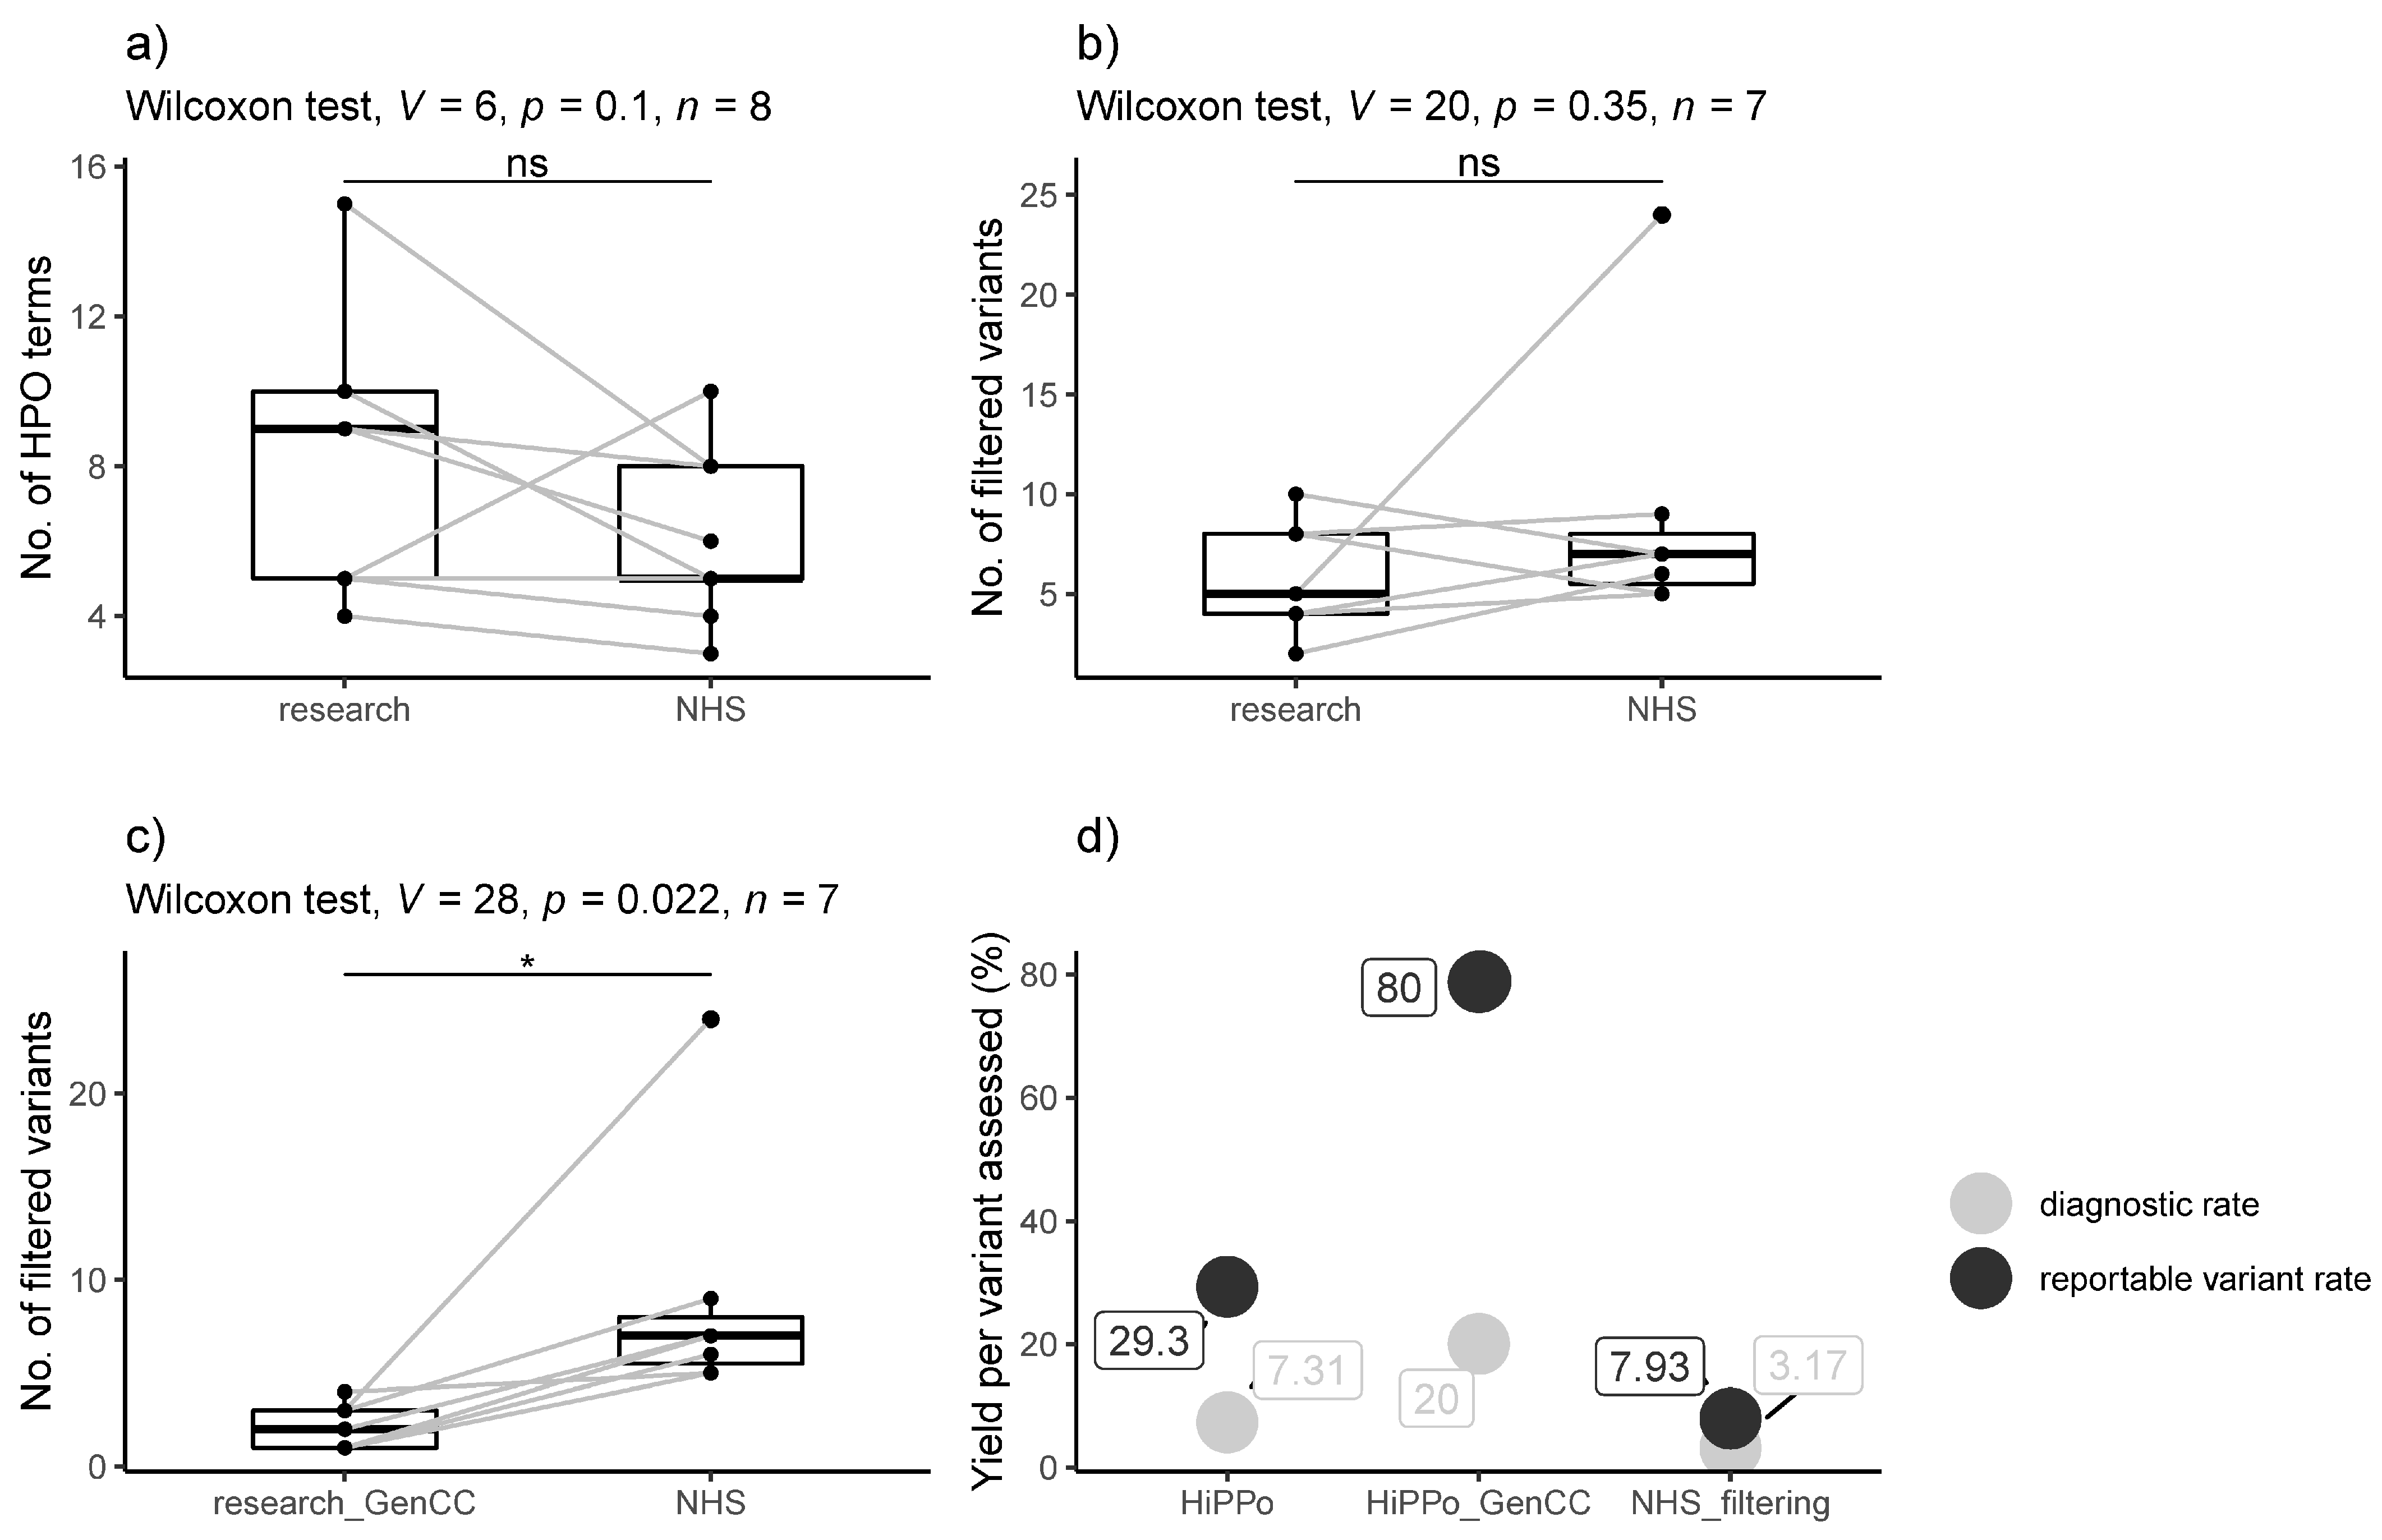
3.3. Comparison between Exome Study and GMS Clinical Genome Results

Table 3 (7.31%) compared with the panel-based GMS strategy (2/63 (3.17%)), although the result was not significant (p-value = 0.39, Fisher’s exact test). When limiting HiPPo analysis to GenCC disease genes, the diagnostic rate per variant assessed improved further to 3/15 (20%) (Figure 4); p-value = 0.06. The reportable variant rate per number of variants assessed was higher for the HiPPo approach when limited to GenCC disease genes (12/15 (80.0%)) compared with the panel-based GMS strategy (5/63 (7.93%)).

4. Discussion

Genome sequencing is available as a clinical test on the NHS through the GMS. Following sequencing, data are filtered by a preselected gene panel chosen by the referring clinician, in addition to CNVs overlapping the panel applied, de novo variants, and Exomiser [6] top three ranked variants. This predominantly ‘panel-based’ approach attempts to minimise noise and efficiently identify pathogenic variants in disease-relevant genes.
However, panel-based strategies are not without limitations. PanelApp [4] is open source, but gene reviews and updates of the approved gene content rely on volunteer efforts and come with a significant lag time. Panels represent a snapshot in time, and their application is contingent on clinicians selecting the optimal gene panel(s) with variable levels of genetics training. This is particularly problematic for clinicians in nongenetics specialities lacking adequate familiarity with gene panel selection. If the “wrong” panel is chosen, pathogenic variants can easily be missed. With only 20% of rare disease patients receiving a diagnosis through the 100,000 Genomes Project [1] (the precursor to the UK’s GMS), there is a clear need to investigate variants beyond a limited gene list but without significantly increasing the number of variants for review.
This study compares the GMS’ data analysis filtering strategy using genome sequencing to a gene-agnostic HiPPo approach targeting variants with high pathogenic potential as applied to exome sequencing in a research setting. Twenty-four individuals from eight families underwent parallel clinical genome and research exome sequencing, providing an opportunity to compare different filtering approaches. With many factors influencing differences between the research and NHS studies, such as different technical pipelines, targeted capture, and timescales, the fairest comparison of the efficiency of the two approaches was the number of variants that required review following filtering and the corresponding diagnostic rates. On average, the research exome study reviewed fewer variants than the GMS, yet it identified more diagnostic variants, although this was not statistically significant (p-value = 0.35). The number of reportable variants per variant assessed was higher for HiPPo (29.3%) versus the GMS (7.9%). However, the threshold for what constituted a reportable variant differed between the research exome and the GMS genome strategies. The research exome reported on variants that would not be reportable in the current NHS setting, notably variants in novel disease genes and variants of uncertain significance, although it is worth noting that some international diagnostic labs do report variants in novel genes. However, when restricting the exome HiPPo filtering approach to GenCC disease genes (genes strongly associated with disease that would be reportable in the NHS setting), statistically fewer variants required assessment when compared with the GMS’ panel-based approach (Wilcoxon signed rank p-value = 0.022). Despite this, more pathogenic variants were identified, including a pathogenic variant in ABCC8 representing a partial diagnosis, which was missed by the GMS as it was not on the selected gene panel. For the eight families undergoing parallel exome and genome sequencing, the GenCC disease gene HiPPo analysis strategy identified 15 variants that required further assessment, compared with 41 variants for the GMS approach. Overall, the diagnostic rate per number of variants assessed between the GenCC disease gene HiPPo analysis and the GMS’ panel-based approach was 3/15 (20%) vs. 2/63 (3%), respectively. Although our sample size is modest, there is a strong argument that genotype-to-phenotype methods focused on variants with high pathogenic potential in known disease genes could prove more effective and less resource-intensive than panel-based approaches despite covering a wider range of the genome. Indeed, in the GMS, very few Tier 2 variants are actually reported, meaning that Tier 1 + HiPPo may be an efficient alternative strategy and could also be used to prioritise the interpretation of gene-agnostic variants and/or determine which should be reported and/or taken to multidisciplinary team meetings. There is also a further argument that genome sequencing is not being optimally utilised by the NHS due to resource limitations and that exome sequencing may prove similarly effective; however, this comparison is beyond the scope of this limited study, whereby no pathogenic CNVs were identified, and a time-cost analysis could not be fairly undertaken.
The number of HPO terms did not vary significantly between those selected for the research study versus those submitted by clinicians working in the NHS (p-value = 0.1) (Table 1). A recent study by Kingsmore et al. [31] showed that more HPO terms may not increase diagnostic yield but a more focused list of key terms may support analysis more effectively.
In total, HiPPo identified three diagnoses (compared with two diagnoses by the GMS) and a further 10 unique variants of interest in seven unique genes, of which three genes were discounted by the GMS (Table 4) as they did not meet the threshold for clinical reporting. In FAM_2_4, HiPPo identified compound heterozygous variants in INTS1 (7:1480876G:C and 7:1497193:C:G), a disease gene associated with an autosomal recessive disorder (MIM: 618571) presenting with cataracts, poor growth, developmental delay, and dysmorphic facies. Whilst FAM_2_4 shares some features with the INTS1-related syndrome, he does not have cataracts and is large (with his weight tracking along the 99th percentile) as opposed to being small. These variants are being reviewed by his clinical team.
In FAM_8_23, both HiPPo and the GMS identified compound heterozygous variants (one pathogenic and one VUS) in SDCCAG8 (1:243341070:TG:T and 1:243378799:A:G), a disease gene associated with an autosomal recessive retinal-renal ciliopathy (MIM: 615993 and MIM: 613615). These variants have been discussed at length with the clinical team and are not felt to explain the nephrotic phenotype. On renal biopsy, the patient had immature glomerular development diffuse foot process effacement on electron microscopy, which is inconsistent with a retinal-renal ciliopathy. Furthermore, there were additional inconsistent features, including microcephaly, cerebellopontine hypoplasia and functional asplenia. In the same individual, we identified a de novo variant in ZNF91. Through MME, we are collaborating with a group performing functional studies on this gene, whereby they also have a patient with microcephaly and nephrotic syndrome.
In total, we submitted six variants in five novel genes to MME from the exome study, which is beyond the remit of the NHS diagnostic capacity. We had no matches for PKD1L3 and FOXB2. In addition to ZNF91 (as described above in FAM_9_26), we matched with collaborators working on HMGB1 (de novo variant found in FAM_1_1) and ADGRB2 (de novo variant found in monozygotic twin sisters FAM_4_13 and FAM_4_10). In 2021, a paper was published on HMGB1-predicted loss-of-function variants in six patients [32]. Common features included developmental delay, language delay, microcephaly, obesity and dysmorphic features, some of which overlap with FAM_1_1. This variant has been returned to the patient’s clinician, and we have put them directly in touch with the authors of the 2021 paper [32] for an ongoing collaboration. Whilst the HMGB1 variant was also reported as a VUS through the GMS, there is no time provision for clinicians to consider and follow-up on any unreported novel candidates. Furthermore, most de novo candidates in novel genes are disregarded by the GMS and so are seldom investigated further. That said, anonymised patient data are eventually deposited in the Genomics England Research Environment, meaning that novel variants may be identified and later investigated through research.
In 2017, a paper was published in Human Mutation describing a missense variant in ADGRB2 in a patient presenting with developmental delay and progressive spastic paraparesis, features shared with identical twins FAM_4_13 and FAM_4_10 harbouring a de novo pLoF in the same gene [33]. The authors showed that their specific variant demonstrated a gain in function. We have contacted the authors of the paper and are now directly working with them to model our variant in vitro and in vivo.

Limitations

This study is small, representing 25 individuals from eight families, of which 24 participants received parallel exome and genome sequencing, enabling us to compare two different filtering strategies. Inevitably, a larger study is needed to test the value of gene-agnostic approaches utilising pathogenicity scores compared with gene panel approaches. This is not currently possible within the NHS as we do not have routine access to data that would enable a direct comparison, such as the clinical panels selected for scrutiny, the tiered variants returned to the diagnostic laboratories, or the final clinical report. For the current study, this was only possible because we had local patient research consent to access these specific data from the GMS systems. We are mindful that we compared an exome with a genome, however, QC was excellent, and the panel-based strategy of the GMS essentially limits data analysis to exonic regions. We were further mindful that the two arms of the study used different technical pipelines, i.e., DRAGEN vs. GATK and tool versions may further contribute to differences in the performance of filtering strategies.
Data analysed in a research setting are not comparable with data analysed for diagnostic purposes as the threshold for variant follow-up and investigation differs in a clinical setting, with inconsistency in reporting on novel discoveries. It is important not to conflate a potential novel discovery identified in the research setting with a ‘missed’ diagnosis. That said, the research exome picked up a pathogenic variant missed by the GMS due to being outside the applied gene panels.
Our study was further biased by predominantly neurodevelopmental phenotypes due to the nature of intellectual disability (ID) being overrepresented in referrals for GMS genome sequencing. The biggest bias with ID is enrichment for de novo variants in this type of disorder, although both the GMS filtering approach and HiPPo assess de novo variants, so we would not expect the performance to change drastically.
No pathogenic variants were identified by GMS clinical genome sequencing that was not captured by the research exome, although a larger sample size is needed to test the diagnostic uplift gained from structural variants detected using genome sequencing versus potential missed diagnoses from using panel-based approaches.

5. Conclusions

This study compared a gene-agnostic filtering strategy called HiPPo as applied to research exome data with a gene panel-based analysis strategy applied to genome sequencing data. Despite HiPPo being pan-exomic, a similar number of variants were assessed per patient to the panel-based strategy of the GMS and more variants of interest were identified; this includes a pathogenic variant in ACDCC8 and de novo variants in three novel genes, whereby case series and functional experiments are underway, which highlights the added potential that research studies can offer. When restricting HiPPo to GenCC disease genes, statistically fewer variants required assessment to identify the same diagnoses as identified by the GMS (20% vs. 3%, respectively), representing a greater diagnostic yield per variant assessed. This preliminary work suggests that panel-based approaches are limited and that they could be improved by incorporating specific variant prioritisation metrics. Despite the limited sample size, we believe our study is an invaluable first step in demonstrating proof of concept that alternative analytical strategies have value for genome sequencing within the NHS.

Supplementary Materials

The following supporting information can be downloaded at https://www.mdpi.com/article/10.3390/healthcare11243179/s1, Table S1: DNA concentration and volume available for samples consented for research exome sequencing. Table S2: All HiPPo filtered variants following research exome sequencing of 27 individuals in 9 families.

Author Contributions

Conceptualization, E.G.S., D.H. and S.E.; Methodology, E.G.S. and N.S.T.; Software, E.G.S.; Formal analysis, E.G.S. and N.S.T.; Investigation, N.S.T., D.H., A.O.-L. and S.E.; Resources, D.H.; Data curation, E.G.S.; Writing—original draft, E.G.S.; Writing—review & editing, E.G.S., N.S.T., D.H., D.B., H.L.R., A.O.-L. and S.E.; Supervision, D.B., H.L.R., A.O.-L. and S.E. All authors have read and agreed to the published version of the manuscript.

Funding

E.G.S. was supported by the Kerkut Charitable Trust, Foulkes Fellowship, and University of Southampton’s Presidential Scholarship Award; H.L.R. and A.O’.D.-L. and sequencing were supported by the National Human Genome Research Institute (NHGRI) grant U01HG011755 as part of the GREGoR consortium and HR by NHGRI R01HG009141. D.B. was generously supported by a National Institute of Health Research (NIHR) Research Professorship RP-2016-07-011. The sponsor for the study is University Hospital of Southampton NHS Foundation Trust (Protocol number: RHM NEU0302).

Institutional Review Board Statement

The Ethics Committee of Yorkshire and The Humber—Leeds East Research Ethics Committee gave ethical approval for this work on 12th May 2017. Research Ethics Committee reference number: 17/YH/0069.

Informed Consent Statement

Study participants were recruited to the study ‘Use of NGS technologies for resolving clinical phenotypes’ (IRAS: 212945). All patients consented for the data herein to be shared.

Data Availability Statement

Data are contained within the article and Supplementary Materials.

Conflicts of Interest

The authors declare no conflict of interest.

References

  1. 100,000 Genomes Project Pilot Investigators. 100,000 Genomes Pilot on Rare-Disease Diagnosis in Health Care—Preliminary Report. N. Engl. J. Med. 2021, 385, 1868–1880. [Google Scholar] [CrossRef]
  2. Seaby, E.G.; Ennis, S. Challenges in the diagnosis and discovery of rare genetic disorders using contemporary sequencing technologies. Brief. Funct. Genom. 2020, 19, 243–258. [Google Scholar] [CrossRef]
  3. Seaby, E.G.; Smedley, D.; Taylor Tavares, A.L.; Brittain, H.; van Jaarsveld, R.H.; Baralle, D.; Rehm, H.L.; O’Donnell-Luria, A.; Ennis, S.; Genomics England Research Consortium. A gene-to-patient approach uplifts novel disease gene discovery and identifies 18 putative novel disease genes. Genet. Med. 2022, 24, 1697–1707. [Google Scholar] [CrossRef]
  4. Martin, A.R.; Williams, E.; Foulger, R.E.; Leigh, S.; Daugherty, L.C.; Niblock, O.; Leong, I.U.; Smith, K.R.; Gerasimenko, O.; Haraldsdottir, E.; et al. PanelApp crowdsources expert knowledge to establish consensus diagnostic gene panels. Nat. Genet. 2019, 51, 1560–1565. [Google Scholar] [CrossRef]
  5. Turnbull, C.; Scott, R.H.; Thomas, E.; Jones, L.; Murugaesu, N.; Pretty, F.B.; Halai, D.; Baple, E.; Craig, C.; Hamblin, A.; et al. The 100,000 Genomes Project: Bringing whole genome sequencing to the NHS. BMJ 2018, 361, k1687. [Google Scholar] [CrossRef]
  6. Smedley, D.; Jacobsen, J.O.; Jäger, M.; Köhler, S.; Holtgrewe, M.; Schubach, M.; Siragusa, E.; Zemojtel, T.; Buske, O.J.; Washington, N.L.; et al. Next-generation diagnostics and disease-gene discovery with the Exomiser. Nat. Protoc. 2015, 10, 2004–2015. [Google Scholar] [CrossRef]
  7. Lelieveld, S.H.; Spielmann, M.; Mundlos, S.; Veltman, J.A.; Gilissen, C. Comparison of exome and genome sequencing technologies for the complete capture of protein-coding regions. Hum. Mutat. 2015, 36, 815–822. [Google Scholar] [CrossRef]
  8. Rehm, H.L. Time to make rare disease diagnosis accessible to all. Nat. Med. 2022, 28, 241–242. [Google Scholar] [CrossRef] [PubMed]
  9. Kircher, M.; Witten, D.M.; Jain, P.; O’Roak, B.J.; Cooper, G.M.; Shendure, J. A general framework for estimating the relative pathogenicity of human genetic variants. Nat. Genet. 2014, 46, 310–315. [Google Scholar] [CrossRef] [PubMed]
  10. Ioannidis, N.M.; Rothstein, J.H.; Pejaver, V.; Middha, S.; McDonnell, S.K.; Baheti, S.; Musolf, A.; Li, Q.; Holzinger, E.; Karyadi, D.; et al. REVEL: An ensemble method for predicting the pathogenicity of rare missense variants. Am. J. Hum. Genet. 2016, 99, 877–885. [Google Scholar] [CrossRef] [PubMed]
  11. Jaganathan, K.; Panagiotopoulou, S.K.; McRae, J.F.; Darbandi, S.F.; Knowles, D.; Li, Y.I.; Kosmicki, J.A.; Arbelaez, J.; Cui, W.; Schwartz, G.B.; et al. Predicting splicing from primary sequence with deep learning. Cell 2019, 176, 535–548.e24. [Google Scholar] [CrossRef]
  12. Landrum, M.J.; Lee, J.M.; Riley, G.R.; Jang, W.; Rubinstein, W.S.; Church, D.M.; Maglott, D.R. ClinVar: Public archive of relationships among sequence variation and human phenotype. Nucleic Acids Res. 2014, 42, D980–D985. [Google Scholar] [CrossRef] [PubMed]
  13. Bamshad, M.J.; Shendure, J.A.; Valle, D.; Hamosh, A.; Lupski, J.R.; Gibbs, R.A.; Boerwinkle, E.; Lifton, R.P.; Gerstein, M.; Gunel, M.; et al. The Centers for Mendelian Genomics: A new large-scale initiative to identify the genes underlying rare Mendelian conditions. Am. J. Med. Genet. Part A 2012, 158, 1523–1525. [Google Scholar] [CrossRef] [PubMed]
  14. McKenna, A.; Hanna, M.; Banks, E.; Sivachenko, A.; Cibulskis, K.; Kernytsky, A.; Garimella, K.; Altshuler, D.; Gabriel, S.; Daly, M.; et al. The Genome Analysis Toolkit: A MapReduce framework for analyzing next-generation DNA sequencing data. Genome Res. 2010, 20, 1297–1303. [Google Scholar] [CrossRef]
  15. Pais, L.S.; Snow, H.; Weisburd, B.; Zhang, S.; Baxter, S.M.; DiTroia, S.; O’Heir, E.; England, E.; Chao, K.R.; Lemire, G.; et al. seqr: A web-based analysis and collaboration tool for rare disease genomics. Hum. Mutat. 2022, 43, 698–707. [Google Scholar] [CrossRef]
  16. DiStefano, M.T.; Goehringer, S.; Babb, L.; Alkuraya, F.S.; Amberger, J.; Amin, M.; Austin-Tse, C.; Balzotti, M.; Berg, J.S.; Birney, E.; et al. The Gene Curation Coalition: A global effort to harmonize gene-disease evidence resources. Genet. Med. 2022, 24, 1732–1742. [Google Scholar] [CrossRef]
  17. Richards, S.; Aziz, N.; Bale, S.; Bick, D.; Das, S.; Gastier-Foster, J.; Grody, W.W.; Hegde, M.; Lyon, E.; Spector, E.; et al. Standards and guidelines for the interpretation of sequence variants: A joint consensus recommendation of the American College of Medical Genetics and Genomics and the Association for Molecular Pathology. Genet. Med. 2015, 17, 405–424. [Google Scholar] [CrossRef] [PubMed]
  18. Azzariti, D.R.; Hamosh, A. Genomic Data Sharing for Novel Mendelian Disease Gene Discovery: The Matchmaker Exchange. Annu. Rev. Genom. Hum. Genet. 2020, 21, 305–326. [Google Scholar] [CrossRef]
  19. Philippakis, A.A.; Azzariti, D.R.; Beltran, S.; Brookes, A.J.; Brownstein, C.A.; Brudno, M.; Brunner, H.G.; Buske, O.J.; Carey, K.; Doll, C.; et al. The Matchmaker Exchange: A platform for rare disease gene discovery. Hum. Mutat. 2015, 36, 915–921. [Google Scholar] [CrossRef]
  20. Buske, O.J.; Schiettecatte, F.; Hutton, B.; Dumitriu, S.; Misyura, A.; Huang, L.; Hartley, T.; Girdea, M.; Sobreira, N.; Mungall, C.; et al. The Matchmaker Exchange API: Automating patient matching through the exchange of structured phenotypic and genotypic profiles. Hum. Mutat. 2015, 36, 922–927. [Google Scholar] [CrossRef]
  21. Amberger, J.S.; Bocchini, C.A.; Schiettecatte, F.; Scott, A.F.; Hamosh, A. OMIM.org: Online Mendelian Inheritance in Man (OMIM®), an online catalog of human genes and genetic disorders. Nucleic Acids Res. 2015, 43, D789–D798. [Google Scholar] [CrossRef]
  22. Lonsdale, J.; Thomas, J.; Salvatore, M.; Phillips, R.; Lo, E.; Shad, S.; Hasz, R.; Walters, G.; Garcia, F.; Young, N.; et al. The genotype-tissue expression (GTEx) project. Nat. Genet. 2013, 45, 580–585. [Google Scholar] [CrossRef]
  23. Cummings, B.B.; Karczewski, K.J.; Kosmicki, J.A.; Seaby, E.G.; Watts, N.A.; Singer-Berk, M.; Mudge, J.M.; Karjalainen, J.; Kyle Satterstrom, F.; O’Donnell-Luria, A.; et al. Transcript expression-aware annotation improves rare variant discovery and interpretation. bioRxiv 2019. bioRxiv:554444. [Google Scholar]
  24. Mungall, C.J.; McMurry, J.A.; Köhler, S.; Balhoff, J.P.; Borromeo, C.; Brush, M.; Carbon, S.; Conlin, T.; Dunn, N.; Engelstad, M.; et al. The Monarch Initiative: An integrative data and analytic platform connecting phenotypes to genotypes across species. Nucleic Acids Res. 2017, 45, D712–D722. [Google Scholar] [CrossRef]
  25. McLaren, W.; Gil, L.; Hunt, S.E.; Riat, H.S.; Ritchie, G.R.; Thormann, A.; Flicek, P.; Cunningham, F. The ensembl variant effect predictor. Genome Biol. 2016, 17, 122. [Google Scholar] [CrossRef]
  26. Karczewski, K.J.; Francioli, L.C.; Tiao, G.; Cummings, B.B.; Alföldi, J.; Wang, Q.; Collins, R.L.; Laricchia, K.M.; Ganna, A.; Birnbaum, D.P.; et al. The mutational constraint spectrum quantified from variation in 141,456 humans. Nature 2020, 581, 434–443. [Google Scholar] [CrossRef]
  27. Robinson, J.T.; Thorvaldsdóttir, H.; Winckler, W.; Guttman, M.; Lander, E.S.; Getz, G.; Mesirov, J.P. Integrative genomics viewer. Nat. Biotechnol. 2011, 29, 24–26. [Google Scholar] [CrossRef]
  28. Ellard, S.; Baple, E.L.; Forrester, N.; Turnbull, C.; Owens, M.; Eccles, D.M.; Abbs, S.; Scott, R.; Deans, Z.C. ACGS best practice guidelines for variant classification 2019. ACGS Guidel. 2019, 1, 32. [Google Scholar]
  29. Robinson, P.N.; Köhler, S.; Bauer, S.; Seelow, D.; Horn, D.; Mundlos, S. The Human Phenotype Ontology: A tool for annotating and analyzing human hereditary disease. Am. J. Hum. Genet. 2008, 83, 610–615. [Google Scholar] [CrossRef] [PubMed]
  30. Rehm, H.L.; Berg, J.S.; Brooks, L.D.; Bustamante, C.D.; Evans, J.P.; Landrum, M.J.; Ledbetter, D.H.; Maglott, D.R.; Martin, C.L.; Nussbaum, R.L.; et al. ClinGen—The clinical genome resource. N. Engl. J. Med. 2015, 372, 2235–2242. [Google Scholar] [CrossRef] [PubMed]
  31. Peterson, B.D.; Hernandez, E.J.; Hobbs, C.; Jenkins, S.M.; Moore, M.B.; Juarez, E.R.; Zoucha, S.; Sanford, E.; Bainbridge, M.N.; Frise, E.; et al. Automated Prioritization of Sick Newborns for Rapid Whole Genome Sequencing Using Clinical Natural Language Processing and Machine Learning. Genome Med. 2022, 15, 18. [Google Scholar] [CrossRef]
  32. Uguen, K.; Krysiak, K.; Audebert-Bellanger, S.; Redon, S.; Benech, C.; Viora-Dupont, E.; Tran Mau-Them, F.; Rondeau, S.; Elsharkawi, I.; Granadillo, J.L.; et al. Heterozygous HMGB1 loss-of-function variants are associated with developmental delay and microcephaly. Clin. Genet. 2021, 100, 386–395. [Google Scholar] [CrossRef]
  33. Purcell, R.H.; Toro, C.; Gahl, W.A.; Hall, R.A. A disease-associated mutation in the adhesion GPCR BAI2 (ADGRB2) increases receptor signaling activity. Hum. Mutat. 2017, 38, 1751–1760. [Google Scholar] [CrossRef]
Figure 1. Genomic Medicine Service workflow for genome sequencing on the NHS. Tier 1 variants are defined as predicted loss-of-function variants or de novo variants in a green gene on the PanelApp gene panel(s) applied. Tier 2 variants are defined as coding variants +/− 8 bp (excluding synonymous) on any transcript in the panel applied. Synonymous variants affecting splicing are ignored. The gene-agnostic filter includes top three Exomiser rank variant with score of ≥0.95 and any de novo (coding) variant. Tier A is defined by a CNV (>10 KB) overlapping a ClinGen curated pathogenic region relevant to a panel applied or a CNV overlapping with a green gene in the panel applied. Anonymised sequencing data are available for some patients in the Genomics England (GEL) Research Environment. * Gene panels are selected using GEL PanelApp by the referring clinician.
Healthcare 11 03179 g001
Figure 2. A proposed method for improving diagnostic yield and efficiency. Comparison of the current NHS approach versus our proposed method HiPPo for an example case (FAM 6). Variants are identified by comparing a patient’s DNA against a human genome reference. In this example, there is a pathogenic variant (dashed circle) within the identified list of variants. To minimise the number of variants assessed, the NHS has adopted a method (A) that looks at small regions of the DNA (a panel of genes) and assesses the variants within that region. If the causal variant is in a region of the DNA not assessed, then the diagnosis is missed. Our revised approach (B) captures a larger region of DNA (including all genes) but only looks at variants predicted to be damaging or submitted as P/LP to ClinVar (black circle). As a result, a larger area of DNA is assessed whilst assessing fewer variants overall. This aims to result in a higher diagnostic rate per number of variants assessed despite analysing a larger region of the genome than typically applied in a gene panel.
Healthcare 11 03179 g002
Figure 3. Overview of patient recruitment and analysis. Eight families were recruited for parallel GMS clinical genome sequencing and research exome sequencing. Different data analysis strategies were applied to the exome (HiPPo) vs. genome sequencing data (adopting a panel-based strategy as outlined by the GMS). Variants reported were compared between analysis strategies, including the Human Phenotype Ontology (HPO) terms used, number of variants assessed, and results reported.
Healthcare 11 03179 g003
Figure 4. Comparison of results between the research exome and clinical genome (NHS) sequencing. (a) Number of HPO terms recorded between the exome and genome studies. (b) Number of variants assessed by the NHS reporting laboratory following GMS genome sequencing versus number of variants passing HiPPo filtering (in any gene) in the exome study. (c) Number of variants assessed by the NHS reporting laboratory following GMS genome sequencing versus the number of filtered HiPPo variants in GenCC disease genes assessed by the exome study. (d) Plot showing the diagnostic rate per variant assessed and the reported variant rate per variant assessed for the HiPPo research approach, HiPPo restricted to GenCC disease genes approach, and the GMS panel-based filtering strategy. * p < 0.05.
Healthcare 11 03179 g004
Table 1. Samples and phenotypes of patients recruited for a parallel research exome and NHS genome.
SamplesClinical Data
Fam_IDPro_IDPat_IDMat_IDSib_IDAgeSexWES Phenotype—HPO Terms Identified from Clinical NotesWGS Phenotype—HPO Terms Identified by ClinicianWGS—Gene Panel Applied
FAM_1123 0–5MGastroesophageal reflux, Myopia, Delayed eruption of primary teeth, Triangular face, Prominent forehead, Cow milk allergy, Egg allergy, Nut food product allergy, Sacral dimple, Clinodactyly of the 5th finger, Short 5th toe, 2–3 toe syndactyly, Mild global developmental delay, Delayed speech and language development, OligohydramniosGlobal developmental delay, Delayed speech and language development, Triangular face, Prominent forehead, Feeding difficulties, Delayed gross motor development, Oligohydramnios, Delayed eruption of primary teeth.Intellectual disability (R.29.4), Congenital malformation and dysmorphism syndromes (R27.3), Skeletal dysplasia (R104.3), Likely inborn error of metabolism (R98.2)
FAM_12 41–45Munaffectedunaffected
FAM_13 41–45Funaffectedunaffected
FAM_2456 6–10MSimple ear, Astigmatism, Obesity, Patchy hypo- and hyperpigmentation, 2–3 toe syndactyly, Short finger, Specific learning disability, Global developmental delay, Intellectual disability, Delayed speech and language developmentChronic otitis media, Obesity, Severe intellectual disability, Autistic behaviour, Global developmental delayIntellectual disability (R.29.4), severe early-onset obesity (R149.1)
FAM_25 31–35Munaffectedunaffected
FAM_26 31–35Funaffectedunaffected
FAM_3789 6–10FLow-set ears, Hypermetropia, Abnormality of the palmar creases, Broad distal phalanges of all fingers, Shallow orbits, Cranial asymmetry, Plagiocephaly, Mild global developmental delay, Intellectual disabilityThin upper lip vermillion, Long philtrum, Downslanted palpebral fissures, Deep palmar crease, Intellectual disability, PlagiocephalyIntellectual disability (R29.4)
FAM_38 61–65Munaffectedunaffected
FAM_39 46–50Funaffectedunaffected
FAM_41011121346–50FDelayed ability to walk, Delayed speech and language development, Spastic paraparesis, Global developmental delayGlobal developmental delay, Intellectual disability, and Spastic paraparesisIntellectual disability (R29.4)
FAM_411 76–80Munaffectedunaffected
FAM_412 76–80Funaffectedunaffected
FAM_413 46–50FDelayed ability to walk, Delayed speech and language development, Seizure, Spastic paraparesis, Global developmental delayDevelopmental delay, Intellectual disability, Spastic paraparesis, and SeizureIntellectual disability (R29.4)
FAM_5141516 0–5FProminent forehead, Low hanging columella, Prominent fingertip pads, Preauricular pit, Hypopigmented macule, Frontal bossing, Flat occiput, Joint hypermobility, Confluent hyperintensity of cerebral white matter on MRI, Mild global developmental delay, PolydipsiaProminent forehead, Moderate global developmental delay, Relative macrocephaly, Anxiety, Low hanging columellaIntellectual disability (R29.4)
FAM_515 26–30Munaffectedunaffected
FAM_516 21–25Funaffectedunaffected
FAM_6171819 0–5FEpicanthic folds, Joint hypermobility, Global developmental delay, Intellectual disability, Increased nuchal translucencyGlobal developmental delay, Increased prenatal nuchal translucency, Short toenails, Epicanthic foldsIntellectual disability (R29.4)
FAM_618 31–35Munaffectedunaffected
FAM_619 31–35Funaffectedunaffected
FAM_7202122 6–10MHypertelorism, Bilateral polymicrogyria, Global developmental delay, Delayed speech and language development, Delayed fine motor development, Delayed gross motor development, Focal seizures, Generalised seizures, Intellectual disabilityFocal seizures, Generalised seizures, Infantile encephalopathy, Polymicrogyria, Delayed speech and language development, Severe intellectual disability, Global developmental delayEarly-onset or syndromic epilepsy (R59.3), Cerebral malformation (R87.3)
FAM_721 36–40Munaffectedunaffected
FAM_722 36–40Funaffectedunaffected
FAM_8232425 0–5 *FMicrophthalmia, Cataract, Retinal dystrophy, Congenital nephrotic syndrome, MicrocephalyIntrauterine growth restriction, Microcephaly, Congenital nephrotic syndrome, Renal failure, Bilateral congenital cataract, Cerebellopontine hypoplasia, Retinal dysfunction, Thrombocytopaenia, Giant platelets, Howell–Jolly bodiesCongenital malformation and dysmorphic syndromes (R27), Structural eye disease (R36), Unexplained paediatric onset end-stage renal disease (R257), Cerebellar anomalies (R84), Severe microcephaly (R88), Proteinuric renal disease (R195)
FAM_824 36–40Funaffectedunaffected
FAM_825 41–45Munaffectedunaffected
Discrepancies between phenotypes underlined in bold. Ages given in age ranges. Fam_ID = Family ID, Mat_ID = Maternal ID, Pat_ID = Paternal ID, Pro_ID = Proband ID, Sib_ID = Sibling ID. All IDs are fully anonymised for publication. * Patient deceased.
Table 2. Filtering criteria for the research exome and NHS genome.
Research Exome HiPPo StrategyNHS Genome Panel-Based Strategy
DominantRecessiveDominantRecessive
InheritanceDe novo/dominant searchRecessive search &De novo/dominant searchRecessive search &
AF (gnomAD exomes, gnomAD genomes, TOPMED *, ExAC, 1000 g)<0.001<0.05<0.001<0.01
Cohort^ AF<0.01<0.01No filter appliedNo filter applied
Variant typeAll coding +/− 20 bp, excluding synonymous, on any transcriptAll coding +/− 20 bp, excluding synonymous, on any transcriptAll coding +/− 8 bp on any transcript, excluding synonymousAll coding +/− 8 bp on any transcript, excluding synonymous
SpliceAI (for splicing variants)>0.2>0.2No filter appliedNo filter applied
CADD (all variants)>15>15No filter appliedNo filter applied
ClinVarRemove benign/likely benignRemove benign/likely benignNo filter appliedNo filter applied
GenesAll genes and later restricted to GenCC definitive and strong genesAll genes and later restricted to GenCC definitive and strong genesGreen in PanelApp Panel(s)Green in PanelApp Panel(s)
Allele balance>0.2>0.2N/AN/A
Genotype Quality>40>40>30>30
QCall variantsall variantspasspass
OtherPathogenic variants in ClinVar retained even if in unaffected parentsN/AIn any gene: Exomiser top 3 rank variant (coding) with score of ≥0.95 or any de novo (coding)In any gene: Exomiser top 3 rank variant (coding) with score of ≥0.95 or any de novo (coding)
SV/CNVNot assessedNot assessedCNV (>10 KB) overlaps a ClinGen curated pathogenic region relevant to a panel applied, or the CNV overlaps with a green gene in the panel applied.CNV (>10 KB) overlaps a ClinGen curated pathogenic region relevant to a panel applied, or the CNV overlaps with a green gene in the panel applied.
Comparison of filtering criteria between the research exome and NHS genome. AF—maximum allele frequency across any population, QC—quality control, N/A—not applicable. * TOPMED allele frequency was only applied to the research exome. ^ Cohort AF is the frequency of any given variant as a frequency of the total number of individuals in that cohort (>15,000 individuals for the research study). & Recessive search includes X-linked recessive disorders.
Table 3. Comparison of variants reported by the research exome sequencing study vs. the GMS genome sequencing.
SamplesResearch ExomeGMS Genome
FamIDProIDReported VariantsStatusNo. HiPPo VariantsNo. HiPPo Variants in GenCC GenesReported VariantsNo. of Variants Passing FilteringDe NovoExomiserAdditional HiPPo VariantsGMS Interpretation of HiPPo Variants
FAM_11VUS: HMGB1: 13:30462666:CT:C; c.342del; p.Gly115GlufsTer37 (frameshift, de novo). Potential new disease gene, submitted to MME. Variant also detected by NHS.83VUS: HMGB1: 13:30462666:CT:C; c.342del; p.Gly115GlufsTer379REST
HMGB1
1. HMGB1
2. KDM4
3. ROBO1
NoneN/A
FAM_24VUS: INTS1: 7:1480876:G:C; c.3908C > G; p.Thr1303Ser (missense). Phenotype partially fitting with disease gene—undergoing clinical review.44No variants reported5None1. KDM5A
2. RPS3A
3. COL16A1
INTS1—VUS × 2INTS1 (Tier 2) discounted as weak evidence
VUS: INTS1: 7:1497193:C:G; c.1547G > C; p.Cys516Ser (missense).
(Variants in trans)
FAM_37Pathogenic: PPP1CB: 2:28776944:C:G; c.146C > G; p.Pro49Arg (missense, de novo).Confirmed diagnosis (also detected by NHS).42Pathogenic: PPP1CB: 2:28776944:C:G; c.146C > G; p.Pro49Arg7MYO7B
PPP1CB
EXOC7
1. PPP1CB
2. SELENBP1
3. EFCAB11
NoneN/A
FAM_410VUS: ADGRB2: 1:31731030:G:A; c.4150C > T; p.Arg1384Ter (de novo, nonsense).Potential new disease gene. Confirmed de novo by Sanger sequencing and in identical twin (FAM_4_13). Functional work underway.6823No variants reported14ADGRB2
CRNN
PCDHB7
NFYB
PIEZO1
1. FBXO46
2. CEP290
3. NFYB
ADGRB2—VUS × 2De novo (ADGRB2) variant
discounted as in novel gene
FAM_413VUS: ADGRB2: 1:31731030:G:A; c.4150C > T; p.Arg1384Ter (de novo, stop gained).The same variant is present in identical twin (FAM_4_10)No variants reported
FAM_514Pathogenic: ABCC8: 11:17413408:G:A; c.2464C > T; p.Gln822Ter (nonsense, inherited from parent) Clinically agreed as partial diagnosis.81No variants reported5GOLGA8T1. PTPRF
2. NPHP4
3. PRKDC
ABCC8PathogenicABCC8 not analysed as untiered and gene absent from R29 panel
FAM_617Pathogenic: CHAMP1: 13:114325034:C:T; c.1192C > T; p.Arg398Ter (de novo, nonsense).Confirmed diagnosis (also detected by NHS).21Pathogenic: CHAMP1: 13:114325034:C:T; c.1192C > T; p.Arg398Ter6KRTAP5-51. CHAMP1
2. MDK
3. CRAC2RA
NoneN/A
FAM_720VUS: FOXB2: 9:77020700:A:G; c.1046A > G; p.Lys349Arg (missense, de novo).
VUS: PKD1L3: 16:71951734:T:G; c.3020A > C; p.Glu1007Ala (missense).
Both FOXB2 and PFK1L3 are potential novel disease genes and have been submitted to MME.101No variants reported7FOXB2
RP1L1
1. IGFN1
2. ZXDA
3. CADNA1F
FOXB2—VUS
PKD1L3—VUS × 2
FOXB2 de novo variant—Discounted
PKD1L3—Not analysed—Tier 3; Exomiser rank 33
VUS: PKD1L3: 16:71951734:T:G; c.3020A > C; p.Glu1007Ala (missense).
PFK1L3 variants are in trans.
FAM_823VUS: ZNF91: 19:23361341:G:C; c.1638C > G; p.Tyr546Ter (de novo, nonsense). ZNF91 is a novel disease gene. A group is working on this gene, and we have joined their case series. The SDCCAG8 variants are in trans but are not felt to fit with the clinical phenotype.53VUS: SDCCAG8: 14:92449109:A > C, c.1552A > G, p.Arg518Gly (missense).
Pathogenic: SDCCAG8: 1:243341070:TG>T, c.1255del, p.Glu419ArgfsTer43 (frameshift).
24ZNF91
ZNF91
1. RIN3
2. ERAP2
3. ZNF91
NoneZNF91 variant discounted as no established disease association
VUS: SDCCAG8: 14:92449109:A > C, c.1552A > G, p.Arg518Gly (missense).
Pathogenic: SDCCAG8: 1:243341070:TG > T, c.1255del, p.Glu419ArgfsTer43 (frameshift).
FamID—Family ID; MME—matchmaker exchange; N/A—not applicable; ProID—Proband ID; VUS—variant of uncertain significance.
Table 4. Details of 14 variants reported by the research exome study meeting prioritisation criteria.
VariantGeneConsequenceGnomadCaddRevelHgvscHgvspClinVarACMGFamIDProbandIDP_ACSample_2S2_ACSample_3S3_ACReturned by GMS?
13:30462666:CT:CHMGB1frameshift038 ENST00000341423.9:c.342delp.Gly115GlufsTer37 VUSFAM_1112030Yes
7:1480876:G:CINTS1missense5.56−423.50.243ENST00000404767.7:c.3908C > Gp.Thr1303Ser VUSFAM_2415160No
7:1497193:C:GINTS1missense7.76−5240.315ENST00000404767.7:c.1547G > Cp.Cys516Ser VUSFAM_2415061No
2:28776944:C:GPPP1CBmissense026.70.438ENST00000395366.2:c.146C > Gp.Pro49ArgPPFAM_3718090Yes
1:31731030:G:AADGRB2stop_gained038 ENST00000373655.6:c.4150C > Tp.Arg1384Ter VUSFAM_4131110131No
1:31731030:G:AADGRB2stop_gained038 ENST00000373655.6:c.4150C > Tp.Arg1384Ter VUSFAM_4101110131No
13:114325034:C:TCHAMP1stop_gained035 ENST00000643483.1:c.1192C > Tp.Arg398TerPPFAM_6171180190Yes
11:17413408:G:AABCC8stop_gained043 ENST00000302539.9:c.2464C > Tp.Gln822Ter LPFAM_5141150191No
16:71951734:T:GPKD1L3missense5.09−423.1 ENST00000620267.1:c.3020A > Cp.Glu1007Ala VUSFAM_7201211220No
16:71973386:C:TPKD1L3missense1.02−422 ENST00000620267.1:c.1891G > Ap.Ala631Thr VUSFAM_7201210221No
9:77020700:A:GFOXB2missense025.30.534ENST00000376708.1:c.1046A > Gp.Lys349Arg VUSFAM_7201210220No
19:23361341:G:CZNF91stop_gained032 ENST00000300619.11:c.1638C > Gp.Tyr546Ter VUSFAM_8231240250No
1:243341070:TG:TSDCCAG8frameshift026 ENST00000366541.7:c.1255delp.Glu419ArgfsTer43 PFAM_8231241250Yes
1:243378799:A:GSDCCAG8missense9.55−522.20.195ENST00000366541.7:c.1552A > Gp.Arg518GlyVUSVUSFAM_8231240251Yes
Families separated by colour. FamID—Family ID; hgvsc—HGVS coding consequence; hgvsp—HGVS protein consequence; LP—likely pathogenic; P—pathogenic; P_AC—proband allele count; S2_AC—sample2 allele count; S3_AC—sample3 allele count; VUS—variant of uncertain significance. Sample_2 and sample_3 refer to parental DNA.
Disclaimer/Publisher’s Note: The statements, opinions and data contained in all publications are solely those of the individual author(s) and contributor(s) and not of MDPI and/or the editor(s). MDPI and/or the editor(s) disclaim responsibility for any injury to people or property resulting from any ideas, methods, instructions or products referred to in the content.

