
Evaluating the Usability of mHealth Apps: An Evaluation Model Based on Task Analysis Methods and Eye Movement Data

Abstract
:1. Introduction
1.1. Background and Motivation
1.2. Related Work
1.2.1. Usability Evaluation in mHealth Apps
1.2.2. Task Analysis Methods
1.2.3. Eye Movement Data Analysis
2. Materials and Methods
2.1. Usability Evaluation Model
2.2. Experiment Design
2.3. Subjects
2.4. Task and Procedure
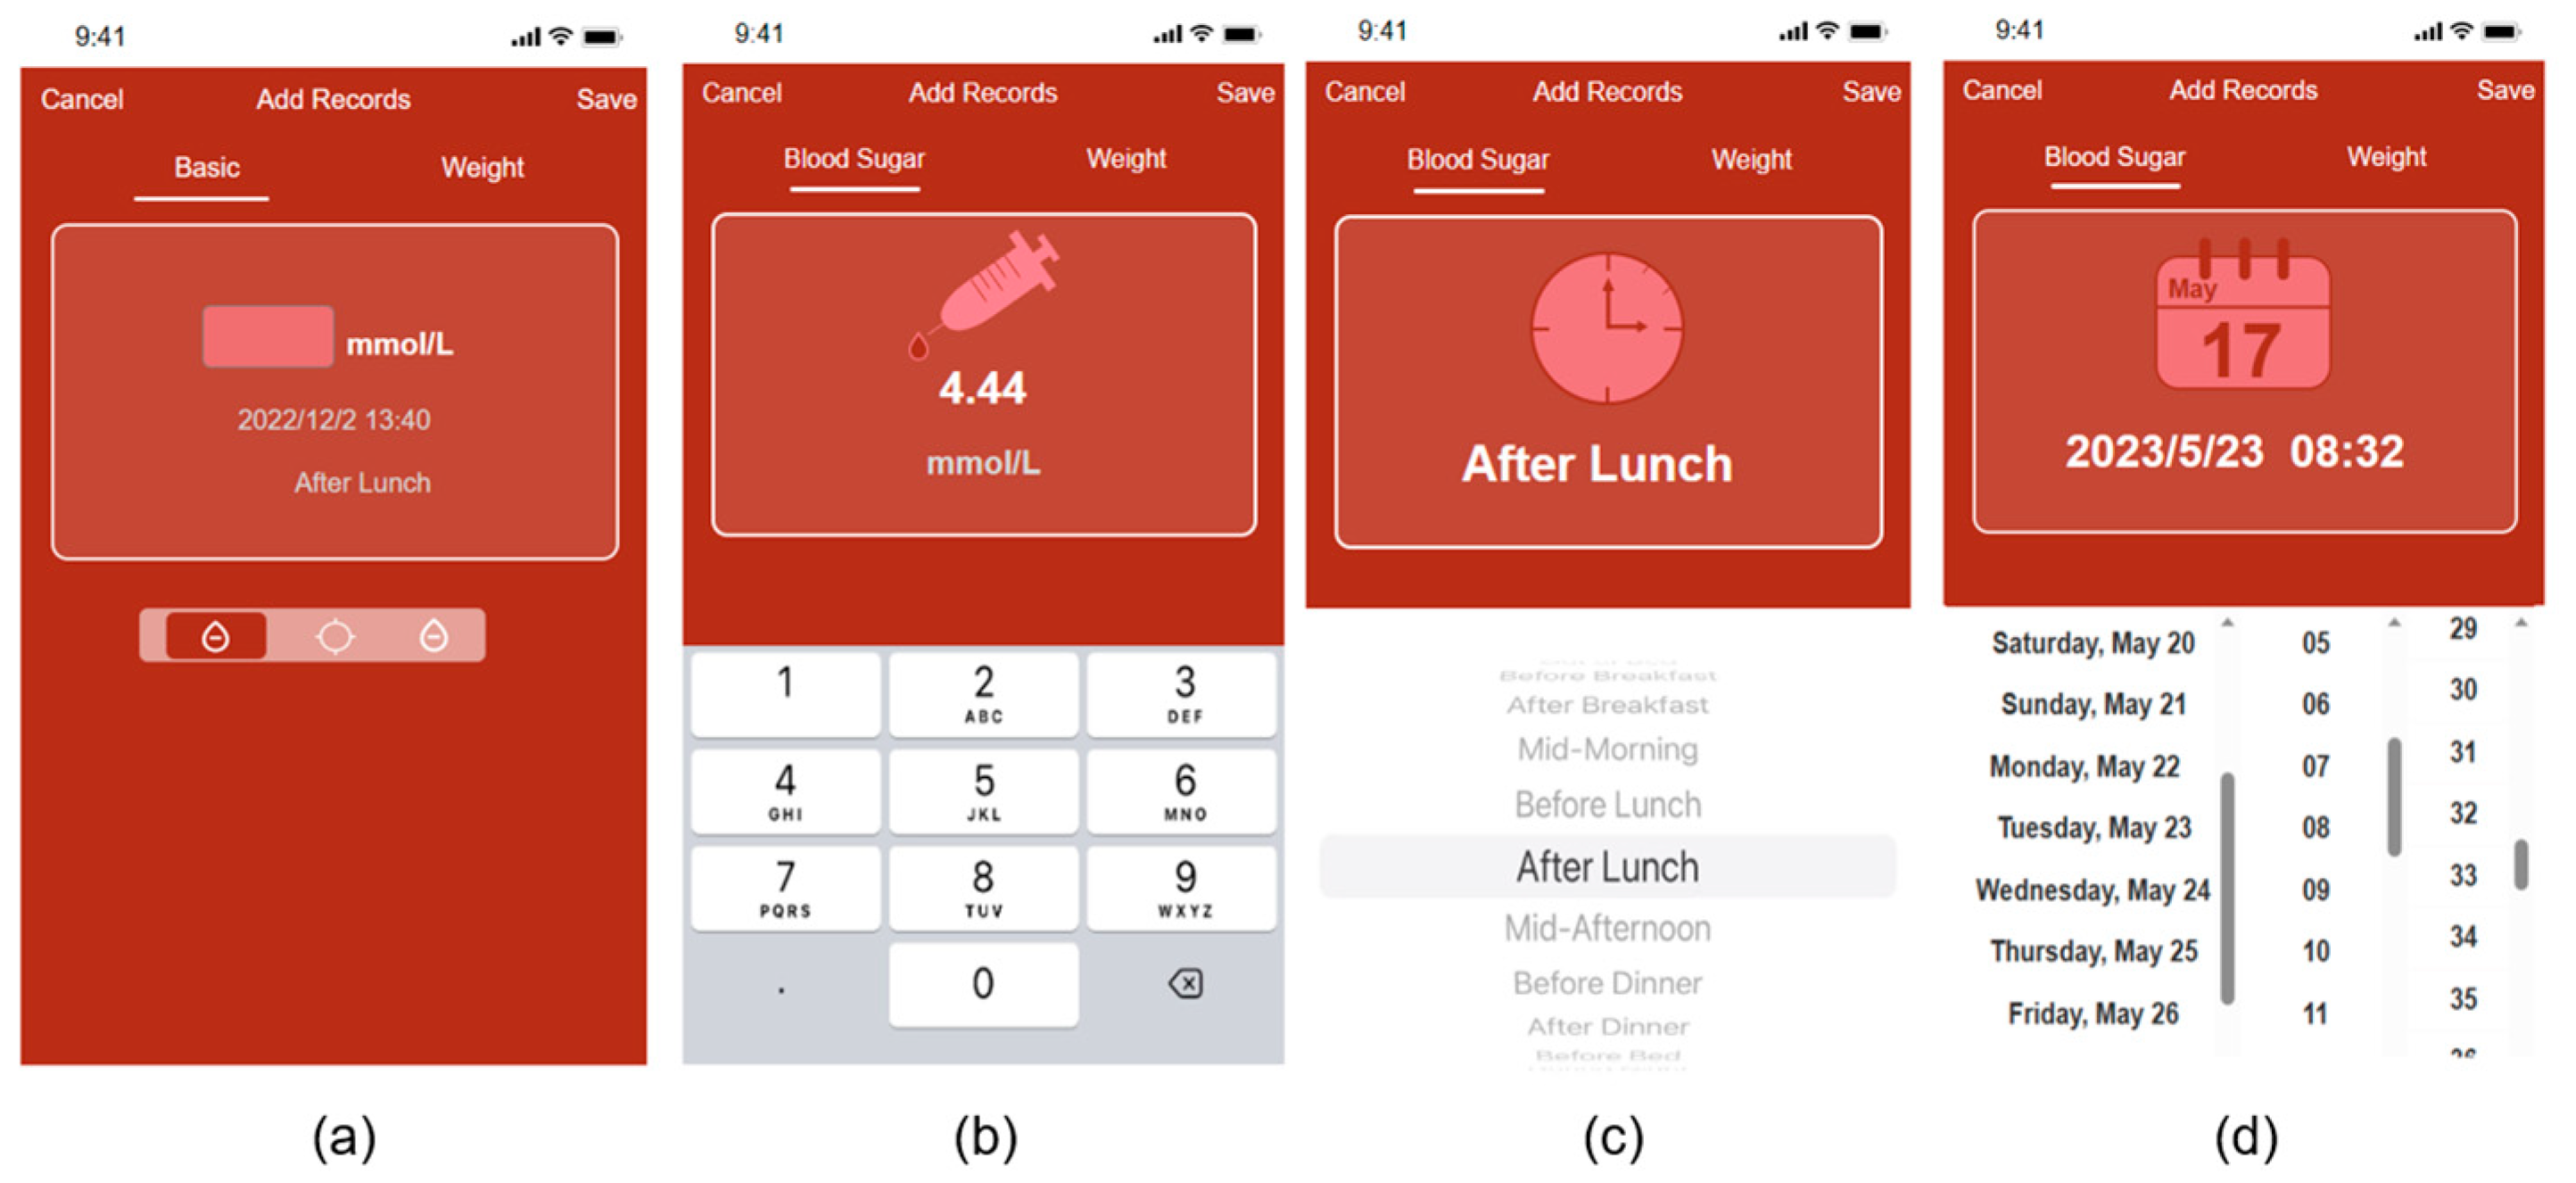
2.4.1. Prototyping
2.4.2. User Notification and Pre-Training
2.4.3. Task Analysis and Error Recording
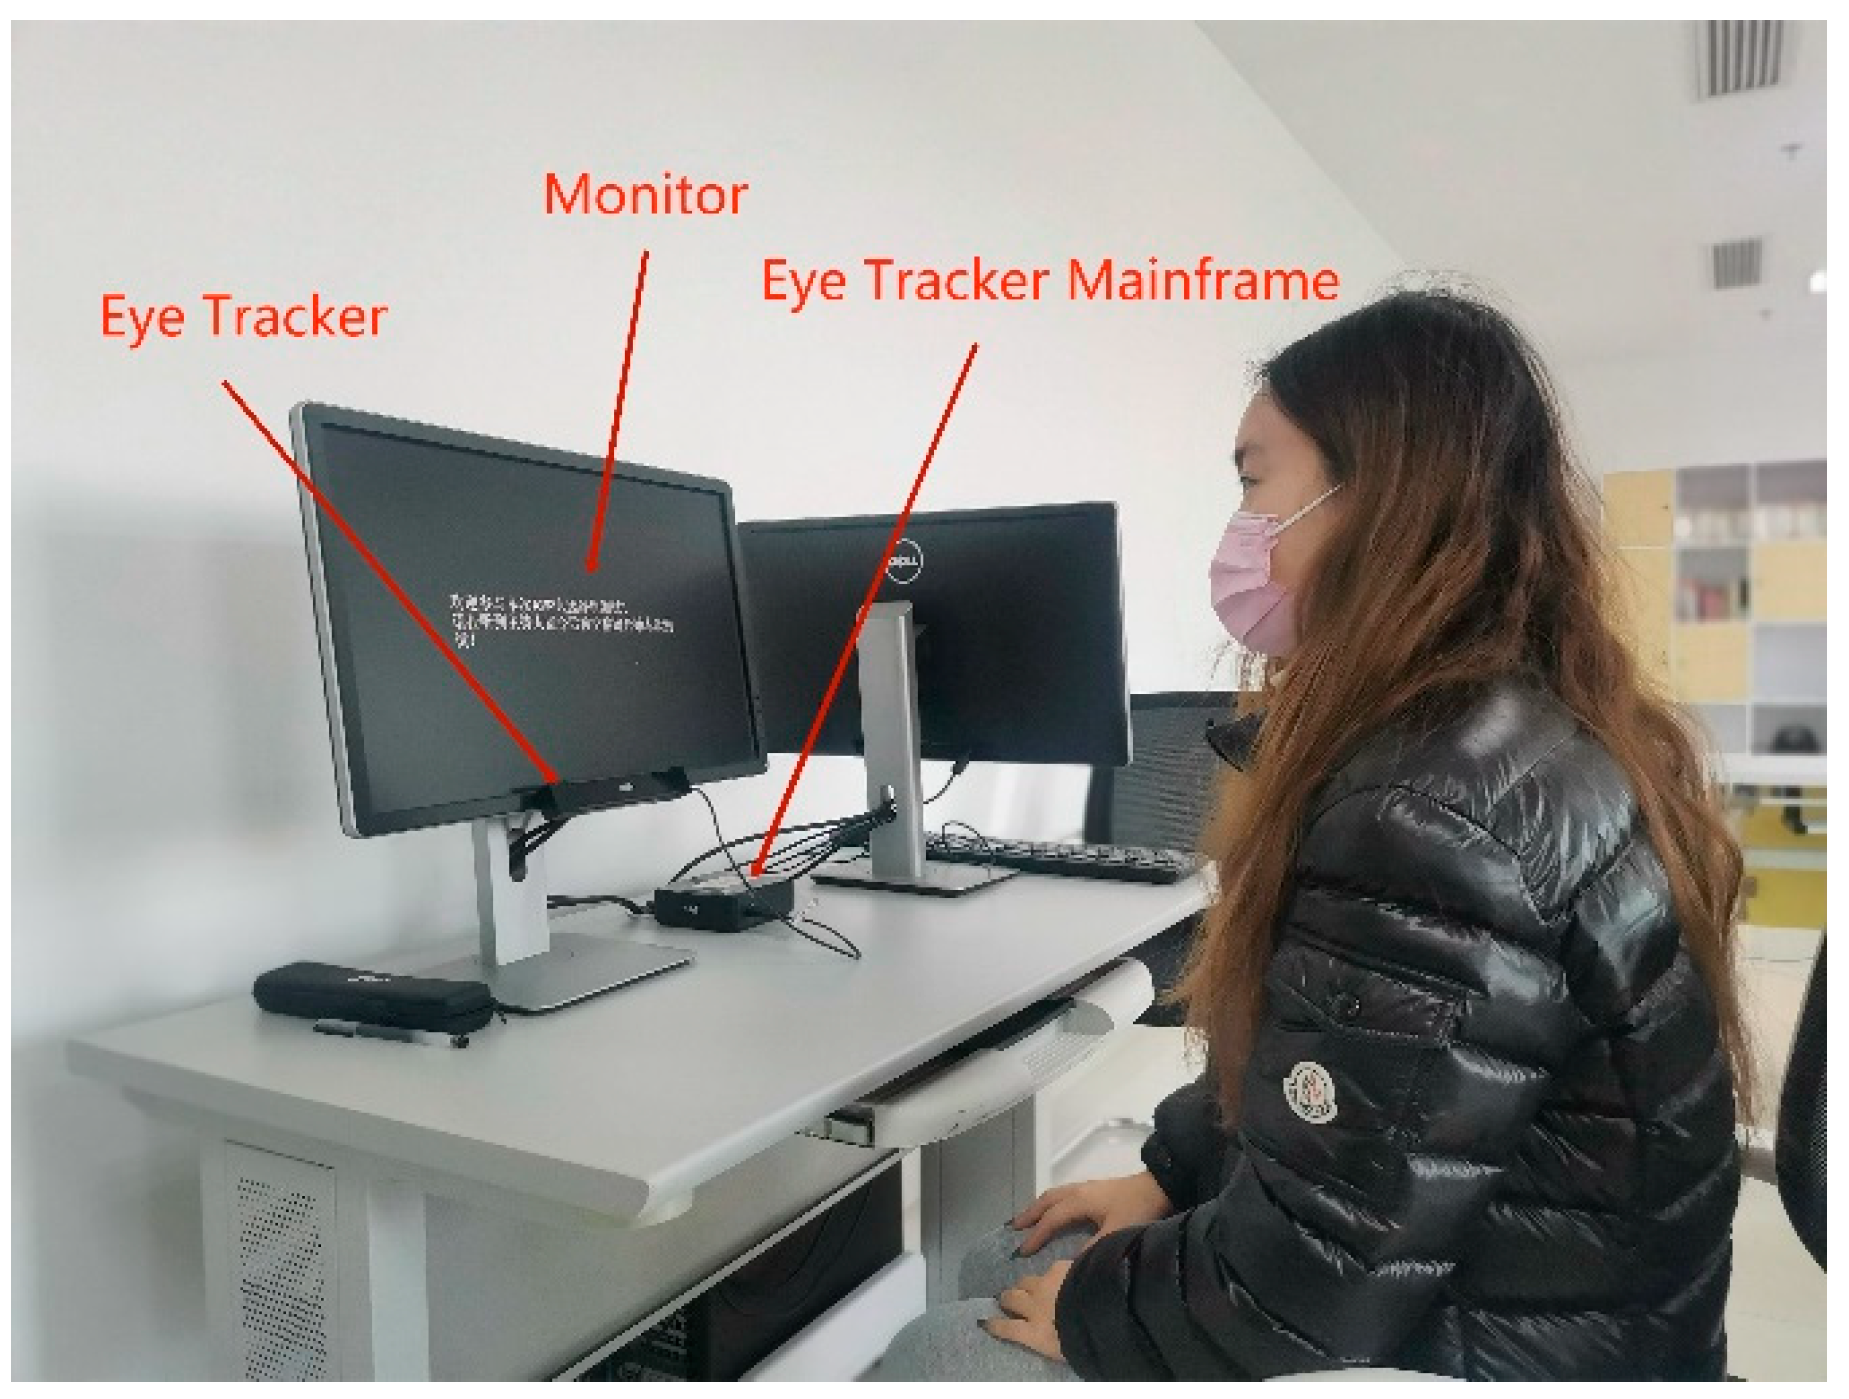
2.4.4. Eye Movement Tasks and Data Acquisition
2.4.5. SUS and Post-Task Questionnaire
3. Results
3.1. Risk Records and Use of Error Records Derived from the Task Analysis Method
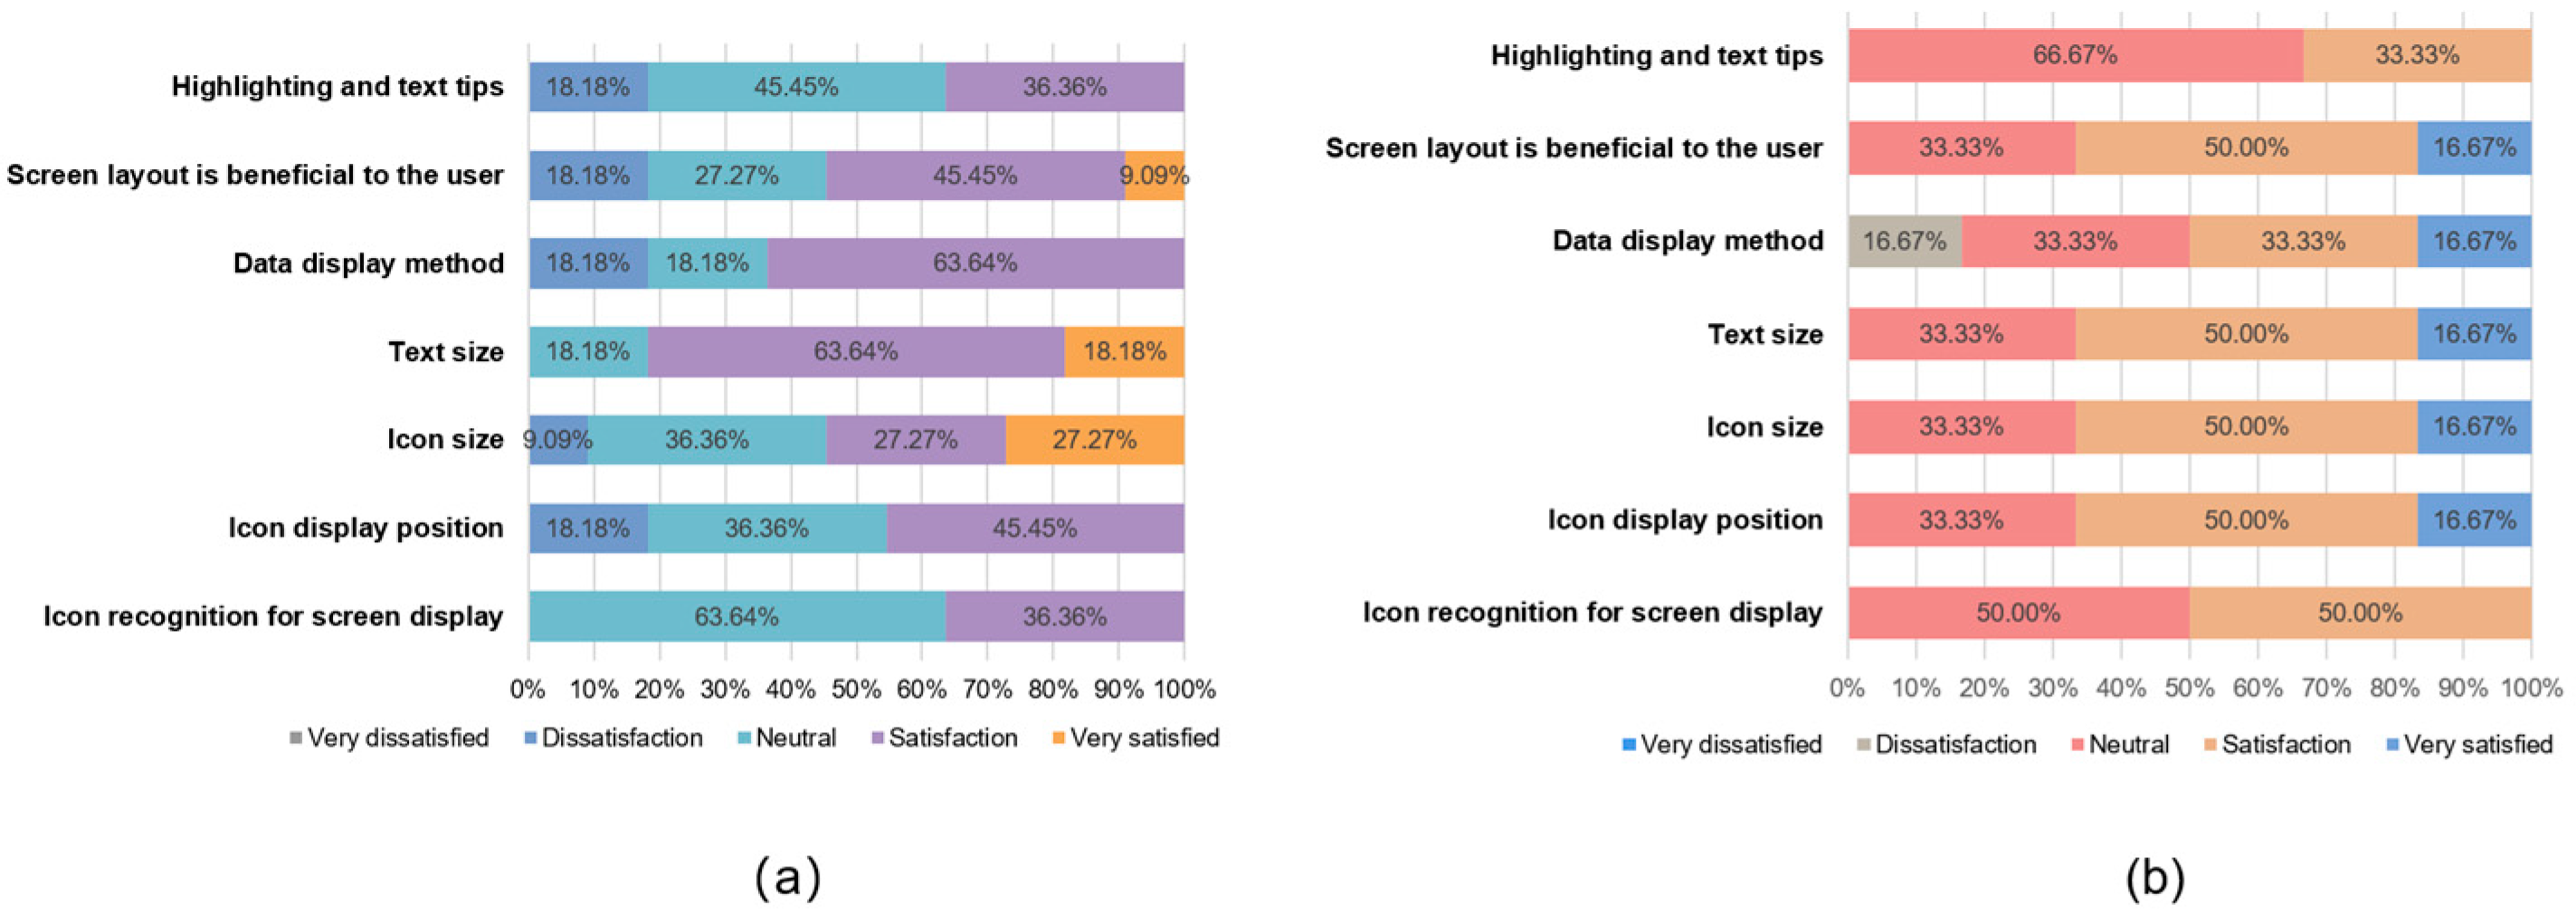
3.2. Comprehensive Satisfaction Scores Derived from the Orientation Questionnaire
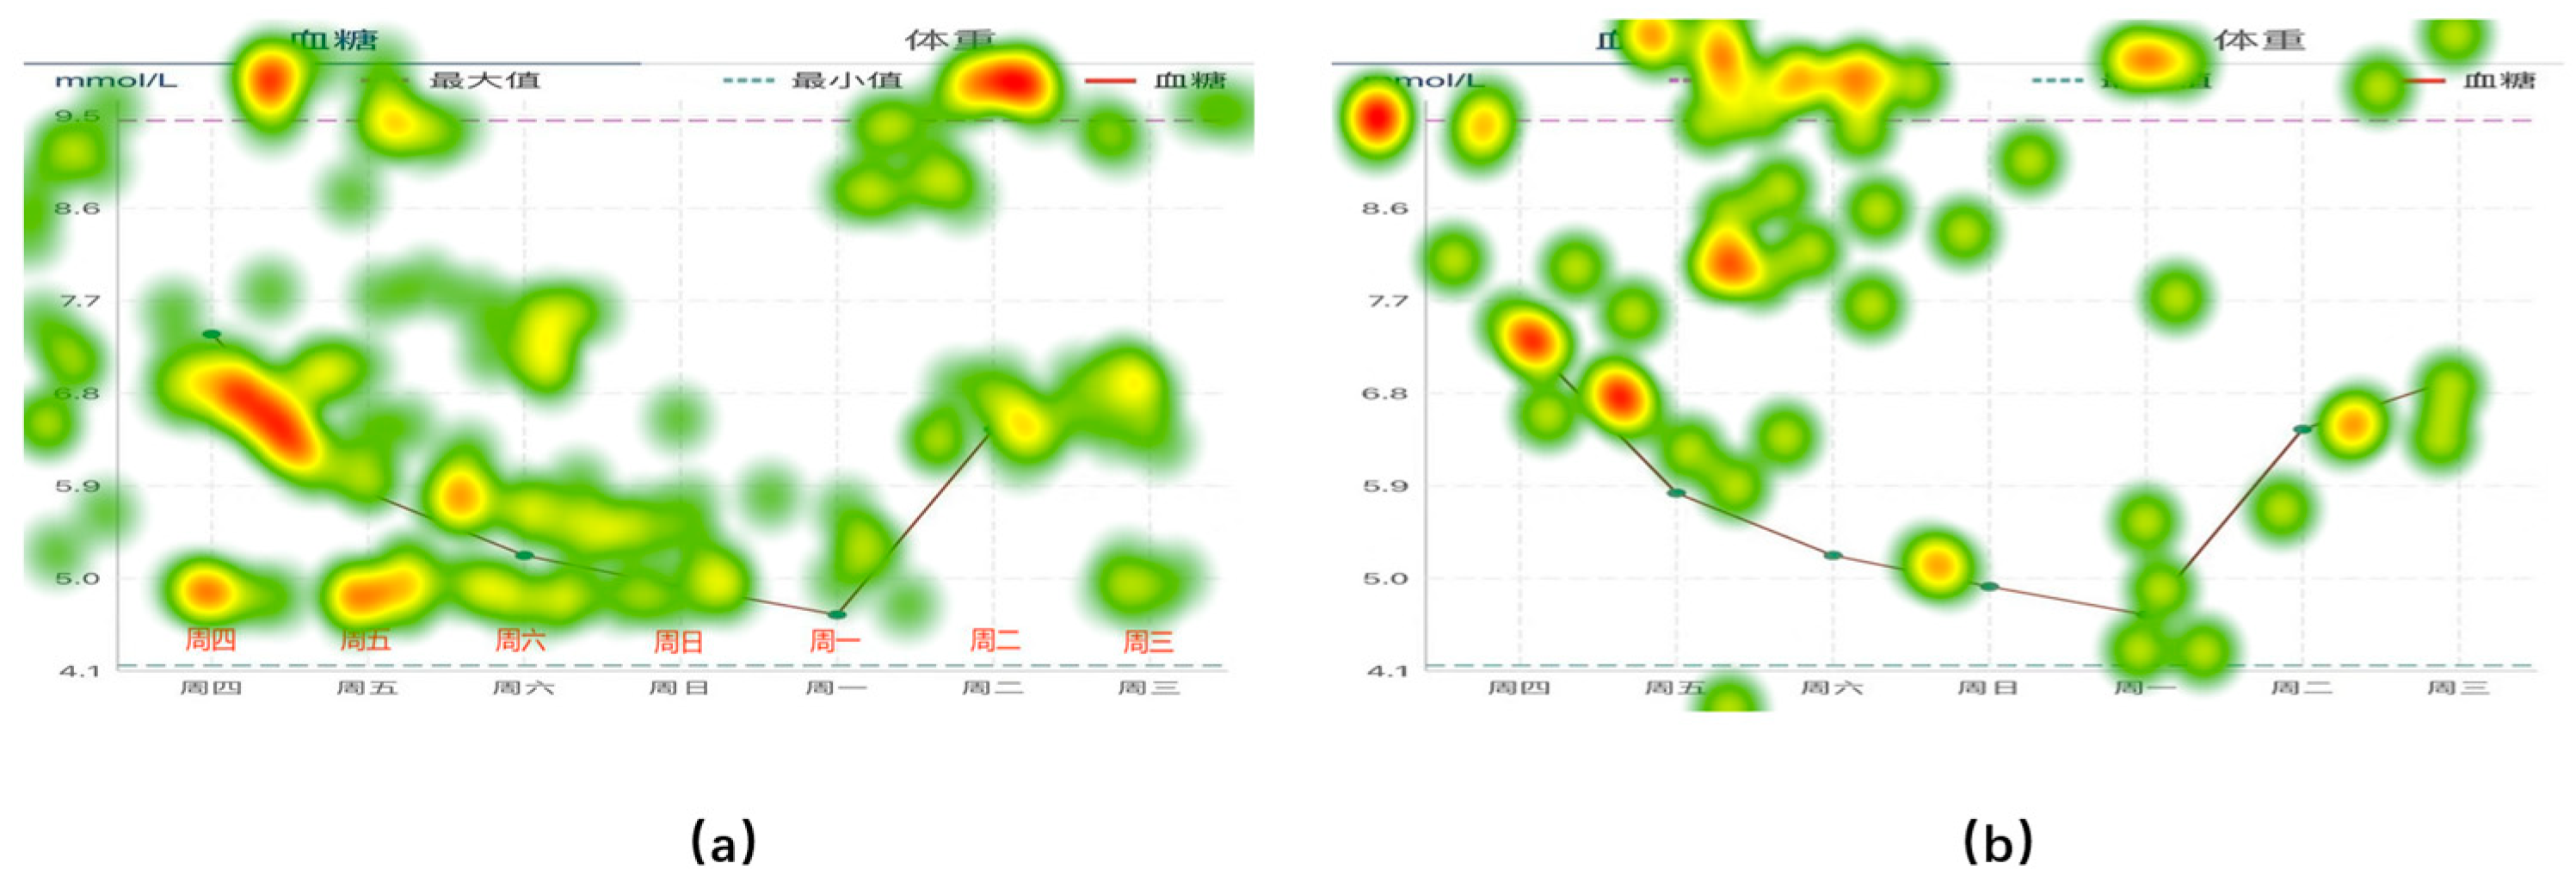
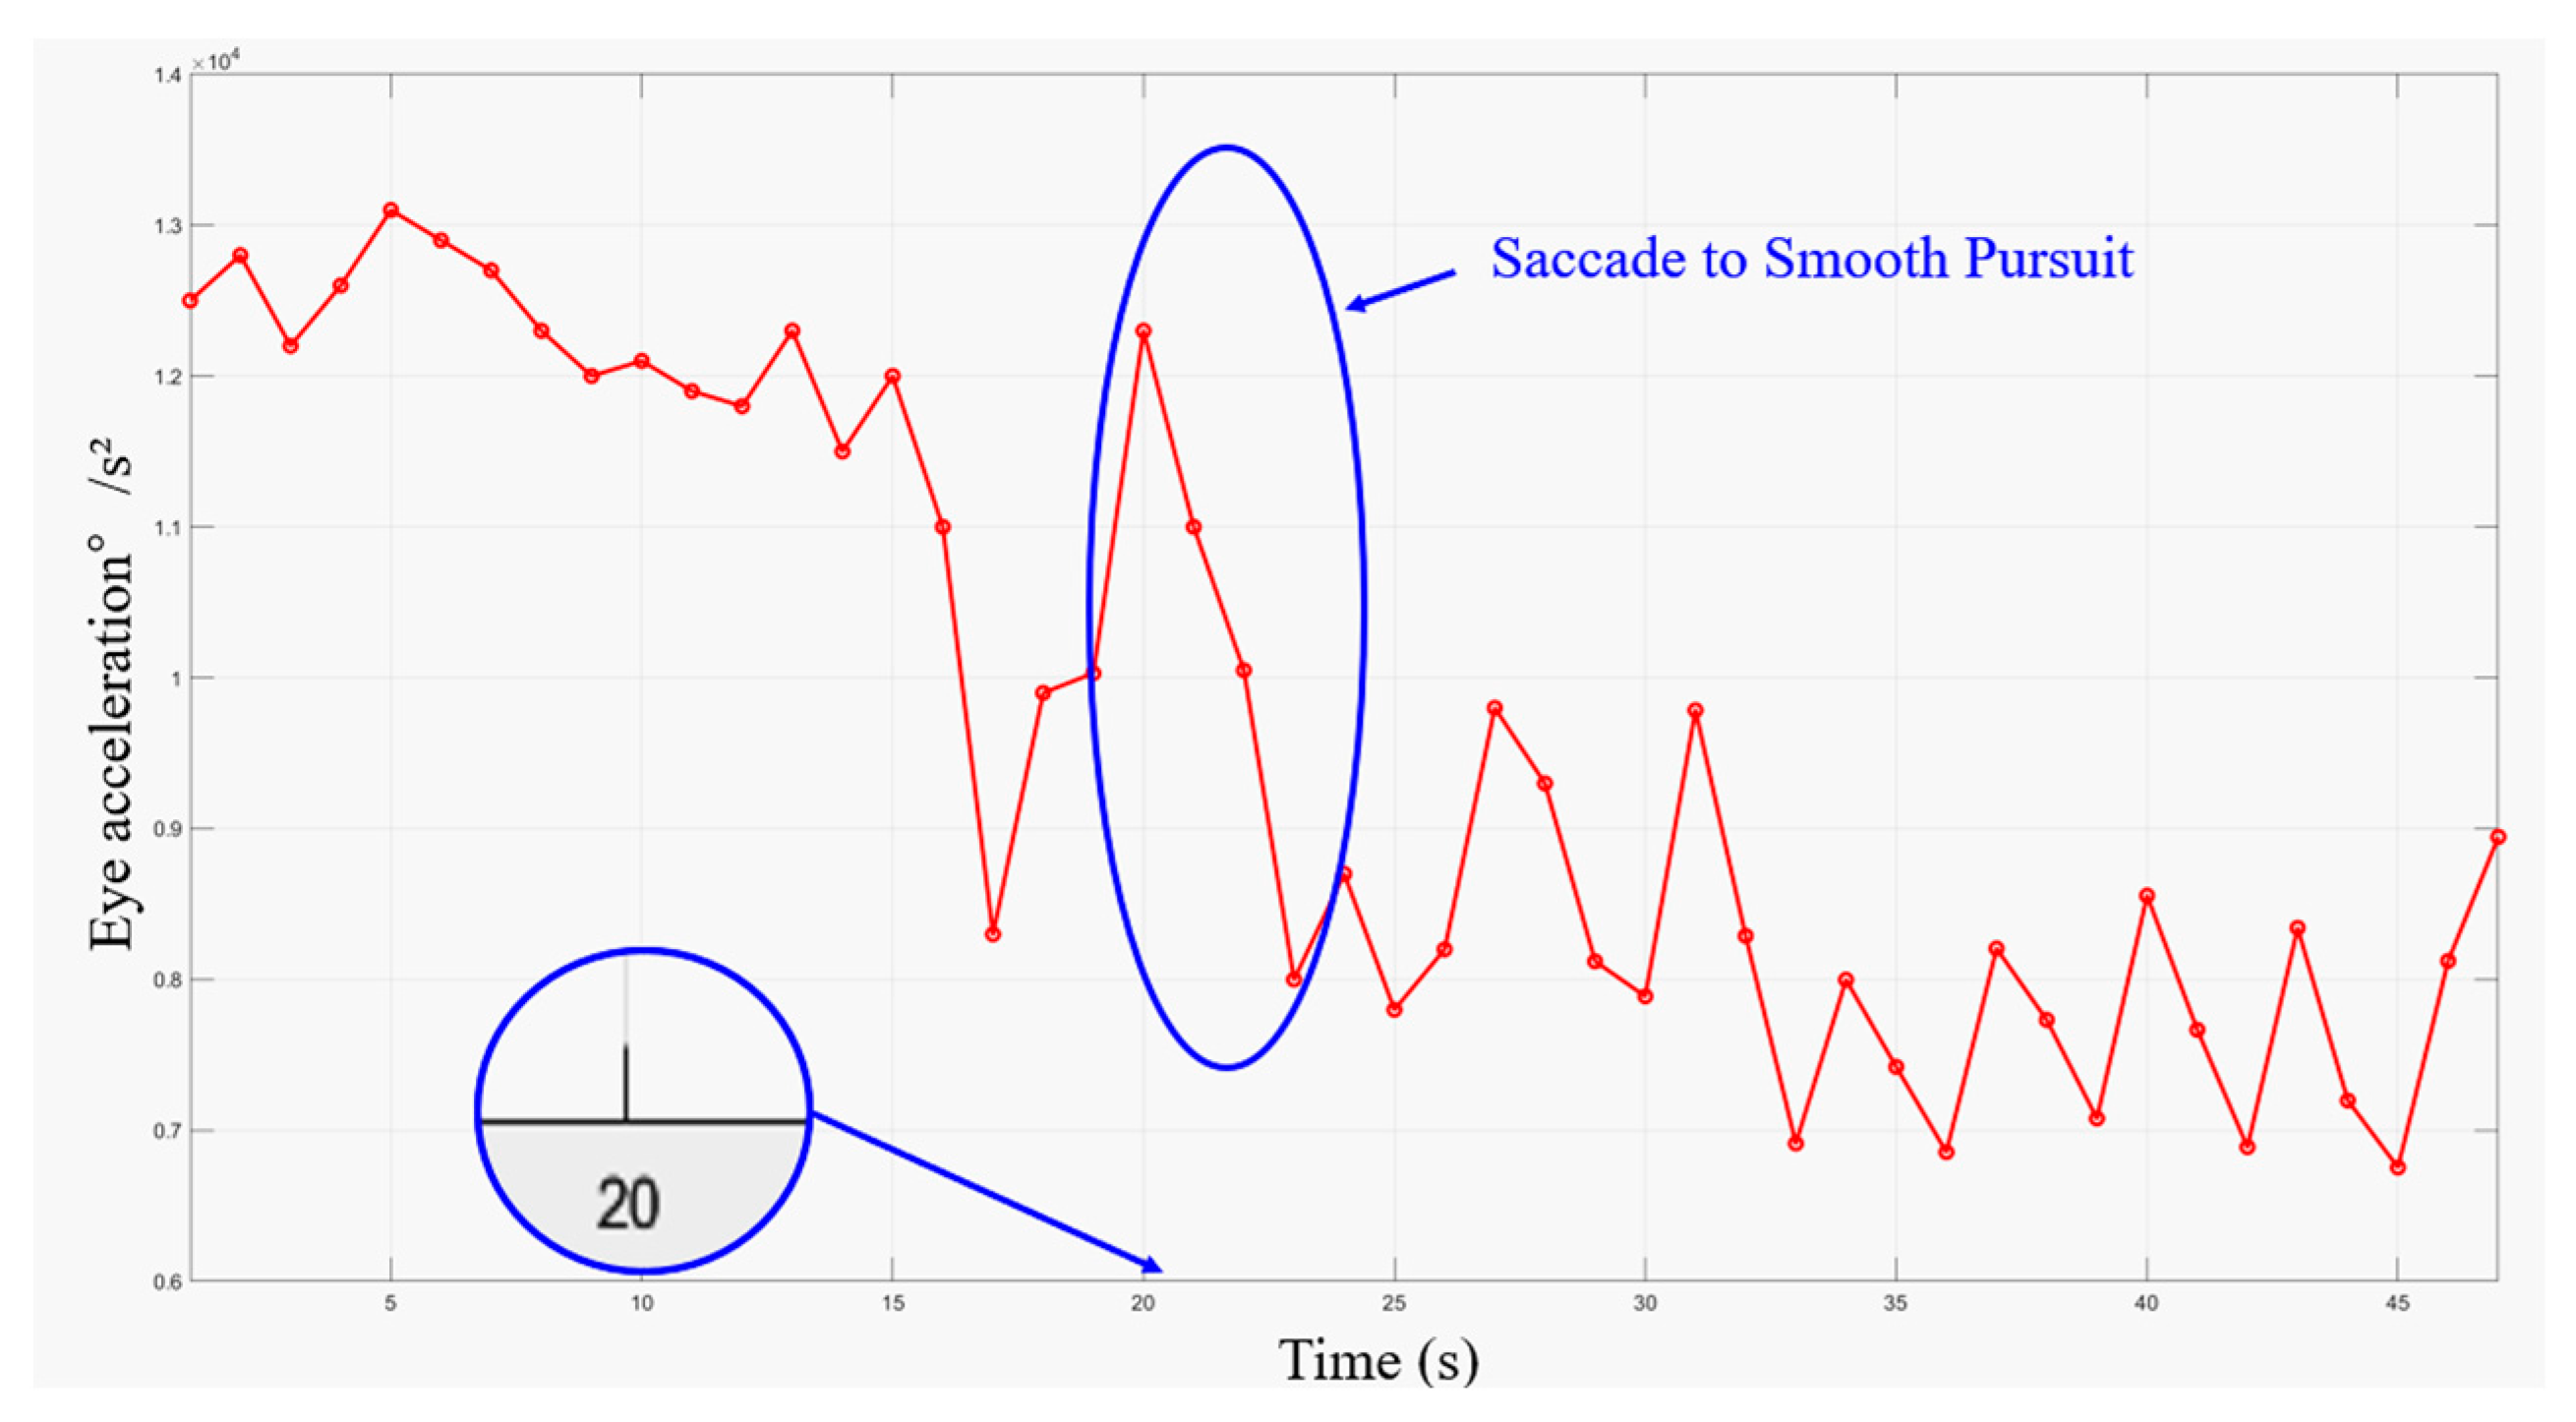
3.3. Eye Movement Acceleration
3.4. Prototype Improvement Checklist Design
3.5. Model Validation Data
3.5.1. SUS Score
3.5.2. Entropy Method Comprehensive Score Based on Eye Movement Indicators
4. Discussion
5. Conclusions
Author Contributions
Funding
Institutional Review Board Statement
Informed Consent Statement
Data Availability Statement
Acknowledgments
Conflicts of Interest
Appendix A. Orientation Questionnaire
- Your age
- Have you been using a smartphone for more than a year?
- How many hours per day do you use smartphone apps on average?
- Have you known and used apps with similar functionality?
- What is your overall impression of the app?
- Will you choose to continue using this app in the future?
- Please rate the interface design part of this app
- 7.1
- Recognizability of icons displayed on the screen
- 7.2
- Icon display position
- 7.3
- Icon size
- 7.4
- Application text size
- 7.5
- The way the data is displayed
- 7.6
- User-friendly screen layout
- 7.7
- Highlighting and clear text prompts
- Please rate the interaction of this app
- 8.1
- Usage time efficiency (system response rate, etc.)
- 8.2
- Efficiency of action (back operation or error message, etc.)
- 8.3
- Layout rationality (number of steps, etc.)
- 8.4
- Ease of learning
- How would you rate the usefulness of the features provided by the app?
- 9.1
- Blood glucose recording
- 9.2
- Weight record
- 9.3
- Blood glucose history search
- 9.4
- Weight history query
- 9.5
- Insulin calculation
- 9.6
- Graphical presentation
- 9.7
- Data record inquiry
- 9.8
- Multi-user mode
- What are your needs for blood glucose displays?
- 10.1
- Last record
- 10.2
- Highest/lowest value
- 10.3
- Trend
- 10.4
- Hazardous value alerts
- 10.5
- Glucose status assessment
- 10.6
- Other
- What are your suggestions for improving the app?
Appendix B. Task Analysis Record Form

| Task No. | Mission Content: | Performed by: | |||||
|---|---|---|---|---|---|---|---|
| User roles: ☐ patients ☐ doctors | Age: | Gender: | |||||
| Brief description of the mission environment: | |||||||
| No. | Steps | Main content | Task breakdown | Expected results | Time | Task completion status | Usability principles reference |
| Duration: | Location: | ||||||
Appendix C. SUS Questionnaire
- I think that I would like to use this system frequently.
- I found the system unnecessarily complex.
- I thought the system was easy to use.
- I think that I would need the support of a technical person to be able to use this system.
- I found the various functions in this system well integrated.
- I thought there was too much inconsistency in this system.
- I would imagine that most people would learn to use this system very quickly.
- I found the system very cumbersome to use.
- I felt very confident using the system.
- I needed to learn a lot of things before I could get going with this system.
References
- Martínez-Pérez, B.; De La Torre-Díez, I.; López-Coronado, M. Mobile health applications for the most prevalent conditions by the World Health Organization: Review and analysis. J. Med. Internet Res. 2013, 15, e120. [Google Scholar] [CrossRef] [PubMed]
- Ryu, S. Book review: mHealth: New horizons for health through mobile technologies: Based on the findings of the second global survey on eHealth (global observatory for eHealth series, volume 3). Healthc. Inform. Res. 2012, 18, 231. [Google Scholar] [CrossRef]
- Sun, J.; Guo, Y.; Wang, X.; Zeng, Q. mHealth for aging China: Opportunities and challenges. Aging Dis. 2016, 7, 53. [Google Scholar] [CrossRef]
- Koh, J.; Tng, G.Y.Q.; Hartanto, A. Potential and Pitfalls of Mobile Mental Health Apps in Traditional Treatment: An Umbrella Review. J. Pers. Med. 2022, 12, 1376. [Google Scholar] [CrossRef]
- Haggag, O.; Grundy, J.; Abdelrazek, M.; Haggag, S. A large scale analysis of mHealth app user reviews. Empir. Softw. Eng. 2022, 27, 196. [Google Scholar] [CrossRef] [PubMed]
- LLv, Q.; Jiang, Y.; Qi, J.; Zhang, Y.; Zhang, X.; Fang, L.; Tu, L.; Yang, M.; Liao, Z.; Zhao, M.; et al. Using mobile apps for health management: A new health care mode in China. JMIR mHealth uHealth 2019, 7, e10299. [Google Scholar] [CrossRef]
- Lu, C.; Hu, Y.; Xie, J.; Fu, Q.; Leigh, I.; Governor, S.; Wang, G. The use of mobile health applications to improve patient experience: Cross-sectional study in Chinese public hospitals. JMIR mHealth uHealth 2018, 6, e9145. [Google Scholar] [CrossRef]
- Yang, L.; Wu, J.; Mo, X.; Chen, Y.; Huang, S.; Zhou, L.; Dai, J.; Xie, L.; Chen, S.; Shang, H.; et al. Changes in mobile health apps usage before and after the COVID-19 outbreak in China: Semilongitudinal survey. JMIR Public Health Surveill. 2023, 9, e40552. [Google Scholar] [CrossRef]
- Choi, J.; Kim, H.; Jung, W.; Lee, S.J. Analysis of interface management tasks in a digital main control room. Nucl. Eng. Technol. 2019, 51, 1560–1640. [Google Scholar] [CrossRef]
- Rodríguez, I.; Fuentes, C.; Herskovic, V.; Campos, M. Monitoring chronic pain: Comparing wearable and mobile interfaces. In Ubiquitous Computing and Ambient Intelligence: 10th International Conference, UCAmI 2016, San Bartolomé de Tirajana, Gran Canaria, Spain, November 29–December 2, 2016, Proceedings, Part I 10; Springer International Publishing: Cham, Switzerland, 2016; pp. 234–245. [Google Scholar] [CrossRef]
- Cooke, M.; Richards, J.; Tjondronegoro, D.; Chakraborty, P.R.; Jauncey-Cooke, J.; Andresen, E.; Theodoros, J.; Paterson, R.; Schults, J.; Raithatha, B.; et al. myPainPal: Co-creation of a mHealth app for the management of chronic pain in young people. Inform. Health Soc. Care 2021, 46, 291–305. [Google Scholar] [CrossRef]
- Shahmoradi, L.; Mousa-abadi, M.B.; Karami, M. Designing a Mobile Phone Application for Self-Management of Knee and Lumbar Osteoarthritis: A Usability and Feasibility Study. Appl. Health Inf. Technol. 2022, 3. [Google Scholar] [CrossRef]
- Cafazzo, J.A.; Casselman, M.; Hamming, N.; Katzman, D.K.; Palmert, M.R. Design of an mHealth app for the self-management of adolescent type 1 diabetes: A pilot study. J. Med. Internet Res. 2012, 14, e2058. [Google Scholar] [CrossRef] [PubMed]
- Koumpouros, Y. User-centric design methodology for mhealth apps: The painapp paradigm for chronic pain. Technologies 2022, 10, 25. [Google Scholar] [CrossRef]
- Foster, E.C.; Bradford, A.; Towle, J. Software Engineering: A Methodical Approach; CRC Press: Boca Raton, FL, USA, 2021. [Google Scholar] [CrossRef]
- Sneha, S.; Thalla, S.; Rischie, I.; Shahriar, H. Health Internet technology for chronic conditions: Review of diabetes management apps. JMIR Diabetes 2021, 6, e17431. [Google Scholar] [CrossRef] [PubMed]
- Yan, Y.; Wu, T.; Zhang, M.; Li, C.; Liu, Q.; Li, F. Prevalence, awareness and control of type 2 diabetes mellitus and risk factors in Chinese elderly population. BMC Public Health 2022, 22, 1382. [Google Scholar] [CrossRef] [PubMed]
- Wang, L.; Peng, W.; Zhao, Z.; Zhang, M.; Shi, Z.; Song, Z.; Zhang, X.; Li, C.; Huang, Z.; Sun, X.; et al. Prevalence and treatment of diabetes in China, 2013–2018. JAMA 2021, 326, 2498–2506. [Google Scholar] [CrossRef]
- Li, Y.; Teng, D.; Shi, X.; Qin, G.; Qin, Y.; Quan, H.; Shi, B.; Sun, H.; Ba, J.; Chen, B.; et al. Prevalence of diabetes recorded in mainland China using 2018 diagnostic criteria from the American Diabetes Association: National cross sectional study. BMJ 2020, 369, m997. [Google Scholar] [CrossRef] [PubMed]
- Su, B.; Wang, Y.; Dong, Y.; Hu, G.; Xu, Y.; Peng, X.; Wang, Q.; Zheng, X. Trends in diabetes mortality in urban and rural China, 1987–2019: A joinpoint regression analysis. Front. Endocrinol. 2022, 12, 777654. [Google Scholar] [CrossRef] [PubMed]
- Guo, M.; Meng, F.; Guo, Q.; Bai, T.; Hong, Y.; Song, F.; Ma, Y. Effectiveness of mHealth management with an implantable glucose sensor and a mobile application among Chinese adults with type 2 diabetes. J. Telemed. Telecare 2023, 29, 632–640. [Google Scholar] [CrossRef]
- Chung, H.W.; Tai, C.J.; Chang, P.; Su, W.L.; Chien, L.Y. The effectiveness of a traditional Chinese medicine–based mobile health app for individuals with prediabetes: Randomized controlled trial. JMIR mHealth uHealth 2023, 11, e41099. [Google Scholar] [CrossRef]
- Zhang, W.; Yang, P.; Wang, H.; Pan, X.; Wang, Y. The effectiveness of a mHealth-based integrated hospital-community-home program for people with type 2 diabetes in transitional care: A protocol for a multicenter pragmatic randomized controlled trial. BMC Prim. Care 2022, 23, 196. [Google Scholar] [CrossRef]
- Rho, M.J.; Kim, S.R.; Kim, H.S.; Cho, J.H.; Yoon, K.H.; Mun, S.K.; Choi, I.Y. Exploring the relationship among user satisfaction, compliance, and clinical outcomes of telemedicine services for glucose control. Telemed. e-Health 2014, 20, 712–720. [Google Scholar] [CrossRef] [PubMed]
- Guo, X.; Chen, L.; Chen, L.; Ji, Q.; Sun, Z.; Li, Q.; Xing, Q.; Zhao, F.; Yuan, L.; Lou, Q.; et al. Effectiveness evaluation of the mobile health patients management mode on treatment compliance and glycemic control for type 2 diabetes patients using basal insulin treatment for 12 weeks. Chin. J. Endocrinol. Metab. 2016, 12, 639–646. [Google Scholar] [CrossRef]
- Gunawardena, K.C.; Jackson, R.; Robinett, I.; Dhaniska, L.; Jayamanne, S.; Kalpani, S.; Muthukuda, D. The influence of the smart glucose manager mobile application on diabetes management. J. Diabetes Sci. Technol. 2019, 13, 75–81. [Google Scholar] [CrossRef]
- El-Gayar, O.; Timsina, P.; Nawar, N.; Eid, W. Mobile applications for diabetes self-management: Status and potential. J. Diabetes Sci. Technol. 2013, 7, 247–262. [Google Scholar] [CrossRef] [PubMed]
- Arthurs, N.; Tully, L.; O’Malley, G.; Browne, S. Usability and engagement testing of mHealth Apps in paediatric obesity: A narrative review of current literature. Int. J. Environ. Res. Public Health 2022, 19, 1453. [Google Scholar] [CrossRef]
- Wang, Q.; Liu, J.; Zhou, L.; Tian, J.; Chen, X.; Zhang, W.; Wang, H.; Zhou, W.; Gao, Y. Usability evaluation of mHealth apps for elderly individuals: A scoping review. BMC Med. Inform. Decis. Mak. 2022, 22, 317. [Google Scholar] [CrossRef] [PubMed]
- Zhao, S.; Cao, Y.; Cao, H.; Liu, K.; Lv, X.; Zhang, J.; Li, Y.; Davidson, P.M. Chinese version of the mHealth app usability questionnaire: Cross-cultural adaptation and validation. Front. Psychol. 2022, 13, 813309. [Google Scholar] [CrossRef]
- Smith, A.C.; Thomas, E.; Snoswell, C.L.; Haydon, H.; Mehrotra, A.; Clemensen, J.; Caffery, L.J. Telehealth for global emergencies: Implications for coronavirus disease 2019 (COVID-19). J. Telemed. Telecare 2020, 26, 309–313. [Google Scholar] [CrossRef]
- Klasnja, P.; Hartzler, A.; Powell, C.; Pratt, W. Supporting cancer patients’ unanchored health information management with mobile technology. AMIA Annu. Symp. Proc. 2011, 2011, 732, PMC3243297. [Google Scholar]
- Zayim, N.; Yıldız, H.; Yüce, Y.K. Estimating Cognitive Load in a Mobile Personal Health Record Application: A Cognitive Task Analysis Approach. Healthc. Inform. Res. 2023, 29, 367. [Google Scholar] [CrossRef] [PubMed]
- Wildenbos, G.A.; Jaspers, M.W.; Schijven, M.P.; Dusseljee-Peute, L.W. Mobile health for older adult patients: Using an aging barriers framework to classify usability problems. Int. J. Med. Inform. 2019, 124, 68–77. [Google Scholar] [CrossRef]
- Chamberlain, L. Eye tracking methodology; theory and practice. Qual. Mark. Res. Int. J. 2007, 10, 217–220. [Google Scholar] [CrossRef]
- Asan, O.; Yang, Y. Using eye trackers for usability evaluation of health information technology: A systematic literature review. JMIR Hum. Factors 2015, 2, e4062. [Google Scholar] [CrossRef] [PubMed]
- Rose, J.A.; Bearman, C. Making effective use of task analysis to identify human factors issues in new rail technology. Appl. Ergon. 2012, 43, 614–624. [Google Scholar] [CrossRef] [PubMed]
- Baumgartner, J.; Ruettgers, N.; Hasler, A.; Sonderegger, A.; Sauer, J. Questionnaire experience and the hybrid System Usability Scale: Using a novel concept to evaluate a new instrument. Int. J. Hum.-Comput. Stud. 2021, 147, 102575. [Google Scholar] [CrossRef]
- Oyama, A.; Takeda, S.; Ito, Y.; Nakajima, T.; Takami, Y.; Takeya, Y.; Yamamoto, K.; Sugimoto, K.; Shimizu, H.; Shimamura, M.; et al. Novel method for rapid assessment of cognitive impairment using high-performance eye-tracking technology. Sci. Rep. 2019, 9, 12932. [Google Scholar] [CrossRef] [PubMed]
- Lewis, J.R. The system usability scale: Past, present, and future. Int. J. Hum. –Comput. Interact. 2018, 34, 577–590. [Google Scholar] [CrossRef]
- Mat Zain, N.H.; Abdul Razak, F.H.; Jaafar, A.; Zulkipli, M.F. Eye tracking in educational games environment: Evaluating user interface design through eye tracking patterns. In Proceedings of the Visual Informatics: Sustaining Research and Innovations: Second International Visual Informatics Conference, IVIC 2011, Selangor, Malaysia, 9–11 November 2011; Proceedings, Part II 2; Springer: Berlin/Heidelberg, Germany, 2011; pp. 64–73. [Google Scholar] [CrossRef]
- Joachims, T.; Granka, L.; Pan, B.; Hembrooke, H.; Gay, G. Accurately Interpreting Clickthrough Data as Implicit Feedback. ACM SIGIR Forum 2017, 51, 4–11. [Google Scholar] [CrossRef]
- Joseph, A.W.; Murugesh, R. Potential eye tracking metrics and indicators to measure cognitive load in human-computer interaction research. J. Sci. Res. 2020, 64, 168–175. [Google Scholar] [CrossRef]
- Zhong, X.; Cheng, Y.; Yang, J.; Tian, L. Evaluation and Optimization of In-Vehicle HUD Design by Applying an Entropy Weight-VIKOR Hybrid Method. Appl. Sci. 2023, 13, 3789. [Google Scholar] [CrossRef]
- Christiansen, M.; Greene, C.; Pardo, S.; Warchal-Windham, M.E.; Harrison, B.; Morin, R.; Bailey, T.S. A new, wireless-enabled blood glucose monitoring system that links to a smart mobile device: Accuracy and user performance evaluation. J. Diabetes Sci. Technol. 2017, 11, 567–573. [Google Scholar] [CrossRef] [PubMed]
- ISO 9241-210:2019; Ergonomics of Human-System Interaction—Part 210: Human-Centred Design for Interactive Systems. International Organization for Standardization: Geneva, Switzerland, 2019.
- Jeffries, R. The role of task analysis in the design of software. In Handbook of Human-Computer Interaction; Springer Nature: North-Holland, The Netherlands, 1997; pp. 347–359. [Google Scholar] [CrossRef]
- John, B.E.; Kieras, D.E. The GOMS family of user interface analysis techniques: Comparison and contrast. ACM Trans. Comput.-Hum. Interact. (TOCHI) 1996, 3, 320–351. [Google Scholar] [CrossRef]
- Kluge, M.; Asche, H. Validating a smartphone-based pedestrian navigation system prototype: An informal eye-tracking pilot test. In Proceedings of the Computational Science and Its Applications–ICCSA 2012: 12th International Conference, Salvador de Bahia, Brazil, 18–21 June 2012; Proceedings, Part II 12; Springer: Berlin/Heidelberg, Germany, 2012; pp. 386–396. [Google Scholar] [CrossRef]
- Gibaldi, A.; Vanegas, M.; Bex, P.J.; Maiello, G. Evaluation of the Tobii EyeX Eye tracking controller and Matlab toolkit for research. Behav. Res. Methods 2017, 49, 923–946. [Google Scholar] [CrossRef] [PubMed]
- Alomari, H.W.; Ramasamy, V.; Kiper, J.D.; Potvin, G. A User Interface (UI) and User eXperience (UX) evaluation framework for cyberlearning environments in computer science and software engineering education. Heliyon 2020, 6, e03917. [Google Scholar] [CrossRef] [PubMed]
- Bartko, J.J. The intraclass correlation coefficient as a measure of reliability. Psychol. Rep. 1966, 19, 3–11. [Google Scholar] [CrossRef]
- Zhang, J.; Su, D.; Zhuang, Y.; Furong, Q.I.U. Study on cognitive load of OM interface and eye movement experiment for nuclear power system. Nucl. Eng. Technol. 2020, 52, 78–86. [Google Scholar] [CrossRef]
- Nielsen, J.; Landauer, T.K. A mathematical model of the finding of usability problems. In Proceedings of the INTERACT’93 and CHI’93 Conference on Human Factors in Computing Systems, Amsterdam, The Netherlands, 1 May 1993; pp. 206–213. [Google Scholar] [CrossRef]


| Group | Ave | Sd |
|---|---|---|
| A | 21.67 | 0.62 |
| B | 46.67 | 2.42 |
| Group | Ave | Sd |
|---|---|---|
| A | 21.92 | 0.79 |
| B | 45.75 | 5.56 |
| Task scenario | New users manage blood glucose data for themselves | New users manage blood glucose data for others |
| Subtasks | Add user | Add user |
| Add blood glucose records | Master user switching | |
| Check blood glucose records | Check blood glucose records | |
| Delete blood glucose records Insulin calculation | Add blood glucose records Insulin calculation |
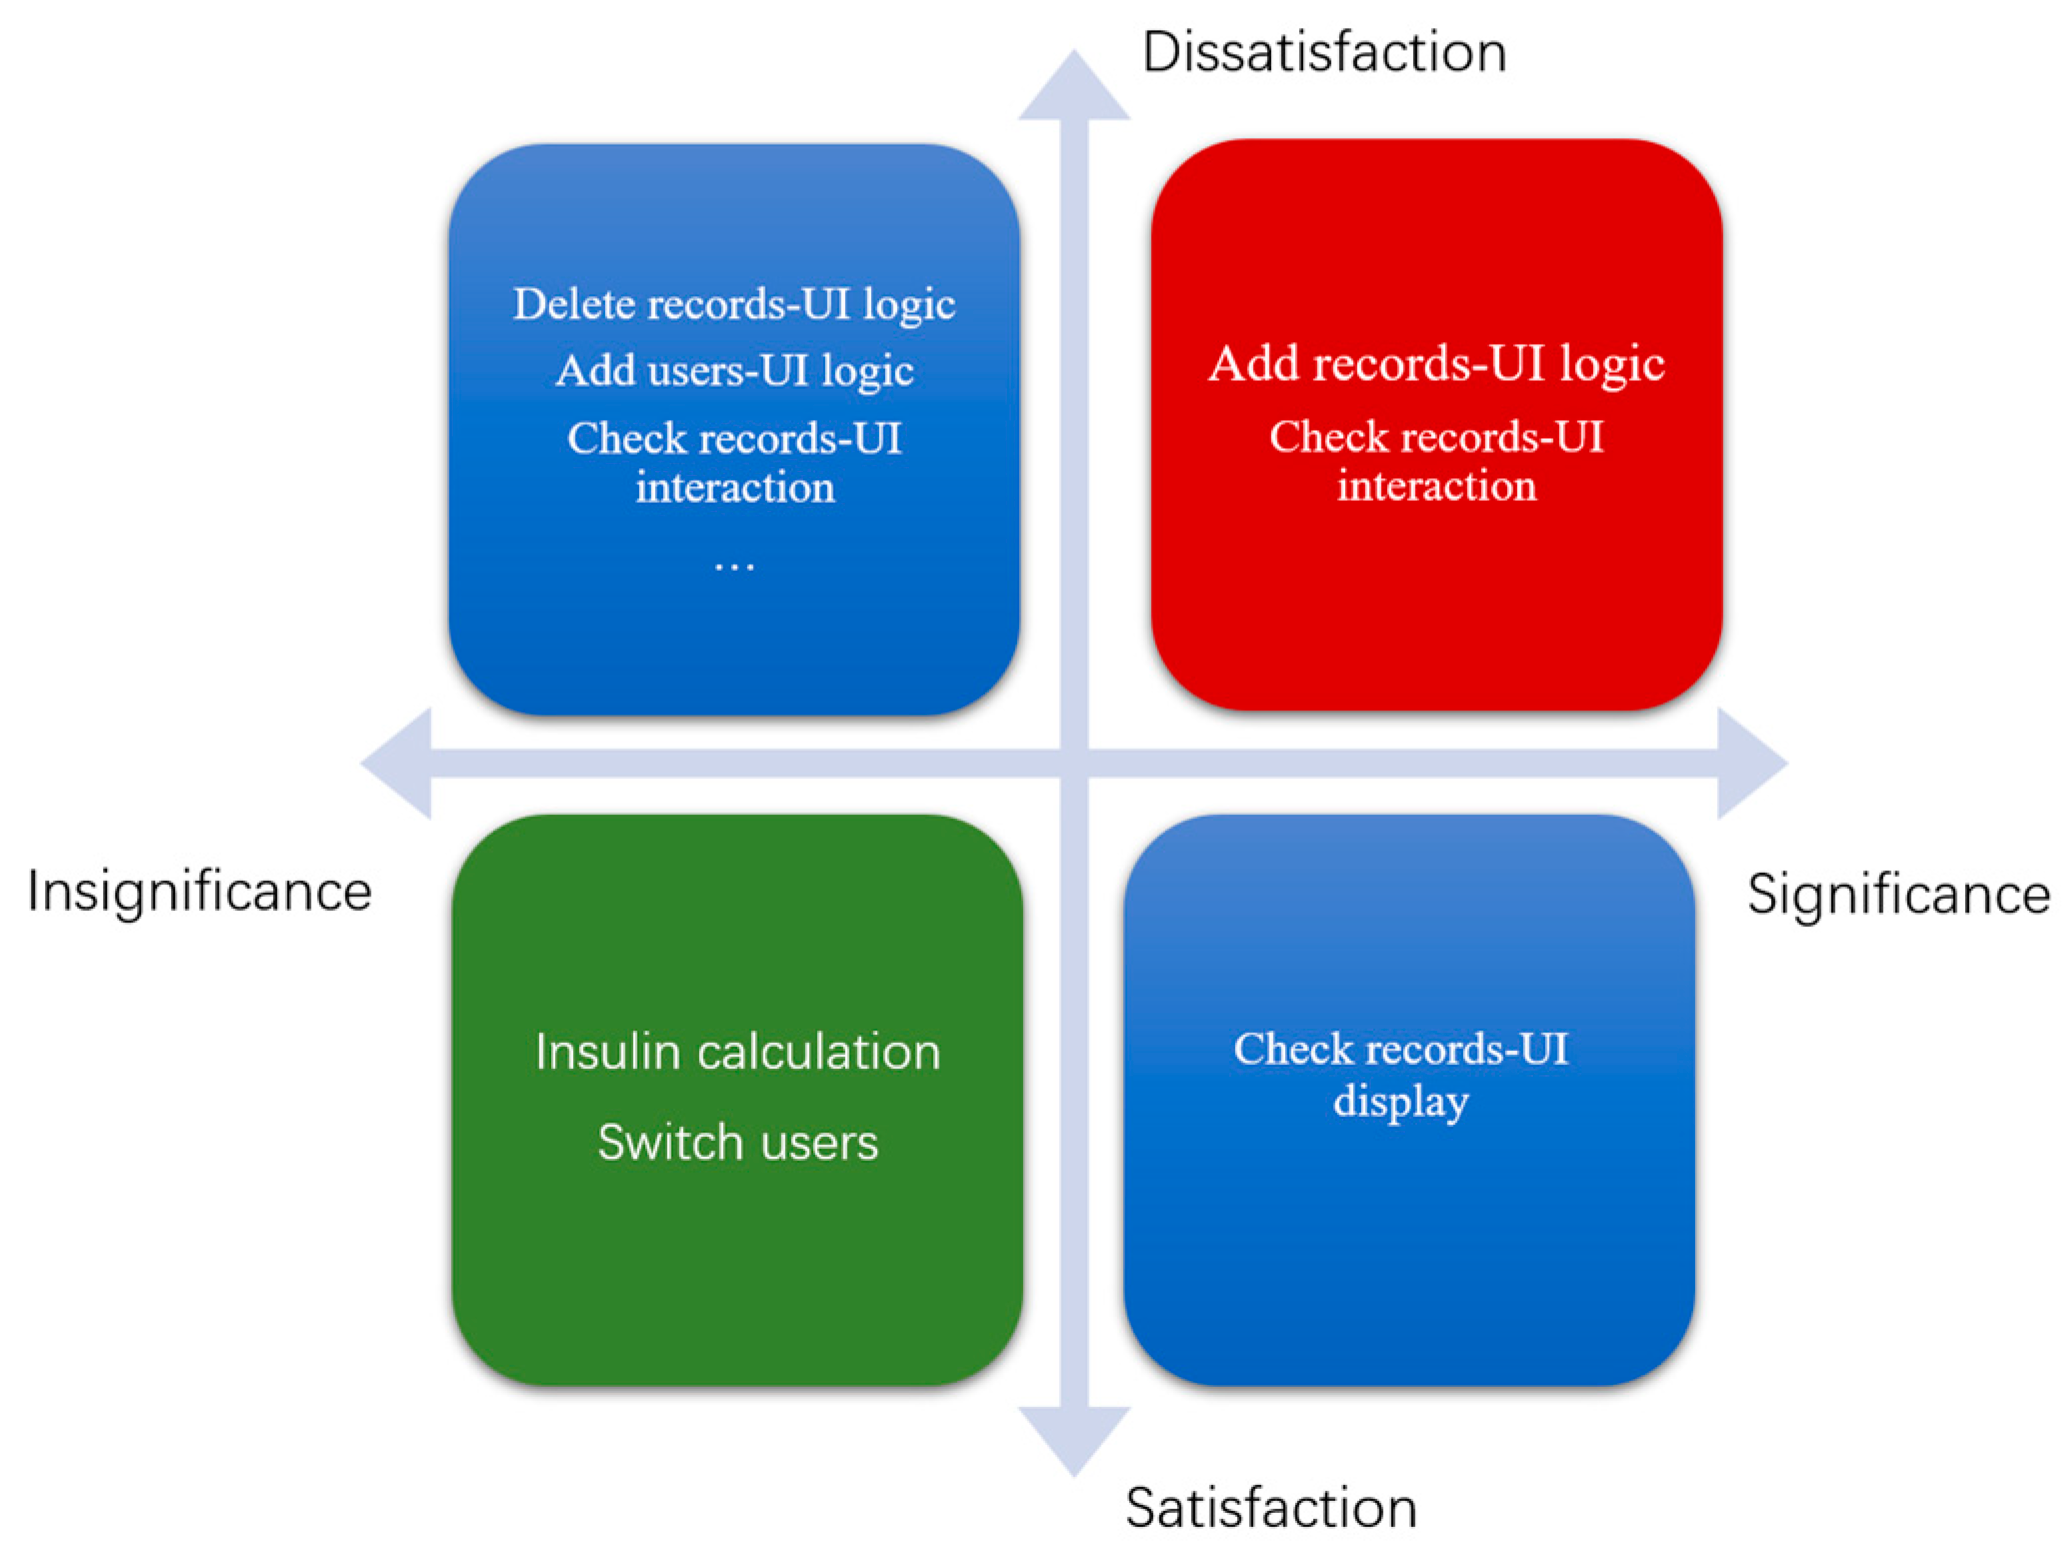
| Subtasks | Risk Description | Source of Risk | Risk Impact | Number of Occurrences | Is It Mission-Critical | Suggestions for Improvement |
|---|---|---|---|---|---|---|
| Add records | Blood glucose record added to the entrance is unknown | Interface navigation defects | Time-consuming increase in record addition | 6 | No | Add guidance tips |
| Add records | Time slot modification portal is not easy to find | Interface navigation defects | Modification time consumption increased | 6 | No | Add guidance tips |
| Check records | Blood glucose units are not visible enough | Interface display defects | Wrong perception of blood glucose amount may cause injury or death | 6 | Yes | Click on the blank form |
| Check records | Check the record time period modification method lack of consistency | Task interaction defects | Lower user satisfaction | 9 | No | Uniform time period modification method |
| Subtasks | Risk Description | Source of Risk | Risk Impact | Number of Occurrences | Is It Mission-Critical | Suggestions for Improvement |
|---|---|---|---|---|---|---|
| Add records | The step to add blood glucose records is unknown | Interface navigation defects | Time-consuming increase in record addition | 5 | No | Add guidance tips |
| Add records | Ambiguous meaning of time zones | The meaning of the text is not clear | Unclear concept of blood glucose time recording | 3 | Yes | Adjust expressions in records |
| Add records | Time portal is difficult to find | Interface navigation defects | Interface navigation defects | 6 | No | Add guidance tips |
| Add records | Forgot to add weight information | Interface navigation defects | Easy to lead to imperfect information | 3 | No | Add guidance tips |
| Impact | First Tier | Second Tier | Third Tier |
|---|---|---|---|
| Interface interaction | UI logic | Menu | Main menu, sub-menu, menu tabs… |
| Navigation | Main menu navigation, list navigation, search navigation… | ||
| Icons | Static icons, dynamic icons | ||
| Pop-up window | Notification pop-ups, warning pop-ups, type pop-ups… | ||
| Interface design | UI display | Menu interface | |
| Status screen | Preview interface, multimedia content management interface, browsing interface… | ||
| Function interface | Keying interface, search interface, photo interface… | ||
| Other interface | Opening screen | ||
| Interface interaction | UI interaction | Interaction task | Confirm, enter, terminate… |
| Interaction feedback | Send, save, delete… | ||
| Interface interaction Interface design | UI components | Interface area | Navigation bar, title area, content area… |
| List type | Single selection list, multiple selection list, markable list… | ||
| Operating components | Scrollbars, radio buttons, checkboxes… | ||
| Text | Label name, column name… |
| DGP | ICC | Fisher’s Exact Test | |||||
|---|---|---|---|---|---|---|---|
| Value | 95% Confidence Interval | p | Value | Monte Carlo Significance | |||
| Lower | Upper | ||||||
| Interface design | Single | 0.839 | 0.704 | 0.916 | <0.01 | 41.365 | <0.01 |
| AVE | 0.913 | 0.827 | 0.956 | <0.01 | |||
| Interaction mode | Single | 0.494 | 0.064 | 0.766 | 0.014 | 60.792 | <0.01 |
| AVE | 0.661 | 0.121 | 0.867 | 0.014 | |||
| Functional practicability | Single | 0.687 | 0.479 | 0.822 | <0.01 | 31.296 | 0.019 |
| AVE | 0.814 | 0.648 | 0.902 | <0.01 | |||
| Item | SUS Score | Usability Score | Learning Score |
|---|---|---|---|
| All | 57.79 ± 14.85 | 60.04 ± 17.21 | 58.09 ± 20.98 |
| Group A | 60.68 ± 16.45 | 59.38 ± 19.36 | 65.91 ± 17.75 |
| Group B | 52.50 ± 9.24 | 61.25 ± 12.25 | 43.75 ± 18.75 |
| Item | SUS Score | Usability Score | Learning Score |
|---|---|---|---|
| All | 71.67 ± 5.44 | 73.25 ± 4.76 | 67.35 ± 7.96 |
| Group A | 73.25 ± 7.85 | 71.50 ± 10.57 | 67.74 ± 13.40 |
| Group B | 66.75 ± 3.86 | 78.50 ± 5.58 | 66.03 ± 13.25 |
| User | Time to First Fixation(s) | Total Fixation Duration(s) | Fixation Count(times) | Total Visit Duration(s) |
|---|---|---|---|---|
| U1 | 0.00 | 3.76 | 14 | 12.94 |
| U2 | 0.00 | 1.95 | 7 | 3.37 |
| U3 | 0.00 | 2.51 | 9 | 3.15 |
| U4 | 3.02 | 1.71 | 10 | 3.58 |
| U5 | 1.10 | 3.85 | 12 | 4.31 |
| U6 | 0.00 | 2.74 | 11 | 3.90 |
| U7 | 1.45 | 3.22 | 9 | 3.53 |
| U8 | 2.16 | 3.12 | 11 | 3.98 |
| U9 | 0.30 | 2.79 | 7 | 4.27 |
| U10 | 0.00 | 3.72 | 8 | 7.85 |
| U11 | 0.00 | 6.60 | 17 | 8.90 |
| U12 | 0.00 | 6.32 | 13 | 5.33 |
| U13 | 4.42 | 4.16 | 14 | 7.90 |
| U14 | 0.01 | 3.65 | 13 | 5.25 |
| U15 | 0.74 | 0.82 | 4 | 5.94 |
| U16 | 0.00 | 4.40 | 13 | 3.92 |
| U17 | 0.97 | 3.23 | 12 | 4.35 |
| U18 | 0.00 | 3.70 | 11 | 3.58 |
| Information entropy | 0.97 | 0.95 | 0.95 | 0.97 |
| Weight | 0.20 | 0.30 | 0.32 | 0.18 |
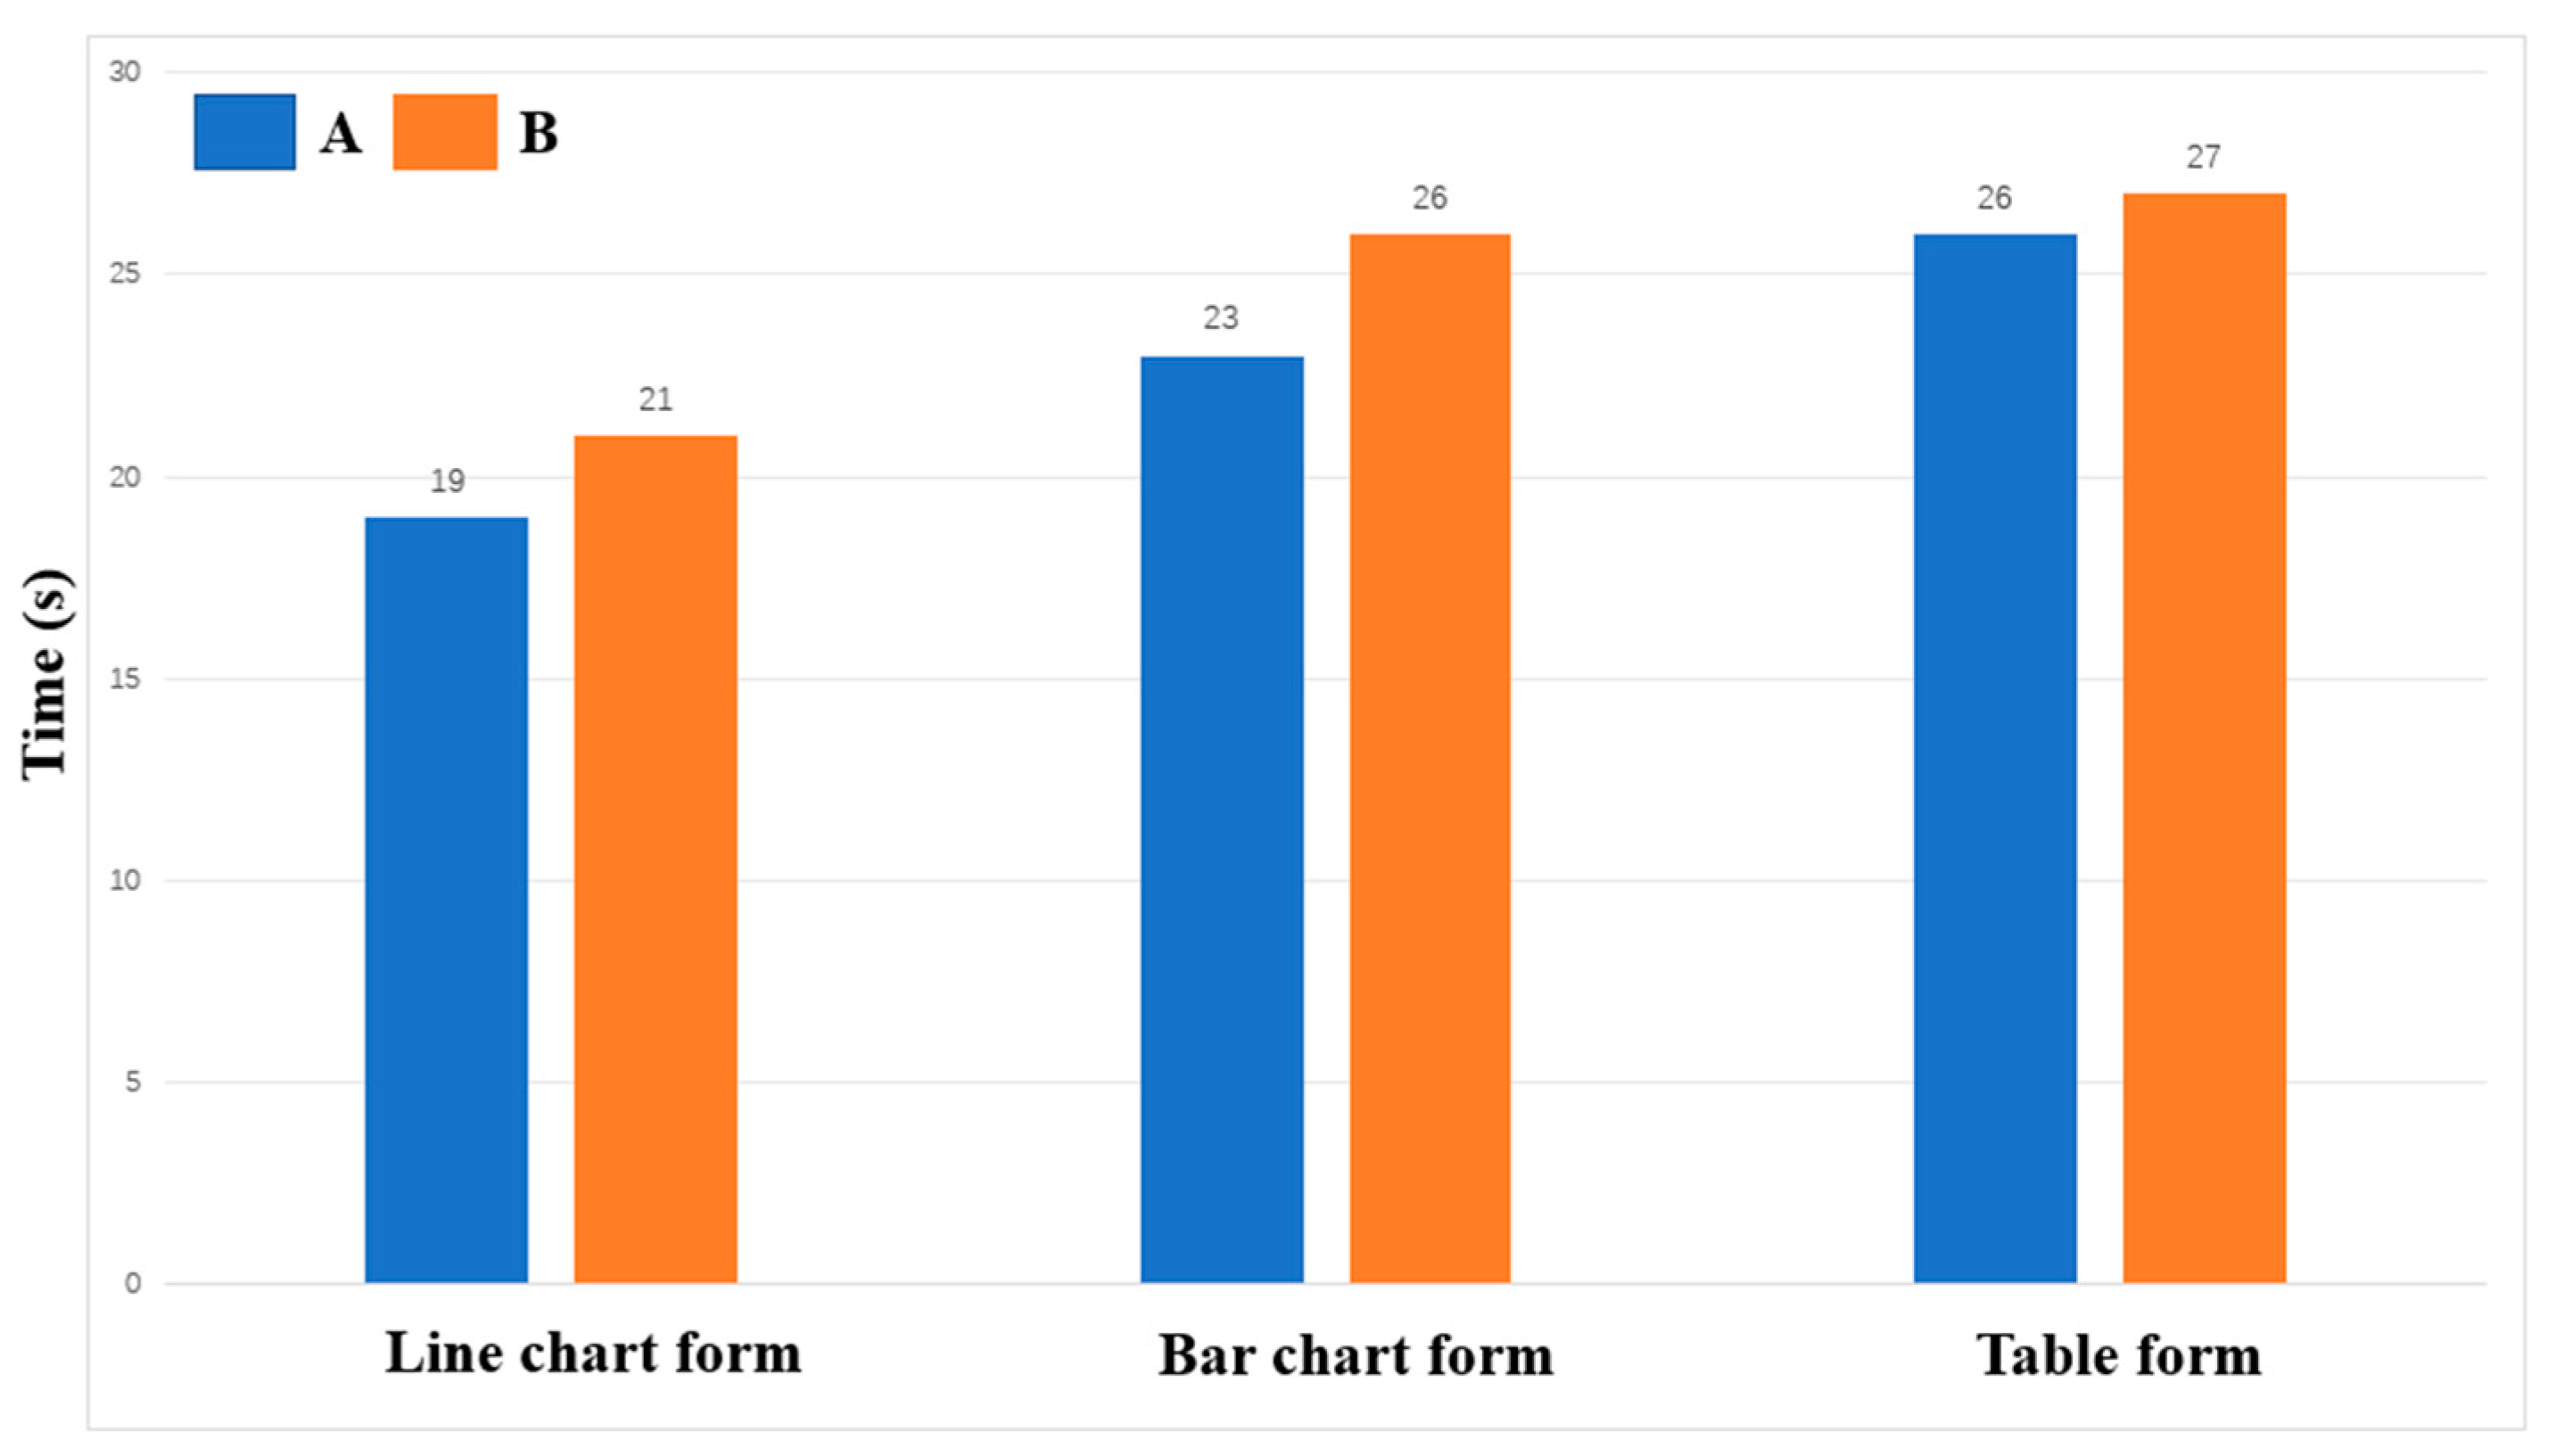
| Form | Time to First Fixation(s) | Total Fixation Duration(s) | Fixation Count(times) | Total Visit Duration(s) | Comprehensive Score |
|---|---|---|---|---|---|
| Line graph | 0.79 | 3.45 | 10.83 | 5.33 | 5.62 |
| Bar graph | 0.83 | 3.44 | 10.65 | 4.91 | 4.75 |
| Table | 0.87 | 3.52 | 10.86 | 4.99 | 4.04 |
| Ave | 0.83 | 3.47 | 10.78 | 5.08 | 4.80 |
| Form | Time to First Fixation(s) | Total Fixation Duration(s) | Fixation Count(times) | Total Visit Duration(s) | Comprehensive Score |
|---|---|---|---|---|---|
| Line graph | 0.73 | 3.47 | 7.90 | 4.53 | 4.78 |
| Bar graph | 0.86 | 3.23 | 8.42 | 5.01 | 4.03 |
| Table | 0.79 | 3.19 | 10.73 | 4.77 | 3.67 |
| Ave | 0.79 | 3.30 | 9.01 | 4.77 | 4.16 |
| Form | Group A First Round | Group A Second Round | Group A First Round | Group A Second Round |
|---|---|---|---|---|
| Line graph | 5.23 | 4.98 | 6.01 | 4.58 |
| Bar graph | 4.91 | 4.15 | 4.59 | 3.91 |
| Table | 3.76 | 3.49 | 4.32 | 3.85 |
| Ave | 4.63 | 4.21 | 4.97 | 4.11 |
Disclaimer/Publisher’s Note: The statements, opinions and data contained in all publications are solely those of the individual author(s) and contributor(s) and not of MDPI and/or the editor(s). MDPI and/or the editor(s) disclaim responsibility for any injury to people or property resulting from any ideas, methods, instructions or products referred to in the content. |
© 2024 by the authors. Licensee MDPI, Basel, Switzerland. This article is an open access article distributed under the terms and conditions of the Creative Commons Attribution (CC BY) license (https://creativecommons.org/licenses/by/4.0/).
Share and Cite
Shen, Y.; Wang, S.; Shen, Y.; Tan, S.; Dong, Y.; Qin, W.; Zhuang, Y. Evaluating the Usability of mHealth Apps: An Evaluation Model Based on Task Analysis Methods and Eye Movement Data. Healthcare 2024, 12, 1310. https://doi.org/10.3390/healthcare12131310
Shen Y, Wang S, Shen Y, Tan S, Dong Y, Qin W, Zhuang Y. Evaluating the Usability of mHealth Apps: An Evaluation Model Based on Task Analysis Methods and Eye Movement Data. Healthcare. 2024; 12(13):1310. https://doi.org/10.3390/healthcare12131310
Chicago/Turabian StyleShen, Yichun, Shuyi Wang, Yuhan Shen, Shulian Tan, Yue Dong, Wei Qin, and Yiwei Zhuang. 2024. "Evaluating the Usability of mHealth Apps: An Evaluation Model Based on Task Analysis Methods and Eye Movement Data" Healthcare 12, no. 13: 1310. https://doi.org/10.3390/healthcare12131310
APA StyleShen, Y., Wang, S., Shen, Y., Tan, S., Dong, Y., Qin, W., & Zhuang, Y. (2024). Evaluating the Usability of mHealth Apps: An Evaluation Model Based on Task Analysis Methods and Eye Movement Data. Healthcare, 12(13), 1310. https://doi.org/10.3390/healthcare12131310