
Impact of Education as a Social Determinant on the Risk of Type 2 Diabetes Mellitus in Korean Adults

Abstract
:1. Introduction
2. Materials and Methods
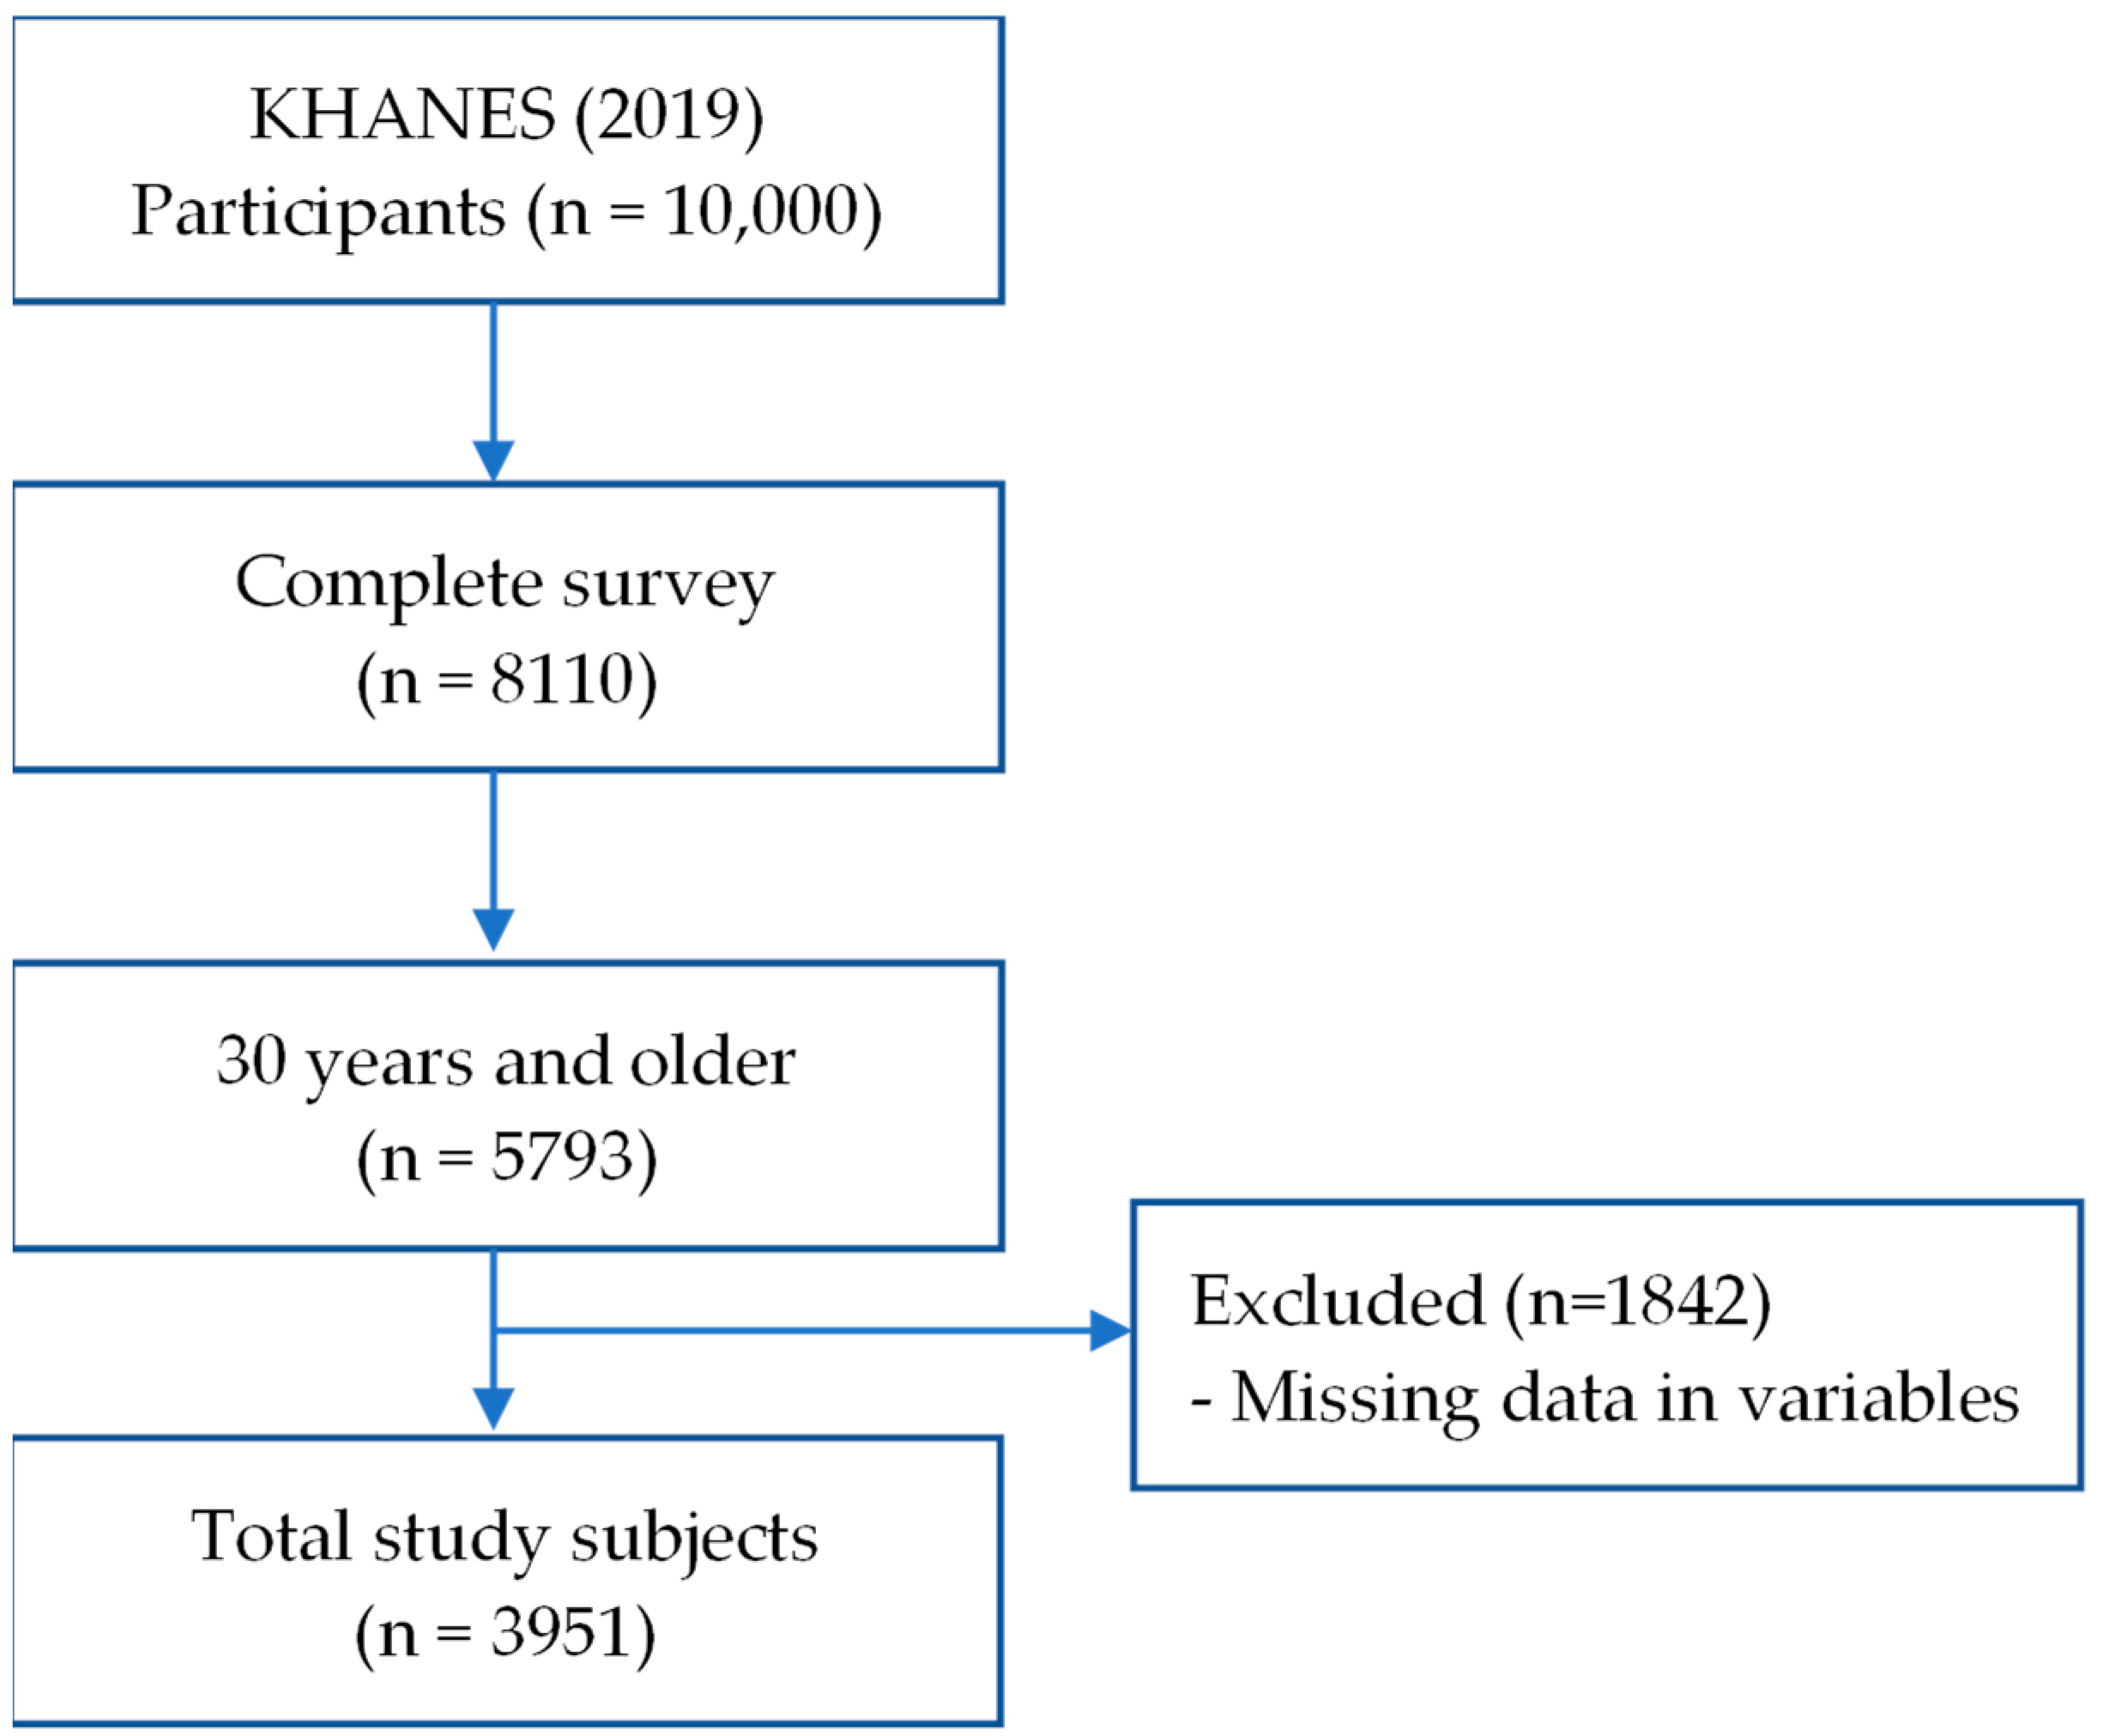
2.1. Data
2.2. Model for Health Equity in Type 2 Diabetes Mellitus
2.3. Structural Determinant
2.4. Intermediary Determinants
2.5. Statistical Analysis
3. Results
3.1. Prevalence of T2DM According to Biological Factors and Health Behaviors
3.2. Comparison of Educational Attainment by Health-Related Characteristics
3.3. Logistic Regression Analysis for the Effect of Education on the Risk of T2DM
4. Discussion
5. Conclusions
Author Contributions
Funding
Institutional Review Board Statement
Informed Consent Statement
Data Availability Statement
Conflicts of Interest
References
- Felicia, H.B.; Nancy, E.A.; Seth, A.B.; Marshall, H.C.; Tiffany, L.G.W.; Ana, N.A.; Pamela, L.T.; Debra, H.J. Social Determinants of Health and Diabetes: A Scientific Review. Diabetes Care 2021, 44, 258–279. [Google Scholar] [CrossRef]
- Maness, S.B.; Merrell, L.; Thompson, E.L.; Griner, S.B.; Kline, N.; Wheldon, C. Social Determinants of Health and Health Disparities: COVID-19 Exposures and Mortality among African American People in the United States. Public Health Rep. 2021, 136, 18–22. [Google Scholar] [CrossRef]
- Hacker, K.; Auerbach, J.; Ikeda, R.; Philip, C.; Houry, D.; SDOH Task Force. Social Determinants of Health—An Approach Taken at CDC. J. Public Health Manag. Pract. 2022, 28, 589–594. [Google Scholar] [CrossRef]
- World Health Organization. Closing the Gap in a Generation: Health Equity through Action on the Social Determinants of Health; World Health Organization: Geneva, Switzerland, 2008; Available online: https://www.who.int/publications/i/item/WHO-IER-CSDH-08.1 (accessed on 7 June 2022).
- Mikkonen, J.; Raphael, D. Social Determinants of Health: The Canadian Facts; York University School of Health Policy and Management: Toronto, ON, Canada, 2010; Available online: https://thecanadianfacts.org/the_canadian_facts.pdf (accessed on 12 June 2022).
- World Health Organization. World Health Report 2008—Primary Health Care: No. More Than Ever; World Health Organization: Geneva, Switzerland, 2008; Available online: https://apps.who.int/iris/handle/10665/43949 (accessed on 21 June 2022).
- World Health Organization; Office of World Health Reporting. The World Health Report: 2002: Reducing Risks, Promoting Healthy Life: Overview; World Health Organization: Geneva, Switzerland, 2002; Available online: https://apps.who.int/iris/handle/10665/67454 (accessed on 23 June 2022).
- Zinman, B.; Ruderman, N.; Campaigne, B.N.; Devlin, J.T.; Schneider, S.H.; American Diabetes Association. Physical activity/exercise and diabetes mellitus. Diabetes Care 2003, 26, 73–77. [Google Scholar] [CrossRef]
- Ronald, J.; Sigal, G.P.; Kenny, D.H.; Wasserman, C.C.; Russell, D.W. Physical Activity/Exercise and Type 2 Diabetes: A consensus statement from the American Diabetes Association. Diabetes Care 2006, 29, 1433–1438. [Google Scholar] [CrossRef]
- Williams, E.D.; Tapp, R.J.; Magliano, D.J.; Shaw, J.E.; Zimmet, P.Z.; Oldenburg, B.F. Health behaviours, socioeconomic status and diabetes incidence: The Australian diabetes obesity and lifestyle study (AusDiab). Diabetologia 2010, 53, 2538–2545. [Google Scholar] [CrossRef]
- Maddatu, J.; Anderson-Baucum, E.; Evans-Molina, C. Smoking and the risk of type 2 diabetes. Transl. Res. J. Lab. Clin. Med. 2017, 184, 101–107. [Google Scholar] [CrossRef]
- Holst, C.; Becker, U.; Jørgensen, M.E.; Grønbæk, M.; Tolstrup, J.S. Alcohol drinking patterns and risk of diabetes: A cohort study of 70,551 men and women from the general Danish population. Diabetologia 2017, 60, 1941–1950. [Google Scholar] [CrossRef]
- Zimmet, P.Z. Kelly West Lecture 1991. Challenges in diabetes epidemiology-from West to the rest. Diabetes Care 1992, 15, 232–252. [Google Scholar] [CrossRef] [PubMed]
- Robbins, J.M.; Vaccarino, V.; Zhang, H.; Kasl, S.V. Socioeconomic status and type 2 diabetes in African American and non-Hispanic white women and men: Evidence from the third national health and nutrition examination survey. Am. J. Public Health 2001, 91, 76–83. [Google Scholar] [CrossRef] [PubMed]
- Ko, G.T.; Chan, J.C.; Yeung, V.T.; Chow, C.C.; Tsang, L.W.; Cockram, C.S. A low socioeconomic status is an additional risk factor for glucose intolerance in high risk Hong Kong Chinese. Eur. J. Epidemiol. 2001, 17, 289–295. [Google Scholar] [CrossRef] [PubMed]
- Centers for Disease Control and Prevention (CDC). Socioeconomic status of women with diabetes—United States, 2000. MMWR Morb. Mortal. Wkly. Rep. 2002, 51, 147–148, 159. Available online: https://www.cdc.gov/mmwr/preview/mmwrhtml/mm5107a3.htm (accessed on 14 July 2022).
- Rabi, D.M.; Edwards, A.L.; Southern, D.A.; Svenson, L.W.; Sargious, P.M.; Norton, P.; Larsen, E.T.; Ghali, W.A. Association of socio-economic status with diabetes prevalence and utilization of diabetes care services. BMC Health Serv. Res. 2006, 6, 124. [Google Scholar] [CrossRef] [PubMed]
- Agardh, E.E.; Ahlbom, A.; Andersson, T.; Efendic, S.; Grill, V.; Hallqvist, J.; Östenson, C.G. Socio-economic position at three points in life in association with type 2 diabetes and impaired glucose tolerance in middle-aged Swedish men and women. Int. J. Epidemiol. 2007, 36, 84–92. [Google Scholar] [CrossRef] [PubMed]
- World Health Organization. Regional Office for South-East Asia. Health Literacy Toolkit for Low- and Middle-Incomecountries. 2015. Available online: https://apps.who.int/iris/handle/10665/205244 (accessed on 30 May 2023).
- Liu, L.; Qian, X.; Chen, Z.; He, T. Health literacy and its effect on chronic disease prevention: Evidence from China’s data. BMC Public Health 2020, 20, 690. [Google Scholar] [CrossRef] [PubMed]
- Matthew, J.O.; Robert, C.; Whitaker, D.Y.; Ronald, T.A. The comparative efficacy of lifestyle intervention and metformin by educational attainment in the Diabetes Prevention Program. Prev. Med. 2015, 77, 125–130. [Google Scholar] [CrossRef]
- GBD 2019 Diseases and Injuries Collaborators. Global burden of 369 diseases and injuries in 204 countries and territories, 1990–2019: A systematic analysis for the Global Burden of Disease Study 2019. Lancet 2020, 396, 1204–1222. [Google Scholar] [CrossRef] [PubMed]
- International Diabetes Federation. IDF Diabetes Atlas, 10th ed.; International Diabetes Federation: Brussels, Belgium, 2021; Available online: https://diabetesatlas.org/atlas/tenth-edition/ (accessed on 10 August 2022).
- Bae, J.H.; Han, K.D.; Ko, S.H.; Yang, Y.S.; Choi, J.H.; Choi, K.M.; Kwon, H.S.; Won, K.C. Diabetes Fact Sheet in Korea 2021. Diabetes Metab. J. 2022, 46, 417–426. [Google Scholar] [CrossRef] [PubMed]
- Shin, H.Y.; Kim, J.; Lee, S.; Park, M.S.; Park, S.; Huh, S. Cause-of-death statistics in 2018 in the Republic of Korea. J. Korean Med. Assoc. 2020, 63, 286–297. [Google Scholar] [CrossRef]
- Oh, S.H.; Ku, H.; Park, K.S. Prevalence and socioeconomic burden of diabetes mellitus in South Korean adults: A population-based study using administrative data. BMC Public Health 2021, 21, 548. [Google Scholar] [CrossRef]
- Solar, O.; and Irwin, A.; Solar, O.; Irwin, A. Social determinants, political contexts and civil society action: A historical perspective on the Commission on Social Determinants of Health. Health Promot. J. Aust. 2006, 17, 180–185. [Google Scholar] [CrossRef] [PubMed]
- Irwin, A. A Conceptual Framework for Action on the Social Determinants of Health; World Health Organization: Geneva, Switzerland, 2010; Available online: https://www.who.int/publications/i/item/9789241500852 (accessed on 10 September 2022).
- Anja, K.; Agnes, M. Health in global context; beyond the social determinants of health? Glob. Health Action 2014, 7, 23506. [Google Scholar] [CrossRef]
- National Academies of Sciences, Engineering, and Medicine. A Framework for Educating Health Professionals to Address the Social Determinants of Health; The National Academies Press: Washington, DC, USA, 2016. [Google Scholar] [CrossRef]
- Kim, Y. The Korea National Health and nutrition examination survey (KNHANES): Current status and challenges. Epidemiol. Health 2014, 36, e2014002. [Google Scholar] [CrossRef] [PubMed]
- Korea Disease Control and Prevention Agency. Guidebook for Using the 8th Korean National Health and Nutrition Exam-Ination Survey (KNHANES VIII). 2019. Available online: https://knhanes.kdca.go.kr/knhanes/sub03/sub03_02_05.do (accessed on 21 September 2022).
- Oh, K.; Kim, Y.; Kweon, S.; Kim, S.; Yun, S.; Park, S.; Lee, Y.K.; Kim, Y.; Park, O.; Jeong, E.K. Korea National Health and Nutrition Examination Survey, 20th anniversary: Accomplishments and future directions. Epidemiol. Health 2021, 43, e2021025. [Google Scholar] [CrossRef] [PubMed]
- Hutchinson, M.S.; Joakimsen, R.M.; Njølstad, I.; Schirmer, H.; Figenschau, Y.; Svartberg, J.; Jorde, R. Effects of Age and Sex on Estimated Diabetes Prevalence Using Different Diagnostic Criteria: The Tromsø OGTT Study. Int. J. Endocrinol. 2013, 2013, 613475. [Google Scholar] [CrossRef]
- Shi, L.; Shu, X.O.; Li, H.; Cai, H.; Liu, Q.; Zheng, W.; Xiang, Y.B.; Villegas, R. Physical activity, smoking, and alcohol consumption in association with incidence of type 2 diabetes among middle-aged and elderly Chinese men. PLoS ONE 2013, 8, e77919. [Google Scholar] [CrossRef] [PubMed]
- Gray, N.; Picone, G.; Sloan, F.; Yashkin, A. Relation between BMI and diabetes mellitus and its complications among US older adults. South Med. J. 2015, 108, 29–36. [Google Scholar] [CrossRef] [PubMed]
- Sluijs, I.; Beulens, J.W.; van der Schouw, Y.T.; van der A, D.L.; Buckland, G.; Kuijsten, A.; Schulze, M.B.; Amiano, P.; Ardanaz, E.; Balkau, B.; et al. Dietary glycemic index, glycemic load, and digestible carbohydrate intake are not associated with risk of type 2 diabetes in eight European countries. J. Nutr. 2013, 143, 93–99. [Google Scholar] [CrossRef] [PubMed]
- American Diabetes Association. Diagnosis and classification of diabetes mellitus. Diabetes Care 2010, 33 (Suppl. S1), S62–S69. [Google Scholar] [CrossRef]
- Korea Disease Control and Prevention Agency. Clinical Laboratory Test for the Seventh Korea National Health and Nutrition Examination Survey (2016–2018). 2018. Available online: https://scienceon.kisti.re.kr/srch/selectPORSrchReport.do?cn=TRKO201900000133 (accessed on 4 October 2022).
- Schillinger, D.; Barton, L.R.; Karter, A.J.; Wang, F.; Adler, N. Does literacy mediate the relationship between education and health outcomes? A study of a low-income population with diabetes. Public Health Rep. 2006, 121, 245–254. [Google Scholar] [CrossRef]
- Wang, T.; Zhao, Z.; Wang, G.; Li, Q.; Xu, Y.; Li, M.; Hu, R.; Chen, G.; Su, Q.; Mu, Y.; et al. Age-related disparities in diabetes risk attributable to modifiable risk factor profiles in Chinese adults: A nationwide, population-based, cohort study. Lancet Healthy Longev. 2021, 2, e618–e628. [Google Scholar] [CrossRef] [PubMed]
- Duclos, M.; Oppert, J.M.; Verges, B.; Coliche, V.; Gautier, J.F.; Guezennec, Y.; Reach, G.; Strauch, G.; SFD diabetes and physical activity working group. Physical activity and type 2 diabetes. Recommandations of the SFD (Francophone Diabetes Society) diabetes and physical activity working group. Diabetes Metab. 2013, 39, 205–216. [Google Scholar] [CrossRef] [PubMed]
- Austin, G.L.; Ogden, L.G.; Hill, J.O. Trends in carbohydrate, fat, and protein intakes and association with energy intake in normal-weight, overweight, and obese individuals: 1971–2006. Am. J. Clin. Nutr. 2011, 93, 836–843. [Google Scholar] [CrossRef] [PubMed]
- Hosseini, F.; Jayedi, A.; Khan, T.A.; Shab-Bidar, S. Dietary carbohydrate and the risk of type 2 diabetes: An updated systematic review and dose–response meta-analysis of prospective cohort studies. Sci. Rep. 2022, 12, 2491. [Google Scholar] [CrossRef] [PubMed]
- Seo, M.H.; Lee, W.Y.; Kim, S.S.; Kang, J.-H.; Kim, K.K.; Kim, B.-Y.; Kim, Y.H.; Kim, W.J.; Kim, E.M.; Kim, H.S.; et al. Corrigendum: 2018 Korean Society for the Study of Obesity Guideline for the Management of Obesity in Korea. J. Obes. Metab. Syndr. 2019, 28, 143. [Google Scholar] [CrossRef] [PubMed]
- Surwit, R.S.; Schneider, M.S.; Feinglos, M.N. Stress and diabetes mellitus. Diabetes Care 1992, 15, 1413–1422. [Google Scholar] [CrossRef] [PubMed]
- Hosmer, D.; Lemshow, S.; Sturdivant, R. Applied Logistic Regression; John Wiley & Sons: Hoboken, NJ, USA, 2013; Available online: https://onlinelibrary.wiley.com/doi/book/10.1002/9781118548387 (accessed on 11 October 2022).
- Cowie, C.C.; Casagrande, S.S.; Menke, A.; Cissell, M.A.; Eberhardt, M.S.; Meigs, J.B.; Gregg, E.W.; Knowler, W.C.; Barrett-Connor, E.; Becker, D.J.; et al. Diabetes in America, 3rd ed.; National Institute of Diabetes and Digestive and Kidney Diseases (US): Bethesda, MD, USA, 2018; Chapter 15. [Google Scholar]
- Sinclair, A.; Saeedi, P.; Kaundal, A.; Karuranga, S.; Malanda, B.; Williams, R. Diabetes and global ageing among 65–99-year-old adults: Findings from the International Diabetes Federation Diabetes Atlas, 9th edition. Diabetes Res. Clin. Pract. 2020, 162, 108078. [Google Scholar] [CrossRef] [PubMed]
- Xuanping, Z.; Michael, C.; Boon, P.N.; Elizabeth, E. The Relationship between Educational Attainment and Attrition Rates among Participants in the National Diabetes Prevention Program. Diabetes 2021, 70, 563. [Google Scholar] [CrossRef]
- Smith, J.P. Nature and causes of trends in male diabetes prevalence, undiagnosed diabetes, and the socioeconomic status health gradient. Proc. Natl. Acad. Sci. USA 2007, 104, 13225–13231. [Google Scholar] [CrossRef]
- Steele, C.J.; Schöttker, B.; Marshall, A.H.; Kouvonen, A.; O’Doherty, M.G.; Mons, U.; Saum, K.U.; Boffetta, P.; Trichopoulou, A.; Brenner, H.; et al. Education achievement and type 2 diabetes-what mediates the relationship in older adults? Data from the ESTHER study: A population-based cohort study. BMJ Open 2017, 7, e013569. [Google Scholar] [CrossRef]
- Tajdar, D.; Lühmann, D.; Fertmann, R.; Steinberg, T.; van den Bussche, H.; Scherer, M.; Schäfer, I. Low health literacy is associated with higher risk of type 2 diabetes: A cross-sectional study in Germany. BMC Public Health 2021, 21, 510. [Google Scholar] [CrossRef] [PubMed]
- Levin, K.A. Study design III: Cross-sectional studies. Evid.-Based Dent. 2006, 7, 24–25. [Google Scholar] [CrossRef]
- Dray-Spira, R.; Gary-Webb, T.L.; Brancati, F.L. Educational disparities in mortality among adults with diabetes in the U.S. Diabetes Care 2010, 33, 1200–1205. [Google Scholar] [CrossRef]
- Raghupathi, V.; Raghupathi, W. The influence of education on health: An empirical assessment of OECD countries for the period 1995–2015. Arch Public Health 2020, 78, 20. [Google Scholar] [CrossRef] [PubMed]
- The DECODE Study Group. Age- and Sex-Specific Prevalences of Diabetes and Impaired Glucose Regulation in 13 European Cohorts1. Diabetes Care 2003, 26, 61–69. [Google Scholar] [CrossRef] [PubMed]
- Alanazi, N.H.; Alsharif, M.M.; Rasool, G.; Alruwaili, A.B.H.; Alrowaili, A.M.Z.; Aldaghmi, A.S.; Al Shkra, M.K.D.; Alrasheedi, F.A.; Alenezi, G.S.; Alanazi, M.T. Prevalence of diabetes and its relation with age and sex in Turaif city, northern Saudi Arabia in 2016–2017. Electron. Physician 2017, 9, 5294–5297. [Google Scholar] [CrossRef]
- U.S. Department of Health and Human Services (USDHHS). Smoking and Diabetes Factsheet; U.S. Department of Health and Human Services, Centers for Disease Control and Prevention, National Center for Chronic Disease Prevention and Health Promotion, Office on Smoking and Health: Atlanta, GA, USA, 2014. Available online: https://www.cdc.gov/tobacco/sgr/50th-anniversary/index.htm#fact-sheets (accessed on 10 January 2023).
- Gill, J.M.; Cooper, A.R. Physical activity and prevention of type 2 diabetes mellitus. Sports Med. 2008, 38, 807–824. [Google Scholar] [CrossRef]
- Colberg, S.R.; Sigal, R.J.; Yardley, J.E.; Riddell, M.C.; Dunstan, D.W.; Dempsey, P.C.; Horton, E.S.; Castorino, K.; Tate, D.F. Physical Activity/Exercise and Diabetes: A Position Statement of the American Diabetes Association. Diabetes Care 2016, 39, 2065–2079. [Google Scholar] [CrossRef] [PubMed]
- Zimmet, P.Z. Diabetes and its drivers: The largest epidemic in human history? Clin. Diabetes Endocrinol. 2017, 3, 1. [Google Scholar] [CrossRef]
- Karina, F.; Mathias, L.; Gillian, R.; Richard, H.O.; Helle, T.M. Health Literacy Mediates the Relationship Between Educational Attainment and Health Behavior: A Danish Population-Based Study. J. Health Commun. 2016, 21, 54–60. [Google Scholar] [CrossRef]
- Huisman, M.; Kunst, A.E.; Andersen, O.; Bopp, M.; Borgan, J.K.; Borrell, C.; Costa, G.; Deboosere, P.; Desplanques, G.; Donkin, A.; et al. Socioeconomic inequalities in mortality among elderly people in 11 European populations. J. Epidemiol. Community Health 2004, 58, 468–475. [Google Scholar] [CrossRef] [PubMed]
- Ntarladima, A.M.; Karssenberg, D.; Poelman, M.; Grobbee, D.E.; Lu, M.; Schmitz, O.; Strak, M.; Janssen, N.; Hoek, G.; Vaartjes, I. Associations between the fast-food environment and diabetes prevalence in the Netherlands: A cross-sectional study. Lancet Planet. Health 2022, 6, e29–e39. [Google Scholar] [CrossRef] [PubMed]
- Haines, M.S.; Leong, A.; Porneala, B.C.; Meigs, J.B.; Miller, K.K. Association between muscle mass and diabetes prevalence independent of body fat distribution in adults under 50 years old. Nutr. Diabetes 2022, 12, 29. [Google Scholar] [CrossRef] [PubMed]
- Yen, F.S.; Wei, J.C.C.; Chiu, L.T.; Hsu, C.C.; Hwu, C.M. Diabetes, hypertension, and cardiovascular disease development. J. Transl. Med. 2022, 20, 9. [Google Scholar] [CrossRef]
- Ryu, K.S.; Kang, H.Y.J.; Lee, S.W.; Park, H.W.; You, N.Y.; Kim, J.H.; Hwangbo, Y.; Choi, K.S.; Cha, H.S. Screening Model for Estimating Undiagnosed Diabetes among People with a Family History of Diabetes Mellitus: A KNHANES-Based Study. Int. J. Environ. Res. Public Health 2020, 17, 8903. [Google Scholar] [CrossRef]


| Variable | Total | T2DM | χ2 | p-Value | |
|---|---|---|---|---|---|
| Yes | No | ||||
| n (%) | |||||
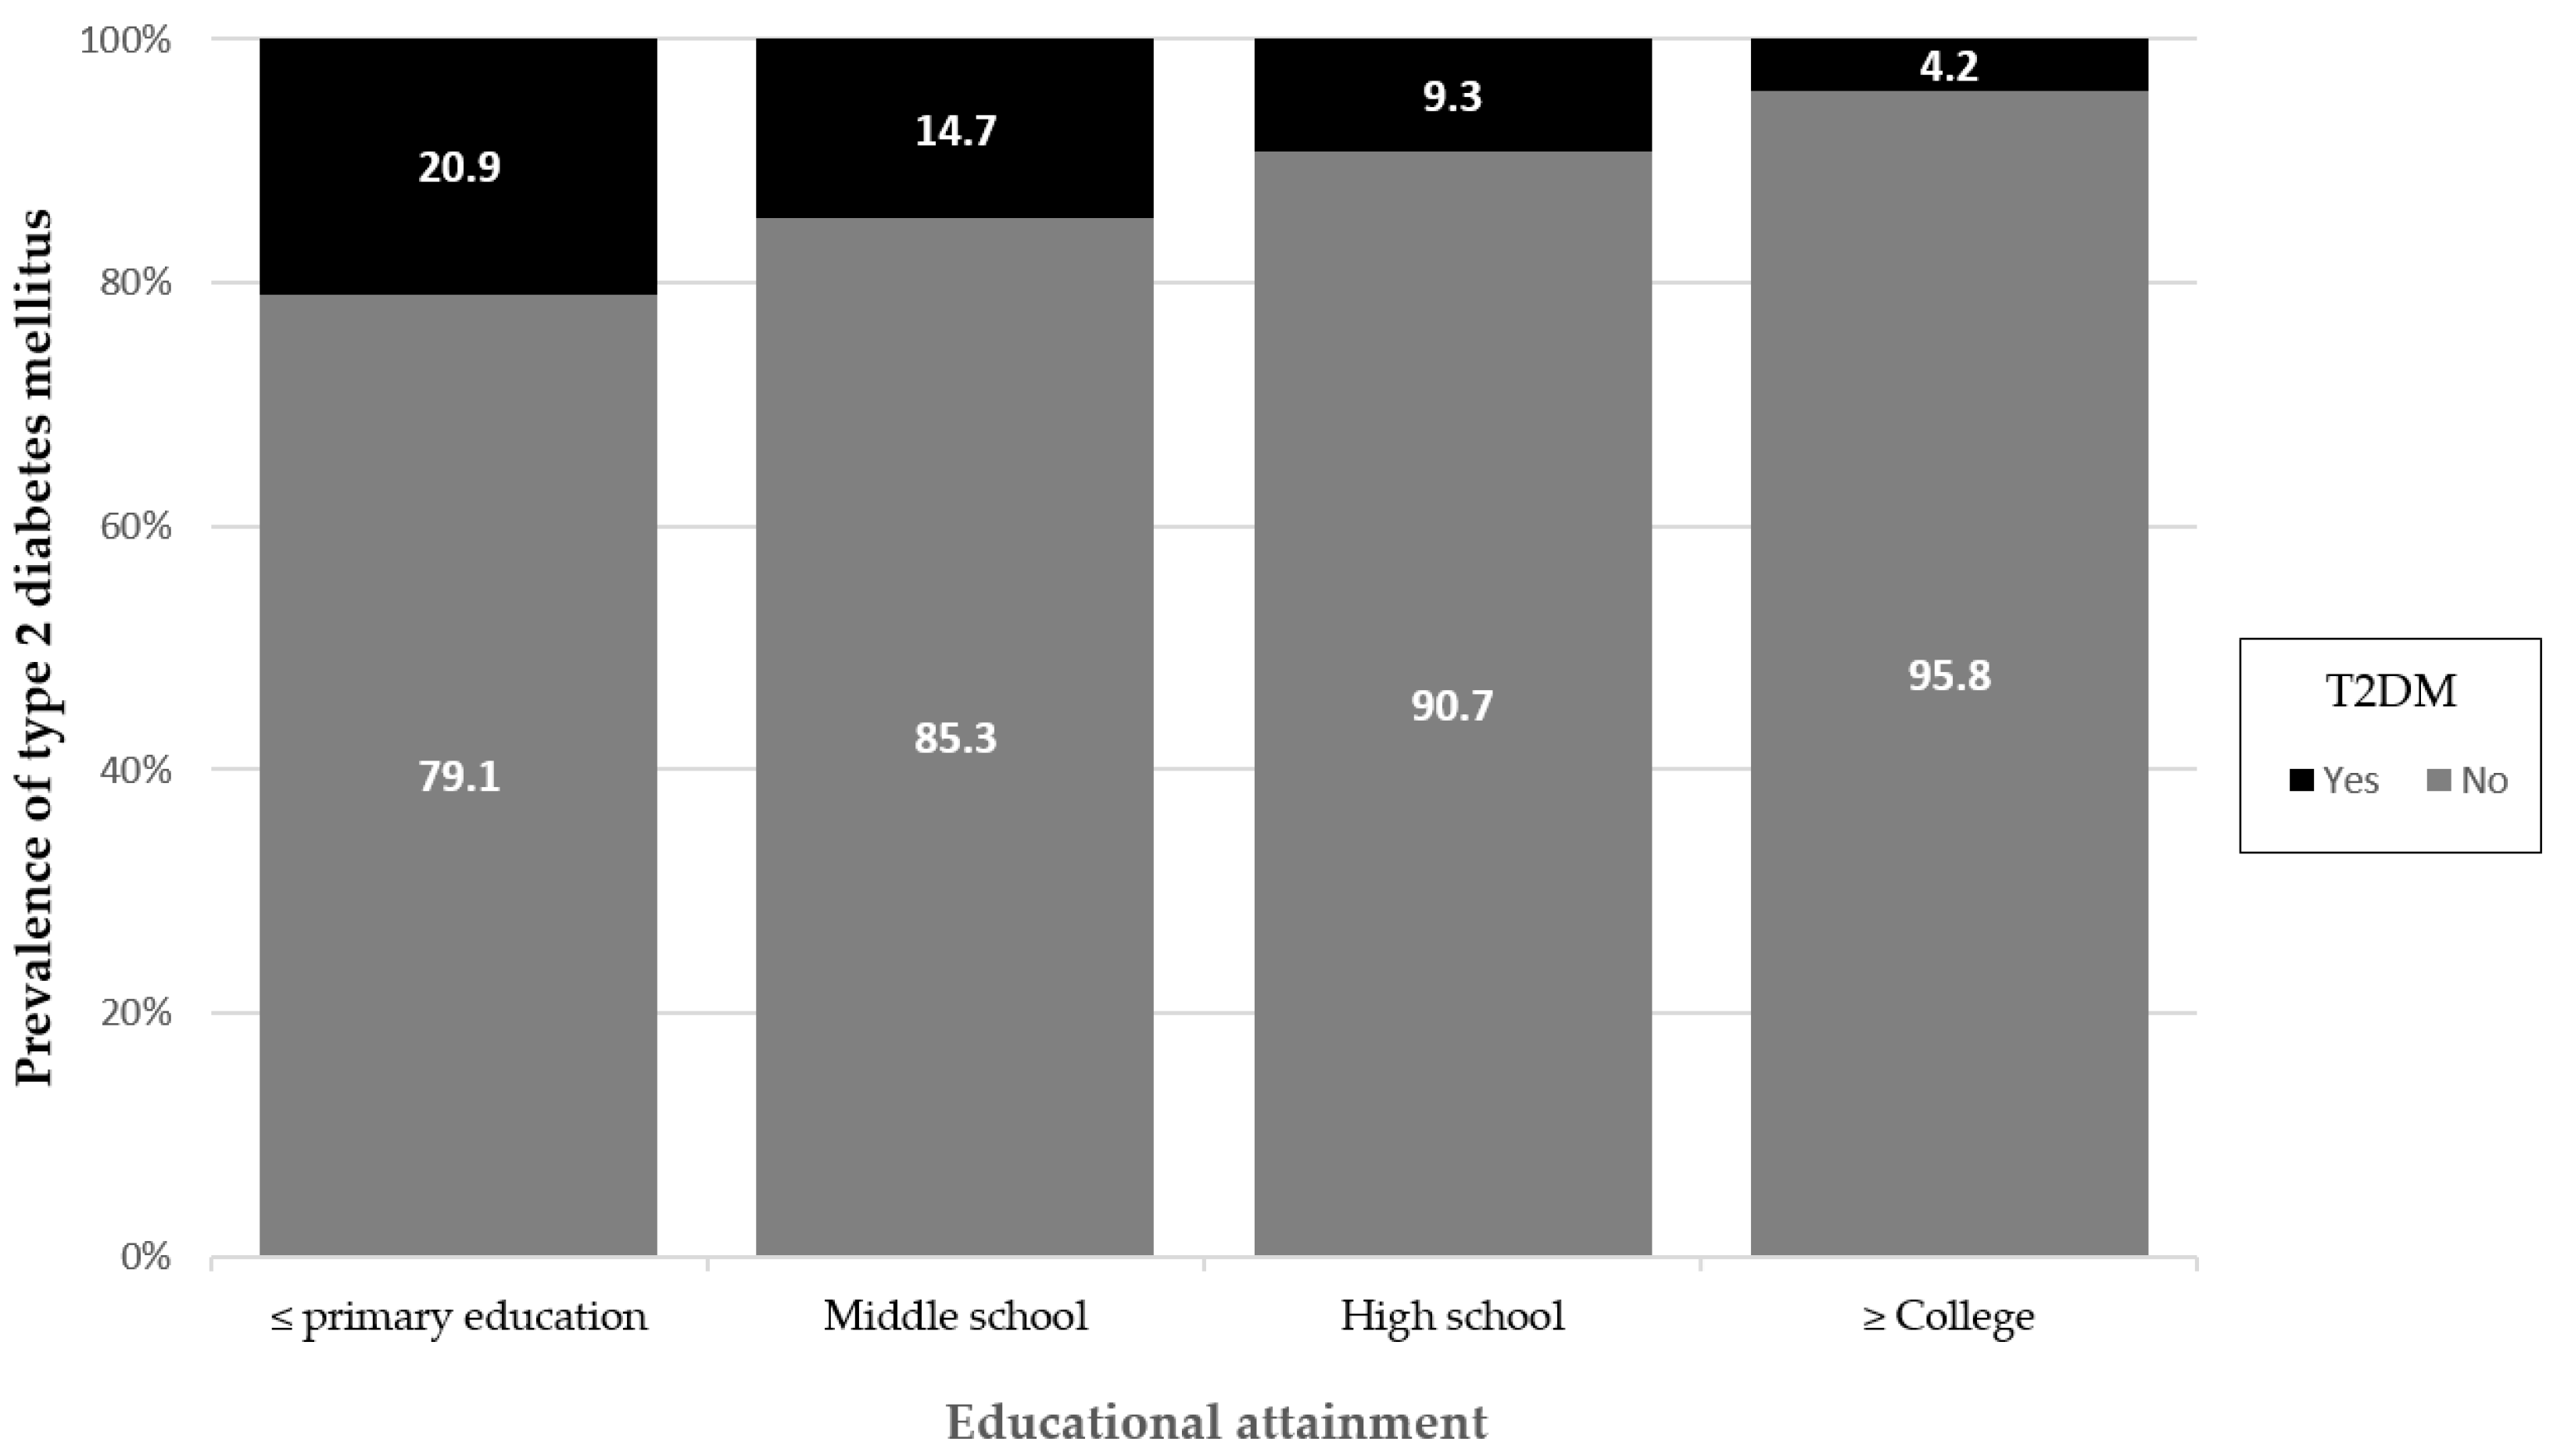
| Education level | 166.733 *** | <0.001 | |||
| ≤Primary education | 717 (18.1) | 150 (20.9) | 567 (79.1) | ||
| Middle school | 395 (10.0) | 58 (14.7) | 337 (85.3) | ||
| High school | 1231 (31.2) | 114 (9.3) | 1117 (90.7) | ||
| ≥College | 1608 (40.7) | 68 (4.2) | 1540 (95.8) | ||
| Sex | 21.137 *** | <0.001 | |||
| Male | 1794 (45.4) | 220 (12.3) | 1574 (87.7) | ||
| Female | 2157 (54.6) | 170 (7.9) | 1987 (92.1) | ||
| Age 1 | 00 ± 0.00 | 251.441 *** | <0.001 | ||
| 30–39 | 718 (18.2) | 8 (1.1) | 710 (98.9) | ||
| 40–49 | 900 (22.8) | 34 (3.9) | 866 (96.1) | ||
| 50–64 | 1301 (32.9) | 128 (9.8) | 1173 (90.2) | ||
| ≥65 | 1032 (26.1) | 220 (21.3) | 812 (78.7) | ||
| Drinking | 0.030 * | 0.821 | |||
| <2 times/week | 3005 (76.1) | 298 (9.9) | 2707 (90.1) | ||
| ≥2 times/week | 946 (23.9) | 92 (9.7) | 854 (90.3) | ||
| Smoking | 24.844 *** | <0.001 | |||
| Never | 2232 (56.5) | 179 (8.0) | 2053 (92.0) | ||
| Ex-smoker | 1046 (26.5) | 142 (13.6) | 904 (86.4) | ||
| Current smoker | 673 (17.0) | 69 (10.3) | 604 (89.7) | ||
| Physical activity 2 | 4.755 * | 0.024 | |||
| ≥150 min/week | 1653 (41.8) | 143 (8.7) | 1510 (91.3) | ||
| <150 min/week | 2298 (58.2) | 247 (10.7) | 2051 (89.3) | ||
| Carbohydrate intake 3 | 36.417 *** | <0.001 | |||
| <60% | 1585 (40.1) | 101 (6.4) | 1484 (93.6) | ||
| ≥60% | 2366 (59.9) | 289 (12.2) | 2077 (87.8) | ||
| Obesity 4 | 50.897 *** | <0.001 | |||
| No (25 > BMI) | 2580 (65.3) | 191 (7.4) | 2389 (92.6) | ||
| Yes (25 ≤ BMI) | 1371 (34.7) | 199 (14.5) | 1172 (85.5) | ||
| Stress | 1.230 | 0.245 | |||
| Moderate or less | 2958 (74.9) | 301 (10.2) | 2657 (89.8) | ||
| Severe or more | 993 (25.1) | 89 (9.0) | 904 (91.0) | ||
| Variable | Educational Attainment, n(%) | χ2 | |||
|---|---|---|---|---|---|
| ≤Primary Education | Middle School | High School | ≥College | ||
| Sex | 29.946 *** | ||||
| Male | 264 (14.7) | 188 (10.5) | 556 (31.0) | 786 (43.8) | |
| Female | 453 (21.0) | 207 (9.6) | 675 (31.3) | 822 (38.1) | |
| Age | 182.939 *** | ||||
| 30–39 | 8 (1.1) | 11 (1.5) | 155 (21.6) | 544 (75.8) | |
| 40–49 | 6 (0.7) | 26 (2.9) | 306 (34.0) | 562 (62.4) | |
| 50–64 | 163 (12.5) | 184 (14.1) | 558 (42.9) | 396 (30.4) | |
| ≥65 | 540 (52.3) | 174 (16.9) | 212 (20.5) | 106 (10.3) | |
| Drinking | 8.997 * | ||||
| <2 times/week | 565 (18.8) | 285 (9.5) | 916 (30.5) | 1239 (41.2) | |
| ≥2 times/week | 152 (16.1) | 110 (11.6) | 315 (33.3) | 369 (39.0) | |
| Smoking | 46.462 *** | ||||
| Never | 457 (20.5) | 201 (9.0) | 653 (29.3) | 921 (41.3) | |
| Ex-smoker | 177 (16.9) | 118 (11.3) | 312 (29.8) | 439 (42.0) | |
| Current smoker | 83 (12.3) | 76 (11.3) | 266 (39.5) | 248 (36.8) | |
| Physical activity | 70.179 *** | ||||
| ≥150 min/week | 209 (12.6) | 146 (8.8) | 548 (33.2) | 750 (45.4) | |
| <150 min/week | 508 (22.1) | 249 (10.8) | 683 (29.7) | 858 (37.3) | |
| Carbohydrate intake | 217.619 *** | ||||
| <60% | 142 (9.0) | 124 (7.8) | 496 (31.3) | 823 (51.9) | |
| ≥60% | 575 (24.3) | 271 (11.5) | 735 (31.1) | 785 (33.2) | |
| Obesity | 20.456 *** | ||||
| No (25 > BMI) | 432 (16.7) | 244 (9.5) | 794 (30.8) | 1110 (43.0) | |
| Yes (25 ≤ BMI) | 285 (20.8) | 151 (11.0) | 437 (31.9) | 498 (36.3) | |
| Stress | 14.439 ** | ||||
| Moderate or less | 554 (18.7) | 317 (10.7) | 926 (31.3) | 1161 (38.2) | |
| Severe or more | 163 (16.4) | 78 (7.9) | 305 (30.7) | 447 (45.0) | |
| Crude Model 1 | Adjusted Model 1 2 | Adjusted Model 2 3 | |||||||
|---|---|---|---|---|---|---|---|---|---|
| Variable | OR | 95% CI | OR | 95% CI | OR | 95% CI | |||
| Min | Max | Max | Max | Min | Max | ||||
| Education level | |||||||||
| ≤Primary education | 1.00 | 1.00 | 1.00 | ||||||
| Middle school | 0.65 * | 0.47 | 0.91 | 0.77 | 0.54 | 1.08 | 0.78 | 0.55 | 1.11 |
| High school | 0.39 *** | 0.30 | 0.50 | 0.68 * | 0.50 | 0.92 | 0.73 * | 0.53 | 0.99 |
| ≥College | 0.17 *** | 0.12 | 0.23 | 0.45 *** | 0.31 | 0.64 | 0.49 *** | 0.34 | 0.72 |
| Sex | |||||||||
| Male | 1.00 | 1.00 | |||||||
| Female | 0.59 *** | 0.47 | 0.74 | 0.77 | 0.55 | 1.07 | |||
| Age | |||||||||
| 30–39 | 1.00 | 1.00 | |||||||
| 40–49 | 3.37 ** | 1.55 | 7.34 | 3.24 ** | 1.48 | 7.07 | |||
| 50–64 | 7.70 *** | 3.70 | 16.03 | 7.43 *** | 3.56 | 15.52 | |||
| ≥65 | 14.70 *** | 6.98 | 30.97 | 14.73 *** | 6.92 | 31.33 | |||
| Smoking | |||||||||
| Never | 1.00 | ||||||||
| Ex-smoker | 1.45 * | 1.02 | 2.04 | ||||||
| Current smoker | 1.42 | 0.97 | 2.09 | ||||||
| Physical activity | |||||||||
| ≥150 min/week | 1.00 | ||||||||
| <150 min/week | 1.02 | 0.81 | 1.28 | ||||||
| Carbohydrate intake | |||||||||
| <60% | 1.00 | ||||||||
| ≥60% | 2.10 *** | 1.68 | 2.61 | ||||||
| Obesity | |||||||||
| No (25 > BMI) | 1.00 | ||||||||
| Yes (25 ≤ BMI) | 1.28 | 0.99 | 1.65 | ||||||
| Cox and Snell R2/Nagelkerke’s R2 | 0.039/0.083 | 0.072/0.152 | 0.084/0.177 | ||||||
| χ2(df), p-value | 158.364(3), <0.001 | 296.787(7), <0.001 | 347.219(12), <0.001 | ||||||
| Hosmer–Lemeshow test, χ2(df), p-value | 0.000(2), 1.000 | 6.765(8), 0.562 | 13.377(8), 0.100 | ||||||
Disclaimer/Publisher’s Note: The statements, opinions and data contained in all publications are solely those of the individual author(s) and contributor(s) and not of MDPI and/or the editor(s). MDPI and/or the editor(s) disclaim responsibility for any injury to people or property resulting from any ideas, methods, instructions or products referred to in the content. |
© 2024 by the authors. Licensee MDPI, Basel, Switzerland. This article is an open access article distributed under the terms and conditions of the Creative Commons Attribution (CC BY) license (https://creativecommons.org/licenses/by/4.0/).
Share and Cite
Lee, M.-J.; Seo, B.-J.; Kim, Y.-S. Impact of Education as a Social Determinant on the Risk of Type 2 Diabetes Mellitus in Korean Adults. Healthcare 2024, 12, 1446. https://doi.org/10.3390/healthcare12141446
Lee M-J, Seo B-J, Kim Y-S. Impact of Education as a Social Determinant on the Risk of Type 2 Diabetes Mellitus in Korean Adults. Healthcare. 2024; 12(14):1446. https://doi.org/10.3390/healthcare12141446
Chicago/Turabian StyleLee, Mi-Joon, Bum-Jeun Seo, and Yeon-Sook Kim. 2024. "Impact of Education as a Social Determinant on the Risk of Type 2 Diabetes Mellitus in Korean Adults" Healthcare 12, no. 14: 1446. https://doi.org/10.3390/healthcare12141446