Abstract
Background: Lifestyle choices significantly affect health outcomes in Saudi Arabia, but the relationship between health behaviors and satisfaction is unclear. This study aimed to assess lifestyle choices and associated satisfaction levels among residents in the Jazan region of Saudi Arabia. Methods: A cross-sectional study was conducted in Jazan, Saudi Arabia, with 3411 participants. Sociodemographic, lifestyle, and satisfaction data were collected using a questionnaire that was completed during interviews. Logistic regression analyses were implemented to examine the relationships between the study variables and factors related to weight, physical activity, and eating satisfaction. Results: The study found that 38.3% of participants were inactive and 77% rarely ate fruits and vegetables. A total of 47.6% were overweight or obese. Weight (71.12%) and eating (71.59%) satisfaction were high despite these health concerns. The satisfaction-behavior paradox was especially evident in diet. Higher income, physical activity, and healthy eating habits were significantly associated with higher satisfaction (OR = 1.49, 95% CI: 1.15–1.93, p = 0.003 for weight satisfaction, OR = 34.74, 95% CI: 25.42–48.35, p < 0.001 for physical activity satisfaction, and OR = 2.08, 95% CI: 1.67–2.61, p < 0.001 for fruit and vegetable consumption). Conclusions: Lifestyle behaviors and satisfaction in Jazan, Saudi Arabia, are complex. The satisfaction-behavior paradox, especially in diet, reveals a major gap between perceived and actual health. These findings highlight the need for targeted, culturally sensitive interventions that address behavioral change and perception alignment to improve regional public health.
1. Introduction
Global health outcomes and well-being depend more on lifestyle choices and health behaviors. The World Health Organization defines a healthy lifestyle as “a way of living based on identifiable patterns of behavior which are determined by the interplay between an individual’s personal characteristics, social interactions, and socioeconomic and environmental living conditions” [1]. This definition encompasses various aspects of daily life including diet, physical activity, tobacco use, and alcohol consumption [2].
Numerous studies have demonstrated the positive impact of healthy lifestyles on reducing the chronic disease risk and improving health management. For instance, the United States Diabetes Prevention Program, a randomized clinical trial multi-center, has investigated the effect of lifestyle intervention on diabetes risk [3]. The program achieved a 58% reduction in the diabetes incidence rate by setting goals of reducing body weight by 7% and maintaining a physical activity level of 700 calories per week [3]. This study’s findings are particularly relevant to Saudi Arabia given the country’s high prevalence of diabetes. According to recent estimates, approximately 17.7% of the adult Saudi population was affected by diabetes in 2021 [4], highlighting the urgent need for effective lifestyle interventions. More recent studies have confirmed the health benefits of lifestyle interventions that have yielded significant reductions in body weight, body mass index (BMI), and waist circumference among adults with metabolic syndrome [5,6].
While the importance of healthy lifestyles is universally recognized, their implementation and maintenance vary across cultures and socioeconomic groups. This variability points to the need for targeted healthy lifestyle promotion in diverse populations. In this context, Saudi Arabia presents a unique case study of how rapidly developing nations must manage the health effects of urbanization and lifestyle changes. According to previous studies, the main lifestyle issues in Saudi Arabia are inactivity, poor diet, tobacco use, and stress [7]. A systematic review revealed that Saudi Arabia has a higher obesity rate than the global average, with the largest studies reporting a prevalence of 35.6%. Obesity in Saudi Arabia is primarily associated with dietary factors (particularly the shift toward the Western diet and increased consumption of sugary beverages), physical inactivity, and demographic factors such as being female, married, and living in an urban area [8]. There has been a significant rise in chronic illnesses in Saudi Arabia associated with urbanization and the adoption of Western lifestyles. Sedentary lifestyles combined with a greater consumption of fast food have increased the risk of obesity [9,10,11,12]. In the World Health Report of Saudi Arabia 2019, which used a participant sample of 8912, only 39% of the respondents had a normal BMI, and nearly 60% of adult Saudis were either overweight or obese [13]. These alarming statistics highlight the need for effective public health interventions nationwide.
The Saudi government has promoted healthy lifestyles and physical activity to address the growing problem of obesity in the nation [14]. Recent initiatives include the Quality of Life Program, which aims to increase the percentage of individuals who exercise at least once a week from 13% in 2015 to 40% by 2030 [15]. These programs have raised the awareness of healthy lifestyles and led to the construction of more public recreational facilities, but they have also encountered challenges including cultural barriers to women’s public physical activity and a lack of comprehensive health education programs [16]. A recent study found that behavioral changes were difficult to implement despite increased awareness, highlighting the complexity of population-level lifestyle modification [16]. Initiatives that seek to address these challenges and adapt strategically to Saudi Arabia’s unique cultural context are most likely to succeed.
Research on lifestyle-related health issues in Saudi Arabia is limited due to a lack of understanding of the factors influencing an individual’s satisfaction with their lifestyle choices, a focus on urban populations, and the interaction between lifestyle behaviors and socioeconomic factors [17]. Understanding these gaps can aid in the design of effective public health interventions. Theoretical frameworks that assess lifestyle behaviors and change readiness are needed to address the current limitations and develop more targeted interventions.
Assessing the community lifestyle risk factors is crucial to designing effective public health interventions. Such assessments should also consider the community members’ willingness to change unhealthy habits. The transtheoretical model, which measures lifestyle change motivation, is useful in this context. This model describes six stages of behavioral change, from pre-contemplation to maintenance [18]. Interestingly, research suggests that some high-risk individuals may enjoy their unhealthy lifestyles. Satisfaction may make it harder to change unhealthy habits. A recent study in Saudi Arabia found that individuals who reported high satisfaction with their current lifestyle, despite engaging in unhealthy behaviors, were less likely to participate in health promotion programs [17]. This finding underscores the importance of understanding satisfaction levels when designing health interventions.
Given these considerations, the current study aimed to assess lifestyle choices among individuals in a community from the southwestern region of Saudi Arabia and identify factors associated with levels of satisfaction. The study’s findings may significantly impact public health policy in Saudi Arabia by elucidating the relationship between lifestyle behaviors, satisfaction levels, and behavioral change. The conclusions of the present study may be used to guide the design of culturally sensitive health programs, allocate resources, and reduce lifestyle-related diseases. The research may also serve as a model for other developing nations.
2. Methods
2.1. Study Design and Setting
This cross-sectional study was part of a regional health needs assessment project conducted in May and June 2024. Cross-sectional designs are ideal for capturing population health behaviors and attitudes at a specific time [19]. The researchers were able to efficiently collect data on multiple variables simultaneously, providing a comprehensive picture of Jazan’s lifestyle patterns and satisfaction levels. The study was conducted in the Jazan region of Saudi Arabia, a diverse area with a rich cultural heritage and rapid urbanization. The region’s proximity to the Yemeni border and its transition from an agricultural economy to an urban economy provide an interesting context for examining lifestyle choices and satisfaction levels across socioeconomic groups.
2.2. Data Collection Tool
The health needs assessment tool was developed through a rigorous process involving consultation of the relevant international literature on community health needs assessment tools [20,21] and was reviewed by a panel of experts in family and community medicine to ensure its comprehensiveness and suitability for the target population. The final questionnaire comprised various components including demographics, lifestyle determinants of health, and the participants’ satisfaction with their lifestyles. The lifestyle determinants assessed in this study were based on the Saudi Guidelines for the Prevention and Management of Obesity [22]. Participants self-reported their body weight and height, allowing for BMI calculation. Physical activity levels were evaluated by asking participants about their adherence to the clinical recommendation of performing 150 min or more of exercise per week. Dietary behaviors were assessed through questions on five key elements of healthy eating designed to measure the participants’ consumption of whole-grain products, fruits and vegetables, low-fat meats, and low-fat products, along with their avoidance of high-sugar foods. Satisfaction with body weight, physical activity, and eating behavior was measured using a Likert scale ranging from 1 (lowest satisfaction) to 10 (highest satisfaction) for each parameter. The internal consistency of the lifestyle determinants and satisfaction items was evaluated using Cronbach’s alpha, yielding a coefficient of 0.77, indicating acceptable reliability.
2.3. Data Collection Process
Trained medical students conducted personal interviews to collect data. The students received two days of training on interviewing, ethics, and questionnaire use. To ensure the consistency and accuracy of the data collection, the training included role-playing and practice interviews. Quality control was used throughout the data collection. Daily supervisor debriefings, random questionnaire spot checks, and 5% participant re-interviews to assess reliability were incorporated. Discrepancies were resolved quickly. Community settings in various Jazan provinces hosted the interviews. Participants were identified and approached in their communities. This household survey recruited in the targeted individuals’ homes. Adults (18+) and Jazan residents were eligible. Non-Jazan residents and minors were excluded. In addition, individuals who were identified and approached but who declined to participate were excluded.
Multistage sampling was used to ensure regional representation. The Jazan region, which is composed of 17 governmental provinces in coastal, mountain, and island areas, was first stratified by geography. Districts and households were randomly selected within each stratum. Parents and children from each household were selected to gather intergenerational perspectives.
2.4. Study Size
Sample size estimation of the current health needs assessment was based on the statistical formula:
where
nh = (deff) (Z2) (P)(1 − P) (k)/(Ã)(d2),
nh is the sample size in terms of the number of households to be selected;
deff is the sample design effect;
z is the statistic that defines the level of confidence desired;
P is an estimate of a key indicator to be measured by the survey;
k is a multiplier to account for the anticipated rate of non-response;
à Average no. of persons of the base population per HH;
d is the margin of error to be attained.
In the survey, the number of 1600 households was estimated based on the following calculations. First, the z-statistic = 1.96 for the 95% level of confidence. The default value of the sample design effect was set as 2, unless there was supporting empirical data from previous or related surveys that suggested a different value. For the non-response multiplier, k, a proportion of 20% was suggested. The level of P was set as 50% because we were interested in many health indicators, so it was best to use this percentage as it provided the largest sample size. Finally, the average no. of persons of the base population (above 18 years) per HH was 60%.
This approach allowed for the comprehensive assessment of lifestyle choices and satisfaction levels across diverse geographic and demographic segments of the Jazan population, enhancing the generalizability of the findings to the broader community [17,23].
2.5. Data Analysis
Data analysis was performed using R software (version 4.2.3, R Foundation for Statistical Computing, Vienna, Austria). The risk factors examined were divided into two main categories. The first category included sociodemographic characteristics such as age, gender, education, residence, income, nationality, languages spoken, employment status, marital status, and housing. The second category focused on health-related parameters including height, weight, BMI, physical activity levels, smoking habits, khat usage, and dietary behaviors. The outcome variables of interest were satisfaction levels regarding weight, physical activity, and dietary behaviors among the study participants.
Our analysis began with an overview of the sample characteristics. Binary and categorical variables were described using frequencies and proportions, and quantitative variables were summarized with mean values and standard deviations (SDs). Additionally, we used multiple logistic regression analyses to investigate the adjusted relationships between the outcome variables and the identified risk factors, quantifying these associations with the odds ratios (ORs). Statistical significance was determined with a p-value threshold below 0.05.
3. Results
3.1. Sociodemographic, Habitual, and Dietary Characteristics of the Sample
Table 1 describes the socio-demographic characteristics of 3411 participants from the Jazan region in Saudi Arabia. The mean age was 34 ± 15 years, with households averaging 7 ± 2.9 family members. This study recruited a nearly equal sample of male and female participants (50.9% vs. 49.1%, respectively). The majority of participants were Saudi nationals (97%) and Arabic speakers (99.7%). Most participants were university-educated (54.3%), single (61%), and resided in rural areas (62%). A significant portion were students (37.6%), with the highest income bracket being ≥15,000 SAR (27.7%). Housing was predominantly in owned villas (46%). Table 2 presents the health characteristics of the study population. The mean height was 163 ± 9.3 cm, the mean weight was 67 ± 17 kg, and the mean BMI was 25 ± 5.6. Regarding physical activity, 38.3% of participants reported no physical activity per week, while 40.3% engaged in moderate or vigorous activity for a minimum of 30 minutes, five times per week, which was the highest reported activity level. BMI categories indicated that 41.3% of participants were of normal weight, 30.1% were overweight, 17.5% were obese, and 11.1% were underweight. Table 3 describes the smoking behavior and khat chewing habits of the study participants. The majority (81%) reported never smoking. Meanwhile, 10% were current smokers, and 4% were ex-smokers. Passive smoking was reported by 5% of participants. In terms of specific smoking types, 91% were non-cigarette smokers, 95% were non-shisha smokers, and 96% were non-vape smokers. The prevalence of combined smoking behaviors was generally low, with 1% or less engaging in combinations of cigarettes, shisha, and vape smoking. Regarding khat chewing, 89.7% reported never chewing khat, 4.7% were current users, and 5.5% were ex-users. Table 4 presents the dietary habits of the study participants (n = 3411). Approximately half of all participants reported consuming whole grains (48%), while a slightly higher percentage reported not consuming whole grains (52%). Daily consumption of fruits and vegetables was reported by 23% of participants, with the majority (77%) indicating infrequent consumption. Regarding meat choices, 51% reported consuming low-fat meats, while 49% did not. A significant proportion of participants reported avoiding high-sugar foods (37%) and consuming low-fat products (32%), although the majority did not engage in these dietary practices (63% and 68%, respectively).

Table 1.
Sociodemographic characteristics of the study participants (n = 3411).
Table 2.
Physical activity patterns and anthropometric measures of study participants (n = 3411).
Table 3.
Smoking behavior and khat chewing habits among study participants (n = 3411).
Table 4.
Dietary habits of study participants (n = 3411).
3.2. Satisfaction Levels among Participants
The majority of participants were satisfied with their weight and eating behaviors. Specifically, 71.12% of participants reported satisfaction with their weight, while 28.88% were dissatisfied. In terms of eating behavior, 71.59% were satisfied, and 28.41% were dissatisfied. However, satisfaction with physical activity was relatively lower, with 59.75% of the participants expressing satisfaction and 40.25% indicating dissatisfaction (Figure 1).
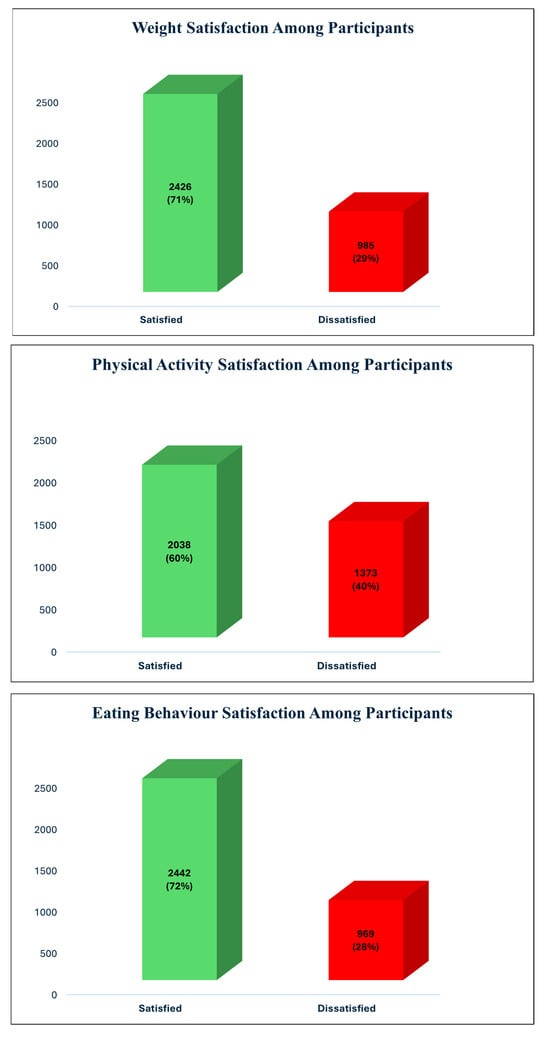
Figure 1.
Percentage distribution of satisfaction levels for weight, physical activity, and eating behavior among participants in Jazan region, Saudi Arabia (n = 3411).
3.3. The Determinants of Satisfaction Levels among Participants
Table 5 shows the association of demographic and lifestyle factors with weight satisfaction among the participants. There was a significant association between nationality and weight satisfaction, with Saudi nationals being less likely to be satisfied compared with other nationalities (OR = 0.54, CI = 0.28–0.98, p = 0.049). Income level also played a significant role: participants earning between 10,000 and 14,999 SAR were more likely to be satisfied with their weight compared with those earning less than 5000 SAR (OR = 1.49, CI = 1.15–1.93, p = 0.003). Housing type was another significant factor, with participants living in owned villas being less likely to be satisfied with their weight compared with those living in rented housing (OR = 0.66, CI = 0.49–0.89, p = 0.007). BMI showed a significant negative association with weight satisfaction (OR = 0.89, CI = 0.84–0.94, p < 0.001). Additionally, BMI categories indicated that underweight (OR = 0.18, CI = 0.12–0.27, p < 0.001), overweight (OR = 0.45, CI = 0.32–0.64, p < 0.001), and obese individuals (OR = 0.28, CI = 0.15–0.50, p < 0.001) were all less likely to be satisfied with their weight compared with those of a normal weight. Physical activity levels showed significant associations, with participants engaging in mild-to-moderate (OR = 1.48, CI = 1.22–1.79, p < 0.001) and moderate-to-vigorous physical activity (OR = 1.87, CI = 1.46–2.39, p < 0.001) being more likely to be satisfied with their weight compared with those with no physical activity. Finally, eating behavior related to the consumption of low-fat meat was significantly associated with weight satisfaction, with participants choosing low-fat meat being more likely to be satisfied with their weight (OR = 1.33, CI = 1.12–1.58, p = 0.001).
Table 5.
Demographic and lifestyle factors associated with weight satisfaction: results from multiple logistic regression analysis.
Table 6 shows the association of demographic and lifestyle factors with physical activity satisfaction among participants. Nationality was significantly associated with physical activity satisfaction, with Saudi nationals being less likely to be satisfied compared with other nationalities (OR = 0.51, CI = 0.28–0.90, p = 0.022). Physical activity levels had a strong association, where participants engaging in mild-to-moderate physical activity (OR = 7.23, CI = 6.03–8.71, p < 0.001) and moderate-to-vigorous physical activity (OR = 34.74, CI = 25.42–48.35, p < 0.001) were significantly more likely to be satisfied compared with those with no physical activity. Eating behaviors also played a significant role: participants who chose low-fat meat (OR = 1.32, CI = 1.11–1.57, p = 0.002), avoided high-sugar foods (OR = 1.27, CI = 1.06–1.52, p = 0.008), and opted for low-fat products (OR = 1.25, CI = 1.03–1.50, p = 0.021) were more likely to be satisfied with their physical activity levels than those who did not make these choices.
Table 6.
Multivariate logistic regression analysis of factors associated with physical activity satisfaction among participants in Jazan region, Saudi Arabia (n = 3411).
Table 7 shows the association of demographic and lifestyle factors with eating behavior satisfaction among the participants. Age was a significant factor, with older participants being more satisfied with their eating behavior (OR = 1.02, CI = 1.01–1.04, p < 0.001). Males were more likely to be satisfied compared with females (OR = 1.27, CI = 1.05–1.54, p = 0.015). Saudi nationals were less likely to be satisfied compared with individuals of other nationalities (OR = 0.35, CI = 0.17–0.65, p = 0.002). BMI was inversely related to satisfaction (OR = 0.92, CI = 0.87–0.96, p = 0.001), with underweight participants reporting significantly less satisfaction with their eating behaviors compared with those with normal weight (OR = 0.53, CI = 0.37–0.76, p = 0.001).
Table 7.
Multivariate logistic regression analysis of factors associated with eating behavior satisfaction among participants in Jazan region, Saudi Arabia (n = 3411).
Physical activity levels were significantly associated with eating behavior satisfaction, where participants engaging in mild-to-moderate (OR = 1.93, CI = 1.61–2.32, p < 0.001) and moderate-to-vigorous physical activity (OR = 2.68, CI = 2.10–3.44, p < 0.001) were more likely to be satisfied compared with those with no physical activity. Various eating behaviors were also significant: participants consuming daily fruits and vegetables (OR = 2.08, CI = 1.67–2.61, p < 0.001), choosing low-fat meat (OR = 1.90, CI = 1.61–2.25, p < 0.001), avoiding high-sugar foods (OR = 1.83, CI = 1.53–2.20, p < 0.001), and opting for low-fat products (OR = 2.02, CI = 1.67–2.46, p < 0.001) were more likely to be satisfied with their eating behaviors than participants who did not make these choices.
4. Discussion
The present study revealed significant insights into the lifestyle choices and satisfaction levels of residents of the Jazan region in Saudi Arabia. Our findings highlight a complex relationship between health behaviors and satisfaction, particularly in the domains of physical activity, diet, and weight management. Notably, we observed a paradoxical trend where high levels of satisfaction coexisted with potentially unhealthy lifestyle choices.
A notable finding was the high prevalence of physical inactivity, with over a third of participants reporting no regular exercise. This is concerning given the well-established benefits of physical activity in preventing chronic diseases. Similarly, dietary habits showed room for improvement, with most participants reporting the infrequent consumption of fruits and vegetables. Despite these unhealthy behaviors, satisfaction levels regarding weight and eating habits were surprisingly high. This discrepancy between actual health behaviors and perceived satisfaction suggests a potential misalignment between health awareness and practice in the community.
A remarkable paradox was found between unhealthy lifestyle behaviors and high satisfaction, particularly in diet. This satisfaction-behavior paradox suggests that many students are unaware of their problematic habits and are in the precontemplation stage of behavior change [18]. In dietary behaviors, satisfaction levels were similar regardless of healthy eating guidelines, highlighting the disconnect. This differed from the patterns of satisfaction noted for weight and physical activity levels. Several factors may be responsible for this paradox. For example, Saudi Arabian culture emphasizes social eating and high-calorie dishes, which may normalize unhealthy diets [9]. A lack of health awareness and nutritional literacy among students may also lead to misconceptions about healthy diets [23]. Cognitive dissonance may also play a contributing role, with students rationalizing unhealthy behaviors to boost their self-esteem [11]. Health education and behavior change interventions in the region should take heed of this paradox. If students are happy with unhealthy behaviors, traditional education may be ineffective. Instead, interventions should raise awareness of the discrepancy between current behaviors and health recommendations, possibly using motivational interviewing [8]. Addressing the environmental and cultural factors that underlie this paradox, such as campus food availability and social norms of physical activity, may help promote behavioral change [7,16].
Our findings indicate that targeted public health interventions and policies are needed to address Jazan’s high prevalence of unhealthy lifestyle behaviors and paradoxical satisfaction levels. Multifaceted interventions should address individual, environmental, and sociocultural factors [9]. Policies that make healthy foods more accessible and affordable, along with nutrition education, can improve diets [8]. Community-based, culturally appropriate physical activity programs, especially for women, can be implemented to address inactivity [16]. Given the satisfaction paradox, especially in dietary behaviors, health promotion programs should highlight the gap between perceived and actual health [17]. The transtheoretical model of behavior change [18] may influence motivational interviewing and stage-based interventions. University policies, such as offering healthy food in cafeterias and increasing campus physical activity, could encourage healthier choices [16]. The engagement of community leaders and social networks may improve the cultural sensitivity and effectiveness of these interventions [7]. Finally, tailored substance abuse prevention programs should be integrated into health promotion efforts to address regional issues such as khat use [9]. Public health initiatives can better address the complex interactions that affect the lifestyle behaviors and satisfaction of the residents of Jazan by implementing these comprehensive, culturally sensitive strategies.
Strengths and Limitations
This study has several strengths including its large sample size, its use of a culturally relevant and validated questionnaire, and its comprehensive assessment of various lifestyle factors. Robust statistical analyses illuminate the complex relationships between sociodemographic factors, lifestyle behaviors, and satisfaction. However, some restrictions remain. Cross-sectional studies cannot establish causality. Self-reported data from direct interviews may be biased, especially on sensitive topics such as diet and exercise. Results from this single-region sample may not apply to the entire national population. In addition, cultural and environmental factors specific to Jazan may affect the lifestyle choices and perceptions differently. Despite these limitations, this study provides a solid foundation for understanding the complex relationship between lifestyle behaviors and satisfaction in Saudi Arabia, which can inform targeted public health interventions.
5. Conclusions
This study examined lifestyle behaviors and satisfaction in Jazan, Saudi Arabia, revealing a complex relationship between health behaviors, sociodemographic factors, and satisfaction. The findings showed a worrying prevalence of unhealthy lifestyle behaviors including inactivity, poor diet, and obesity. The most surprising finding was the satisfaction-behavior paradox, where participants reported high health satisfaction despite engaging in unhealthy dietary habits. This paradox highlights a critical gap between perceived and actual health status, making public health interventions more challenging. We found significant associations between sociodemographic factors and satisfaction, emphasizing the need for culturally sensitive interventions. The results of this study underscore the need to address the environmental and sociocultural factors that lead to unhealthy lifestyles and call for a health promotion paradigm shift. Addressing this disconnect and implementing targeted, multilevel interventions that consider individual behaviors, community norms, and societal structures could significantly improve regional health outcomes. Longitudinal studies should examine the temporal relationships between health behaviors, satisfaction, and long-term health outcomes and the efficacy of interventions to address the satisfaction-behavior paradox.
Author Contributions
Conceptualization, I.M.G.; Methodology, A.M.M., I.M.G., M.A.J., M.A.M., A.A.A., A.A.B., M.A.R., M.S.M., T.A.B., A.K.A., T.A.H., R.I.Q., A.A.M. and A.Y.A.; software, M.A.M.; validation, T.A.B.; Formal analysis, M.A.J. and M.S.M.; Investigation, I.M.G.; resources, A.M.M.; Data curation, M.A.J.; Writing—original draft, M.A.J. and M.S.M.; Writing—review & editing, A.Y.A.; visualization, M.A.J.; Supervision, M.A.M., A.A.A., A.A.B., M.A.R. and A.Y.A.; Project administration, A.K.A. All authors have read and agreed to the published version of the manuscript.
Funding
This research received no external funding.
Institutional Review Board Statement
This study was conducted in accordance with the Declaration of Helsinki and approved by the Standing Committee for Scientific Research of Jazan University (protocol code REC-45/05/848 dated 26 November 2023).
Informed Consent Statement
Informed consent was obtained from all subjects involved in this study.
Data Availability Statement
The raw data supporting the conclusions of this article are available upon reasonable request to the corresponding author.
Acknowledgments
The authors express their deepest gratitude to all the students who participated in this study by generously sparing their time and sharing personal information about their health behaviors and perceptions. We also wish to acknowledge the diligent efforts of our trained data collection team in carefully conducting the survey administration and data entry.
Conflicts of Interest
The authors declare no conflicts of interest.
References
- Nutbeam, D.; Kickbusch, I. Health promotion glossary. Health Promot. Int. 1998, 13, 349–364. [Google Scholar] [CrossRef]
- Lianov, L.; Johnson, M. Physician competencies for prescribing lifestyle medicine. JAMA 2010, 304, 202–203. [Google Scholar] [CrossRef] [PubMed]
- DPP. The Diabetes Prevention Program (DPP): Description of lifestyle intervention. Diabetes Care 2002, 25, 2165–2171. [Google Scholar] [CrossRef] [PubMed]
- Ogurtsova, K.; Guariguata, L.; Barengo, N.C.; Ruiz, P.L.-D.; Sacre, J.W.; Karuranga, S.; Sun, H.; Boyko, E.J.; Magliano, D.J. IDF diabetes Atlas: Global estimates of undiagnosed diabetes in adults for 2021. Diabetes Res. Clin. Pract. 2022, 183, 109118. [Google Scholar] [CrossRef] [PubMed]
- Singh, V.K.; Muralidhar, D.; Malo, P.K.; Bhaskarapillai, B.; Muralidharan, K. Effectiveness of Short-Term Lifestyle Modification on Reducing Body-Weight-Related Parameters in Persons with Severe Mental Illness: A Randomized Controlled Trial. Indian J. Psychol. Med. 2023, 45, 352–359. [Google Scholar] [CrossRef] [PubMed]
- Rahimi, G.R.M.; Yousefabadi, H.A.; Niyazi, A.; Rahimi, N.M.; Alikhajeh, Y. Effects of Lifestyle Intervention on Inflammatory Markers and Waist Circumference in Overweight/Obese Adults With Metabolic Syndrome: A Systematic Review and Meta-Analysis of Randomized Controlled Trials. Biol. Res. Nurs. 2022, 24, 94–105. [Google Scholar] [CrossRef] [PubMed]
- Munawir Alhejely, M.M.; Shibli, K.Y.; Hamed Almalki, W.A.; Felemban, G.M.B.; Alluhaybi, H.S.; Majrashi, B.M.; Bakhsh, B.Y. Influence of Lifestyle Changes on Cardiovascular Diseases in Saudi Arabia: A Systematic Literature Review. Cureus 2023, 15, e40075. [Google Scholar] [CrossRef] [PubMed]
- Salem, V.; AlHusseini, N.; Abdul Razack, H.I.; Naoum, A.; Sims, O.T.; Alqahtani, S.A. Prevalence, risk factors, and interventions for obesity in Saudi Arabia: A systematic review. Obes. Rev. 2022, 23, e13448. [Google Scholar] [CrossRef] [PubMed]
- Al-Hazzaa, H.M. Physical inactivity in Saudi Arabia revisited: A systematic review of inactivity prevalence and perceived barriers to active living. Int. J. Health Sci. Qassim 2018, 12, 50–64. [Google Scholar] [PubMed]
- Al Makadma, A.S. Adolescent health and health care in the Arab Gulf countries: Today’s needs and tomorrow’s challenges. Int. J. Pediatr. Adolesc. Med. 2017, 4, 1–8. [Google Scholar] [CrossRef] [PubMed]
- Lavie, C.J.; Ozemek, C.; Carbone, S.; Katzmarzyk, P.T.; Blair, S.N. Sedentary Behavior, Exercise, and Cardiovascular Health. Circ. Res. 2019, 124, 799–815. [Google Scholar] [CrossRef] [PubMed]
- Naeem, Z. Increasing trend of Junk food use in Saudi Arabia and health implications. Int. J. Health Sci. Qassim 2012, 6, V–VI. [Google Scholar] [CrossRef] [PubMed]
- Saudi Ministry of Health. World Health Survey. Available online: https://www.moh.gov.sa/en/Ministry/Statistics/Population-Health-Indicators/Documents/World-Health-Survey-Saudi-Arabia.pdf (accessed on 28 September 2019).
- Saudi Vision 2030. Quality of Life Program. Available online: https://www.vision2030.gov.sa/en/vision-2030/vrp/quality-of-life-program/ (accessed on 31 December 2019).
- The Quality of Life Program Implementation Plan. Quality of Life Program. 2021. Available online: https://www.vision2030.gov.sa/media/gi3l3js2/qol-en.pdf (accessed on 31 December 2019).
- Abdulrashid, O.A.; Shah, H.B.U.; Baeshen, W.A.; Aljuaid, S.M.; Alasmari, E.A.; Baokbah, R.A.; Baokbah, R.A.; Alamoudi, N.M.; Alkhelewi, M.S.; Turkistani, A.A.; et al. Physical activity and health-related quality of life among adults living in Jeddah city Saudi Arabia. PeerJ 2023, 11, e16059. [Google Scholar] [CrossRef] [PubMed]
- Muaddi, M.A.; Makeen, A.M.; Gosadi, I.M.; Jareebi, M.A.; Alharbi, A.A.; Bahri, A.A.; Ryani, M.A.; Mahfouz, M.S.; Albasheer, O.; Ali, S.A.; et al. Satisfaction Paradoxes in Health Behaviors: Contrasting Patterns across Weight, Physical Activity and Dietary Habits. Nutrients 2024, 16, 2246. [Google Scholar] [CrossRef] [PubMed]
- Prochaska, J.O.; Velicer, W.F. The transtheoretical model of health behavior change. Am. J. Health Promot. 1997, 12, 38–48. [Google Scholar] [CrossRef] [PubMed]
- Setia, M.S. Methodology Series Module 3: Cross-sectional Studies. Indian J. Dermatol. 2016, 61, 261–264. [Google Scholar] [CrossRef] [PubMed]
- Rowe, A.; McClelland, A.; Billingham, K.; Carey, L. Community Health Needs Assessment: An Introductory Guide for the Family Health Nurse in Europe; World Health Organization. Regional Office for Europe: Copenhagen, Denmark, 2001. [Google Scholar]
- Umbach, T. Community Health Needs Assessment; Ochsner Medical Center: New Orleans, LO, USA, 2013. [Google Scholar]
- Saudi Ministry of Health. Saudi Guidelines for Prevention and Management of Obesity; Saudi Ministry of Health: Riyadh, Saudi Arabia, 2016. [Google Scholar]
- Gosadi, I.M.; Makeen, A.M.; Jareebi, M.A.; Elmahdy, M.H.; El-Setouhy, M.; Salih, S.M.; Ahmed, A.E.; Abdelmola, A.; Jafar, R.J.; Mutaen, Y.A. Lifestyle Satisfaction Among Jazan University Employees: A Cross-Sectional Study Exploring Lifestyle Choices and Influencing Factors. Cureus 2024, 16, e55338. [Google Scholar] [CrossRef] [PubMed]

Disclaimer/Publisher’s Note: The statements, opinions and data contained in all publications are solely those of the individual author(s) and contributor(s) and not of MDPI and/or the editor(s). MDPI and/or the editor(s) disclaim responsibility for any injury to people or property resulting from any ideas, methods, instructions or products referred to in the content. |
© 2024 by the authors. Licensee MDPI, Basel, Switzerland. This article is an open access article distributed under the terms and conditions of the Creative Commons Attribution (CC BY) license (https://creativecommons.org/licenses/by/4.0/).