
The Validation of the Greulich and Pyle Atlas for Radiological Bone Age Assessments in a Pediatric Population from the Canary Islands

 ,
,  , , ,
, , , 
Abstract
1. Introduction
2. Materials and Methods
2.1. Study Design
2.2. Participants
2.2.1. Inclusion and Exclusion Criteria
2.2.2. Sample Size Calculation
2.3. Test Methods
2.4. Analysis
3. Results
3.1. Characteristics of Sample
3.2. Main Results
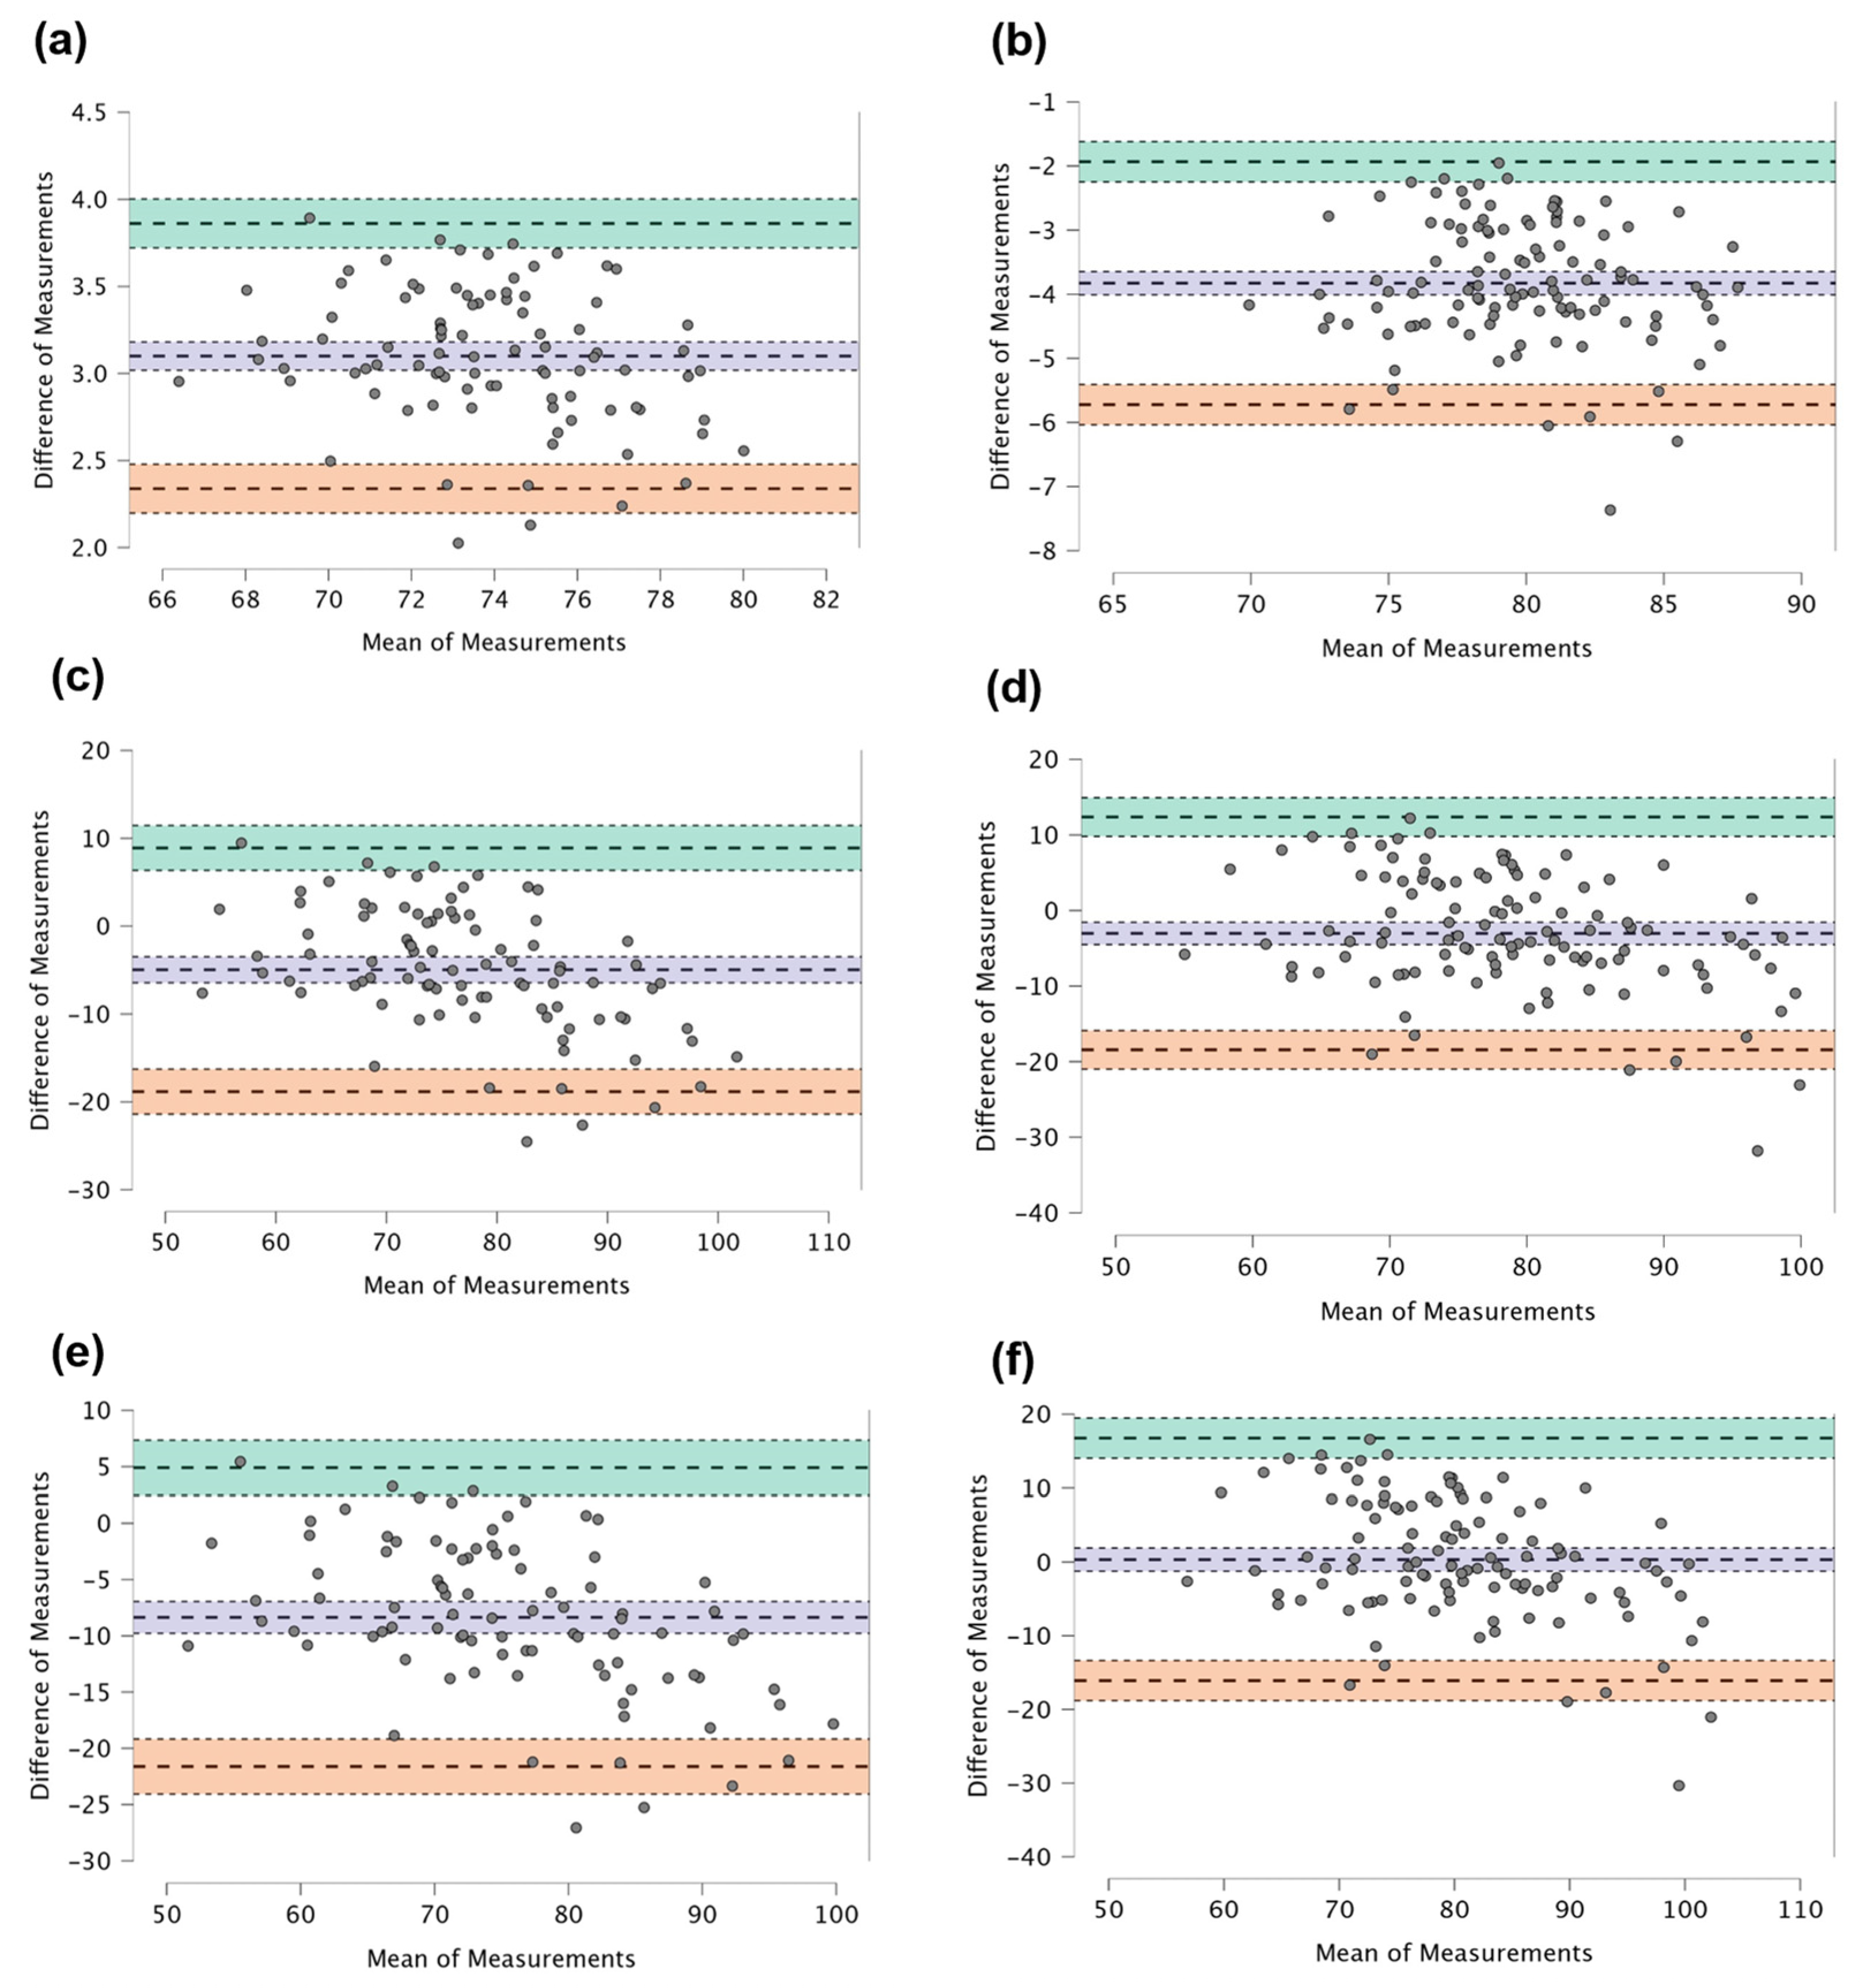
3.2.1. Precision
- Intra-rater agreement
- Inter-rater agreement
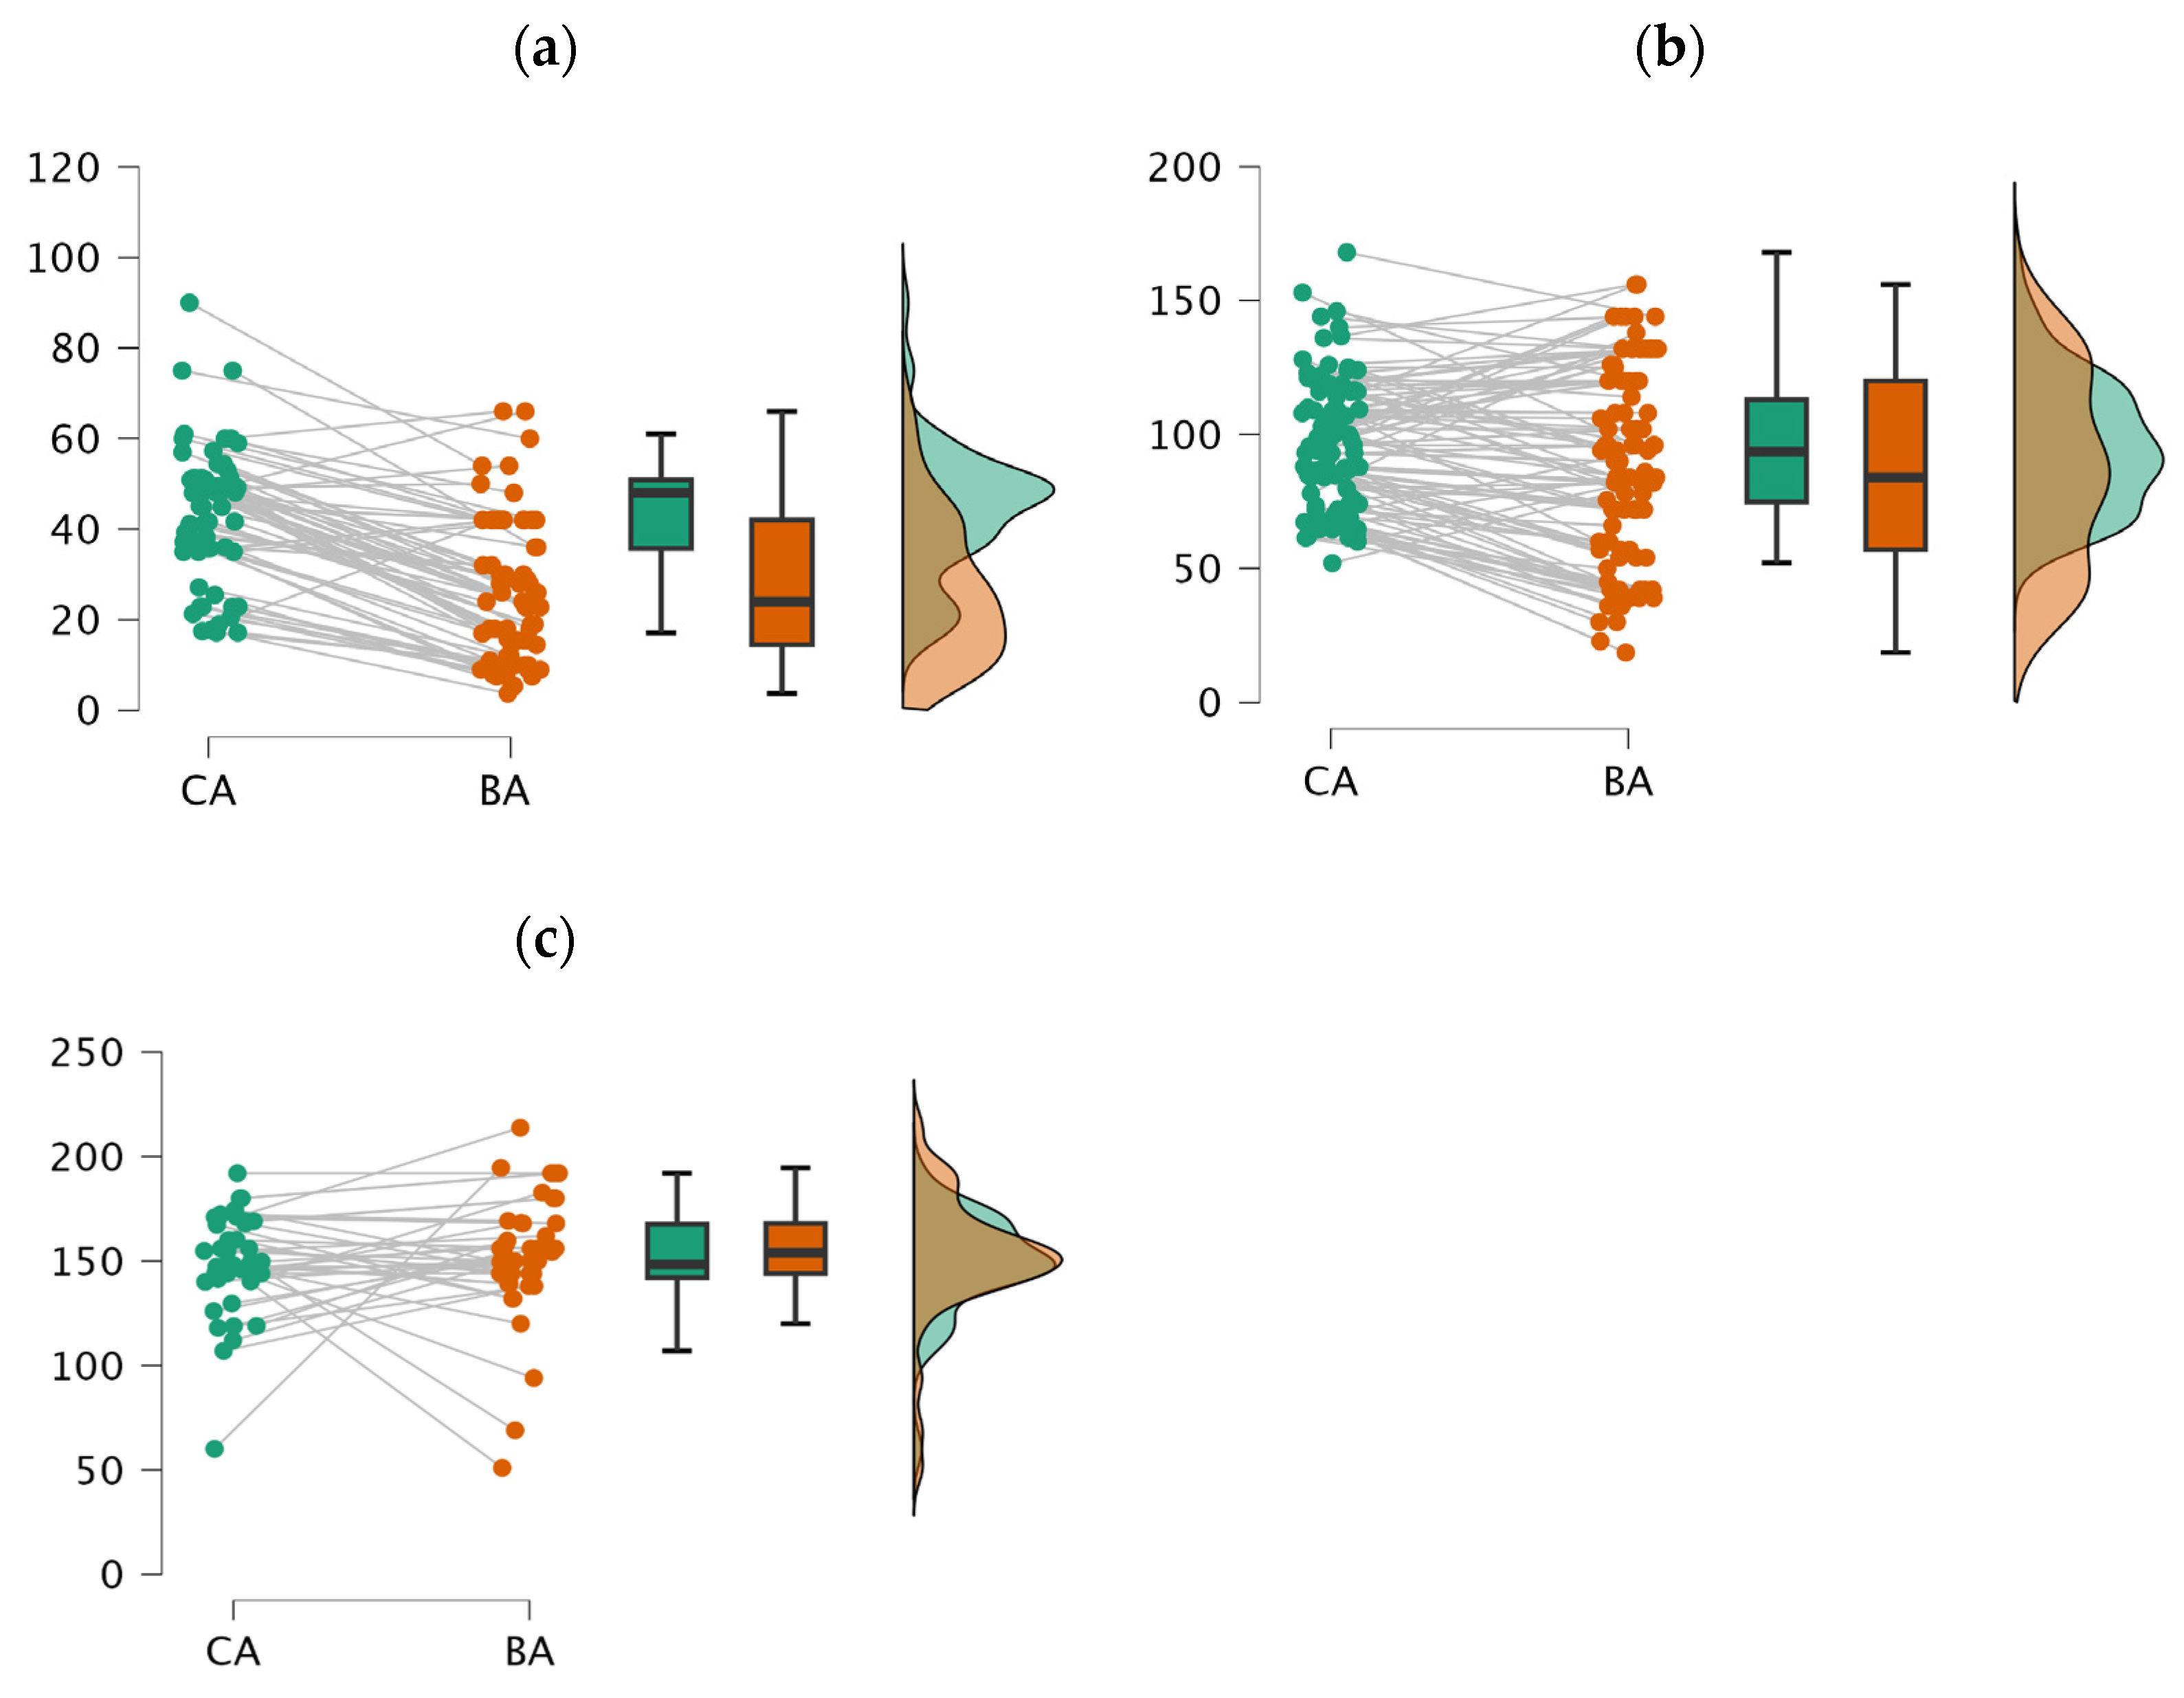
3.2.2. Accuracy
4. Discussion
4.1. Precision of GP-Canary Atlas
4.1.1. Intra-Rater Agreement
4.1.2. Inter-Rater Agreement
4.2. Accuracy of GP-Canary Atlas
5. Conclusions
Author Contributions
Funding
Institutional Review Board Statement
Informed Consent Statement
Data Availability Statement
Conflicts of Interest
References
- Tanner, J.M. Growth at Adolescence; Blackwell Scientific Publications: Oxford, UK, 1962. [Google Scholar]
- Toledo Trujillo, F.M.; Hernández, F.R.; Rodríguez, I.R. Atlas Radiológico de Referencia de la Edad Ósea en la Población Canaria; Fundación Canaria de Salud y Sanidad de Tenerife: Santa Cruz de Tenerife, Spain, 2009. [Google Scholar]
- Nandiraju, D.; Ahmed, I. Human skeletal physiology and factors affecting its modeling and remodeling. Fertil. Steril. 2019, 112, 775–781. [Google Scholar] [CrossRef] [PubMed]
- Macias, H.; Hinck, L. Mammary Gland Development. Wiley Interdiscip. Rev. Dev. Biol. 2012, 1, 533–557. [Google Scholar] [CrossRef] [PubMed]
- Susman, E.J.; Houts, R.M.; Steinberg, L.; Belsky, J.; Cauffman, E.; Dehart, G.; Friedman, S.L.; Roisman, G.I.; Halpern-Felsher, B.L.; Eunice Kennedy Shriver NICHD Early Child Care Research Network. Longitudinal Development of Secondary Sexual Characteristics in Girls and Boys between Ages 9½ and 15½ Years. Arch. Pediatr. Adolesc. Med. 2010, 164, 166–173. [Google Scholar] [CrossRef] [PubMed]
- Bangalore Krishna, K.; Witchel, S.F. Normal Puberty. Endocrinol. Metab. Clin. N. Am. 2024, 53, 183–194. [Google Scholar] [CrossRef] [PubMed]
- Niwczyk, O.; Grymowicz, M.; Szczęsnowicz, A.; Hajbos, M.; Kostrzak, A.; Budzik, M.; Maciejewska-Jeske, M.; Bala, G.; Smolarczyk, R.; Męczekalski, B. Bones and Hormones: Interaction between Hormones of the Hypothalamus, Pituitary, Adipose Tissue and Bone. Int. J. Mol. Sci. 2023, 24, 6840. [Google Scholar] [CrossRef]
- Ulijaszek, S.J. The International Growth Standard for Children and Adolescents Project: Environmental Influences on Preadolescent and Adolescent Growth in Weight and Height. Food Nutr. Bull. 2006, 27, S279–S294. [Google Scholar] [CrossRef]
- Johnson, A.B. Genetic Determinants of Maturation Under Favorable Environmental Conditions. Genet. Dev. 2017, 5, 112–125. [Google Scholar]
- Cavallo, F.; Mohn, A.; Chiarelli, F.; Giannini, C. Evaluation of Bone Age in Children: A Mini-Review. Front. Pediatr. 2021, 9, 580314. [Google Scholar] [CrossRef]
- Navarro, M.M.; Tejedor, B.M.; Siguero, J.P.L. El uso de la edad ósea en la práctica clínica. An. Pediatr. Contin. 2014, 12, 275–283. [Google Scholar] [CrossRef]
- Roberts, C.D. Influence of Environment on Genetic Control of Maturation: A Longitudinal Study. Environ. Genet. 2019, 28, 78–91. [Google Scholar]
- Díaz Gómez, M.N. Crecimiento y Desarrollo Físico del Niño; University of La Rioja: Tenerife, Spain, 1992. [Google Scholar]
- Liu, X.; Zhang, J.; Zheng, Z. Clinical Methods for Bone Age Assessment in Pediatrics. J. Pediatr. Endocrinol. Metab. 2018, 31, 487–495. [Google Scholar]
- Smith, R.; Johnson, M.; Williams, L. Hormonal Profiling in Pediatric Endocrinology. Endocr. Rev. 2020, 42, 301–318. [Google Scholar]
- Gilsanz, V.; Ratib, O. Hand Bone Age: A Digital Atlas of Skeletal Maturity; Springer: Berlin/Heidelberg, Germany, 2011. [Google Scholar]
- Dwyer, A.A.; Hayes, F.J. Evaluation of Endocrine Disorders of the Hypothalamic-Pituitary-Gonadal (HPG) Axis. In Advanced Practice in Endocrinology Nursing; Llahana, S., Follin, C., Yedinak, C., Grossman, A., Eds.; Springer: Cham, Switzerland, 2019. [Google Scholar] [CrossRef]
- Jones, A.; Brown, B. Pediatric Bone Age Assessment: A Practical Guide; Springer: New York, NY, USA, 2019. [Google Scholar]
- Greulich, W.W.; Pyle, S.I. Radiographic Atlas of Skeletal Development of the Hand and Wrist, 2nd ed.; Stanford University Press: Stanford, CA, USA, 1959. [Google Scholar]
- Prokop-Piotrkowska, M.; Marszałek-Dziuba, K.; Moszczyńska, E.; Szalecki, M.; Jurkiewicz, E. Traditional and New Methods of Bone Age Assessment—An Overview. J. Clin. Res. Pediatr. Endocrinol. 2021, 13, 251–262. [Google Scholar] [CrossRef] [PubMed]
- Satoh, M.; Hasegawa, Y. Factors affecting prepubertal and pubertal bone age progression. Front. Endocrinol. 2022, 13, 967711. [Google Scholar] [CrossRef]
- Grgic, O.; Shevroja, E.; Dhamo, B.; Uitterlinden, A.G.; Wolvius, E.B.; Rivadeneira, F.; Medina-Gomez, C. Skeletal maturation in relation to ethnic background in children of school age: The Generation R Study. Bone 2020, 132, 115180. [Google Scholar] [CrossRef]
- Khadilkar, V.; Oza, C.; Khadilkar, A. Relationship between Height Age, Bone Age and Chronological Age in Normal Children in the Context of Nutritional and Pubertal Status. J. Pediatr. Endocrinol. Metab. 2022, 35, 767–775. [Google Scholar] [CrossRef]
- Toledo Trujillo, F.M. Maduración Ósea en una Muestra de Población Urbana de las Islas Canarias. Ph.D. Thesis, Universidad La Laguna, San Cristóbal de La Laguna, Spain, 1978. [Google Scholar]
- Zhang, A.; Sayre, J.W.; Vachon, L.; Liu, B.J.; Huang, H.K. Racial Differences in Growth Patterns of Children Assessed on the Basis of Bone Age. Radiology 2009, 250, 228–235. [Google Scholar] [CrossRef]
- Martín Pérez, S.E.; Martín Pérez, I.M.; Vega González, J.M.; Molina Suárez, R.; León Hernández, C.; Rodríguez Hernández, F.; Herrera Perez, M. Precision and Accuracy of Radiological Bone Age Assessment in Children Among Different Ethnic Groups: A Systematic Review. Diagnostics 2023, 13, 3124. [Google Scholar] [CrossRef]
- Ontell, F.K.; Ivanovic, M.; Ablin, D.S.; Barlow, T.W. Bone Age in Children of Diverse Ethnicity. AJR Am. J. Roentgenol. 1996, 167, 1395–1398. [Google Scholar] [CrossRef]
- Fregel, R.; Ordóñez, A.C.; Serrano, J.G. The Demography of the Canary Islands from a Genetic Perspective. Hum. Mol. Genet. 2021, 30, R64–R71. [Google Scholar] [CrossRef]
- Alshamrani, K.; Messina, F.; Offiah, A.C. Is the Greulich and Pyle Atlas Applicable to All Ethnicities? A Systematic Review and Meta-Analysis. Eur. Radiol. 2019, 29, 2910–2923. [Google Scholar] [CrossRef] [PubMed]
- Bossuyt, P.M.; Reitsma, J.B.; Bruns, D.E.; Gatsonis, C.A.; Glasziou, P.P.; Irwig, L.; Lijmer, J.G.; Moher, D.; Rennie, D.; de Vet, H.C.; et al. STARD 2015: An Updated List of Essential Items for Reporting Diagnostic Accuracy Studies. BMJ 2015, 351, h5527. [Google Scholar] [CrossRef] [PubMed]
- Bhat, A.K.; Kumar, B.; Acharya, A. Radiographic Imaging of the Wrist. Indian J. Plast. Surg. 2011, 44, 186–196. [Google Scholar] [CrossRef] [PubMed]
- Hardy, D.C.; Totty, W.G.; Reinus, W.R.; Gilula, L.A. Posteroanterior Wrist Radiography: Importance of Arm Positioning. J. Hand Surg. Am. 1987, 12, 504–508. [Google Scholar] [CrossRef] [PubMed]
- Govender, D.; Goodier, M. Bone of Contention: The Applicability of the Greulich–Pyle Method for Skeletal Age Assessment in South Africa. S. Afr. J. Radiol. 2018, 22, 6. [Google Scholar] [CrossRef] [PubMed]
- Tiwari, P.K.; Gupta, M.; Verma, A.; Pandey, S.; Nayak, A. Applicability of the Greulich-Pyle Method in Assessing the Skeletal Maturity of Children in the Eastern Utter Pradesh (UP) Region: A Pilot Study. Cureus 2020, 12, e10880. [Google Scholar] [CrossRef] [PubMed]
- KKim, J.R.; Lee, Y.S.; Yu, J. Assessment of Bone Age in Prepubertal Healthy Korean Children: Comparison Among the Korean Standard Bone Age Chart, Greulich-Pyle Method, and Tanner-Whitehouse Method. Korean J. Radiol. 2015, 16, 201–205. [Google Scholar] [CrossRef]
- Fraga Bermúdez, J.M.; Fernández Lorenzo, J.R. La Pediatría, el Niño y el Pediatra: Una Aproximación General. In Tratado de Pediatría, 1st ed.; Moro Serrano, M., Málaga Guerrero, S., Madero López, L., Eds.; Editorial Médica Panamericana: Madrid, Spain, 2014; Volume 1, pp. 1–18. [Google Scholar]
- Hackman, L.; Black, S. The Reliability of the Greulich and Pyle Atlas When Applied to a Modern Scottish Population. J. Forensic Sci. 2012, 58, 114–119. [Google Scholar] [CrossRef]
- Maggio, A.; Flavel, A.; Hart, R.; Franklin, D. Assessment of the Accuracy of the Greulich and Pyle Hand-Wrist Atlas for Age Estimation in a Contemporary Australian Population. Aust. J. Forensic Sci. 2016, 50, 385–395. [Google Scholar] [CrossRef]
- Schmidt, S.; Koch, B.; Schulz, R.; Reisinger, W.; Schmeling, A. Comparative Analysis of the Applicability of the Skeletal Age Determination Methods of Greulich–Pyle and Thiemann–Nitz for Forensic Age Estimation in Living Subjects. Int. J. Leg. Med. 2007, 121, 293–296. [Google Scholar] [CrossRef]
- Van Rijn, R.R.; Lequin, M.H.; Robben, S.G.F.; Hop, W.C.J.; van Kuijk, C. Is the Greulich and Pyle Atlas Still Valid for Dutch Caucasian Children Today? Pediatr. Radiol. 2001, 31, 748–752. [Google Scholar] [CrossRef] [PubMed]
- Santos, C.; Ferreira, M.; Alves, F.C.; Cunha, E. Comparative Study of Greulich and Pyle Atlas and Maturos 4.0 Program for Age Estimation in a Portuguese Sample. Forensic Sci. Int. 2011, 212, 276.e1–276.e7. [Google Scholar] [CrossRef] [PubMed]
- Pinchi, V.; De Luca, F.; Ricciardi, F.; Focardi, M.; Piredda, V.; Mazzeo, E.; Norelli, G.-A. Skeletal age estimation for forensic purposes: A comparison of GP, TW2 and TW3 methods on an Italian sample. Forensic Sci. Int. 2014, 238, 83–90. [Google Scholar] [CrossRef] [PubMed]
- Santoro, V.; Roca, R.; De Donno, A.; Fiandaca, C.; Pinto, G.; Tafuri, S.; Introna, F. Applicability of Greulich and Pyle and Demirijan aging methods to a sample of Italian population. Forensic Sci. Int. 2012, 221, 153.e1–153.e5. [Google Scholar] [CrossRef] [PubMed]
- Calfee, R.P.; Sutter, M.; Steffen, J.A.; Goldfarb, C.A. Skeletal and chronological ages in American adolescents: Current findings in skeletal maturation. J. Child. Orthop. 2010, 4, 467–470. [Google Scholar] [CrossRef]
- Kullman, L. Accuracy of two dental and one skeletal age estimation method in Swedish adolescents. Forensic Sci. Int. 1995, 75, 225–236. [Google Scholar] [CrossRef]
- Olaotse, B.; Norma, P.G.; Kaone, P.-M.; Morongwa, M.; Janes, M.; Kabo, K.; Shathani, M.; Thato, P. Evaluation of the suitability of the Greulich and Pyle atlas in estimating age for the Botswana population using hand and wrist radiographs of young Botswana population. Forensic Sci. Int. Rep. 2023, 7, 100312. [Google Scholar] [CrossRef]
- Dembetembe, K.A.; Morris, A.G. Is Greulich–Pyle age estimation applicable for determining maturation in male Africans? S. Afr. J. Sci. 2012, 108, 1–6. [Google Scholar] [CrossRef]
- Albaker, A.B.; Aldhilan, A.S.; Alrabai, H.M.; AlHumaid, S.; AlMogbil, I.H.; Alzaidy, N.F.A.; Alsaadoon, S.A.H.; Alobaid, O.A.; Alshammary, F.H. Determination of Bone Age and its Correlation to the Chronological Age Based on the Greulich and Pyle Method in Saudi Arabia. J. Pharm. Res. Int. 2021, 33, 1186–1195. [Google Scholar] [CrossRef]
- Nang, K.M.; Ismail, A.J.; Tangaperumal, A.; Wynn, A.A.; Thein, T.T.; Hayati, F.; Teh, Y.G. Forensic age estimation in living children: How accurate is the Greulich-Pyle method in Sabah, East Malaysia? Front. Pediatr. 2023, 11, 1137960. [Google Scholar] [CrossRef]
- Yoon, S.Y.; Lee, K.S.; Bezuidenhout, A.F.; Kruskal, J.B. Spectrum of Cognitive Biases in Diagnostic Radiology. Radiographics 2024, 44, e230059. [Google Scholar] [CrossRef] [PubMed]
- Chen, J.; Gandomkar, Z.; Reed, W.M. Investigating the Impact of Cognitive Biases in Radiologists’ Image Interpretation: A Scoping Review. Eur. J. Radiol. 2023, 166, 111013. [Google Scholar] [CrossRef] [PubMed]
- Busby, L.P.; Courtier, J.L.; Glastonbury, C.M. Bias in Radiology: The How and Why of Misses and Misinterpretations. Radiographics 2018, 38, 236–247. [Google Scholar] [CrossRef] [PubMed]
- Berst, M.J.; Dolan, L.; Bogdanowicz, M.M.; Stevens, M.A.; Chow, S.; Brandser, E.A. Effect of Knowledge of Chronologic Age on the Variability of Pediatric Bone Age Determined Using the Greulich and Pyle Standards. AJR Am. J. Roentgenol. 2001, 176, 507–510. [Google Scholar] [CrossRef]
- Alshamrani, K.; Offiah, A.C. Applicability of Two Commonly Used Bone Age Assessment Methods to Twenty-First Century UK Children. Eur. Radiol. 2019, 30, 504–513. [Google Scholar] [CrossRef]
- Zabet, D.; Rérolle, C.; Pucheux, J.; Telmon, N.; Saint-Martin, P. Can the Greulich and Pyle Method Be Used on French Contemporary Individuals? Int. J. Leg. Med. 2014, 129, 171–177. [Google Scholar] [CrossRef]
- Dawes, T.J.; Vowler, S.L.; Allen, C.M.; Dixon, A.K. Training Improves Medical Student Performance in Image Interpretation. Br. J. Radiol. 2004, 77, 775–776. [Google Scholar] [CrossRef]
- Vincent, C.A.; Driscoll, P.A.; Audley, R.J.; Grant, D.S. Accuracy of Detection of Radiographic Abnormalities by Junior Doctors. Arch. Emerg. Med. 1988, 5, 101–109. [Google Scholar] [CrossRef]
- Christiansen, J.M.; Gerke, O.; Karstoft, J.; Andersen, P.E. Poor interpretation of chest X-rays by junior doctors. Dan. Med. J. 2014, 61, A4875. [Google Scholar]
- Cheung, T.; Harianto, H.; Spanger, M.; Young, A.; Wadhwa, V. Low Accuracy and Confidence in Chest Radiograph Interpretation Amongst Junior Doctors and Medical Students. Intern. Med. J. 2018, 48, 864–868. [Google Scholar] [CrossRef]
- Martrille, L.; Papadodima, S.; Venegoni, C.; Molinari, N.; Gibelli, D.; Baccino, E.; Cattaneo, C. Age Estimation in 0–8-Year-Old Children in France: Comparison of One Skeletal and Five Dental Methods. Diagnostics 2023, 13, 1042. [Google Scholar] [CrossRef] [PubMed]
- Al-Khater, K.M.; Hegazi, T.M.; Al-Thani, H.F.; Al-Muhanna, H.T.; Al-Hamad, B.W.; Alhuraysi, S.M.; Alsfyani, W.A.; Alessa, F.W.; Al-Qwairi, A.O.; Al-Qwairi, A.O.; et al. Time of appearance of ossification centers in carpal bones: A radiological retrospective study on Saudi children. Saudi Med. J. 2020, 41, 938–946. [Google Scholar] [CrossRef] [PubMed]
- Reynolds, E. Degree of kinship and pattern of ossification. A longitudinal X-ray study of the appearance pattern of ossification centers in children of different kinship groups. AJBA 1943, 1, 405–416. [Google Scholar] [CrossRef]
- Gaudino, R.; De Filippo, G.; Bozzola, E.; Gasparri, M.; Bozzola, M.; Villani, A.; Radetti, G. Current clinical management of constitutional delay of growth and puberty. Ital. J. Pediatr. 2022, 48, 45. [Google Scholar] [CrossRef] [PubMed]
- Rosenfield, R.L.; Lipton, R.B.; Drum, M.L. Thelarche, Pubarche, and Menarche Attainment in Children with Normal and Elevated Body Mass Index. Pediatrics 2009, 123, 84–88, Erratum in: Pediatrics 2009, 123, 1255. [Google Scholar] [CrossRef]
- De Bont, J.; Díaz, Y.; Casas, M.; García-Gil, M.; Vrijheid, M.; Duarte-Salles, T. Time Trends and Sociodemographic Factors Associated with Overweight and Obesity in Children and Adolescents in Spain. JAMA Netw. Open 2020, 3, e201171. [Google Scholar] [CrossRef]
- Li, W.; Liu, Q.; Deng, X.; Chen, Y.; Liu, S.; Story, M. Association between Obesity and Puberty Timing: A Systematic Review and Meta-Analysis. Int. J. Environ. Res. Public Health 2017, 14, 1266. [Google Scholar] [CrossRef]
- Huang, A.; Reinehr, T.; Roth, C.L. Connections between Obesity and Puberty: Invited by Manuel Tena-Sempere, Cordoba. Curr. Opin. Endocr. Metab. Res. 2020, 14, 160–168. [Google Scholar] [CrossRef]
- Gavela-Pérez, T.; Garcés, C.; Navarro-Sánchez, P.; López Villanueva, L.; Soriano-Guillén, L. Earlier Menarcheal Age in Spanish Girls Is Related with an Increase in Body Mass Index between Pre-Pubertal School Age and Adolescence. Pediatr. Obes. 2015, 10, 410–415. [Google Scholar] [CrossRef]
- Pérez-Rodrigo, C.; Aranceta Bartrina, J.; Serra Majem, L.; Moreno, B.; Delgado Rubio, A. Epidemiology of Obesity in Spain. Dietary Guidelines and Strategies for Prevention. Int. J. Vitam. Nutr. Res. 2006, 76, 163–171. [Google Scholar] [CrossRef]
- Shi, L.; Jiang, Z.; Zhang, L. Childhood Obesity and Central Precocious Puberty. Front. Endocrinol. 2022, 13, 1056871. [Google Scholar] [CrossRef] [PubMed]
- Ebrí Torné, B. Comparative Study between Bone Ages: Carpal, Metacarpophalangic, Carpometacarpophalangic Ebrí, Greulich and Pyle, and Tanner Whitehouse2. Med. Res. Arch. 2021, 9, e2625. [Google Scholar] [CrossRef]
- Soudack, M.; Ben-Shlush, A.; Jacobson, J.; Raviv-Zilka, L.; Eshed, I.; Hamiel, O. Bone Age in the 21st Century: Is Greulich and Pyle’s Atlas Accurate for Israeli Children? Pediatr. Radiol. 2012, 42, 343–348. [Google Scholar] [CrossRef] [PubMed]
- Cantekin, K.; Celikoglu, M.; Miloglu, O.; Dane, A.; Erdem, A. Bone Age Assessment: The Applicability of the Greulich-Pyle Method in Eastern Turkish Children. J. Forensic Sci. 2011, 57, 679–682. [Google Scholar] [CrossRef] [PubMed]
- Tsehay, B.; Afework, M.; Mesifin, M. Assessment of Reliability of Greulich and Pyle (GP) Method for Determination of Age of Children at Debre Markos Referral Hospital, East Gojjam Zone. Ethiop. J. Health Sci. 2017, 27, 631–640. [Google Scholar] [CrossRef]
- Kowo-Nyakoko, F.; Gregson, C.L.; Madanhire, T.; Stranix-Chibanda, L.; Rukuni, R.; Offiah, A.C.; Micklesfield, L.K.; Cooper, C.; Ferrand, R.A.; Rehman, A.M.; et al. Evaluation of Two Methods of Bone Age Assessment in Peripubertal Children in Zimbabwe. Bone 2023, 170, 116725. [Google Scholar] [CrossRef]

| Stage | Gender | N | Mean | SD | Min | Max | p-Value | |
|---|---|---|---|---|---|---|---|---|
| Age (mos.) | Preschool | Female | 24 | 39.33 | 15.18 | 20.00 | 67.00 | 0.235 |
| Male | 45 | 46.49 | 13.33 | 18.00 | 69.00 | 0.105 | ||
| Scholar | Female | 40 | 92.00 | 26.08 | 85.00 | 118.00 | 0.310 | |
| Male | 62 | 100.16 | 20.33 | 75.00 | 109.00 | 0.089 | ||
| Teenager | Female | 16 | 144.17 | 23.81 | 102.00 | 168.00 | 0.150 | |
| Male | 27 | 151.53 | 20.17 | 107.00 | 192.00 | 0.080 | ||
| Weight (kg) | Preschool | Female | 24 | 14.52 | 2.05 | 9.80 | 18.60 | 0.215 |
| Male | 45 | 13.09 | 2.17 | 7.40 | 18.00 | 0.175 | ||
| Scholar | Female | 40 | 29.58 | 7.14 | 17.60 | 40.00 | 0.200 | |
| Male | 62 | 23.67 | 4.85 | 14.20 | 44.00 | 0.115 | ||
| Teenager | Female | 16 | 33.84 | 4.62 | 22.00 | 39.50 | 0.250 | |
| Male | 27 | 34.21 | 3.19 | 23.80 | 45.70 | 0.140 | ||
| Height (m) | Preschool | Female | 24 | 0.91 | 0.07 | 0.77 | 1.05 | 0.289 |
| Male | 45 | 0.94 | 0.05 | 0.80 | 1.10 | 0.175 | ||
| Scholar | Female | 40 | 1.14 | 0.07 | 0.99 | 1.30 | 0.200 | |
| Male | 62 | 1.16 | 0.05 | 0.94 | 1.40 | 0.115 | ||
| Teenager | Female | 16 | 1.33 | 0.04 | 1.21 | 1.37 | 0.250 | |
| Male | 27 | 1.33 | 0.03 | 1.16 | 1.45 | 0.140 | ||
| BMI (kg/m2) | Preschool | Female | 24 | 17.53 | 2.47 | 8.32 | 19.49 | 0.180 |
| Male | 45 | 14.81 | 2.45 | 18.81 | 18.87 | 0.120 | ||
| Scholar | Female | 40 | 22.76 | 5.49 | 13.45 | 20.29 | 0.175 | |
| Male | 62 | 17.59 | 3.60 | 12.57 | 20.92 | 0.150 | ||
| Teenager | Female | 16 | 19.13 | 2.66 | 15.02 | 21.73 | 0.240 | |
| Male | 27 | 19.33 | 1.80 | 14.61 | 20.99 | 0.130 |
| Group | Time of Measurement | Gender | Mean | ICC | 95% CI Lower | 95% CI Upper |
|---|---|---|---|---|---|---|
| Rater 1 | T1 | Female | 77.65 | |||
| Male | 78.33 | |||||
| T2 | Female | 75.25 | 0.995 | 0.990 | 0.998 | |
| Male | 76.21 | 0.996 | 0.992 | 0.998 | ||
| Rater 2 | T1 | Female | 74.10 | |||
| Male | 82.47 | |||||
| T2 | Female | 70.57 | 0.990 | 0.979 | 0.995 | |
| Male | 80.94 | 0.992 | 0.982 | 0.996 | ||
| Rater 3 | T1 | Female | 78.79 | |||
| Male | 78.62 | |||||
| T2 | Female | 80.67 | 0.921 | 0.832 | 0.964 | |
| Male | 81.83 | 0.976 | 0.947 | 0.989 |
| Groups | Gender | Mean | ICC | 95% CI Lower | 95% CI Upper |
|---|---|---|---|---|---|
| Rater 1–Rater 2 | Female | 75.73 | |||
| 72.34 | 0.982 | 0.968 | 0.990 | ||
| Male | 78.33 | ||||
| 81.70 | 0.944 | 0.902 | 0.968 | ||
| Rater 1–Rater 3 | Female | 75.73 | |||
| 79.73 | 0.463 | 0.216 | 0.654 | ||
| Male | 78.33 | ||||
| 80.22 | 0.408 | 0.145 | 0.618 | ||
| Rater 2–Rater 3 | Female | 72.34 | |||
| 79.73 | 0.509 | 0.273 | 0.688 | ||
| Male | 81.70 | ||||
| 80.22 | 0.327 | 0.052 | 0.557 |
| Stage | Mean | SD | MD | W | Z | p | |
|---|---|---|---|---|---|---|---|
| Preschool (n = 69) | CA | 43.485 | 14.476 | ||||
| BA | 26.449 | 15.409 | 17.036 | 2297.5 | 6.517 | <0.001 *** | |
| Female | CA | 39.331 | 15.182 | ||||
| BA | 24.250 | 16.896 | 15.081 | 390.0 | 3.730 | <0.001 *** | |
| Male | CA | 46.496 | 13.333 | ||||
| BA | 31.598 | 24.881 | 14.898 | 776.0 | 4.920 | <0.001 *** | |
| Scholar (n = 102) | CA | 95.684 | 23.906 | ||||
| BA | 87.519 | 35.572 | 8.165 | 3306.5 | 3.346 | <0.001 *** | |
| Female | CA | 92.001 | 26.086 | ||||
| BA | 88.052 | 37.203 | 3.949 | 849.0 | 1.182 | 0.239 | |
| Male | CA | 100.168 | 20.338 | ||||
| BA | 86.870 | 33.876 | 13.298 | 829.0 | 3.898 | <0.001 *** | |
| Teenager (n = 43) | CA | 148.883 | 23.665 | ||||
| BA | 152.042 | 29.943 | −3.159 | 339.00 | −0.954 | 0.823 | |
| Female | CA | 144.170 | 23.810 | ||||
| BA | 148.667 | 24.231 | −4.497 | 69.0 | 0.052 | 0.980 | |
| Male | CA | 151.53 | 20.176 | ||||
| BA | 156.38 | 18.179 | −4.85 | 91.50 | −1.686 | 0.094 |
Disclaimer/Publisher’s Note: The statements, opinions and data contained in all publications are solely those of the individual author(s) and contributor(s) and not of MDPI and/or the editor(s). MDPI and/or the editor(s) disclaim responsibility for any injury to people or property resulting from any ideas, methods, instructions or products referred to in the content. |
© 2024 by the authors. Licensee MDPI, Basel, Switzerland. This article is an open access article distributed under the terms and conditions of the Creative Commons Attribution (CC BY) license (https://creativecommons.org/licenses/by/4.0/).
Share and Cite
Martín Pérez, I.M.; Martín Pérez, S.E.; Vega González, J.M.; Molina Suárez, R.; García Hernández, A.M.; Rodríguez Hernández, F.; Herrera Pérez, M. The Validation of the Greulich and Pyle Atlas for Radiological Bone Age Assessments in a Pediatric Population from the Canary Islands. Healthcare 2024, 12, 1847. https://doi.org/10.3390/healthcare12181847
Martín Pérez IM, Martín Pérez SE, Vega González JM, Molina Suárez R, García Hernández AM, Rodríguez Hernández F, Herrera Pérez M. The Validation of the Greulich and Pyle Atlas for Radiological Bone Age Assessments in a Pediatric Population from the Canary Islands. Healthcare. 2024; 12(18):1847. https://doi.org/10.3390/healthcare12181847
Chicago/Turabian StyleMartín Pérez, Isidro Miguel, Sebastián Eustaquio Martín Pérez, Jesús María Vega González, Ruth Molina Suárez, Alfonso Miguel García Hernández, Fidel Rodríguez Hernández, and Mario Herrera Pérez. 2024. "The Validation of the Greulich and Pyle Atlas for Radiological Bone Age Assessments in a Pediatric Population from the Canary Islands" Healthcare 12, no. 18: 1847. https://doi.org/10.3390/healthcare12181847
APA StyleMartín Pérez, I. M., Martín Pérez, S. E., Vega González, J. M., Molina Suárez, R., García Hernández, A. M., Rodríguez Hernández, F., & Herrera Pérez, M. (2024). The Validation of the Greulich and Pyle Atlas for Radiological Bone Age Assessments in a Pediatric Population from the Canary Islands. Healthcare, 12(18), 1847. https://doi.org/10.3390/healthcare12181847