Article

The Role of Diet and Physical Activity in Shaping COVID-19 Severity: Design, Validation, and Application of a Retrospective Questionnaire

by
Francisco Vásquez-Aguilar
1,
Marcela de Jesús Vergara-Jiménez
1,
Oscar G. Figueroa-Salcido
1,
Jesús Gilberto Arámburo-Gálvez
1,
Feliznando Isidro Cárdenas-Torres
1,
Noé Ontiveros
2,
Erika Martínez-López
3 and
Elisa Barrón-Cabrera
1,*
1
Facultad de Ciencias de la Nutrición y Gastronomía, Universidad Autónoma de Sinaloa, Culiacan 80010, Sinaloa, Mexico
2
Laboratorio de Análisis Clínicos e Investigación (LACIUS, URS), Departamento de Ciencias Químico, Biológicas y Agropecuarias (DC-QB), Facultad de Ciencias Biológicas y de la Salud, Universidad de Sonora, Navojoa 85880, Sonora, Mexico
3
Instituto de Nutrigenética y Nutrigenómica Traslacional, Departamento de Biología Molecular y Genómica, Centro Universitario de Ciencias de la Salud, Universidad de Guadalajara, Guadalajara 44430, Jalisco, Mexico
*
Author to whom correspondence should be addressed.
Healthcare 2024, 12(8), 813; https://doi.org/10.3390/healthcare12080813
Submission received: 2 March 2024 / Revised: 29 March 2024 / Accepted: 6 April 2024 / Published: 10 April 2024

Abstract

:
After the global challenges posed by COVID-19, researchers strived to identify risk factors for severe cases, which lead to various complications—including death. Lifestyle modifications, such as implementing a healthy diet and recommended physical activity, have been shown to be protective against severe COVID-19 cases. Despite an association of a plant-based diet with reduced COVID-19 severity, specific dietary characteristics have not been identified. Also, the methodology for measuring physical activity is variable, with studies overlooking the intensity or the habit components of physical activity. To bridge this gap, our study designed, validated, and applied a retrospective questionnaire with aims of exploring the relationship between lifestyle factors, specifically diet and physical activity, and severe COVID-19. We considered the intensity and years of physical activity habit, which is a limitation of other questionnaires. Results reveal associations of age and BMI with severe COVID-19. An excessive sugar diet was found to be associated with severe COVID-19 and increased symptom duration. We also observed an inverse relationship pattern of moderate- and vigorous-intensity physical activity across case severity, which is absent in walking physical activity. This study lays a foundation for research aiming to identify lifestyle factors that prevent severe COVID-19 cases.

1. Introduction

The emergence of the coronavirus disease 2019 (COVID-19), driven by the SARS-CoV-2 virus, had a significant adverse impact on societies worldwide. The rapid spread of this disease caused unprecedented challenges to global public health systems. As of the current date, COVID-19 has reached about 800 million cases and caused 7 million deaths globally, indicating a prevalence rate of 9.7% and a case-fatality rate of 0.9% [1]. Severe cases of COVID-19 are associated with complications such as pneumonia, acute respiratory distress syndrome, organ failure, and mortality [2]. Identified high risk factors for severe COVID-19 include age, obesity, type 2 diabetes, chronic kidney disease, chronic obstructive pulmonary disease, and coronary atherosclerosis [3,4,5]. Consequently, understanding and managing factors contributing to the severity of COVID-19 cases would allow for the prevention of its related complications.
Lifestyle modifications, including a healthy diet and recommended levels of physical activity (PA) [6], have proven to be effective tools for improving outcomes of chronic conditions associated with severe forms of COVID-19—such as type 2 diabetes and cardiovascular diseases [7,8]. Also, a plant-based diet has been associated with reduced COVID-19 severity [9], but further research is needed to identify specific dietary characteristics influencing the severity of COVID-19. Furthermore, PA has been related to a reduction in severe COVID-19 outcomes such as hospitalization, ICU admission, and mortality [5,10,11,12,13,14,15]. However, there is a high variability in the methodology for measuring PA [10,11,12], limiting the quality of a quantitative synthesis of results (meta-analysis). Several studies use the International Physical Activity Questionnaire (IPAQ) [11,13,15] as a PA measuring tool. The IPAQ is limited to the assessment of the PA pattern of the week preceding the questionnaire application [16], overlooking the PA habit of the individual. Other studies focus on the frequency and duration of PA, ignoring the intensity component of PA [12].
In this context, our study designed, validated, and applied a retrospective questionnaire with aims of exploring the relationship between lifestyle factors, specifically diet and PA, and the severity of COVID-19. We examined the association between specific dietary characteristics and COVID-19 severity. We also considered the intensity component of PA beyond its frequency and duration, and integrated items to account for the temporal limitation of the IPAQ (focus on the most recent week of PA) [16]. This article serves as a hypothesis-generating piece for more comprehensive research aiming to assess the association between lifestyle and severe COVID-19.

2. Materials and Methods

2.1. Questionnaire Design

The questionnaire (see Supplementary Materials) was designed to identify PA and eating patterns in subjects who developed severe COVID-19. A retrospective questionnaire was applied in a cross-sectional fashion. The questionnaire was divided into the following six sections: (1) demographic information without revealing identity (age, sex, nationality, occupation, and education); (2) COVID-19 diagnosis and disease severity (diagnostic method, symptoms, hospitalization, number of days with symptoms, oxygen support); (3) medical history (particularly chronic medical conditions); (4) Diet and social history (type of diet, food cooking habits, eating schedule, water consumption, tobacco smoking, alcohol consumption, and sleep habits); (5) PA activity (based on the IPAQ short version questionnaire plus additional items addressing the type, frequency, intensity, session duration, and years of PA habit); and (6) vaccination (type of vaccine and received doses). The questionnaire comprised 56 items, but some questions could be skipped if the previous answer was negative. The questions were kept as short and simple as possible, and technical terms were avoided.

2.2. Questionnaire Validation

The questionnaire was validated in the following order: content validity, face validity, and test reproducibility. A Spanish native speaker expert panel assessed the validity of the content. The panel consisted of 11 health sciences professionals involved in research, including sports scientists, physicians, and nutritionists. The panel evaluated the relevance, clarity, writing, terminology, and format of each item using a numerical scale from 1 (unacceptable) to 5 (excellent) [17]. A content validity coefficient (CVC) was employed to determine the concordance of the answers among experts [17]. An item was accepted if it achieved a CVC ≥ 0.80. Items with a score below this threshold were excluded from the questionnaire.
A cohort of healthy Spanish native speakers from the northwest of Mexico assessed the face validity. This cohort was not included in the sample. Participants evaluated the clarity and comprehension of each questionnaire item. To assess clarity, a three-point ordinal scale was utilized: 1 (incomprehensible), 2 (difficult to understand), and 3 (clear and comprehensible) [18]. Comprehension was evaluated using a numerical scale ranging from 0 (very difficult to understand) to 10 (very easy to understand) [18]. Furthermore, a comment section was included, allowing participants to suggest improvements for each item. The agreement among participants’ responses was analyzed using Kendall’s W coefficient of concordance. Items were considered clear and comprehensible if they achieved both a clarity score of ≥2 and a comprehension score of ≥7, coupled with Kendall’s W coefficient of ≥0.70. These items were not subject to further rewording. Additionally, the readability of each questionnaire item was evaluated by the Flesch-Szigriszt test [19]. The INFLESZ scale was employed to interpret the results [20]. The readability test was carried out using the INFLESZ 1.0 software (Granada, Granada, Spain). A score of ≥60 was established as the benchmark for considering the questionnaire items as readable.
The reproducibility of the questionnaire was evaluated through a test–retest analysis conducted on a cohort of individuals who had recovered from COVID-19. The participants were instructed to complete the questionnaire on two different occasions, with a minimum interval of two weeks between the first and second administrations. Cohen’s kappa coefficient test was employed to analyze the consistency of the answers between the first and second administrations of the questionnaire. The time to answer the questionnaire was also recorded.

2.3. Questionnaire Application

The questionnaire was digitized, and data were collected using the Survey Monkey platform. Participants were recruited through a hyperlink disseminated on social media, targeting the general population residing in Culiacan, Mexico. Data were collected from November 2022 to January 2023. Individuals aged 18 years or older who self-identified as having a history of COVID-19 disease completed the questionnaire. Only participants who concluded the entire questionnaire were included in the study. All participants provided informed consent for their involvement in this study.

2.4. Participants

The questionnaire was administered to 296 subjects, of whom 197 met the inclusion criteria. These criteria included either receiving a clinical diagnosis of COVID-19 by a physician or undergoing a laboratory test that yielded a positive result for COVID-19. This information was self-reported through the questionnaire. Consequently, the final sample comprised 197 participants. COVID-19 severity was classified based on the question “How do you consider the severity of your illness?” Subjects requiring supplemental oxygen were categorized as having severe COVID-19 [21], even if they reported a different perception of their severity.

2.5. Measuring Lifetime Physical Activity and Sedentary Patterns

Lifetime PA patterns were obtained from the product of the following variables: metabolic equivalent task (MET) according to PA intensity; duration (minutes); frequency (days per week); and PA habit (years of PA pattern). PA intensities were categorized as walking (3.3 METs), moderate PA (4.0 METs), and vigorous PA (8.0 METs). The sedentary lifetime pattern was obtained from the product of sedentary time (hours/day) and sedentary habit (years of sedentary pattern). PA intensities, frequencies, and duration values were derived from the PA section of our questionnaire. MET intensity values align with recommended ranges from the Physical Activity Guidelines for Americans 2nd Ed. and the Compendium of Physical Activity [6,22,23].

2.6. Ethical Considerations

The design, validation, and application of the retrospective questionnaire was performed from February 2022 to January 2023. This study was approved by the ethics committee of the Faculty of Nutrition and Gastronomy of the “Universidad Autónoma de Sinaloa” (Registration number CE-FCNYG-2022-FEB-002). This study was carried out according to the Declaration of Helsinki, and does not represent any physical, emotional, or occupational risk. All the participants accepted and voluntarily answered the questionnaire; however, signed informed consent was not required. The questions were designed to avoid revealing the identity of the participants and information about the researchers in charge of the study was provided.

2.7. Statistical Analysis

A Shapiro–Wilk test was used to evaluate data normality and a Levene’s test to verify the homogeneity of variables. Quantitative variables are expressed as mean ± standard deviation (SD) or standard error of the mean (SEM) when the analysis was adjusted for co-variables. Pearson coefficients were used to analyze the correlation of quantitative variables. Statistical differences between groups were analyzed using a one-way ANOVA test, and post hoc tests were performed according to the homogeneity of variance. Qualitative variables are expressed as frequencies (n) and percentages (%). Associations between qualitative variables were analyzed by the application of a chi-square test. A p value < 0.05 was considered statistically significant. The G*Power 3.1.9.7 software was utilized to calculate a sample size sufficient for a power of 0.85. All statistical analyses were performed using the software SPSS v.29.0 (IBM, Chicago, IL, USA) and GraphPad Prism 10 software was used to create figures.

3. Results

3.1. Questionnaire Validation

A total of 11 health professionals assessed the relevance, clarity, writing, terminology, and format of each questionnaire item. All the evaluated parameters had scores higher than 4 (Table 1), meaning that the items are clear, relevant, and have an adequate terminology and format for the target population. We included items with a CVC ≥ 0.80. The average CVC for the whole questionnaire was 0.90 (CVCt, Table 1), indicating an adequate validity and agreement among health professionals’ scores for each parameter.
In total, 53 participants (37 females, 16 males; 18–54 years old) assessed the clarity and comprehension of each questionnaire item. The average clarity score was 2.94 ± 0.04, classifying the questionnaire as clear. A strong concordance among participants for clarity scores was obtained (Kendall’s W value: 0.929), suggesting a high agreement among participants’ responses. For comprehension assessment, a continuous numerical scale ranging from 0 (very difficult to understand) to 10 (very easy to understand) was employed. We obtained a comprehension score of 9.81 ± 0.20 with a strong agreement among participants’ scores (Kendall’s W value: 0.716). No further rewording was suggested for any items evaluated. The Flesch-Szigriszt readability score was 64.88, which is considered as normal readability.
The consistency between the responses from the first and second questionnaire application was assessed by Cohen’s k coefficient. A total of 25 participants (18 females, 7 males; 18–69 years old) answered the questionnaire twice at different times. Cohen’s k coefficient was 0.755, which is interpreted as substantial agreement. Overall, the questionnaire was classified as clear and comprehensible by participants and generates consistent responses across time.

3.2. Description of the Study Sample

Social and Demographic Characteristics

Our study sample (n = 197) was composed of Mexican mestizos with a mean age of 30.30 ± 12.05 years and BMI of 25.50 ± 4.21 kg/m2 (Table 2). Sex was distributed as 66.0% females and 34.0% males, most of them being single (62.4%). Education wise, 38.1% were students, 32.5% were employees, and the majority (69.5%) were taking courses or had finished a bachelor’s degree. The rest of the sociodemographic characteristics of the sample are illustrated in Table 2.
Regarding the COVID-19 profile (Table 3), 85.30% of the subjects were diagnosed using a laboratory test (PCR, antigen, antibody), and the rest were diagnosed solely by clinical evaluation (14.70%). Most of the individuals were diagnosed from 2020 to 2022 (98%). COVID-19 severity was classified as mild (n = 91, 46.2%), moderate (n = 89, 45.2%), and severe (n = 17, 8.6%). The participants had COVID-19 symptoms for a mean of 8.57 ± 5.72 days and lost 1.48 ± 3.7 Kg during their COVID-19 infection. The rest of the COVID-19 profile including the distribution of symptoms, comorbidities, and vaccinations are illustrated in Table 3.

3.3. Significant Correlations among Study Participants

Social and Demographic Characteristics

We found Significant correlations among the following quantitative variables: Age, BMI, days with symptoms, and post-COVID-19 weight loss. Table 4 illustrates their Pearson correlation coefficient (r), and their level of significance.

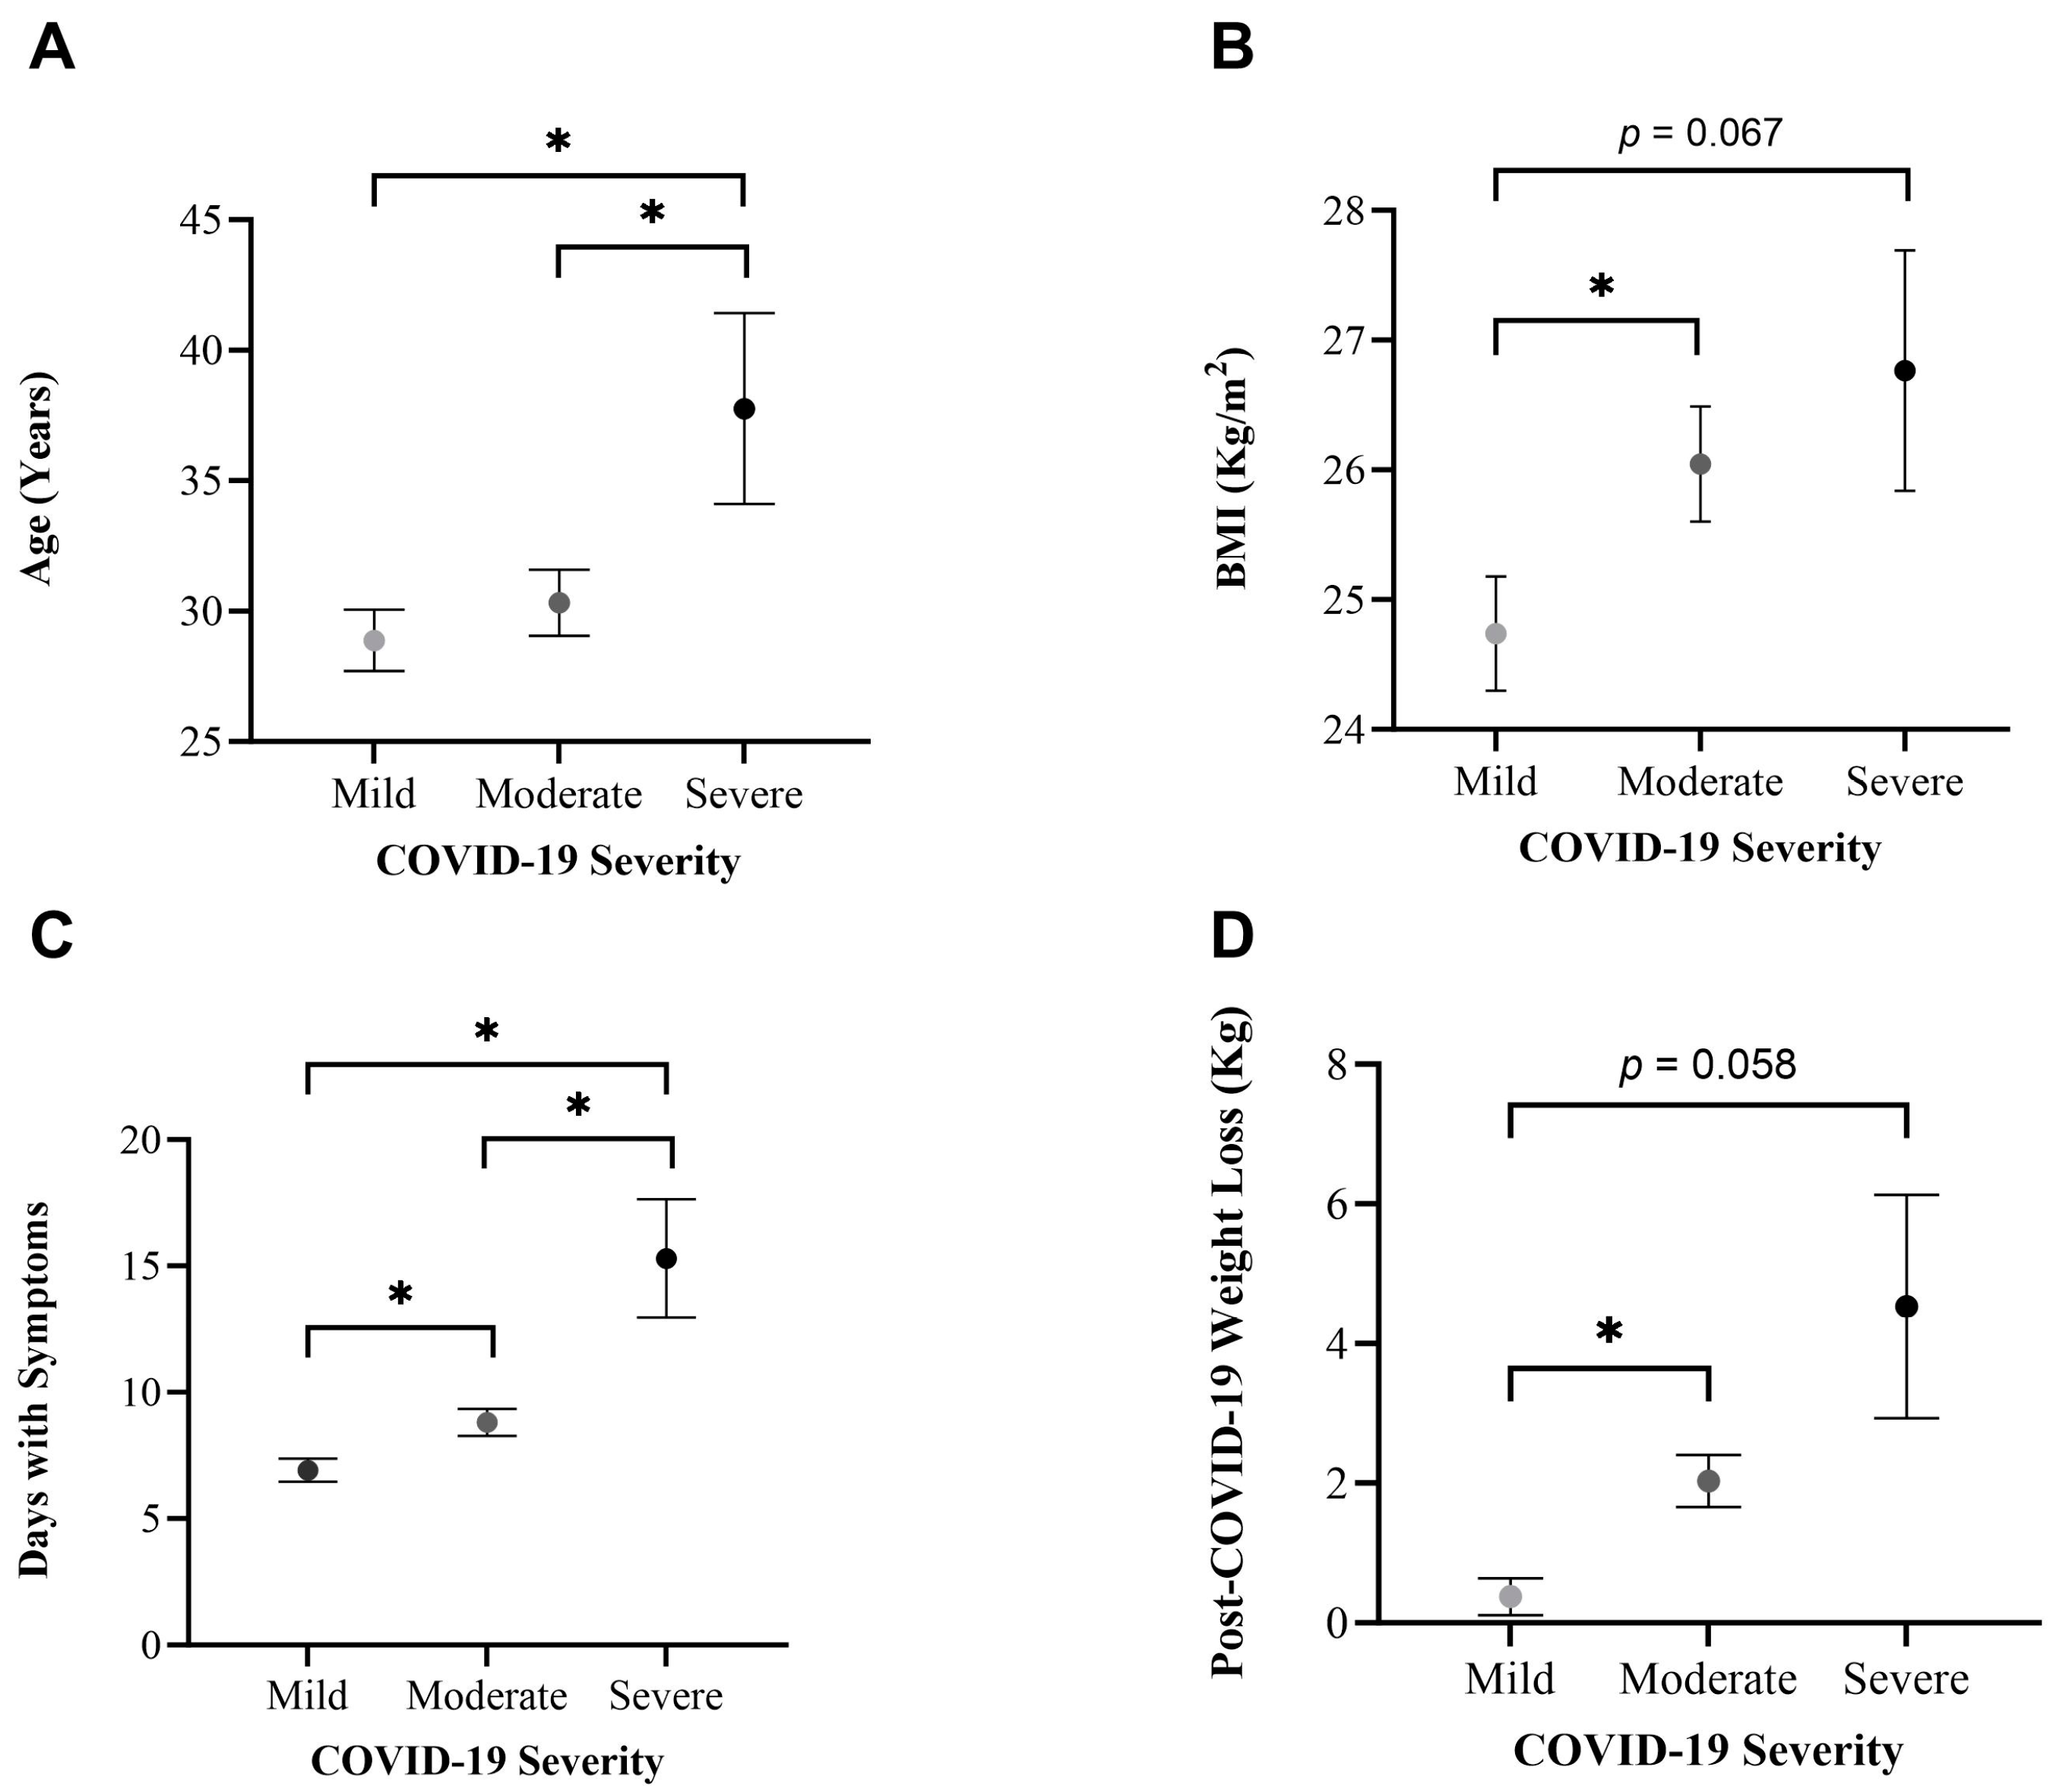
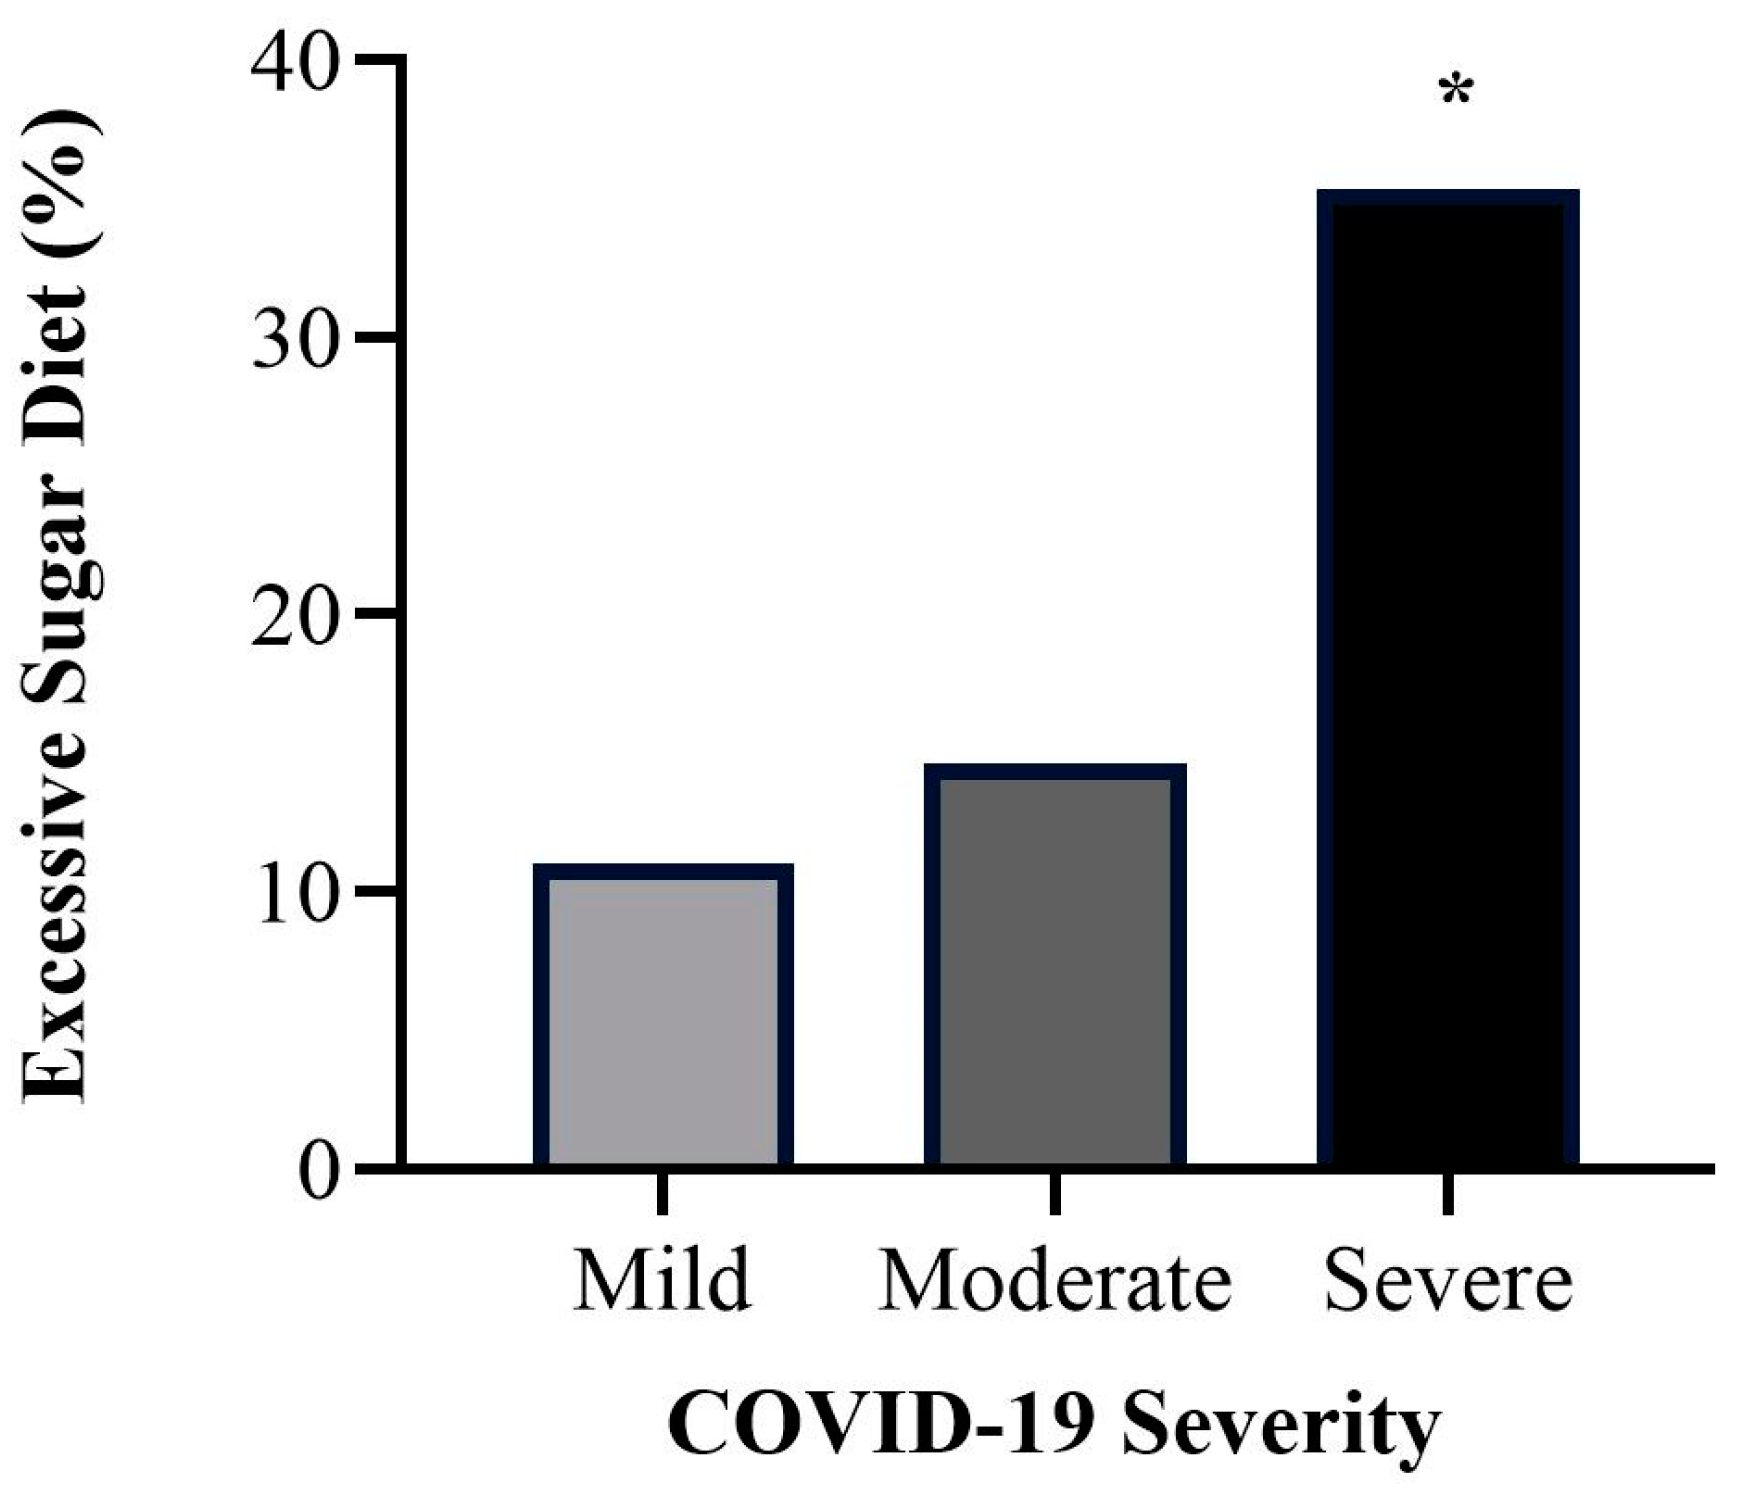
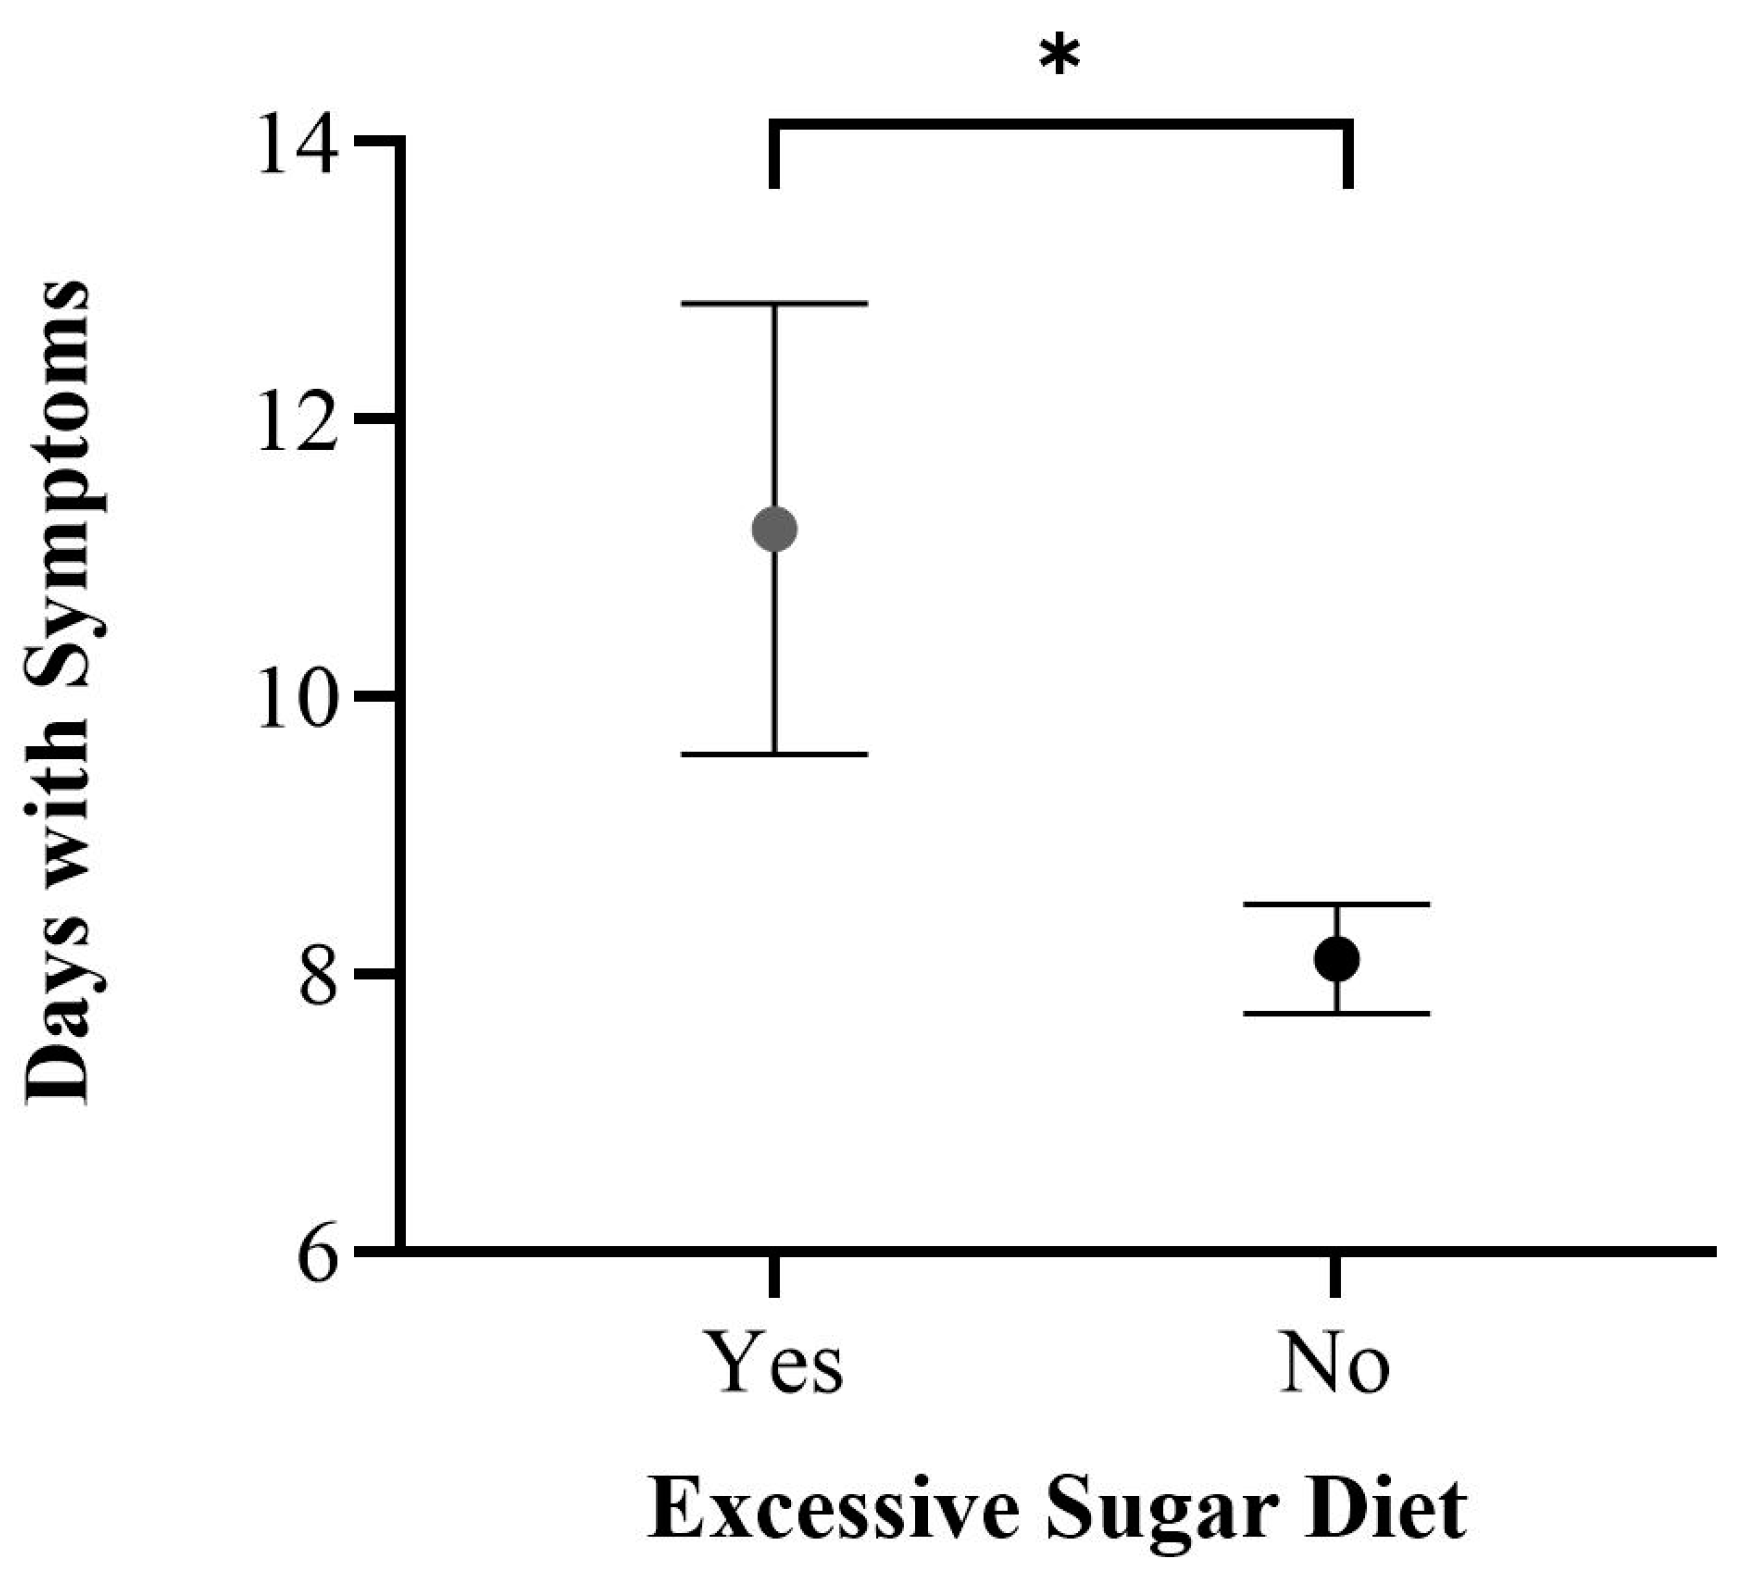
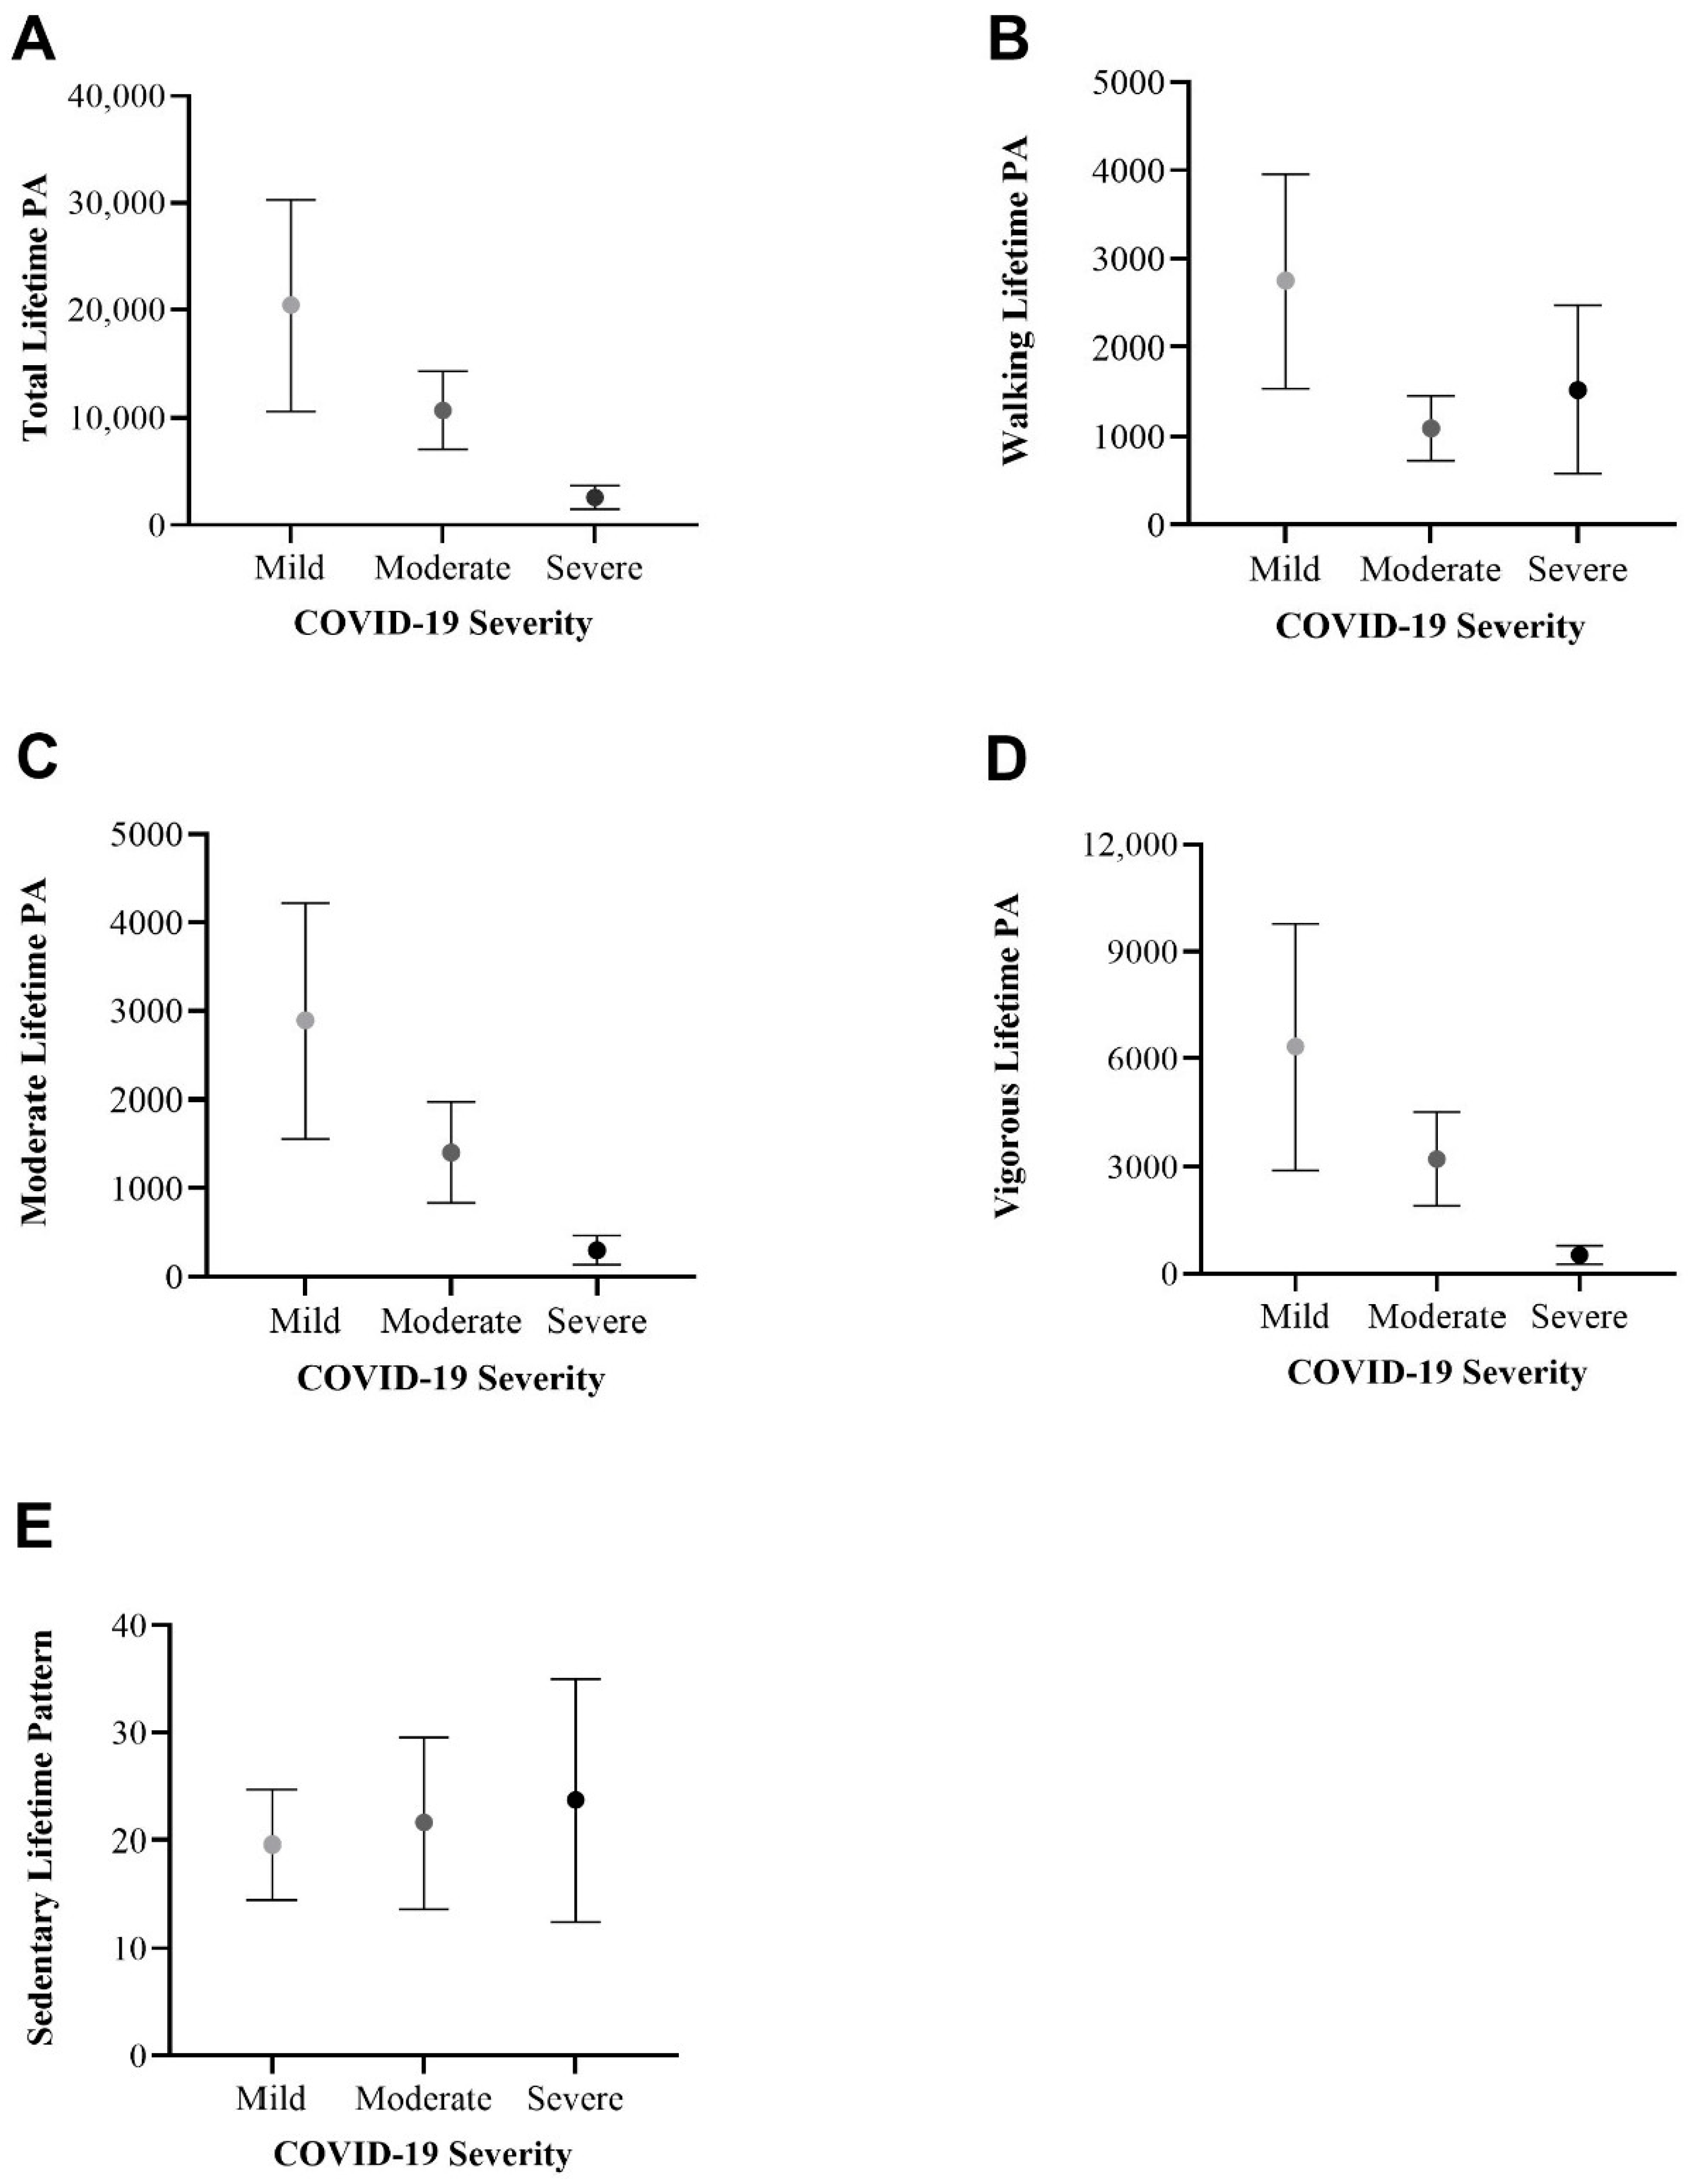
3.4. Differences per COVID-19 Severity

We conducted one-way ANOVAs to assess differences in COVID severity levels according to the following variables: age, BMI, days with symptoms, and post-COVID-19 weight loss (Figure 1). ANOVAs revealed a statistically significant difference in the subject’s age (p = 0.020), BMI (p = 0.048), days with symptoms (p < 0.001), and post-COVID-19 weight loss (p < 0.001) across COVID-19 severity levels. Post hoc tests were conducted to assess between group differences (Figure 1).

3.4.1. Dietary Patterns

An excessive sugar diet was found to be associated with severe COVID-19. Figure 2 illustrates how individuals with severe COVID-19 (35%) were more likely to report adherence to an excessive sugar diet when compared with moderate (15%) and mild (11%) COVID-19 cases. A statistically significant difference across COVID-19 severity levels (p = 0.034) was found.
We also found an association between an excessive sugar diet and an increased symptom duration. Figure 3 illustrates adjusted means for days with COVID-19 symptoms according to the presence or absence of an excessive sugar diet. We adjusted for the following variables: age, BMI, and post-COVID-19 weight loss. A significant difference (p = 0.016) was found between the presence of an excessive sugar diet ( x ¯ = 10.9 ± 1.0 days) and an absence of an excessive sugar diet ( x ¯ = 8.12 ± 0.4 days).

3.4.2. Physical Activity Patterns

An ANOVA test was conducted for each independent variable in Figure 4, revealing overall non-significant differences (p > 0.05). We observed a potential inverse relationship pattern between total lifetime PA and COVID-19 severity levels (Figure 4A; mild (mean: 20,448, SE: 9834); moderate (mean: 10,731, SE: 3636); severe (mean: 2593, SE: 1105). Walking lifetime PA demonstrated an unclear relationship with COVID-19 severity [Figure 4B: mild (mean: 2750, SE: 1205); moderate (mean:1093, SE: 367); severe (mean: 1528, SE: 947)]. Moderate lifetime PA [Figure 4C; Mild (mean: 2890, SE: 1328); moderate (mean: 1407, SE: 573); severe (mean: 299, SE: 164)] and vigorous lifetime PA [Figure 4D; mild (mean: 6336, SE: 3437); moderate (mean: 3220, SE: 1311); severe (mean: 252, SE: 258)] seem to have an inverse relationship pattern with COVID-19 severity levels. Finally, the sedentary lifetime pattern might have a proportional relationship with COVID-19 severity [Figure 4E; mild (mean: 19.6, SE: 5.1); moderate (mean: 21.6, SE: 7.9); severe (mean: 23.7, SE: 11.3)].

4. Discussion

This study presents the strong validation scores of the questionnaire we designed and then applied (Table 1). We found associations between severe COVID-19 and age, BMI, days with symptoms, and post-COVID-19 weight loss (Figure 1). Individuals with a high-sugar diet were linked to severe COVID-19 (Figure 2) and reported an increased symptom duration (Figure 3). We also observed an inverse relationship pattern between COVID-19 severity levels and total, moderate, and vigorous lifetime PA, which is absent in walking lifetime PA (Figure 4).
Lifestyle modifications, particularly maintaining a healthy diet and engaging in PA, have been shown to improve outcomes related to chronic conditions associated with severe forms of COVID-19, such as type 2 diabetes and cardiovascular diseases [7,8]. Despite evidence suggesting an association of a plant-based diet with milder COVID-19 outcomes [9], we have limited understanding of the specific dietary characteristics influencing COVID-19 severity. Moreover, PA has been associated with a decrease in severe COVID-19 outcomes such as hospitalization, ICU admission, and mortality [10,11,12], even when controlling for other known risk factors such as age and chronic diseases [4,5,13,14,15]. The lack of recommended PA has been suggested as the most important modifiable risk factor for severe COVID-19 [5]. However, the methodology for measuring PA is heterogeneous, [10,11,12], limiting the synthesis of results (meta-analysis). The IPAQ is widely used for measuring PA [11,13,15], but is limited to the assessment of the PA pattern of the week preceding the questionnaire application [16]—overlooking the PA habit of the individual. Also, some studies focus on the frequency and duration of PA, ignoring the pivotal intensity component of PA [12], as emphasized in the most recent PA guideline for Americans [6].
In this context, we designed, validated, and applied a questionnaire to explore the relationship between lifestyle factors, specifically diet and PA, and the severity of COVID-19 cases. We aimed to identify specific dietary characteristics associated with COVID-19 severity. Regarding PA, our questionnaire considers the frequency, duration, and intensity of PA. We also acknowledged the temporal limitation of the IPAQ [16], which assesses the most recent week of PA assessment, by integrating an item that explores the years of PA habit.
Our study illustrates the interplay between age, BMI, days with symptoms, and post-COVID-19 weight loss, revealing positive correlations among these factors (Table 4). We also found an association between severe COVID-19 and age; BMI; days with symptoms; and post-COVID-19 weight loss (Figure 1), confirming previous findings of age and obesity as risk factors for severe COVID-19 [4,5].
In line with the previous evidence associated with a healthy diet, such as a plant-based diet with milder COVID-19 outcomes [9], we identified an association between an excessive sugar diet and COVID-19 severity (Figure 2) and symptom duration (Figure 3). The link between a high-sugar diet and severe COVID-19 has been hypothesized in the literature [24] and is supported by our results (Figure 2 and Figure 3). A high-sugar diet has been related to elevated inflammatory markers [25], and chronic systemic inflammation has been linked to the development of chronic diseases associated with severe COVID-19 [3,4,5,26]. Therefore, this may explain the association of a high-sugar diet with severe COVID-19.
Concerning PA, our results seem to demonstrate an inverse relationship pattern between severe COVID-19 and total, moderate, and vigorous lifetime PA (Figure 4A,C,D). Notably, no inverse relationship pattern is observed in walking lifetime PA (Figure 4B). These difference in patterns may explain the potential additive benefits of moderate to high-intensity PA on COVID-19 severity when compared to the benefits of walking or low intensity PA. The intensity of the PA seems to be a factor to consider in assessing PA protective effects against severe COVID-19, as it has been suggested for general health benefits [6]. Additionally, a slight proportional relationship pattern was observed between sedentary lifetime PA and COVID-19 severity levels (Figure 4E), in line with evidence that increased sedentary behavior increases all-cause mortality [6]. Although the relationships of lifetime PA and COVID-19 severity are not statistically significant (Figure 4), they highlight the need for further research into the role of both intensity and PA habits on the severity of COVID-19. The need for specific recommendations on the duration, frequency, habit, and intensity of PA for protection against infectious diseases has been expressed before [27]. There is no consensus on whether high-intensity PA is better than moderate-intensity PA for protecting against severe COVID-19. Some authors have observed a linearity in PA doses and reduced COVID-19 severity [4], but others have shown a flattening in the dose–response curve [12], even when considering cardiorespiratory fitness [14]. With recent studies concluding that vigorous PA does not increase the risk of infections [28], as it was once proposed [29], more research is needed to assess the differences between moderate- and vigorous-intensity PA regarding their protection against severe COVID-19.
Despite these valuable insights, it is crucial to acknowledge our study limitations. A self-reported retrospective questionnaire introduces misreporting and recall biases. The elapsed time from COVID-19 diagnosis to the application of the questionnaire had a mean of 17.7 ± 8.7 months. Therefore, to reduce recall bias, we suggest integrating a limited amount of elapsed time from COVID-19 diagnosis as an inclusion criterion of future studies. Moreover, further research on short-term vs. long-term recall would increase the validity of the retrospective questionnaire by elucidating on the adequate elapsed time for questionnaire application. Additionally, the cross-sectional design of our study and a sample size limited to a pilot study constrain causal inferences. Nonetheless, our study contributes valuable insights into the relationship between lifestyle factors and the severity of COVID-19.

5. Conclusions

In conclusion, our study introduces a validated questionnaire overcoming the PA assessment of temporal limitations; it reveals associations of severe COVID-19 with age, BMI, and a high-sugar diet; and it hints for a potential additional protection against severe COVID-19 from performing moderate- to vigorous-intensity PA compared with walking PA. While preliminary, our findings lay the groundwork for further research to inform public health strategies, aiming to prevent severe cases of future COVID-19 outbreaks and enhance overall population health.

Supplementary Materials

The following supporting information can be downloaded at: https://www.mdpi.com/article/10.3390/healthcare12080813/s1, Questionnaire S1: Lifestyle in Times of COVID-19 Questionnaire (Spanish).

Author Contributions

Conceptualization: E.B.-C.; methodology: M.d.J.V.-J., O.G.F.-S., J.G.A.-G., F.I.C.-T., N.O. and E.B.-C.; software: F.V.-A., O.G.F.-S., J.G.A.-G., F.I.C.-T. and N.O.; formal analysis: F.V.-A., O.G.F.-S., J.G.A.-G. and E.B.-C.; investigation: M.d.J.V.-J., E.M.-L. and E.B.-C.; data curation: F.V.-A., O.G.F.-S. and J.G.A.-G.; writing—original draft preparation: F.V.-A., M.d.J.V.-J., O.G.F.-S., J.G.A.-G., F.I.C.-T., N.O., E.M.-L. and E.B.-C.; writing—review and editing: F.V.-A. and E.B.-C.; visualization: M.d.J.V.-J., E.M.-L. and E.B.-C.; supervision: M.d.J.V.-J., E.M.-L. and E.B.-C.; project administration: E.B.-C. All authors have read and agreed to the published version of the manuscript.

Funding

This research received no external funding.

Institutional Review Board Statement

The study was conducted in accordance with the Declaration of Helsinki and approved by the Ethics Committee of the Faculty of Nutrition and Gastronomy of the “Universidad Autónoma de Sinaloa” (approval no. CE-FCNYG-2022-FEB-002, approval date: 21 February 2022).

Informed Consent Statement

Informed consent was obtained from all subjects involved in the study. Written informed consent for publication has been waived due to the participants was kept anonymous during the study.

Data Availability Statement

The data presented in this study are available on request from the corresponding author. The data are not publicly available due to privacy reasons.

Acknowledgments

We would like to express our gratitude to the expert panel responsible for validating the questionnaire and to the individuals who participated in responding to the questionnaire.

Conflicts of Interest

The authors declare no conflict of interest.

References

  1. WHO Coronavirus (COVID-19) Dashboard. Available online: https://covid19.who.int (accessed on 28 February 2024).
  2. Woods, J.A.; Hutchinson, N.T.; Powers, S.K.; Roberts, W.O.; Gomez-Cabrera, M.C.; Radak, Z.; Berkes, I.; Boros, A.; Boldogh, I.; Leeuwenburgh, C.; et al. The COVID-19 Pandemic and Physical Activity. Sports Med. Health Sci. 2020, 2, 55–64. [Google Scholar] [CrossRef] [PubMed]
  3. CDC. COVID-19. Centers for Disease Control and Prevention. Available online: https://www.cdc.gov/coronavirus/2019-ncov/hcp/clinical-care/underlyingconditions.html (accessed on 28 January 2024).
  4. Steenkamp, L.; Saggers, R.T.; Bandini, R.; Stranges, S.; Choi, Y.-H.; Thornton, J.S.; Hendrie, S.; Patel, D.; Rabinowitz, S.; Patricios, J. Small Steps, Strong Shield: Directly Measured, Moderate Physical Activity in 65,361 Adults Is Associated with Significant Protective Effects from Severe COVID-19 Outcomes. Br. J. Sports Med. 2022, 56, 568–577. [Google Scholar] [CrossRef]
  5. Sallis, R.; Young, D.R.; Tartof, S.Y.; Sallis, J.F.; Sall, J.; Li, Q.; Smith, G.N.; Cohen, D.A. Physical Inactivity Is Associated with a Higher Risk for Severe COVID-19 Outcomes: A Study in 48,440 Adult Patients. Br. J. Sports Med. 2021, 55, 1099–1105. [Google Scholar] [CrossRef]
  6. U.S. Department of Health and Human Services. Physical Activity Guidelines for Americans, 2nd Edition. 2018. Available online: https://health.gov/sites/default/files/2019-09/Physical_Activity_Guidelines_2nd_edition.pdf (accessed on 12 January 2024).
  7. Bennett, D.A.; Du, H.; Clarke, R.; Guo, Y.; Yang, L.; Bian, Z.; Chen, Y.; Millwood, I.; Yu, C.; He, P.; et al. Association of Physical Activity with Risk of Major Cardiovascular Diseases in Chinese Men and Women. JAMA Cardiol. 2017, 2, 1349. [Google Scholar] [CrossRef] [PubMed]
  8. Uusitupa, M.; Khan, T.A.; Viguiliouk, E.; Kahleova, H.; Rivellese, A.A.; Hermansen, K.; Pfeiffer, A.; Thanopoulou, A.; Salas-Salvadó, J.; Schwab, U.; et al. Prevention of Type 2 Diabetes by Lifestyle Changes: A Systematic Review and Meta-Analysis. Nutrients 2019, 11, 2611. [Google Scholar] [CrossRef]
  9. Merino, J.; Joshi, A.D.; Nguyen, L.H.; Leeming, E.R.; Mazidi, M.; Drew, D.A.; Gibson, R.; Graham, M.S.; Lo, C.-H.; Capdevila, J.; et al. Diet Quality and Risk and Severity of COVID-19: A Prospective Cohort Study. Gut 2021, 70, 2096–2104. [Google Scholar] [CrossRef]
  10. Gomide, E.B.G.; Abdalla, P.P.; Pisa, M.F.; Schneider, G.; Vieira, L.G.; Mazzonetto, L.F.; De Sousa Oliveira, A.; Sebastião, E.; Dos Santos, A.P. The Role of Physical Activity in the Clinical Outcomes of People Diagnosed with COVID-19: A Systematic Review. JSAMS Plus 2022, 1, 100007. [Google Scholar] [CrossRef] [PubMed]
  11. Rahmati, M.; Shamsi, M.M.; Khoramipour, K.; Malakoutinia, F.; Woo, W.; Park, S.; Yon, D.K.; Lee, S.W.; Shin, J.I.; Smith, L. Baseline Physical Activity Is Associated with Reduced Mortality and Disease Outcomes in COVID-19: A Systematic Review and Meta-analysis. Rev. Med. Virol. 2022, 32, e2349. [Google Scholar] [CrossRef]
  12. Ezzatvar, Y.; Ramírez-Vélez, R.; Izquierdo, M.; Garcia-Hermoso, A. Physical Activity and Risk of Infection, Severity and Mortality of COVID-19: A Systematic Review and Non-Linear Dose–Response Meta-Analysis of Data from 1,853,610 Adults. Br. J. Sports Med. 2022, 56, 1188–1193. [Google Scholar] [CrossRef]
  13. Hamer, M.; Kivimäki, M.; Gale, C.R.; Batty, G.D. Lifestyle Risk Factors, Inflammatory Mechanisms, and COVID-19 Hospitalization: A Community-Based Cohort Study of 387,109 Adults in UK. Brain Behav. Immun. 2020, 87, 184–187. [Google Scholar] [CrossRef]
  14. Brandenburg, J.P.; Lesser, I.A.; Thomson, C.J.; Giles, L.V. Does Higher Self-Reported Cardiorespiratory Fitness Reduce the Odds of Hospitalization from COVID-19? J. Phys. Act. Health 2021, 18, 782–788. [Google Scholar] [CrossRef] [PubMed]
  15. Lee, S.W.; Lee, J.; Moon, S.Y.; Jin, H.Y.; Yang, J.M.; Ogino, S.; Song, M.; Hong, S.H.; Ghayda, R.A.; Kronbichler, A.; et al. Physical Activity and the Risk of SARS-CoV-2 Infection, Severe COVID-19 Illness and COVID-19 Related Mortality in South Korea: A Nationwide Cohort Study. Br. J. Sports Med. 2022, 56, 901–912. [Google Scholar] [CrossRef] [PubMed]
  16. Craig, C.L.; Marshall, A.L.; Sjöström, M.; Bauman, A.E.; Booth, M.L.; Ainsworth, B.E.; Pratt, M.; Ekelund, U.; Yngve, A.; Sallis, J.F.; et al. International Physical Activity Questionnaire: 12-Country Reliability and Validity. Med. Sci. Sports Exerc. 2003, 35, 1381–1395. [Google Scholar] [CrossRef] [PubMed]
  17. Hernadnez-Nieto, R.A. Contributions to Statistical Analysis; Universidad de Los Andes: Bogotá, Colombia, 1992. [Google Scholar]
  18. Arámburo-Gálvez, J.; Carvalho Gomes, I.; André, T.; Beltrán-Cárdenas, C.; Macêdo-Callou, M.; Braga Rocha, É.; Mye-Takamatu-Watanabe, E.; Rahmeier-Fietz, V.; Figueroa-Salcido, O.; Cárdenas-Torres, F.; et al. Translation, Cultural Adaptation, and Evaluation of a Brazilian Portuguese Questionnaire to Estimate the Self-Reported Prevalence of Gluten-Related Disorders and Adherence to Gluten-Free Diet. Medicina 2019, 55, 593. [Google Scholar] [CrossRef] [PubMed]
  19. Szigriszt-Pazos, F. Sistemas Predictivos de Legilibilidad Del Mensaje Escrito: Fórmula de Perspicuidad. Ph.D. Thesis, Universidad Complutense, Madrid, Spain, 2001. [Google Scholar]
  20. Barrio-Cantalejo, I.M.; Simón-Lorda, P.; Melguizo, M.; Escalona, I.; Marijuán, M.I.; Hernando, P. Validation of the INFLESZ Scale to Evaluate Readability of Texts Aimed at the Patient. An. Sist. Sanit. Navar. 2008, 31, 132–152. [Google Scholar]
  21. Wu, Z.; McGoogan, J.M. Characteristics of and Important Lessons from the Coronavirus Disease 2019 (COVID-19) Outbreak in China: Summary of a Report of 72,314 Cases from the Chinese Center for Disease Control and Prevention. JAMA 2020, 323, 1239. [Google Scholar] [CrossRef] [PubMed]
  22. Ashok, P.; Kharche, J.; Raju, R.; Godbole, G. Metabolic Equivalent Task Assessment for Physical Activity in Medical Students. Natl. J. Physiol. Pharm. Pharmacol. 2017, 7, 236. [Google Scholar] [CrossRef]
  23. Herrmann, S.D.; Willis, E.A.; Ainsworth, B.E.; Barreira, T.V.; Hastert, M.; Kracht, C.L.; Schuna, J.M.; Cai, Z.; Quan, M.; Tudor-Locke, C.; et al. 2024 Adult Compendium of Physical Activities: A Third Update of the Energy Costs of Human Activities. J. Sport Health Sci. 2024, 13, 6–12. [Google Scholar] [CrossRef]
  24. Chesnut, W.M.; MacDonald, S.; Wambier, C.G. Could Diet and Exercise Reduce Risk of COVID-19 Syndemic? Med. Hypotheses 2021, 148, 110502. [Google Scholar] [CrossRef]
  25. O’Connor, L.; Imamura, F.; Brage, S.; Griffin, S.J.; Wareham, N.J.; Forouhi, N.G. Intakes and Sources of Dietary Sugars and Their Association with Metabolic and Inflammatory Markers. Clin. Nutr. 2018, 37, 1313–1322. [Google Scholar] [CrossRef]
  26. Furman, D.; Campisi, J.; Verdin, E.; Carrera-Bastos, P.; Targ, S.; Franceschi, C.; Ferrucci, L.; Gilroy, D.W.; Fasano, A.; Miller, G.W.; et al. Chronic Inflammation in the Etiology of Disease across the Life Span. Nat. Med. 2019, 25, 1822–1832. [Google Scholar] [CrossRef] [PubMed]
  27. Chastin, S.F.M.; Abaraogu, U.; Bourgois, J.G.; Dall, P.M.; Darnborough, J.; Duncan, E.; Dumortier, J.; Pavón, D.J.; McParland, J.; Roberts, N.J.; et al. Effects of Regular Physical Activity on the Immune System, Vaccination and Risk of Community-Acquired Infectious Disease in the General Population: Systematic Review and Meta-Analysis. Sports Med. 2021, 51, 1673–1686. [Google Scholar] [CrossRef] [PubMed]
  28. Campbell, J.P.; Turner, J.E. Debunking the Myth of Exercise-Induced Immune Suppression: Redefining the Impact of Exercise on Immunological Health Across the Lifespan. Front. Immunol. 2018, 9, 648. [Google Scholar] [CrossRef] [PubMed]
  29. Nieman, D. Exercise, Infection, and Immunity. Int. J. Sports Med. 1994, 15 (Suppl. S3), S131–S141. [Google Scholar] [CrossRef]
Figure 1. Line graphs illustrating mean and standard error of (A) age, (B) BMI, (C) days with symptoms, and (D) post-COVID-19 weight loss across COVID-19 severity levels. ANOVAs were conducted and yielded overall significant differences across COVID-19 severity levels. Post hoc * p < 0.05. Exact Pot Hoc p values demonstrating trends are included.
Healthcare 12 00813 g001
Figure 2. Bar graph demonstrating the percentage of subjects referring to an excessive sugar diet across COVID-19 severity levels. A chi-squared test was performed (p = 0.034). * = highest difference between observed and expected frequencies.
Healthcare 12 00813 g002
Figure 3. Adjusted means for days with COVID-19 symptoms according to an excessive sugar diet. A significant difference (*) was found between adjusted means (p = 0.016). Adjusted by age, BMI, and post-COVID-19 weight loss.
Healthcare 12 00813 g003
Figure 4. Line graphs of (A) total lifetime PA, (B) walking lifetime PA, (C) moderate lifetime PA, (D) vigorous lifetime PA, and (E) sedentary lifetime pattern across COVID-19 severity levels: comparing mean and standard error. An ANOVA test was conducted, revealing overall non-significant differences (p < 0.05).
Healthcare 12 00813 g004
Table 1. Questionnaire validation scores given by health professionals.
Number of ExpertsRelevance Mean ± SDClarity Mean ± SDWriting and Terminology Mean ± SDFormat Mean ± SDCVCt
114.53 ± 0.674.47 ± 0.774.44 ± 0.784.45 ± 0.820.90
Data are presented as mean and standard deviation. Validation scores range from 1 to 5. CVCt: total content validity coefficient.
Table 2. Social and demographic characteristics of the study sample.
Variable
Age (mean ± SD)30.30 ± 12.05
Sex n (%)
 Female130 (66.0)
 Male67 (34.0)
BMI kg/m2 (mean ± SD)25.50 ± 4.21
Ethnicity n (%)
 Mexican Mestizo197 (100)
Marital Status n (%)
 Single123 (62.4)
 Married63 (32.0)
 Consensual union 7 (3.6)
 Other4 (2.0)
Education n (%)
 Postsecondary education137 (69.5)
 Elementary and secondary education60 (30.5)
Occupation n (%)
 Student75 (38.1)
 Employee 64 (32.5)
 Self-employed43 (21.8)
 Unemployed 5 (2.5)
 Other10 (5.1)
Total sample = 197. Quantitative variables are represented as “mean (± SD)” and qualitative variables as “n (%)”.
Table 3. COVID-19 general profile of the individuals.
Variable Variable
Diagnostic Tool n (%) Days with Symptoms (mean ± SD)8.57 ± 5.72
 PCR76 (38.6)Hospitalized n (%)
 Antigen test59 (29.9) No 185 (98.4)
 Antibody test 22 (11.2) Yes3 (1.6)
 Antigen test + clinical4 (2.0)    ICU1 (33.3)
 Antibody test + clinical7 (3.6)Oxygen Need n (%)
 Clinical29 (14.7) No 181 (96.3)
Year of Diagnosis n (%)  Yes7 (3.7)
 202256 (28.6)Severity n (%)
 202181 (41.3) Mild91 (46.2)
 202055 (28.1) Moderate89 (45.2)
 20194 (2.0) Severe17 (8.6)
Symptoms n (%) Post-COVID-19 Weight Loss (Kg) (mean ± SD)1.48 ± 3.67
 Present188 (95.4)Comorbidities n (%)
    Headache149 (75.6) No 162 (82.2)
    Fatigue 137 (69.5) Yes35 (17.8)
    Fever119 (60.4)Vaccination n (%)
    Sore throat 111 (56.3) Yes 187 (96.4)
    Anosmia107 (54.3) No 7 (3.6)
    Cough 91 (46.2) Initial vaccine type
    Joint pain89 (45.2)    AstraZeneca70 (37.4)
    Eye pain73 (37.1)    Sinovac69 (37.0)
    Nasal congestion69 (35.0)    Pfizer23 (12.3)
    Runny nose 66 (33.5)    CanSino15 (8.0)
    Shortness of breath60 (30.5)    Other10 (5.3)
    Diarrhea 26 (13.2)COVID-19 Post Vaccine n (%)
    Vomit11 (5.6) Yes 62 (35.0)
 Absent9 (4.6) No 115 (65.0)
Items totaling less than 197 (total sample) are attributed to instances where participants left items in blank. Quantitative variables are represented as “mean (± SD)” and qualitative variables as “n (%)”.
Table 4. Significant Correlations Among Variables of Interest.
Variable1234
1. Age1.000.45 **0.22 **0.17 *
2. BMI (Pre-COVID-19) 1.000.15 *0.77 *
3. Days with Symptoms 1.000.17 *
4. Post-COVID-19 Weight Loss 1.00
* Significance at the 0.05 level (2-tailed), ** Significance at the 0.01 level (2-tailed).
Disclaimer/Publisher’s Note: The statements, opinions and data contained in all publications are solely those of the individual author(s) and contributor(s) and not of MDPI and/or the editor(s). MDPI and/or the editor(s) disclaim responsibility for any injury to people or property resulting from any ideas, methods, instructions or products referred to in the content.

