
Association Between Alcohol Consumption, Other Healthy Habits and Sociodemographic Variables and the Values of Different Insulin Resistance Risk Scales in 139,634 Spanish Workers

 , , , , , and
Abstract
1. Introduction
2. Materials and Methods
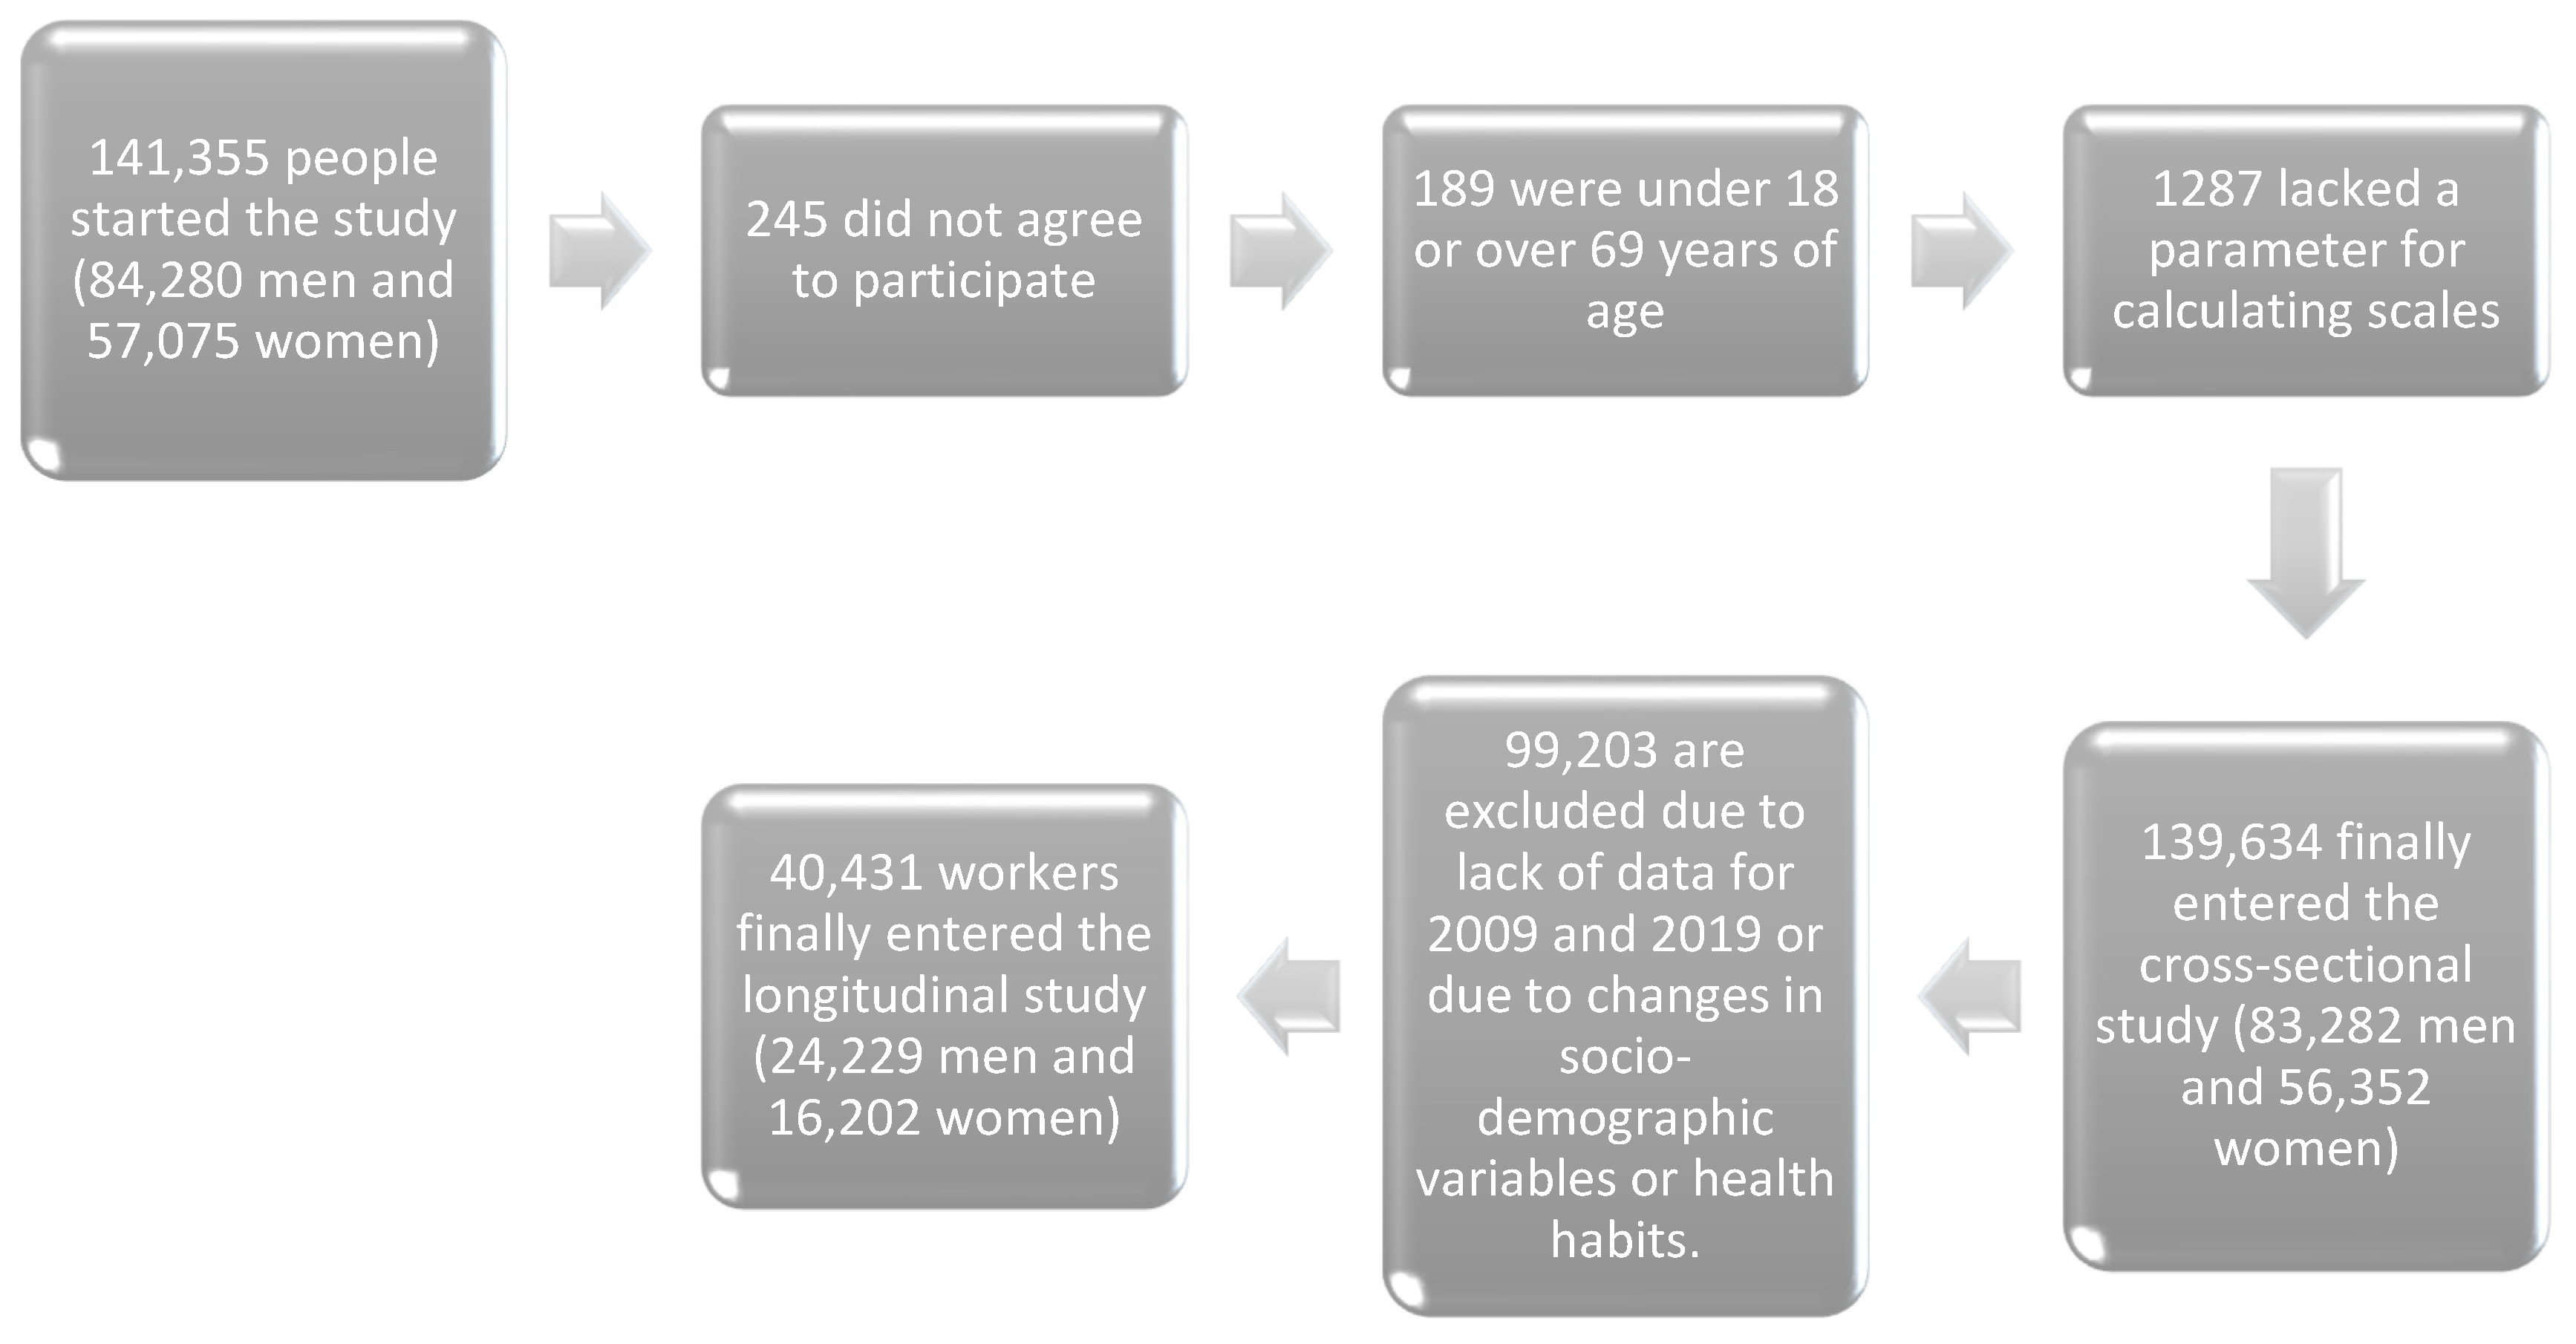
- Age range between 18 and 69 years (i.e., within the working-age population).
- Active employment in one of the participating companies and absence of temporary incapacity at the time of data collection.
- Availability of all necessary variables to calculate the different cardiovascular risk scores.
- Willingness to participate in the study and provide consent for data usage in epidemiological research.
- For the retrospective longitudinal study, availability of complete data for both 2009 and 2019, with no changes in socio-demographic characteristics or health-related behaviors during this period.
2.1. Determination of Variables
- Triglyceride-Glucose Index (TyG) [51]: Computed using the formula TyG = LN (triglycerides × fasting glucose/2), where values equal to or exceeding 8.5 indicate a high risk of insulin resistance. An extended version, TyG-BMI, incorporates the body mass index (BMI) and is calculated as TyG × BMI.The Triglyceride-Glucose Index (TyG) has demonstrated adequate validity as an indirect marker of insulin resistance, showing a strong correlation with the reference method HOMA-IR and other clinical measures. Regarding its reliability, studies assessing its internal consistency using Cronbach’s alpha have reported values above 0.80, indicating good reliability. These findings support its utility as an accessible, practical and reliable tool in both clinical and epidemiological contexts.
- Single-Point Insulin Sensitivity Estimator (SPISE): Derived using the equation SPISE = (600 × HDL0.185/(triglycerides0.2 × BMI1.338) and its inverse, the SPISE-IR, which is calculated as 10/SPISE. An SPISE-IR value of 1.51 or greater is indicative of elevated insulin resistance risk [52].The SPISE has shown good validity for estimating insulin sensitivity, particularly in pediatric and adolescent populations, demonstrating adequate correlation with reference methods such as the euglycemic clamp. In terms of reliability, studies evaluating its internal consistency using Cronbach’s alpha reported values close to or above 0.80, supporting its use as a reliable, simple and noninvasive tool for assessing metabolic risk in various clinical and population settings.
- Metabolic Score for Insulin Resistance (METS-IR) [50]: Determined using the formula METS-IR = LN(2 × glucose) + (triglycerides × BMI)/LN(HDL-c). A threshold of 50 or above is considered high risk for insulin resistance [53].The METS-IR has demonstrated high validity for estimating insulin resistance, showing a strong correlation with the euglycemic clamp method and HOMA-IR. Furthermore, it exhibits good discriminative capacity for identifying metabolic risk across diverse populations. Regarding reliability, studies assessing its internal consistency using Cronbach’s alpha have reported values above 0.80, indicating adequate stability and reliability for clinical and epidemiological applications.
- Class I: University professionals and senior managers.
- Class II: Skilled self-employed workers and intermediate-level occupations.
- Class III: Unskilled workers.
2.2. Statistical Analysis
3. Results
4. Discussion
Strengths and Limitations
5. Conclusions
Author Contributions
Funding
Institutional Review Board Statement
Informed Consent Statement
Data Availability Statement
Conflicts of Interest
References
- İlhan, M.N.; Yapar, D. Alcohol consumption and alcohol policy. Turk. J. Med. Sci. 2020, 50, 1197–1202. [Google Scholar] [CrossRef] [PubMed]
- Balagopal, G.; Davidson, S.; Gill, S.; Barengo, N.; De La Rosa, M.; Sanchez, M. The impact of cultural stress and gender norms on alcohol use severity among Latino immigrant men. Ethn. Health 2022, 27, 1271–1289. [Google Scholar] [CrossRef]
- Hu, Q.; Chen, H.; Shen, C.; Zhang, B.; Weng, X.; Sun, X.; Liu, J.; Dong, Z.; Hu, K.; Ge, J.; et al. Impact and potential mechanism of effects of chronic moderate alcohol consumption on cardiac function in aldehyde dehydrogenase 2 gene heterozygous mice. Alcohol. Clin. Exp. Res. 2022, 46, 707–723. [Google Scholar] [CrossRef] [PubMed]
- Meza, V.; Arnold, J.; Díaz, L.A.; Valverde, M.A.; Idalsoaga, F.; Ayares, G.; Devuni, D.; Arab, J.P. Alcohol Consumption: Medical Implications, the Liver and Beyond. Alcohol Alcohol. 2022, 57, 283–291. [Google Scholar] [CrossRef] [PubMed]
- Roerecke, M. Alcohol’s Impact on the Cardiovascular System. Nutrients 2021, 13, 3419. [Google Scholar] [CrossRef]
- Åberg, F.; Byrne, C.D.; Pirola, C.J.; Männistö, V.; Sookoian, S. Alcohol consumption and metabolic syndrome: Clinical and epidemiological impact on liver disease. J. Hepatol. 2023, 78, 191–206. [Google Scholar] [CrossRef]
- Yuan, S.; Chen, J.; Ruan, X.; Sun, Y.; Zhang, K.; Wang, X.; Li, X.; Gill, D.; Burgess, S.; Giovannucci, E.; et al. Smoking, alcohol consumption, and 24 gastrointestinal diseases: Mendelian randomization analysis. eLife 2023, 12, e84051. [Google Scholar] [CrossRef]
- Singh, N.; Nandy, S.K.; Jyoti, A.; Saxena, J.; Sharma, A.; Siddiqui, A.J.; Sharma, L. Protein Kinase C (PKC) in Neurological Health: Implications for Alzheimer’s Disease and Chronic Alcohol Consumption. Brain Sci. 2024, 14, 554. [Google Scholar] [CrossRef]
- Zhao, J.; Stockwell, T.; Naimi, T.; Churchill, S.; Clay, J.; Sherk, A. Association Between Daily Alcohol Intake and Risk of All-Cause Mortality: A Systematic Review and Meta-analyses. JAMA Netw. Open 2023, 6, e236185, Erratum in JAMA Netw. Open 2023, 6, e2315283. [Google Scholar] [CrossRef]
- Bryazka, D.; Reitsma, M.B.; Griswold, M.G.; Abate, K.H.; Abbafati, C.; Abbasi-Kangevari, M.; Abbasi-Kangevari, Z.; Abdoli, A.; Abdollahi, M.; Abdullah, A.Y.M.; et al. Population-level risks of alcohol consumption by amount, geography, age, sex, and year: A systematic analysis for the Global Burden of Disease Study 2020. Lancet 2022, 400, 185–235, Erratum in Lancet 2022, 400, 358. [Google Scholar] [CrossRef]
- Kim, S.Y.; Freeland-Graves, J.H.; Kim, H.J. Alcohol consumption according to socioeconomic and hypertensive status among Korean adults. Alcohol 2022, 98, 19–24. [Google Scholar] [CrossRef]
- Saunders, G.R.B.; Wang, X.; Chen, F.; Jang, S.-K.; Liu, M.; Wang, C.; Gao, S.; Jiang, Y.; Khunsriraksakul, C.; Otto, J.M.; et al. Genetic diversity fuels gene discovery for tobacco and alcohol use. Nature 2022, 612, 720–724. [Google Scholar] [CrossRef] [PubMed]
- Eakins, D.R.; Neilson, E.C.; Stappenbeck, C.A.; Nguyen, H.V.; Davis, K.C.; George, W.H. Alcohol intoxication and sexual risk intentions: Exploring cultural factors among heavy drinking women. Addict. Behav. 2022, 131, 107314. [Google Scholar] [CrossRef] [PubMed]
- Chagas, C.; Martins, L.B.; Bezerra, A.G.; de Paula, T.C.S.; Xavier, A.C.A.; Zangari, W.; Galduróz, J.C.F. A Systematic Review on Alcohol Consumption among Non-Religious and Religious Adults. Subst. Use Misuse 2023, 58, 238–256. [Google Scholar] [CrossRef]
- Fu, Q.; Dai, H.; Shen, S.; He, Y.; Zheng, S.; Jiang, H.; Gu, P.; Sun, M.; Zhu, X.; Xu, K.; et al. Interactions of genes with alcohol consumption affect insulin sensitivity and beta cell function. Diabetologia 2025, 68, 116–127. [Google Scholar] [CrossRef]
- Cao, C.; Wei, C.; Han, Y.; Luo, J.; Xi, P.; Chen, J.; Xiao, X.; Hu, H.; Qi, D. Association between excessive alcohol consumption and incident diabetes mellitus among Japanese based on propensity score matching. Sci. Rep. 2024, 14, 17274. [Google Scholar] [CrossRef]
- Llamosas-Falcón, L.; Rehm, J.; Bright, S.; Buckley, C.; Carr, T.; Kilian, C.; Lasserre, A.M.; Lemp, J.M.; Zhu, Y.; Probst, C. The Relationship Between Alcohol Consumption, BMI, and Type 2 Diabetes: A Systematic Review and Dose-Response Meta-analysis. Diabetes Care 2023, 46, 2076–2083. [Google Scholar] [CrossRef]
- Miyagi, S.; Takamura, T.; Nguyen, T.T.T.; Tsujiguchi, H.; Hara, A.; Nakamura, H.; Suzuki, K.; Tajima, A.; Kannon, T.; Toyama, T.; et al. Moderate alcohol consumption is associated with impaired insulin secretion and fasting glucose in non-obese non-diabetic men. J. Diabetes Investig. 2021, 12, 869–876. [Google Scholar] [CrossRef]
- Kosmas, C.E.; Bousvarou, M.D.; Kostara, C.E.; Papakonstantinou, E.J.; Salamou, E.; Guzman, E. Insulin resistance and cardiovascular disease. J. Int. Med. Res. 2023, 51, 3000605231164548. [Google Scholar] [CrossRef]
- Hall, C.; Yu, H.; Choi, E. Insulin receptor endocytosis in the pathophysiology of insulin resistance. Exp. Mol. Med. 2020, 52, 911–920. [Google Scholar] [CrossRef]
- Hendriks, H.F. Alcohol and Human Health: What Is the Evidence? Annu. Rev. Food Sci. Technol. 2020, 11, 1–21. [Google Scholar] [CrossRef] [PubMed]
- Fuchs, F.D.; Fuchs, S.C. The Effect of Alcohol on Blood Pressure and Hypertension. Curr. Hypertens. Rep. 2021, 23, 1–6. [Google Scholar] [CrossRef] [PubMed]
- Giannopoulos, G.; Anagnostopoulos, I.; Kousta, M.; Vergopoulos, S.; Deftereos, S.; Vassilikos, V. Alcohol Consumption and the Risk of Incident Atrial Fibrillation: A Meta-Analysis. Diagnostics 2022, 12, 479. [Google Scholar] [CrossRef]
- Tayal, U.; Gregson, J.; Buchan, R.; Whiffin, N.; Halliday, B.P.; Lota, A.; Roberts, A.M.; Baksi, A.J.; Voges, I.; E Jarman, J.W.; et al. Moderate excess alcohol consumption and adverse cardiac remodelling in dilated cardiomyopathy. Heart 2022, 108, 619–625. [Google Scholar] [CrossRef]
- Kazibwe, R.; Chevli, P.A.; Evans, J.K.; Allison, M.; Michos, E.D.; Wood, A.C.; Ding, J.; Shapiro, M.D.; Mongraw-Chaffin, M. Association Between Alcohol Consumption and Ectopic Fat in the Multi-Ethnic Study of Atherosclerosis. J. Am. Hear. Assoc. 2023, 12, e030470. [Google Scholar] [CrossRef] [PubMed]
- Minzer, S.; Losno, R.A.; Casas, R. The Effect of Alcohol on Cardiovascular Risk Factors: Is There New Information? Nutrients 2020, 12, 912. [Google Scholar] [CrossRef]
- Caslin, B.; Mohler, K.; Thiagarajan, S.; Melamed, E. Alcohol as friend or foe in autoimmune diseases: A role for gut microbiome? Gut Microbes 2021, 13, 1916278. [Google Scholar] [CrossRef]
- Singal, A.K.; Mathurin, P. Diagnosis and Treatment of Alcohol-Associated Liver Disease: A Review. JAMA 2021, 326, 165–176. [Google Scholar] [CrossRef]
- Almatar, H.; Alamri, S.; Alduhayan, R.; Alabdulkader, B.; Albdah, B.; Stalin, A.; Alsomaie, B.; Almazroa, A. Visual Functions, Seatbelt Usage, Speed, and Alcohol Consumption Standards for Driving and Their Impact on Road Traffic Accidents. Clin. Optom. 2023, 15, 225–246. [Google Scholar] [CrossRef]
- Alpert, H.R.; Slater, M.E.; Yoon, Y.-H.; Chen, C.M.; Winstanley, N.; Esser, M.B. Alcohol Consumption and 15 Causes of Fatal Injuries: A Systematic Review and Meta-Analysis. Am. J. Prev. Med. 2022, 63, 286–300. [Google Scholar] [CrossRef]
- Rao, R.; Topiwala, A.; Rao, T. Alcohol use disorders and the brain. Addiction 2020, 115, 1580–1589. [Google Scholar] [CrossRef] [PubMed]
- Rumgay, H.; Murphy, N.; Ferrari, P.; Soerjomataram, I. Alcohol and Cancer: Epidemiology and Biological Mechanisms. Nutrients 2021, 13, 3173. [Google Scholar] [CrossRef] [PubMed]
- van der Heide, F.C.T.; Eussen, S.J.P.M.; Houben, A.J.H.M.; Henry, R.M.A.; Kroon, A.A.; van der Kallen, C.J.H.; Dagnelie, P.C.; van Dongen, M.C.J.M.; Berendschot, T.T.J.M.; Schouten, J.S.A.G.; et al. Alcohol consumption and microvascular dysfunction: A J-shaped association: The Maastricht Study. Cardiovasc. Diabetol. 2023, 22, 1–16. [Google Scholar] [CrossRef]
- Freeman, A.M.; Acevedo, L.A.; Pennings, N. Insulin Resistance. 17 August 2023. In StatPearls; StatPearls Publishing: Treasure Island, FL, USA, 2025. [Google Scholar] [PubMed]
- Bovolini, A.; Garcia, J.; Andrade, M.A.; Duarte, J.A. Metabolic Syndrome Pathophysiology and Predisposing Factors. Int. J. Sports Med. 2021, 42, 199–214. [Google Scholar] [CrossRef]
- Sbraccia, P.; D’adamo, M.; Guglielmi, V. Is type 2 diabetes an adiposity-based metabolic disease? From the origin of insulin resistance to the concept of dysfunctional adipose tissue. Eat. Weight. Disord. 2021, 26, 2429–2441. [Google Scholar] [CrossRef]
- Al Asmari, A.K.; Al Shehri, H.A.; Khan, H.A.; Al Omani, S.; Kadasah, S.G.; Horaib, G.B.; Al Buraidi, A.; Al Sharif, A.A.; Mohammed, F.S.; Abbasmanthiri, R.; et al. Serum Levels of Proinflammatory Biomarkers in Military Recruits with and without Metabolic Syndrome. Mediat. Inflamm. 2023, 2023, 4613842. [Google Scholar] [CrossRef]
- Secor, J.D.; Cho, B.S.; Yu, L.J.; Pan, A.; Ko, V.H.; Dao, D.T.; Feigh, M.; Anez-Bustillos, L.; Fell, G.L.; Fraser, D.A.; et al. Structurally-engineered fatty acid 1024 (SEFA-1024) improves diet-induced obesity, insulin resistance, and fatty liver disease. Lipids 2022, 57, 241–255. [Google Scholar] [CrossRef]
- Tong, C.; Wu, Y.; Zhang, L.; Yu, Y. Insulin resistance, autophagy and apoptosis in patients with polycystic ovary syndrome: Association with PI3K signaling pathway. Front. Endocrinol. 2022, 13, 1091147. [Google Scholar] [CrossRef]
- van Gerwen, J.; Shun-Shion, A.S.; Fazakerley, D.J. Insulin signalling and GLUT4 trafficking in insulin resistance. Biochem. Soc. Trans. 2023, 51, 1057–1069. [Google Scholar] [CrossRef]
- Onyango, A.N. Excessive gluconeogenesis causes the hepatic insulin resistance paradox and its sequelae. Heliyon 2022, 8, e12294. [Google Scholar] [CrossRef]
- Hill, M.A.; Yang, Y.; Zhang, L.; Sun, Z.; Jia, G.; Parrish, A.R.; Sowers, J.R. Insulin resistance, cardiovascular stiffening and cardiovascular disease. Metabolism 2021, 119, 154766. [Google Scholar] [CrossRef] [PubMed]
- Li, H.; Meng, Y.; He, S.; Tan, X.; Zhang, Y.; Zhang, X.; Wang, L.; Zheng, W. Macrophages, Chronic Inflammation, and Insulin Resistance. Cells 2022, 11, 3001. [Google Scholar] [CrossRef] [PubMed]
- Tanase, D.M.; Gosav, E.M.; Costea, C.F.; Ciocoiu, M.; Lacatusu, C.M.; Maranduca, M.A.; Ouatu, A.; Floria, M. The Intricate Relationship between Type 2 Diabetes Mellitus (T2DM), Insulin Resistance (IR), and Nonalcoholic Fatty Liver Disease (NAFLD). J. Diabetes Res. 2020, 2020, 3920196. [Google Scholar] [CrossRef] [PubMed]
- Marušić, M.; Paić, M.; Knobloch, M.; Pršo, A.-M.L. NAFLD, Insulin Resistance, and Diabetes Mellitus Type 2. Can. J. Gastroenterol. Hepatol. 2021, 2021, 6613827. [Google Scholar] [CrossRef]
- Kasai, S.; Kokubu, D.; Mizukami, H.; Itoh, K. Mitochondrial Reactive Oxygen Species, Insulin Resistance, and Nrf2-Mediated Oxidative Stress Response—Toward an Actionable Strategy for Anti-Aging. Biomolecules 2023, 13, 1544. [Google Scholar] [CrossRef]
- Segovia-Rodríguez, L.; Echeverry-Alzate, V.; Rincón-Pérez, I.; Calleja-Conde, J.; Bühler, K.M.; Giné, E.; Albert, J.; Hinojosa, J.A.; Huertas, E.; Gómez-Gallego, F.; et al. Gut microbiota and voluntary alcohol consumption. Transl. Psychiatry 2022, 12, 146. [Google Scholar] [CrossRef]
- Akahane, T.; Namisaki, T.; Kaji, K.; Moriya, K.; Kawaratani, H.; Takaya, H.; Sawada, Y.; Shimozato, N.; Fujinaga, Y.; Furukawa, M.; et al. Chronic Alcohol Consumption is Inversely Associated with Insulin Resistance and Fatty Liver in Japanese Males. Nutrients 2020, 12, 1036. [Google Scholar] [CrossRef]
- Manzanero, R.Z.; López-González, A.A.; Tomás-Gil, P.; Paublini, H.; Martínez-Jover, A.; Ramírez-Manent, J.I. Estimation of cardi-ometabolic risk in 25.030 Spanish kitchen workers. Acad. J. Health Sci. 2023, 38, 101–110. [Google Scholar] [CrossRef]
- Sastre-Alzamora, T.; Tomás-Gil, P.; Paublini, H.; Pallarés, L.; Ramírez-Manent, J.I.; López-González, A.A. Relationship between different scales of overweight and obesity and heart age values in 139634 spanish workers. Acad. J. Health Sci. 2023, 38, 137–144. [Google Scholar] [CrossRef]
- Manzanero, R.Z.; López-González, A.A.; Tomás-Gil, P.; Paublini, H.; Martínez-Jover, A.; Ramírez-Manent, J.I. Cardiometabolic risk assessment in 28300 spanish waiters. Acad. J. Health Sci. 2023, 39, 16–24. [Google Scholar] [CrossRef]
- Sastre-Alzamora, T.; Tomás-Gil, P.; Paublini, H.; Pallarés, L.; Ramírez-Manent, J.I.; López-González, A.A. Relationship between heart age and insulin resistance risk scales in 139634 Spanish workers. Acad. J. Health Sci. 2024, 39, 16–22. [Google Scholar] [CrossRef]
- Aguiló Juanola, M.C.; López-González, A.A.; Tomás-Gil, P.; Paublini, H.; Tárraga-López, P.J.; Ramírez-Manent, J.I. Influence of tobacco consumption on the values of different insulin resistance risk scales and non-alcoholic fatty liver disease and hepatic fibrosis scales in 418,343 spanish people. Acad. J. Health Sci. 2024, 39, 9–15. [Google Scholar] [CrossRef]
- Mestre Font, M.; Busquets-Cortés, C.; Ramírez-Manent, J.I.; Vallejos, D.; Sastre Alzamora, T.; López-González, A.A. Influence of so-ciodemographic variables and healthy habits on the values of cardiometabolic risk scales in 386924 spanish workers. Acad. J. Health Sci. 2024, 39, 112–121. [Google Scholar] [CrossRef]
- Montero-Sandiego, E.; Ruiz-Robledillo, N.; Ferrer-Cascales, R.; Clement-Carbonell, V.; Alcocer-Bruno, C.; Albaladejo-Blázquez, N. Spanish validation of the simple lifestyle indicator questionnaire: Validity and reliability analysis. Front. Public Health 2024, 11, 1146010. [Google Scholar] [CrossRef]
- Obrador de Hevia, J.; López-González, Á.A.; Ramírez-Manent, J.I.; Paublini Oliveira, H.; Tárraga López, P.J.; Riutord-Sbert, P. Rela-tionship between alcohol consumption and other variables with the values of different cardiovascular risk factors in 139634 Spanish workers. Acad. J. Health Sci. 2024, 39, 132–141. [Google Scholar] [CrossRef]
- Domingo-Salvany, A.; Bacigalupe, A.; Carrasco, J.M.; Espelt, A.; Ferrando, J.; Borrell, C.; del Grupo de Determinantes Sociales de la Sociedad Española de Epidemiología. Propuestas de clase social neoweberiana y neomarxista a partir de la Clasificación Nacional de Ocupaciones 2011. Gac Sanit. 2013, 27, 263–272. [Google Scholar] [CrossRef]
- Tao, L.-C.; Xu, J.-N.; Wang, T.-T.; Hua, F.; Li, J.-J. Triglyceride-glucose index as a marker in cardiovascular diseases: Landscape and limitations. Cardiovasc. Diabetol. 2022, 21, 68. [Google Scholar] [CrossRef]
- Tazeem, M.S.; Chandrasekaran, N.D.; Srivatsa, N. Assessing the Utility of the Metabolic Score for Insulin Resistance (METS-IR) in Evaluating Metabolic Risk Among Individuals Undergoing Master Health Checkups in a Tertiary Care Hospital in South India: A Retrospective Cohort Study. Cureus 2024, 16, e70289. [Google Scholar] [CrossRef]
- Seo, M.-W.; Cho, W.; Kim, J.Y. The single point insulin sensitivity estimator (SPISE) index as a predictor of metabolic syndrome in Korean adults. Obes. Res. Clin. Pr. 2023, 17, 198–202. [Google Scholar] [CrossRef]
- Gado, M.; Tsaousidou, E.; Bornstein, S.R.; Perakakis, N. Sex-based differences in insulin resistance. J. Endocrinol. 2024, 261, e230245. [Google Scholar] [CrossRef]
- Tsitsou, S.; Zacharodimos, N.; Poulia, K.-A.; Karatzi, K.; Dimitriadis, G.; Papakonstantinou, E. Effects of Time-Restricted Feeding and Ramadan Fasting on Body Weight, Body Composition, Glucose Responses, and Insulin Resistance: A Systematic Review of Randomized Controlled Trials. Nutrients 2022, 14, 4778. [Google Scholar] [CrossRef]
- Tosoratto, J.; Carriedo, B.; Cantón, C. Cardiometabolic risk level in 43074 Spanish office workers: Associated variables. Acad. J. Health Sci. 2024, 39, 48–56. [Google Scholar] [CrossRef]
- De Paoli, M.; Zakharia, A.; Werstuck, G.H. The Role of Estrogen in Insulin Resistance: A Review of Clinical and Preclinical Data. Am. J. Pathol. 2021, 191, 1490–1498. [Google Scholar] [CrossRef]
- He, M.; Wang, J.; Liang, Q.; Li, M.; Guo, H.; Wang, Y.; Deji, C.; Sui, J.; Wang, Y.-W.; Liu, Y.; et al. Time-restricted eating with or without low-carbohydrate diet reduces visceral fat and improves metabolic syndrome: A randomized trial. Cell Rep. Med. 2022, 3, 100777. [Google Scholar] [CrossRef] [PubMed]
- Imerb, N.; Thonusin, C.; Chattipakorn, N.; Chattipakorn, S.C. Aging, obese-insulin resistance, and bone remodeling. Mech. Ageing Dev. 2020, 191, 111335. [Google Scholar] [CrossRef]
- Boccardi, V.; Mancinetti, F.; Baroni, M.; Cecchetti, R.; Bastiani, P.; Ruggiero, C.; Mecocci, P. Metabolic Score for Insulin Resistance (METS-IR) and Circulating Cytokines in Older Persons: The Role of Gender and Body Mass Index. Nutrients 2022, 14, 3228. [Google Scholar] [CrossRef]
- Al-Daghri, N.M.; Wani, K.; Khattak, M.N.K.; Alnaami, A.M.; Al-Saleh, Y.; Sabico, S. The single point insulin sensitivity estimator (SPISE) is associated with bone health in Arab adults. Aging Clin. Exp. Res. 2024, 36, 136. [Google Scholar] [CrossRef]
- Newman, A.B.; Visser, M.; Kritchevsky, S.B.; Simonsick, E.; Cawthon, P.M.; Harris, T.B. The Health, Aging, and Body Composition (Health ABC) Study—Ground-Breaking Science for 25 Years and Counting. J. Gerontol. A Biol. Sci. Med. Sci. 2023, 78, 2024–2034. [Google Scholar] [CrossRef]
- Eckstrom, E.; Neukam, S.; Kalin, L.; Wright, J. Physical Activity and Healthy Aging. Clin. Geriatr. Med. 2020, 36, 671–683. [Google Scholar] [CrossRef]
- McMaughan, D.J.; Oloruntoba, O.; Smith, M.L. Socioeconomic Status and Access to Healthcare: Interrelated Drivers for Healthy Aging. Front. Public Health 2020, 8, 231. [Google Scholar] [CrossRef]
- Font, M.M.; Busquets-Cortés, C.; Ramírez-Manent, J.I.; Tomás-Gil, P.; Paublini, H.; López-González, Á.A. Influence of Sociodemographic Variables and Healthy Habits on the Values of Insulin Resistance Indicators in 386,924 Spanish Workers. Nutrients 2023, 15, 5122. [Google Scholar] [CrossRef] [PubMed]
- Bittner, J.M.P.; Gilman, S.E.; Chen, Z.; Perkins, N.J.; Cheon, B.K. Socioeconomic mobility, metabolic health, and diet: Mediation via subjective socioeconomic status. Obesity 2024, 32, 2035–2044. [Google Scholar] [CrossRef] [PubMed]
- Paudel, S.; Ahmadi, M.; Phongsavan, P.; Hamer, M.; Stamatakis, E. Do associations of physical activity and sedentary behaviour with cardiovascular disease and mortality differ across socioeconomic groups? A prospective analysis of device-measured and self-reported UK Biobank data. Br. J. Sports Med. 2023, 57, 921–929. [Google Scholar] [CrossRef] [PubMed]
- Caliri, A.W.; Tommasi, S.; Besaratinia, A. Relationships among smoking, oxidative stress, inflammation, macromolecular damage, and cancer. Mutat. Res. Rev. Mutat. Res. 2021, 787, 108365. [Google Scholar] [CrossRef]
- Lynch, J.; Jin, L.; Richardson, A.; Conklin, D.J. Tobacco Smoke and Endothelial Dysfunction: Role of Aldehydes? Curr. Hypertens. Rep. 2020, 22, 73. [Google Scholar] [CrossRef]
- Rehman, K.; Haider, K.; Akash, M.S.H. Cigarette smoking and nicotine exposure contributes for aberrant insulin signaling and cardiometabolic disorders. Eur. J. Pharmacol. 2021, 909, 174410. [Google Scholar] [CrossRef]
- Kim, H.J.; Cho, Y.J. Smoking cessation and risk of metabolic syndrome: A meta-analysis. Medicine 2024, 103, e38328. [Google Scholar] [CrossRef]
- Suarez, E.C.; Beckham, J.C.; Green, K.T. The Relation of Light-to-Moderate Alcohol Consumption to Glucose Metabolism and Insulin Resistance in Nondiabetic Adults: The Moderating Effects of Depressive Symptom Severity, Adiposity, and Sex. Int. J. Behav. Med. 2017, 24, 927–936. [Google Scholar] [CrossRef]
- Boyle, M.; Masson, S.; Anstee, Q.M. The bidirectional impacts of alcohol consumption and the metabolic syndrome: Cofactors for progressive fatty liver disease. J. Hepatol. 2018, 68, 251–267. [Google Scholar] [CrossRef]
- Ahmed, B.; Sultana, R.; Greene, M.W. Adipose tissue and insulin resistance in obese. Biomed. Pharmacother. 2021, 137, 111315. [Google Scholar] [CrossRef]
- Diotaiuti, P.; Mancone, S.; Corrado, S.; De Risio, A.; Cavicchiolo, E.; Girelli, L.; Chirico, A. Internet addiction in young adults: The role of impulsivity and codependency. Front. Psychiatry 2022, 13, 893861. [Google Scholar] [CrossRef] [PubMed]
- Mirabelli, M.; Chiefari, E.; Arcidiacono, B.; Corigliano, D.M.; Brunetti, F.S.; Maggisano, V.; Russo, D.; Foti, D.P.; Brunetti, A. Mediterranean Diet Nutrients to Turn the Tide against Insulin Resistance and Related Diseases. Nutrients 2020, 12, 1066. [Google Scholar] [CrossRef] [PubMed]
- García-Hermoso, A.; López-Gil, J.F.; Izquierdo, M.; Ramírez-Vélez, R.; Ezzatvar, Y. Exercise and Insulin Resistance Markers in Children and Adolescents With Excess Weight: A Systematic Review and Network Meta-Analysis. JAMA Pediatr. 2023, 177, 1276–1284, Erratum in JAMA Pediatr. 2023, 177, 1362. [Google Scholar] [CrossRef] [PubMed]

| Men’s Mean (SD) n = 83,282 | Women’s Mean (SD) n = 56,352 | Cohen’s d | |
|---|---|---|---|
| Age (years) | 41.4 (10.7) | 40.1 (10.4) | 0.123 |
| Height (cm) | 173.8 (7.1) | 161.2 (6.5) | 1.836 |
| Weight (kg) | 83.2 (14.6) | 66.3 (13.9) | 1.18 |
| Systolic blood pressure (mmHg) | 126.2 (15.9) | 115.6 (15.7) | 0.67 |
| Diastolic blood pressure (mmHg) | 76.6 (10.9) | 71.1 (10.7) | 0.508 |
| Total cholesterol (mg/dL) | 199.6 (38.6) | 194.6 (36.9) | 0.132 |
| HDL cholesterol (mg/dL) | 50.0 (7.7) | 54.7 (9.2) | −0.564 |
| LDL cholesterol (mg/dL) | 122.6 (37.4) | 121.5 (37.1) | 0.03 |
| Triglycerides (mg/dL) | 133.8 (95.6) | 90.8 (49.7) | 0.536 |
| Glucose (mg/dL) | 93.0 (25.4) | 86.8 (18.1) | 0.273 |
| Cramers_V | |||
| <30 years vs. ≥30 years | 0.038512766469072986 | ||
| Social class I vs. other social class | 0.10030239261755346 | ||
| Elementary school vs. higher education | 0.18254337547869515 | ||
| Non-smokers vs. smokers | 0.011487974483581643 | ||
| No physical activity vs. physical activity | 0.10931382468740578 | ||
| Non-Meditrerranean diet vs. Mediterranean diet | 0.13048756330861092 | ||
| No alcohol consumption vs. alcohol consumption | 0.19172611388544775 |
| n | Scale | Men | n | Scale | Women | Cohen’s d | |
|---|---|---|---|---|---|---|---|
| Mean (SD) | Mean (SD) | ||||||
| <30 years | 12,558 | TyG | 8.2 (0.5) | 10,110 | TyG | 8.0 (0.4) | 0.437 |
| <30 years | 12,558 | TyG-BMI | 207.4 (42.4) | 10,110 | TyG-BMI | 189.4 (42.0) | 0.426 |
| <30 years | 12,558 | METS-IR | 37.4 (7.8) | 10,110 | METS-IR | 33.8 (7.6) | 0.467 |
| <30 years | 12,558 | SPISE-IR | 1.5 (0.4) | 10,110 | SPISE-IR | 1.3 (0.4) | 0.500 |
| 30–39 years | 24,648 | TyG | 8.4 (0.6) | 17,460 | TyG | 8.1 (0.5) | 0.535 |
| 30–39 years | 24,648 | TyG-BMI | 227.6 (45.6) | 17,460 | TyG-BMI | 199.0 (47.1) | 0.619 |
| 30–39 years | 24,648 | METS-IR | 41.2 (8.5) | 17,460 | METS-IR | 35.8 (8.6) | 0.632 |
| 30–39 years | 24,648 | SPISE-IR | 1.7 (0.5) | 17,460 | SPISE-IR | 1.4 (0.5) | 0.600 |
| 40–49 years | 25,178 | TyG | 8.6 (0.6) | 17,094 | TyG | 8.2 (0.5) | 0.712 |
| 40–49 years | 25,178 | TyG-BMI | 243.5 (46.9) | 17,094 | TyG-BMI | 214.6 (49.8) | 0.601 |
| 40–49 years | 25,178 | METS-IR | 44.3 (8.8) | 17,094 | METS-IR | 38.7 (9.1) | 0.628 |
| 40–49 years | 25,178 | SPISE-IR | 1.9 (0.5) | 17,094 | SPISE-IR | 1.6 (0.5) | 0.600 |
| 50–59 years | 17,370 | TyG | 8.8 (0.6) | 9984 | TyG | 8.4 (0.5) | 0.707 |
| 50–59 years | 17,370 | TyG-BMI | 253.9 (45.7) | 9984 | TyG-BMI | 232.6 (51.3) | 0.445 |
| 50–59 years | 17,370 | METS-IR | 46.6 (8.7) | 9984 | METS-IR | 41.9 (9.3) | 0.527 |
| 50–59 years | 17,370 | SPISE-IR | 2.0 (0.5) | 9984 | SPISE-IR | 1.7 (0.5) | 0.600 |
| 60–69 years | 3528 | TyG | 8.9 (0.5) | 1704 | TyG | 8.5 (0.5) | 0.800 |
| 60–69 years | 3528 | TyG-BMI | 260.2 (41.5) | 1704 | TyG-BMI | 241.8 (47.6) | 0.422 |
| 60–69 years | 3528 | METS-IR | 48.0 (8.0) | 1704 | METS-IR | 43.5 (8.6) | 0.549 |
| 60–69 years | 3528 | SPISE-IR | 2.1 (0.5) | 1704 | SPISE-IR | 1.8 (0.5) | 0.600 |
| Social class I | 6234 | TyG | 8.4 (0.6) | 7632 | TyG | 8.0 (0.4) | 0.893 |
| Social class I | 6234 | TyG-BMI | 229.3 (43.3) | 7632 | TyG-BMI | 191.3 (41.4) | 0.901 |
| Social class I | 6234 | METS-IR | 41.9 (8.3) | 7632 | METS-IR | 34.0 (7.7) | 1.027 |
| Social class I | 6234 | SPISE-IR | 1.7 (0.5) | 7632 | SPISE-IR | 1.3 (0.4) | 1.000 |
| Social class II | 19,856 | TyG | 8.5 (0.6) | 18,112 | TyG | 8.1 (0.5) | 0.721 |
| Social class II | 19,856 | TyG-BMI | 236.8 (45.6) | 18,112 | TyG-BMI | 202.0 (46.1) | 0.751 |
| Social class II | 19,856 | METS-IR | 43.0 (8.7) | 18,112 | METS-IR | 36.3 (8.4) | 0.784 |
| Social class II | 19,856 | SPISE-IR | 1.8 (0.5) | 18,112 | SPISE-IR | 1.4 (0.5) | 0.800 |
| Social class III | 57,192 | TyG | 8.5 (0.7) | 30,608 | TyG | 8.2 (0.5) | 0.529 |
| Social class III | 57,192 | TyG-BMI | 239.5 (49.3) | 30,608 | TyG-BMI | 218.0 (52.8) | 0.449 |
| Social class III | 57,192 | METS-IR | 43.1 (9.3) | 30,608 | METS-IR | 39.3 (9.6) | 0.427 |
| Social class III | 57,192 | SPISE-IR | 1.8 (0.5) | 30,608 | SPISE-IR | 1.6 (0.5) | 0.400 |
| Elementary school | 55,306 | TyG | 8.7 (0.6) | 27,086 | TyG | 8.2 (0.8) | 0.879 |
| Elementary school | 55,306 | TyG-BMI | 234.8 (47.8) | 27,086 | TyG-BMI | 218.0 (52.0) | 0.353 |
| Elementary school | 55,306 | METS-IR | 43.8 (9.3) | 27,086 | METS-IR | 39.3 (9.5) | 0.506 |
| Elementary school | 55,306 | SPISE-IR | 1.9 (0.5) | 27,086 | SPISE-IR | 1.6 (0.5) | 0.600 |
| High school | 22,408 | TyG | 8.6 (0.7) | 22,574 | TyG | 8.1 (0.5) | 1.000 |
| High school | 22,408 | TyG-BMI | 231.8 (49.5) | 22,574 | TyG-BMI | 204.5 (48.6) | 0.611 |
| High school | 22,408 | METS-IR | 42.8 (9.0) | 22,574 | METS-IR | 36.7 (8.8) | 0.734 |
| High school | 22,408 | SPISE-IR | 1.8 (0.5) | 22,574 | SPISE-IR | 1.5 (0.5) | 0.600 |
| University | 5568 | TyG | 8.5 (0.6) | 6692 | TyG | 8.0 (0.4) | 1.116 |
| University | 5568 | TyG-BMI | 230.4 (43.1) | 6692 | TyG-BMI | 190.0 (40.3) | 0.958 |
| University | 5568 | METS-IR | 42.3 (8.3) | 6692 | METS-IR | 33.8 (7.5) | 1.105 |
| University | 5568 | SPISE-IR | 1.7 (0.5) | 6692 | SPISE-IR | 1.3 (0.4) | 1.000 |
| Non-smokers | 55,618 | TyG | 8.5 (0.6) | 38,252 | TyG | 8.1 (0.5) | 0.712 |
| Non-smokers | 55,618 | TyG-BMI | 229.9 (49.1) | 38,252 | TyG-BMI | 203.9 (47.6) | 0.563 |
| Non-smokers | 55,618 | METS-IR | 42.1 (9.5) | 38,252 | METS-IR | 36.7 (8.7) | 0.632 |
| Non-smokers | 55,618 | SPISE-IR | 1.7 (0.6) | 38,252 | SPISE-IR | 1.4 (0.5) | 0.600 |
| Smokers | 27,664 | TyG | 8.6 (0.7) | 18,100 | TyG | 8.2 (0.5) | 0.711 |
| Smokers | 27,664 | TyG-BMI | 239.3 (47.3) | 18,100 | TyG-BMI | 211.8 (51.3) | 0.572 |
| Smokers | 27,664 | METS-IR | 43.5 (8.8) | 18,100 | METS-IR | 38.1 (9.4) | 0.605 |
| Smokers | 27,664 | SPISE-IR | 1.8 (0.5) | 18,100 | SPISE-IR | 1.5 (0.5) | 0.600 |
| No physical activity | 51,984 | TyG | 8.8 (0.6) | 28,962 | TyG | 8.4 (0.5) | 0.706 |
| No physical activity | 51,984 | TyG-BMI | 260.7 (42.7) | 28,962 | TyG-BMI | 240.9 (49.7) | 0.414 |
| No physical activity | 51,984 | METS-IR | 47.6 (8.1) | 28,962 | METS-IR | 43.5 (9.0) | 0.460 |
| No physical activity | 51,984 | SPISE-IR | 2.1 (0.5) | 28,962 | SPISE-IR | 1.8 (0.5) | 0.600 |
| Physical activity | 31,298 | TyG | 8.1 (0.4) | 27,390 | TyG | 7.9 (0.4) | 0.400 |
| Physical activity | 31,298 | TyG-BMI | 195.6 (21.8) | 27,390 | TyG-BMI | 175.8 (20.4) | 0.445 |
| Physical activity | 31,298 | METS-IR | 35.3 (3.9) | 27,390 | METS-IR | 31.4 (3.7) | 0.471 |
| Physical activity | 31,298 | SPISE-IR | 1.4 (0.2) | 27,390 | SPISE-IR | 1.2 (0.2) | 0.400 |
| Non-Mediterranean diet | 54,792 | TyG | 8.8 (0.6) | 29,764 | TyG | 8.4 (0.5) | 0.856 |
| Non-Mediterranean diet | 54,792 | TyG-BMI | 257.4 (44.2) | 29,764 | TyG-BMI | 237.7 (51.6) | 0.466 |
| Non-Mediterranean diet | 54,792 | METS-IR | 46.9 (8.4) | 29,764 | METS-IR | 42.8 (9.4) | 0.530 |
| Non-Mediterranean diet | 54,792 | SPISE-IR | 2.0 (0.5) | 29,764 | SPISE-IR | 1.8 (0.5) | 0.500 |
| Mediterranean diet | 28,490 | TyG | 8.1 (0.4) | 26,588 | TyG | 7.9 (0.4) | 0.361 |
| Mediterranean diet | 28,490 | TyG-BMI | 195.4 (22.0) | 26,588 | TyG-BMI | 177.4 (21.6) | 0.389 |
| Mediterranean diet | 28,490 | METS-IR | 35.4 (4.0) | 26,588 | METS-IR | 31.8 (4.0) | 0.421 |
| Mediterranean diet | 28,490 | SPISE-IR | 1.4 (0.2) | 26,588 | SPISE-IR | 1.2 (0.2) | 0.400 |
| No alcohol consumption | 56,022 | TyG | 8.4 (0.5) | 47,536 | TyG | 8.1 (0.4) | 0.539 |
| No alcohol consumption | 56,022 | TyG-BMI | 217.4 (37.6) | 47,536 | TyG-BMI | 197.6 (40.2) | 0.410 |
| No alcohol consumption | 56,022 | METS-IR | 39.5 (7.1) | 47,536 | METS-IR | 35.5 (7.4) | 0.447 |
| No alcohol consumption | 56,022 | SPISE-IR | 1.6 (0.4) | 47,536 | SPISE-IR | 1.4 (0.4) | 0.400 |
| Alcohol consumption | 27,260 | TyG | 8.9 (0.7) | 8816 | TyG | 8.6 (0.6) | 0.520 |
| Alcohol consumption | 27,260 | TyG-BMI | 274.8 (44.0) | 8816 | TyG-BMI | 272.2 (52.5) | 0.055 |
| Alcohol consumption | 27,260 | METS-IR | 50.2 (8.4) | 8816 | METS-IR | 48.9 (9.7) | 0.147 |
| Alcohol consumption | 27,260 | SPISE-IR | 2.2 (0.5) | 8816 | SPISE-IR | 2.1 (0.6) | 0.200 |
| TyG Index High | TyG-BMI High | METS-IR High | SPISE-IR High | ||
|---|---|---|---|---|---|
| Men | n | % | % | % | % |
| <30 years | 12,558 | 11.6 | 12.8 | 7.1 | 28.5 |
| 30–39 years | 24,648 | 22.6 | 22.3 | 13.9 | 47.9 |
| 40–49 years | 25,178 | 36.1 | 35.8 | 22.8 | 64.7 |
| 50–59 years | 17,370 | 45.8 | 45.3 | 31.4 | 74.7 |
| 60–69 years | 3528 | 55.8 | 51.6 | 36.6 | 82.3 |
| Social class I | 6234 | 24.5 | 24.2 | 16.2 | 51.8 |
| Social class II | 19,856 | 31.1 | 30.7 | 19.4 | 57.3 |
| Social class III | 57,192 | 32.1 | 31.8 | 20.9 | 58.8 |
| Elementary school | 55,306 | 36.0 | 34.0 | 22.5 | 59.3 |
| High school | 22,408 | 29.9 | 30.4 | 19.6 | 56.5 |
| University | 5568 | 25.8 | 25.3 | 17.1 | 54.2 |
| Non-smokers | 55,618 | 30.3 | 26.7 | 18.6 | 51.3 |
| Smokers | 27,664 | 33.2 | 33.1 | 21.0 | 60.0 |
| No physical activity | 51,984 | 47.8 | 49.6 | 32.4 | 85.2 |
| Physical activity | 31,298 | 3.8 | 3.9 | 4,1 | 10.5 |
| Non-Mediterranean diet | 54,792 | 45.3 | 47.0 | 30.7 | 81.0 |
| Mediterranean diet | 28,490 | 4.4 | 5.8 | 5.9 | 11.2 |
| No alcohol consumption | 56,022 | 20.1 | 14.5 | 7.8 | 41.0 |
| Alcohol consumption | 27,260 | 54.1 | 64.8 | 45.5 | 90.3 |
| Women | n | % | % | % | % |
| <30 years | 10,110 | 5.8 | 8.0 | 4.5 | 16.2 |
| 30–39 years | 17,460 | 8.1 | 11.9 | 7.5 | 22.1 |
| 40–49 years | 17,094 | 14.3 | 17.7 | 11.3 | 34.1 |
| 50–59 years | 9984 | 25.7 | 27.7 | 17.7 | 50.4 |
| 60–69 years | 1704 | 37.1 | 35.2 | 23.8 | 60.9 |
| Social class I | 7632 | 7.4 | 7.6 | 4.5 | 16.5 |
| Social class II | 18,112 | 11.9 | 12.2 | 7.6 | 24.4 |
| Social class III | 30,608 | 16.1 | 21.2 | 13.6 | 38.3 |
| Elementary school | 27,086 | 15.8 | 21.0 | 13.3 | 38.6 |
| High school | 22,574 | 12.8 | 13.9 | 8.9 | 26.1 |
| University | 6692 | 7.2 | 6.8 | 4.3 | 15.5 |
| Non-smokers | 38,252 | 13.5 | 13.2 | 8.3 | 26.8 |
| Smokers | 18,100 | 13.8 | 18.8 | 11.5 | 32.8 |
| No physical activity | 28,962 | 25.5 | 32.0 | 20.3 | 59.7 |
| Physical activity | 27,390 | 2.8 | 2.5 | 1.9 | 7.8 |
| Non-Mediterranean diet | 29,764 | 24.1 | 31.2 | 19.8 | 57.2 |
| Mediterranean diet | 26,588 | 3.1 | 3.8 | 2.9 | 10.3 |
| No alcohol consumption | 47,536 | 7.9 | 8.8 | 4.8 | 21.7 |
| Alcohol consumption | 8816 | 44.4 | 57.9 | 40.9 | 80.5 |
| TyG Index High n = 33,702 | TyG-BMI High n = 35,088 | METS-IR High n = 22,704 | SPISE-IR High n = 74,686 | |
|---|---|---|---|---|
| OR (95% CI) | OR (95% CI) | OR (95% CI) | OR (95% CI) | |
| Women | 1 | 1 | 1 | 1 |
| Men | 2.41 (2.34–2.49) | 1.48 (1.44–1.53) | 1.33 (1.28–1.38) | 3.63 (3.51–3.75) |
| <30 years | 1 | 1 | 1 | 1 |
| 30–39 years | 1.48 (1.39–1.58) | 1.10 (1.07–1.13) | 1.11 (1.08–1.14) | 1.40 (1.29–1.51) |
| 40–49 years | 1.81 (1.69–1.93) | 1.19 (1.13–1.25) | 1.18 (1.13–1.24) | 1.47 (1.38–1.57) |
| 50–59 years | 2.43 (2.26–2.60) | 1.39 (1.28–1.50) | 1.38 (1.25–1.51) | 1.76 (1.60–1.92) |
| 60–69 years | 3.39 (3.12–3.66) | 1.76 (1.51–2.02) | 1.80 (1.60–2.01) | 2.45 (2.22–2.69) |
| Social class I | 1 | 1 | 1 | 1 |
| Social class II | 1.51 (1.45–1.58) | 1.39 (1.27–1.50) | 1.52 (1.45–1.60) | 1.50 (1.39–1.61) |
| Social class III | 1.97 (1.67–2.27) | 1.58 (1.50–1.65) | 1.67 (1.57–1.78) | 1.88 (1.62–2.14) |
| University | 1 | 1 | 1 | 1 |
| High school | 1.38 (1.27–1.49) | 1.21 (1.15–1.26) | 1.45 (1.33–1.58) | 1.39 (1.30–1.49) |
| Elementary school | 1.95 (1.78–2.13) | 1.65 (1.50–1.81) | 1.76 (1.60–1.93) | 1.79 (1.60–1.98) |
| Non-smokers | 1 | 1 | 1 | 1 |
| Smokers | 1.19 (1.14–1.25) | 1.20 (1.13–1.28) | 1.18 (1.12–1.24) | 1.06 (1.03–1.10) |
| No physical activity | 1 | 1 | 1 | 1 |
| Physical activity | 11.21 (10.30–12.12) | 13.74 (12.70–14.80) | 8.92 (7.93–9.94) | 16.52 (15.57–16.48) |
| Mediterranean diet | 1 | 1 | 1 | 1 |
| Non-Mediterranean diet | 1.64 (1.51–1.78) | 5.46 (4.90–6.03) | 3.22 (2.80–3.65) | 3.04 (2.86–3.23) |
| No alcohol consumption | 1 | 1 | 1 | 1 |
| Alcohol consumption | 2.43 (2.35–2.51) | 5.06 (4.89–5.23) | 5.06 (4.87–5.25) | 4.00 (3.83–4.17) |
| TyG High | TyG-BMI High | METS-IR High | SPISE-IR High | ||||||||||
|---|---|---|---|---|---|---|---|---|---|---|---|---|---|
| PRE | POST | PRE | POST | PRE | POST | PRE | POST | ||||||
| Men | n | % | % | Difference (%) | % | % | Difference (%) | % | % | Difference (%) | % | % | Difference (%) |
| <30 years | 3645 | 10.7 | 11.7 | 9.3 | 11.8 | 13.1 | 11.0 | 6.9 | 7.7 | 11.6 | 27.3 | 29.2 | 7.0 |
| 30–39 years | 6933 | 21.9 | 25 | 14.2 | 22 | 25 | 13.6 | 13.9 | 15.8 | 13.7 | 46.9 | 51.1 | 9.0 |
| 40–49 years | 7013 | 35.4 | 42.1 | 18.9 | 35.3 | 41.5 | 17.6 | 22.4 | 26.4 | 17.9 | 64.8 | 71.8 | 10.8 |
| 50–59 years | 4952 | 46.2 | 56.5 | 22.3 | 46.9 | 57.2 | 22.0 | 32.4 | 40.1 | 23.8 | 75.2 | 85.6 | 13.8 |
| Social class I | 1760 | 23.4 | 25.8 | 10.3 | 24 | 26.6 | 10.8 | 16.3 | 18.2 | 11.7 | 50.3 | 54.3 | 8.0 |
| Social class II | 5368 | 30.9 | 36.6 | 18.4 | 30.9 | 36.4 | 17.8 | 19.5 | 23.1 | 18.5 | 57 | 63.6 | 11.6 |
| Social class III | 15,415 | 31.8 | 38.6 | 21.4 | 31.7 | 38.1 | 20.2 | 26.6 | 32.2 | 21.1 | 58.3 | 67.1 | 15.1 |
| Elementary school | 14,914 | 36.2 | 43.8 | 21.0 | 34.4 | 41.4 | 20.3 | 22.6 | 27.6 | 22.1 | 59.7 | 68.5 | 14.7 |
| High school | 6053 | 29.5 | 35 | 18.6 | 30.1 | 35.5 | 17.9 | 19.6 | 23.2 | 18.4 | 56.1 | 62.5 | 11.4 |
| University | 1576 | 23.8 | 26.2 | 10.1 | 25 | 27.8 | 11.2 | 17 | 19.1 | 12.4 | 52.4 | 56.7 | 8.2 |
| Non-smokers | 15,122 | 30.1 | 35.8 | 18.9 | 26.3 | 31 | 17.9 | 18.6 | 22.2 | 19.4 | 50.6 | 56.1 | 10.9 |
| Smokers | 7421 | 32.6 | 41 | 25.8 | 33.2 | 42.2 | 27.1 | 21.1 | 25.6 | 21.3 | 59.8 | 68.9 | 15.2 |
| Physical activity | 8535 | 3.8 | 4 | 5.3 | 3.9 | 4.2 | 7.7 | 3.9 | 4.2 | 7.7 | 10.1 | 10.7 | 5.9 |
| No physical activity | 14,008 | 47.5 | 59.8 | 25.9 | 49.8 | 60.9 | 22.3 | 32.6 | 40.3 | 23.6 | 85.2 | 94.3 | 10.7 |
| Mediterranean diet | 7767 | 4.2 | 4.5 | 7.1 | 5.9 | 6.4 | 8.5 | 4.8 | 5.2 | 8.3 | 10.7 | 11.4 | 6.5 |
| Non-Mediterranean diet | 14,776 | 45 | 56.2 | 24.9 | 47.2 | 57.2 | 21.2 | 30.9 | 37.8 | 22.3 | 81 | 93.6 | 15.6 |
| No alcohol consumption | 15,107 | 19.6 | 21.6 | 10.2 | 14.3 | 16.6 | 16.1 | 7.9 | 9.2 | 16.5 | 40.1 | 44.2 | 10.2 |
| Alcohol consumption | 7436 | 53.9 | 70 | 29.9 | 64.7 | 80.1 | 23.8 | 45.3 | 62.2 | 37.3 | 90.6 | 97 | 7.1 |
| Women | n | % | % | Difference (%) | % | % | Difference (%) | % | % | Difference (%) | % | % | Difference (%) |
| < 30 years | 2833 | 5.9 | 6.4 | 8.5 | 8.7 | 9.5 | 9.2 | 5 | 5.5 | 10.0 | 17.4 | 18.9 | 8.6 |
| 30–39 years | 4824 | 8.6 | 9.7 | 12.8 | 12.3 | 13.8 | 12.2 | 7.7 | 8.6 | 11.7 | 22.2 | 25 | 12.6 |
| 40–49 years | 4636 | 14.3 | 17.1 | 19.6 | 16.8 | 19.5 | 16.1 | 10.8 | 12.6 | 16.7 | 34.1 | 39.1 | 14.7 |
| 50–59 years | 2768 | 26.2 | 32.3 | 23.3 | 27.5 | 34.9 | 26.9 | 18.1 | 22.3 | 23.2 | 49.5 | 58.4 | 18.0 |
| Social class I | 1973 | 8 | 8.7 | 8.7 | 7.1 | 7.7 | 8.5 | 3.9 | 4.3 | 10.3 | 16.6 | 17.7 | 6.6 |
| Social class II | 4920 | 11.9 | 13.4 | 12.6 | 12.2 | 13.8 | 13.1 | 7.8 | 9.1 | 16.7 | 24.2 | 37.7 | 55.8 |
| Social class III | 8168 | 16.3 | 19.6 | 20.2 | 21.1 | 25.4 | 20.4 | 13.7 | 16.8 | 22.6 | 38.7 | 45.1 | 16.5 |
| Elementary school | 7289 | 16 | 19.2 | 20.0 | 20.9 | 25.2 | 20.6 | 13.4 | 16.5 | 23.1 | 38.8 | 45.4 | 17.0 |
| High school | 6056 | 12.8 | 14.5 | 13.3 | 13.8 | 15.6 | 13.0 | 8.9 | 10.3 | 15.7 | 26.2 | 28.8 | 9.9 |
| University | 1716 | 7.9 | 8.7 | 10.1 | 6.2 | 6.7 | 8.1 | 3.8 | 4.2 | 10.5 | 15.4 | 16.5 | 7.1 |
| Non-smokers | 10,236 | 13.4 | 15.4 | 14.9 | 12.6 | 14.3 | 13.5 | 7.8 | 8.7 | 11.5 | 27.3 | 30.2 | 10.6 |
| Smokers | 4825 | 14 | 16.4 | 17.1 | 18.2 | 21.5 | 18.1 | 11.8 | 13.7 | 16.1 | 32.9 | 38.5 | 17.0 |
| Physical activity | 7317 | 1.2 | 1.3 | 8.3 | 3.2 | 3.3 | 3.1 | 1.9 | 2 | 5.3 | 7.9 | 8.4 | 6.3 |
| No physical activity | 7744 | 25.7 | 31 | 20.6 | 31.8 | 40.9 | 28.6 | 20.4 | 24.5 | 20.1 | 60.1 | 73.8 | 22.8 |
| Mediterranean diet | 7029 | 1.9 | 2 | 5.3 | 4.8 | 5.1 | 6.3 | 2.8 | 3 | 7.1 | 8.8 | 9.5 | 8.0 |
| Non-Mediterranean diet | 8032 | 24.2 | 29.7 | 22.7 | 30.7 | 39.9 | 30.0 | 19.7 | 23.6 | 19.8 | 57.2 | 68.8 | 20.3 |
| No alcohol consumption | 12,750 | 8.2 | 9 | 9.8 | 8.9 | 10 | 12.4 | 4.9 | 5.4 | 10.2 | 22.1 | 25.3 | 14.5 |
| Alcohol consumption | 2311 | 44.8 | 58.1 | 29.7 | 57.8 | 74.7 | 29.2 | 41.1 | 52 | 26.5 | 80.5 | 94.8 | 17.8 |
Disclaimer/Publisher’s Note: The statements, opinions and data contained in all publications are solely those of the individual author(s) and contributor(s) and not of MDPI and/or the editor(s). MDPI and/or the editor(s) disclaim responsibility for any injury to people or property resulting from any ideas, methods, instructions or products referred to in the content. |
© 2025 by the authors. Licensee MDPI, Basel, Switzerland. This article is an open access article distributed under the terms and conditions of the Creative Commons Attribution (CC BY) license (https://creativecommons.org/licenses/by/4.0/).
Share and Cite
Obrador de Hevia, J.; López-González, Á.A.; Ramírez-Manent, J.I.; Paublini, H.; Tárraga López, P.J.; Martorell Sánchez, C.; Riutord-Sbert, P. Association Between Alcohol Consumption, Other Healthy Habits and Sociodemographic Variables and the Values of Different Insulin Resistance Risk Scales in 139,634 Spanish Workers. Healthcare 2025, 13, 921. https://doi.org/10.3390/healthcare13080921
Obrador de Hevia J, López-González ÁA, Ramírez-Manent JI, Paublini H, Tárraga López PJ, Martorell Sánchez C, Riutord-Sbert P. Association Between Alcohol Consumption, Other Healthy Habits and Sociodemographic Variables and the Values of Different Insulin Resistance Risk Scales in 139,634 Spanish Workers. Healthcare. 2025; 13(8):921. https://doi.org/10.3390/healthcare13080921
Chicago/Turabian StyleObrador de Hevia, Joan, Ángel Arturo López-González, José Ignacio Ramírez-Manent, Hernán Paublini, Pedro Juan Tárraga López, Cristina Martorell Sánchez, and Pere Riutord-Sbert. 2025. "Association Between Alcohol Consumption, Other Healthy Habits and Sociodemographic Variables and the Values of Different Insulin Resistance Risk Scales in 139,634 Spanish Workers" Healthcare 13, no. 8: 921. https://doi.org/10.3390/healthcare13080921
APA StyleObrador de Hevia, J., López-González, Á. A., Ramírez-Manent, J. I., Paublini, H., Tárraga López, P. J., Martorell Sánchez, C., & Riutord-Sbert, P. (2025). Association Between Alcohol Consumption, Other Healthy Habits and Sociodemographic Variables and the Values of Different Insulin Resistance Risk Scales in 139,634 Spanish Workers. Healthcare, 13(8), 921. https://doi.org/10.3390/healthcare13080921