
Quantitative Ultrasound Changes in Echotexture and Functional Parameters after a Multicomponent Training Program in Pre-Frailty Individuals: A Pilot Randomized Clinical Trial


 ,
,  ,
,  , and
, and 
Abstract
:1. Introduction
2. Methods
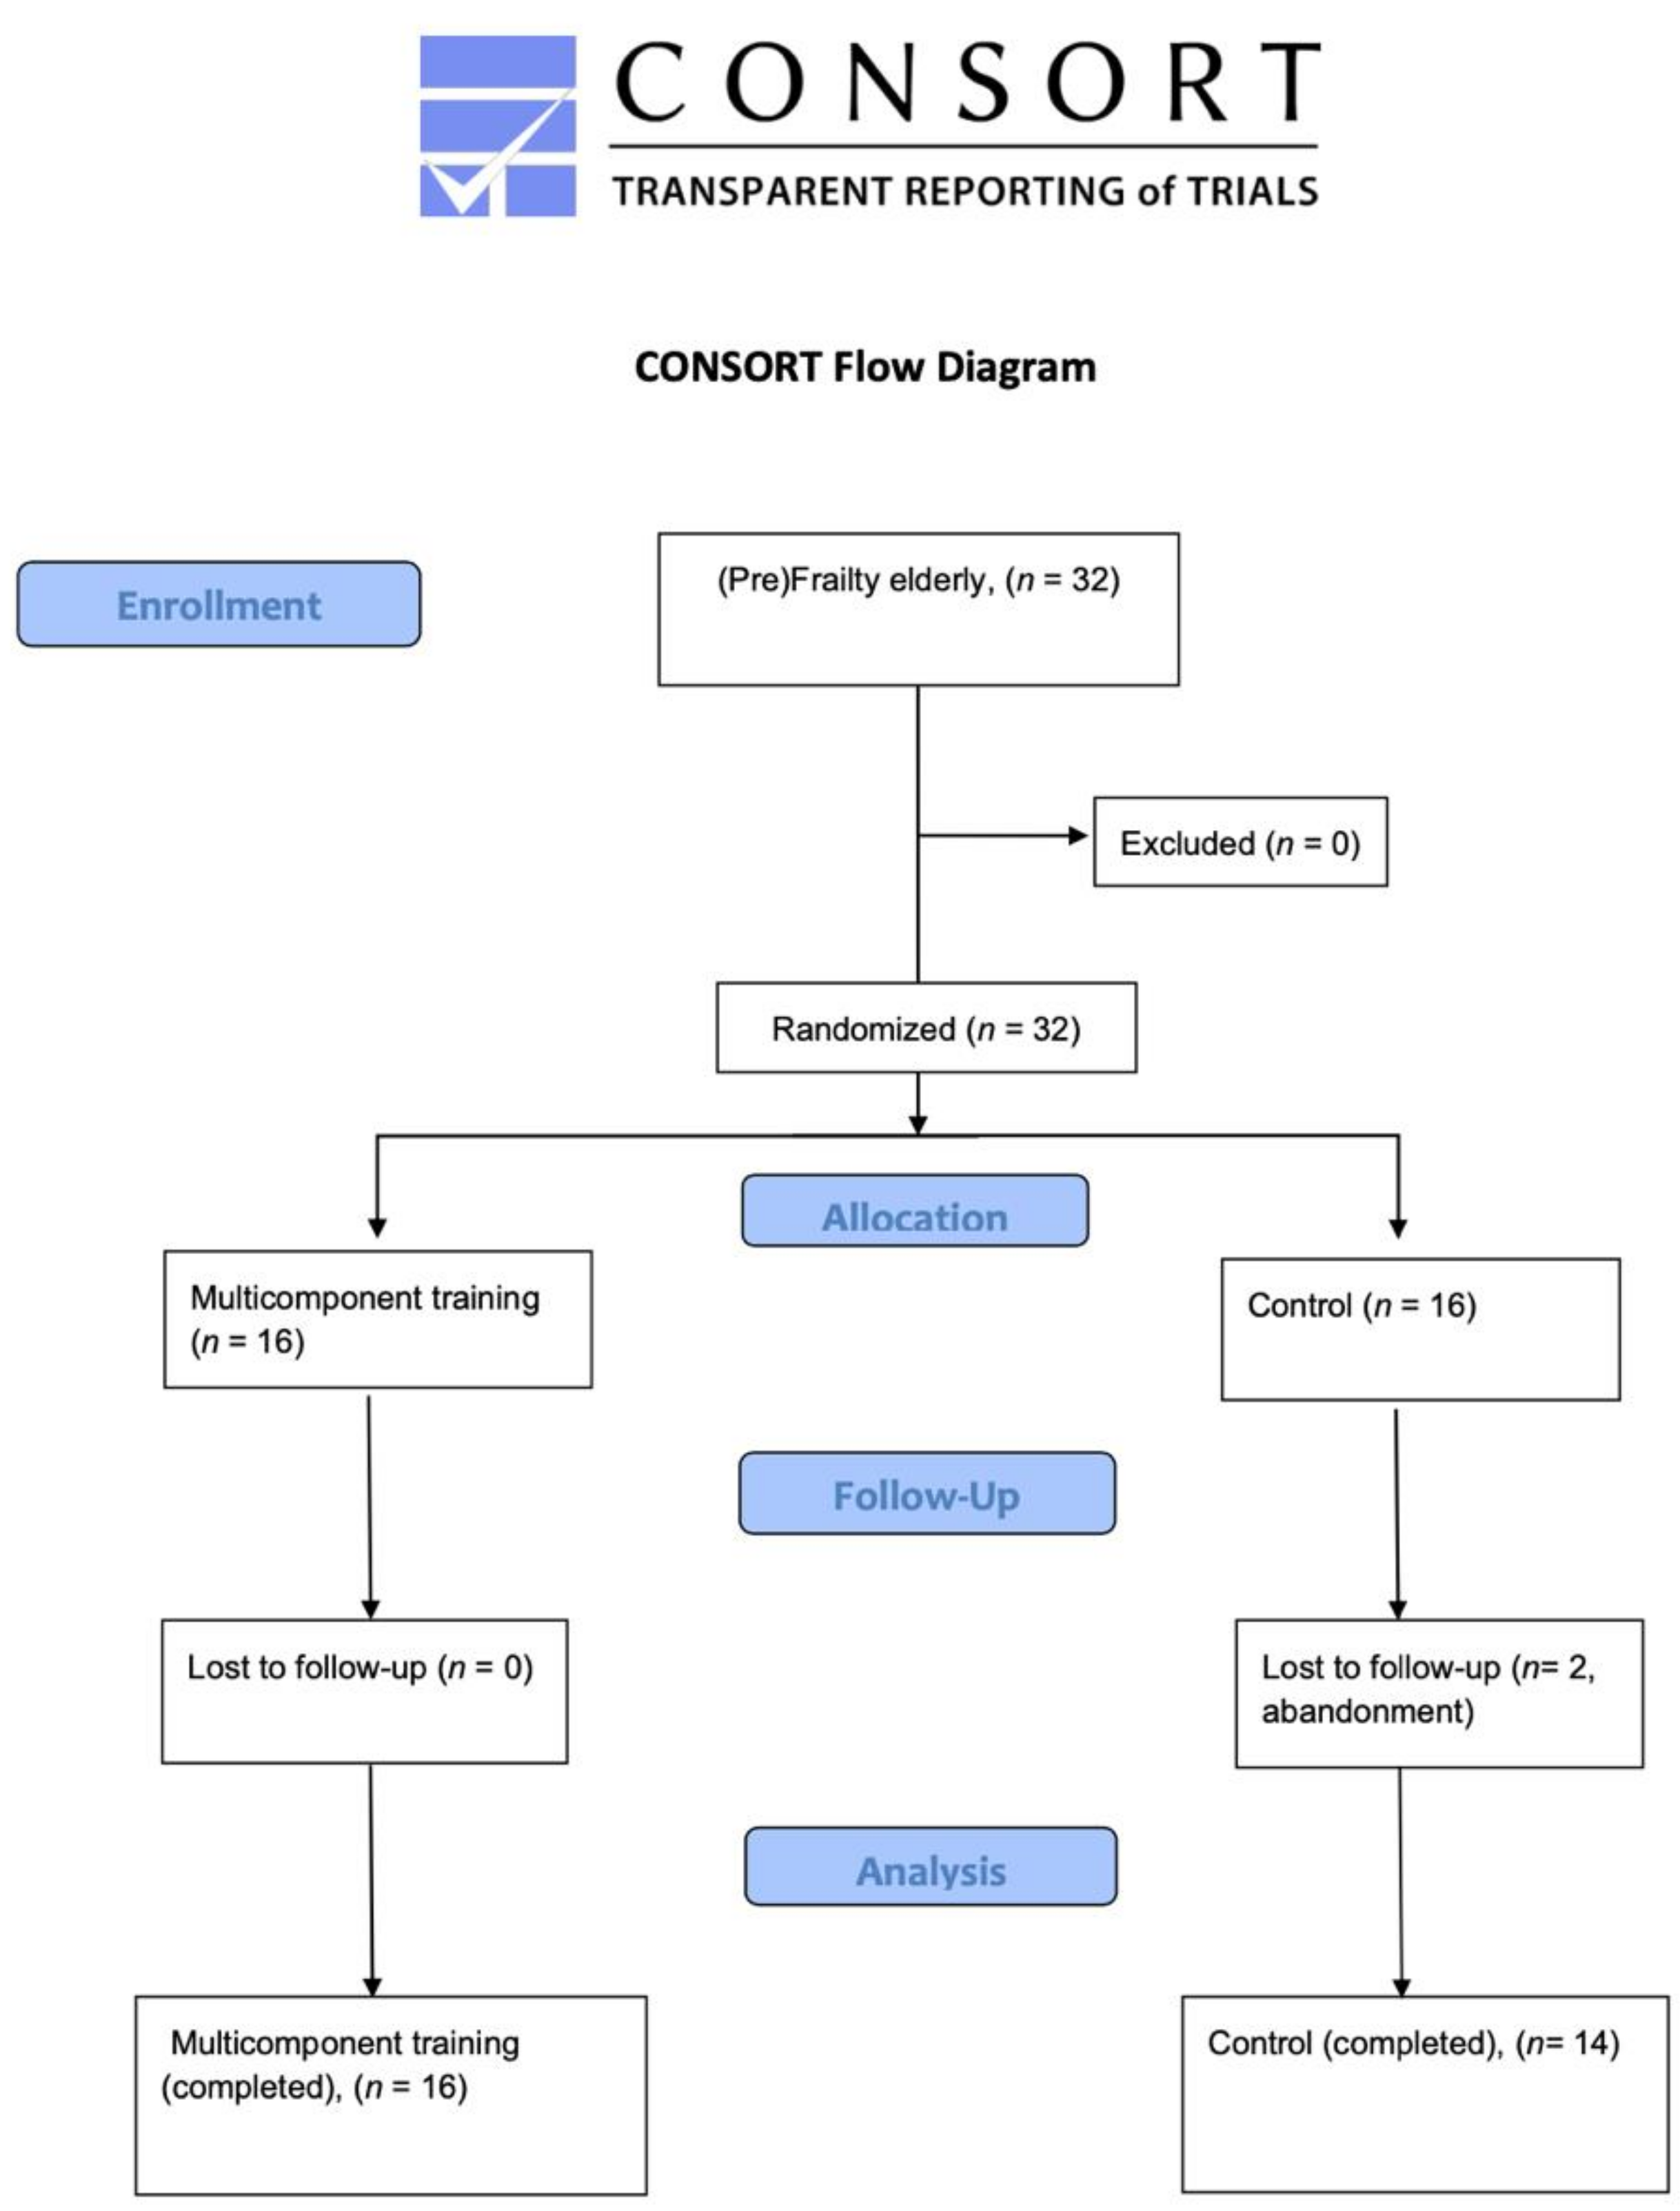
2.1. Study Design
2.2. Ethical Considerations
2.3. Participants
2.4. Sample Size Calculation
2.5. Randomization
2.6. Multicomponent Training Group
2.7. Usual Care (Control) Group
2.8. Outcome Measurements
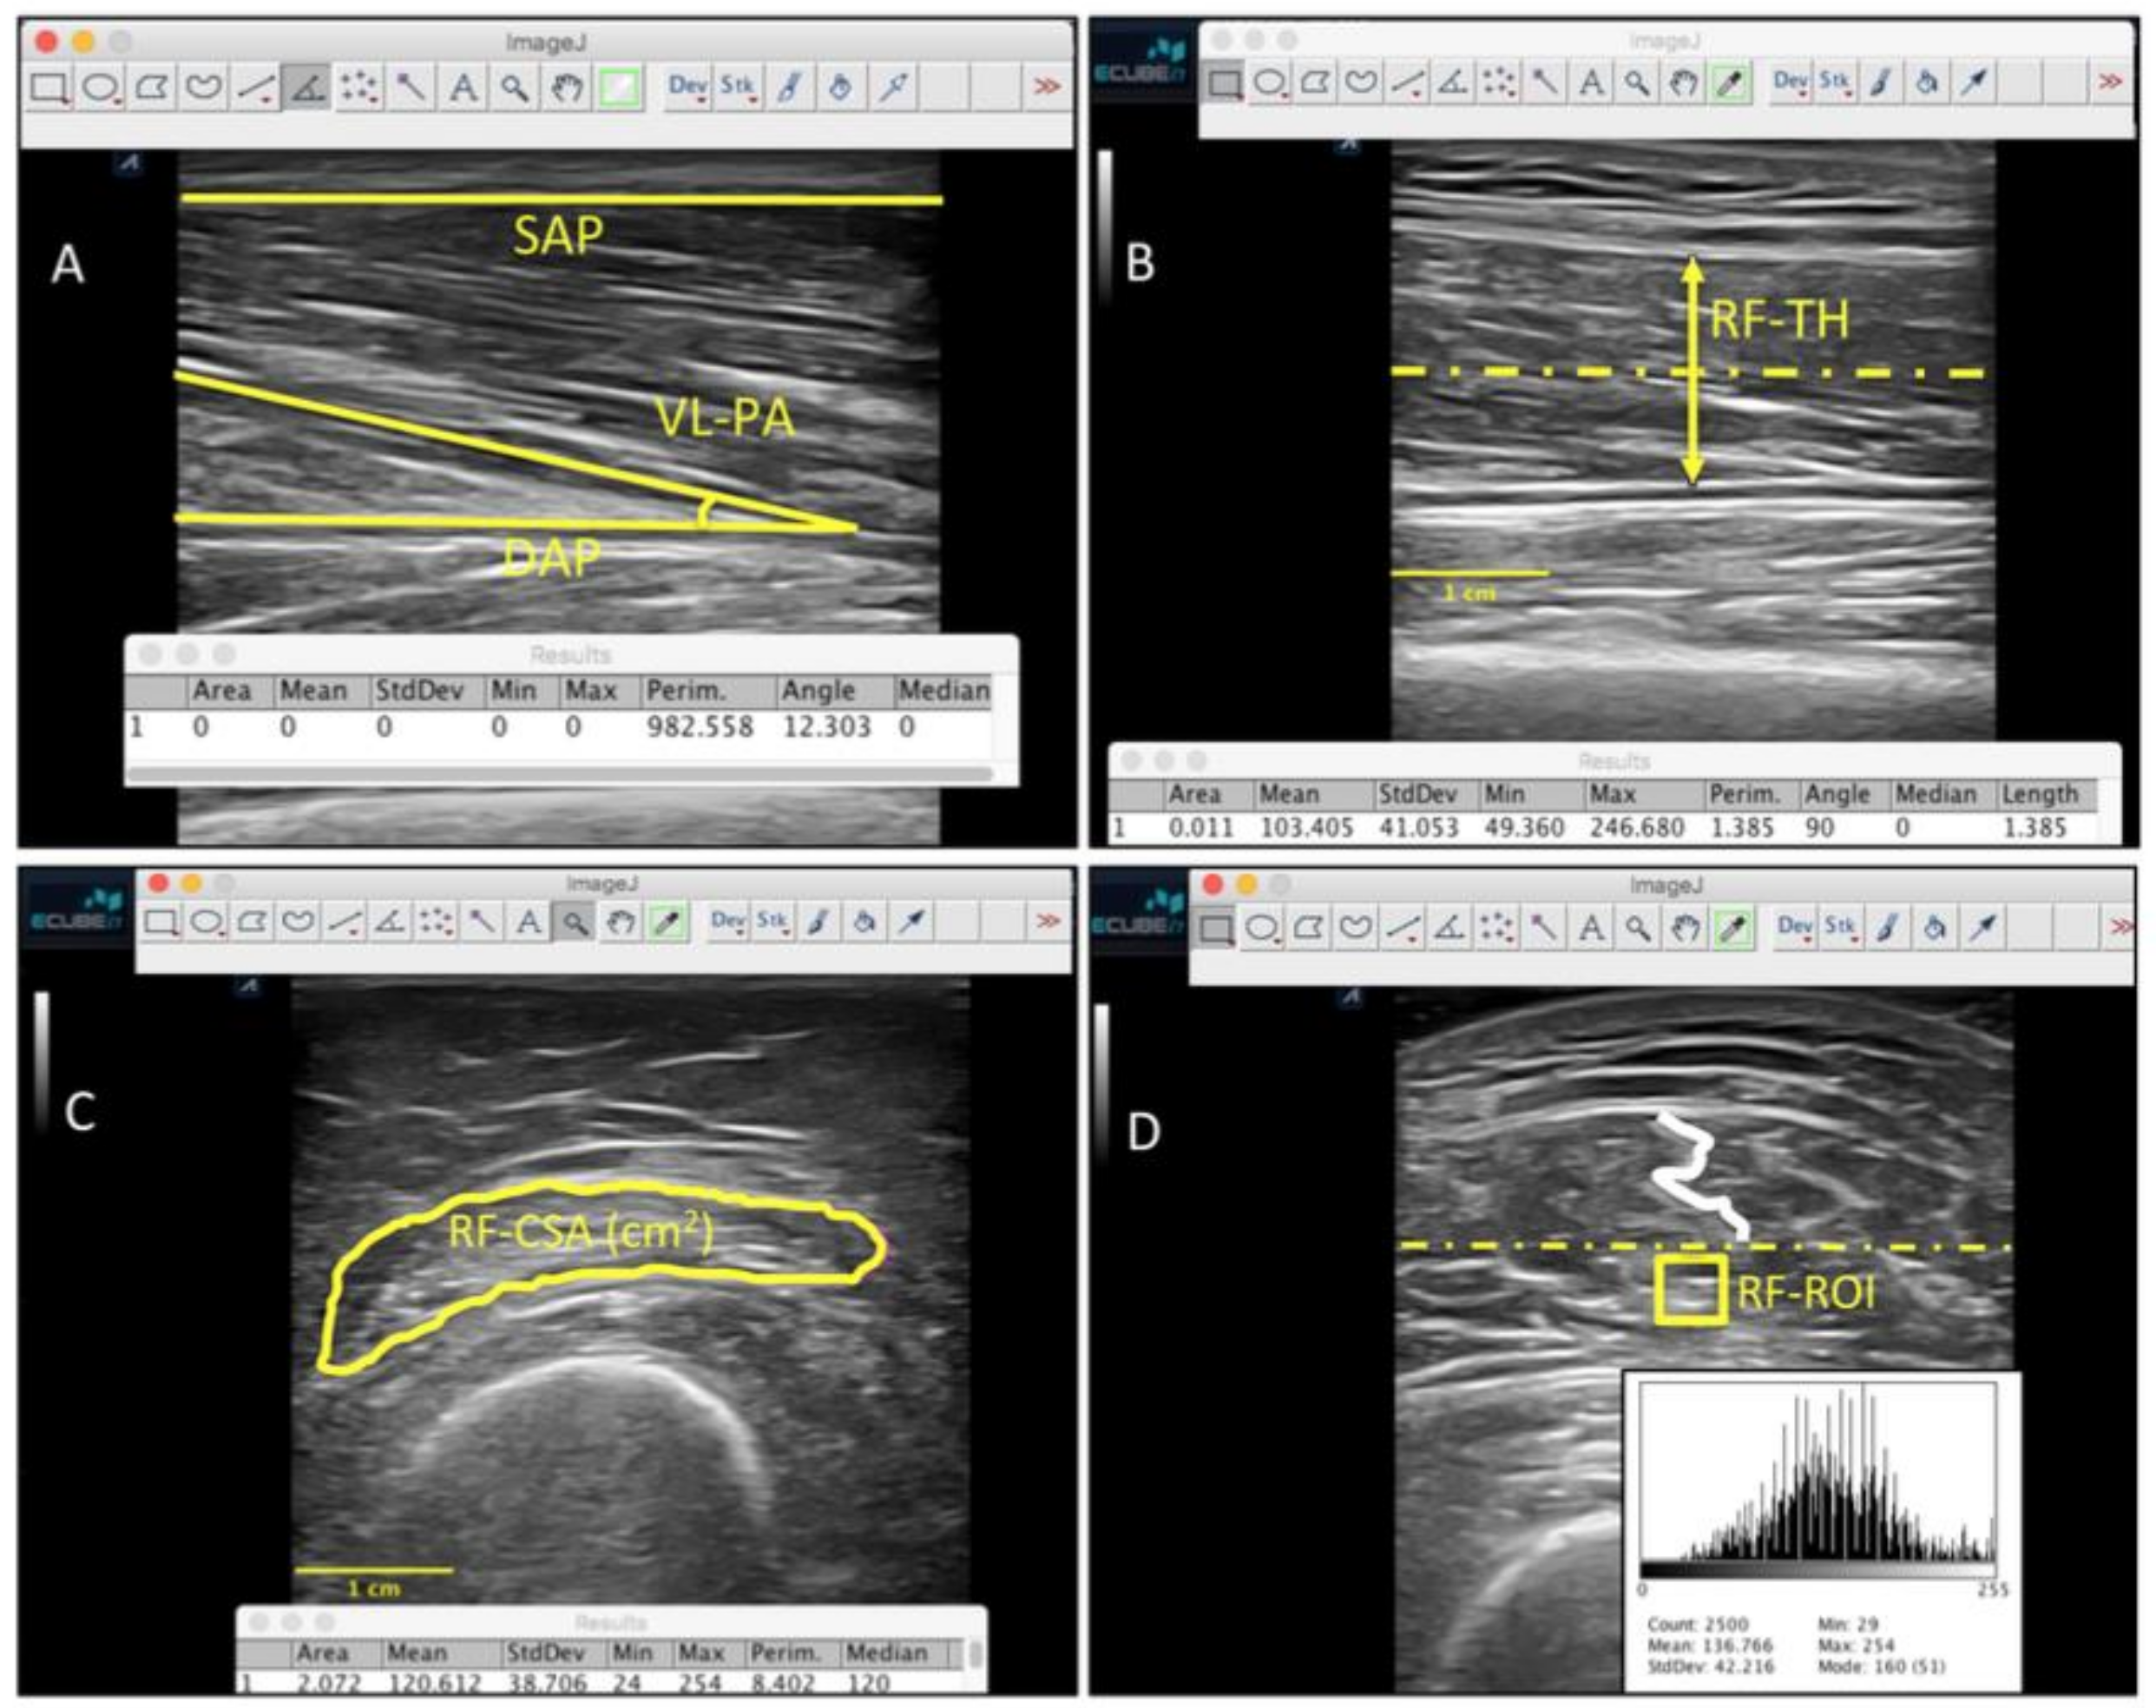
2.9. Ultrasound Imaging Evaluation
2.10. Functional Parameters Assessment
2.11. Statistical Analysis
3. Results
4. Discussion
4.1. Quantitative Ultrasound Imaging for Tissue Echogenicity and Homogeneity
4.2. Future Studies and Clinical Implications
5. Limitations
6. Conclusions
Author Contributions
Funding
Institutional Review Board Statement
Informed Consent Statement
Data Availability Statement
Conflicts of Interest
References
- Losa-Reyna, J.; Baltasar-Fernandez, I.; Alcazar, J.; Navarro-Cruz, R.; Garcia-Garcia, F.J.; Alegre, L.M.; Alfaro-Acha, A. Effect of a short multicomponent exercise intervention focused on muscle power in frail and pre frail elderly: A pilot trial. Exp. Gerontol. 2019, 115, 114–121. [Google Scholar] [CrossRef]
- Fried, L.P.; Tangen, C.M.; Walston, J.; Newman, A.B.; Hirsch, C.; Gottdiener, J.; Seeman, T.; Tracy, R.; Kop, W.J.; Burke, G.; et al. Frailty in older adults: Evidence for a phenotype. J. Gerontol. A Biol. Sci. Med. Sci. 2001, 56, M146–M156. [Google Scholar] [CrossRef]
- Garcia-Garcia, F.J.; Gutierrez Avila, G.; Alfaro-Acha, A.; Amor Andres, M.S.; De Los Angeles De La Torre Lanza, M.; Escribano Aparicio, M.V.; Humanes Aparicio, S.; Larrion Zugasti, J.L.; Gomez-Serranillo Reus, M.; Rodriguez-Artalejo, F.; et al. The prevalence of frailty syndrome in an older population from Spain. The Toledo Study for Healthy Aging. J. Nutr. Health Aging 2011, 15, 852–856. [Google Scholar] [CrossRef]
- Theou, O.; Tan, E.C.K.; Bell, J.S.; Emery, T.; Robson, L.; Morley, J.E.; Rockwood, K.; Visvanathan, R. Frailty Levels in Residential Aged Care Facilities Measured Using the Frailty Index and FRAIL-NH Scale. J. Am. Geriatr. Soc. 2016, 64, e207–e212. [Google Scholar] [CrossRef]
- Cadore, E.L.; Rodriguez-Manas, L.; Sinclair, A.; Izquierdo, M. Effects of different exercise interventions on risk of falls, gait ability, and balance in physically frail older adults: A systematic review. Rejuvenation Res. 2013, 16, 105–114. [Google Scholar] [CrossRef] [Green Version]
- Yamada, M.; Arai, H.; Sonoda, T.; Aoyama, T. Community-based exercise program is cost-effective by preventing care and disability in Japanese frail older adults. J. Am. Med. Dir. Assoc. 2012, 13, 507–511. [Google Scholar] [CrossRef]
- Casas-Herrero, A.; Anton-Rodrigo, I.; Zambom-Ferraresi, F.; Saez de Asteasu, M.L.; Martinez-Velilla, N.; Elexpuru-Estomba, J.; Marin-Epelde, I.; Ramon-Espinoza, F.; Petidier-Torregrosa, R.; Sanchez-Sanchez, J.L.; et al. Effect of a multicomponent exercise programme (VIVIFRAIL) on functional capacity in frail community elders with cognitive decline: Study protocol for a randomized multicentre control trial. Trials 2019, 20, 362. [Google Scholar] [CrossRef]
- Byrne, C.; Faure, C.; Keene, D.J.; Lamb, S.E. Ageing, Muscle Power and Physical Function: A Systematic Review and Implications for Pragmatic Training Interventions. Sports Med. 2016, 46, 1311–1332. [Google Scholar] [CrossRef]
- Cadore, E.L.; Casas-Herrero, A.; Zambom-Ferraresi, F.; Idoate, F.; Millor, N.; Gomez, M.; Rodriguez-Manas, L.; Izquierdo, M. Multicomponent exercises including muscle power training enhance muscle mass, power output, and functional outcomes in institutionalized frail nonagenarians. Age (Dordr) 2014, 36, 773–785. [Google Scholar] [CrossRef] [Green Version]
- Romero-Morales, C.; Martin-Llantino, P.J.; Calvo-Lobo, C.; Palomo-Lopez, P.; Lopez-Lopez, D.; Pareja-Galeano, H.; Rodriguez-Sanz, D. Comparison of the sonographic features of the Achilles Tendon complex in patients with and without achilles tendinopathy: A case-control study. Phys. Ther. Sport 2019, 35, 122–126. [Google Scholar] [CrossRef]
- Romero-Morales, C.; Martin-Llantino, P.; Calvo-Lobo, C.; San-Antolin, M.; Lopez-Lopez, D.; Blanco-Morales, M.; Rodriguez-Sanz, D. Ultrasound Imaging of the Abdominal Wall and Trunk Muscles in Patients with Achilles Tendinopathy versus Healthy Participants. Diagnostics 2019, 10, 17. [Google Scholar] [CrossRef] [Green Version]
- Lin, Y.-F.; Lin, J.-J.; Cheng, C.-K.; Lin, D.-H.; Jan, M.-H. Association between sonographic morphology of vastus medialis obliquus and patellar alignment in patients with patellofemoral pain syndrome. J. Orthop. Sports Phys. Ther. 2008, 38, 196–202. [Google Scholar] [CrossRef] [Green Version]
- Jan, M.-H.; Lin, D.-H.; Lin, J.-J.; Lin, C.-H.J.; Cheng, C.-K.; Lin, Y.-F. Differences in sonographic characteristics of the vastus medialis obliquus between patients with patellofemoral pain syndrome and healthy adults. Am. J. Sports Med. 2009, 37, 1743–1749. [Google Scholar] [CrossRef]
- Ticinesi, A.; Narici, M.V.; Lauretani, F.; Nouvenne, A.; Colizzi, E.; Mantovani, M.; Corsonello, A.; Landi, F.; Meschi, T.; Maggio, M. Assessing sarcopenia with vastus lateralis muscle ultrasound: An operative protocol. Aging Clin. Exp. Res. 2018, 30, 1437–1443. [Google Scholar] [CrossRef]
- Raj, I.S.; Bird, S.R.; Shield, A.J. Reliability of ultrasonographic measurement of the architecture of the vastus lateralis and gastrocnemius medialis muscles in older adults. Clin. Physiol. Funct. Imaging 2012, 32, 65–70. [Google Scholar] [CrossRef] [Green Version]
- Seymour, J.M.; Ward, K.; Sidhu, P.S.; Puthucheary, Z.; Steier, J.; Jolley, C.J.; Rafferty, G.; Polkey, M.I.; Moxham, J. Ultrasound measurement of rectus femoris cross-sectional area and the relationship with quadriceps strength in COPD. Thorax 2009, 64, 418–423. [Google Scholar] [CrossRef] [Green Version]
- Berger, J.; Bunout, D.; Barrera, G.; de la Maza, M.P.; Henriquez, S.; Leiva, L.; Hirsch, S. Rectus femoris (RF) ultrasound for the assessment of muscle mass in older people. Arch. Gerontol. Geriatr. 2015, 61, 33–38. [Google Scholar] [CrossRef]
- Pillen, S.; Tak, R.O.; Zwarts, M.J.; Lammens, M.M.Y.; Verrijp, K.N.; Arts, I.M.P.; van der Laak, J.A.; Hoogerbrugge, P.M.; van Engelen, B.G.M.; Verrips, A. Skeletal muscle ultrasound: Correlation between fibrous tissue and echo intensity. Ultrasound Med. Biol. 2009, 35, 443–446. [Google Scholar] [CrossRef]
- Zaidman, C.M.; Holland, M.R.; Anderson, C.C.; Pestronk, A. Calibrated quantitative ultrasound imaging of skeletal muscle using backscatter analysis. Muscle Nerve 2008, 38, 893–898. [Google Scholar] [CrossRef]
- Arts, I.M.P.; van Rooij, F.G.; Overeem, S.; Pillen, S.; Janssen, H.M.H.A.; Schelhaas, H.J.; Zwarts, M.J. Quantitative muscle ultrasonography in amyotrophic lateral sclerosis. Ultrasound Med. Biol. 2008, 34, 354–361. [Google Scholar] [CrossRef]
- Simon, N.G.; Turner, M.R.; Vucic, S.; Al-Chalabi, A.; Shefner, J.; Lomen-Hoerth, C.; Kiernan, M.C. Quantifying disease progression in amyotrophic lateral sclerosis. Ann. Neurol. 2014, 76, 643–657. [Google Scholar] [CrossRef]
- Ríos-Díaz, J.; Martínez-Payá, J.J.; del Baño-Aledo, M.E.; de Groot-Ferrando, A.; Botía-Castillo, P.; Fernández-Rodríguez, D. Sonoelastography of Plantar Fascia: Reproducibility and Pattern Description in Healthy Subjects and Symptomatic Subjects. Ultrasound Med. Biol. 2015, 41, 2605–2613. [Google Scholar] [CrossRef]
- Martinez-Paya, J.J.; Del Bano-Aledo, M.E.; Rios-Diaz, J.; Tembl-Ferrairo, J.I.; Vazquez-Costa, J.F.; Medina-Mirapeix, F. Muscular Echovariation: A New Biomarker in Amyotrophic Lateral Sclerosis. Ultrasound Med. Biol. 2017, 43, 1153–1162. [Google Scholar] [CrossRef]
- Martínez-Payá, J.J.; Ríos-Díaz, J.; Medina-Mirapeix, F.; Vázquez-Costa, J.F.; del Baño-Aledo, M.E. Monitoring Progression of Amyotrophic Lateral Sclerosis Using Ultrasound Morpho-Textural Muscle Biomarkers: A Pilot Study. Ultrasound Med. Biol. 2018, 44, 102–109. [Google Scholar] [CrossRef]
- Wong, V.; Spitz, R.W.; Bell, Z.W.; Viana, R.B.; Chatakondi, R.N.; Abe, T.; Loenneke, J.P. Exercise induced changes in echo intensity within the muscle: A brief review. J. Ultrasound 2020, 23, 457–472. [Google Scholar] [CrossRef]
- Almazán-Polo, J.; López-López, D.; Romero-Morales, C.; Rodríguez-Sanz, D.; Becerro-de-Bengoa-Vallejo, R.; Losa-Iglesias, M.E.; Bravo-Aguilar, M.; Calvo-Lobo, C. Quantitative Ultrasound Imaging Differences in Multifidus and Thoracolumbar Fasciae between Athletes with and without Chronic Lumbopelvic Pain: A Case-Control Study. J. Clin. Med. 2020, 9, 2647. [Google Scholar] [CrossRef]
- Holt, G.R. Declaration of Helsinki-the world’s document of conscience and responsibility. South. Med. J. 2014, 107, 407. [Google Scholar] [CrossRef]
- Guralnik, J.M.; Simonsick, E.M.; Ferrucci, L.; Glynn, R.J.; Berkman, L.F.; Blazer, D.G.; Scherr, P.A.; Wallace, R.B. A short physical performance battery assessing lower extremity function: Association with self-reported disability and prediction of mortality and nursing home admission. J. Gerontol. 1994, 49, M85–M94. [Google Scholar] [CrossRef]
- Wiggins, R.H., 3rd; Davidson, H.C.; Harnsberger, H.R.; Lauman, J.R.; Goede, P.A. Image file formats: Past, present, and future. Radiographics 2001, 21, 789–798. [Google Scholar] [CrossRef]
- Kwah, L.K.; Pinto, R.Z.; Diong, J.; Herbert, R.D. Reliability and validity of ultrasound measurements of muscle fascicle length and pennation in humans: A systematic review. J. Appl. Physiol. 2013, 114, 761–769. [Google Scholar] [CrossRef] [Green Version]
- Arts, I.M.P.; Pillen, S.; Schelhaas, H.J.; Overeem, S.; Zwarts, M.J. Normal values for quantitative muscle ultrasonography in adults. Muscle Nerve 2010, 41, 32–41. [Google Scholar] [CrossRef]
- Gao, J.; He, W.; Du, L.-J.; Chen, J.; Park, D.; Wells, M.; Fowlkes, B.; O’Dell, M. Quantitative Ultrasound Imaging to Assess the Biceps Brachii Muscle in Chronic Post-Stroke Spasticity: Preliminary Observation. Ultrasound Med. Biol. 2018, 44, 1931–1940. [Google Scholar] [CrossRef] [Green Version]
- Calvo-Lobo, C.; Useros-Olmo, A.I.; Almazan-Polo, J.; Martin-Sevilla, M.; Romero-Morales, C.; Sanz-Corbalan, I.; Rodriguez-Sanz, D.; Lopez-Lopez, D. Quantitative Ultrasound Imaging Pixel Analysis of the Intrinsic Plantar Muscle Tissue between Hemiparesis and Contralateral Feet in Post-Stroke Patients. Int. J. Environ. Res. Public Health 2018, 15, 2519. [Google Scholar] [CrossRef] [Green Version]
- Molinari, F.; Caresio, C.; Acharya, U.R.; Mookiah, M.R.K.; Minetto, M.A. Advances in quantitative muscle ultrasonography using texture analysis of ultrasound images. Ultrasound Med. Biol. 2015, 41, 2520–2532. [Google Scholar] [CrossRef]
- Alcazar, J.; Rodriguez-Lopez, C.; Ara, I.; Alfaro-Acha, A.; Manas-Bote, A.; Guadalupe-Grau, A.; Garcia-Garcia, F.J.; Alegre, L.M. The Force-Velocity Relationship in Older People: Reliability and Validity of a Systematic Procedure. Int. J. Sports Med. 2017, 38, 1097–1104. [Google Scholar] [CrossRef] [PubMed]
- Narici, M.; Franchi, M.; Maganaris, C. Muscle structural assembly and functional consequences. J. Exp. Biol. 2016, 219, 276–284. [Google Scholar] [CrossRef] [PubMed] [Green Version]
- Strasser, E.M.; Draskovits, T.; Praschak, M.; Quittan, M.; Graf, A. Association between ultrasound measurements of muscle thickness, pennation angle, echogenicity and skeletal muscle strength in the elderly. Age (Omaha) 2013, 35, 2377–2388. [Google Scholar] [CrossRef] [PubMed] [Green Version]
- Abe, T.; Ogawa, M.; Loenneke, J.P.; Thiebaud, R.S.; Loftin, M.; Mitsukawa, N. Relationship between site-specific loss of thigh muscle and gait performance in women: The HIREGASAKI study. Arch. Gerontol. Geriatr. 2012, 55, e21–e25. [Google Scholar] [CrossRef]
- Abe, T.; Sakamaki, M.; Yasuda, T.; Bemben, M.G.; Kondo, M.; Kawakami, Y.; Fukunaga, T. Age-related, site-specific muscle loss in 1507 Japanese men and women aged 20 to 95 years. J. Sports Sci. Med. 2011, 10, 145–150. [Google Scholar] [PubMed]
- Arts, I.M.P.; Overeem, S.; Pillen, S.; Kleine, B.U.; Boekestein, W.A.; Zwarts, M.J.; Jurgen Schelhaas, H. Muscle ultrasonography: A diagnostic tool for amyotrophic lateral sclerosis. Clin. Neurophysiol. 2012, 123, 1662–1667. [Google Scholar] [CrossRef] [PubMed]
- Greening, N.J.; Harvey-Dunstan, T.C.; Chaplin, E.J.; Vincent, E.E.; Morgan, M.D.; Singh, S.J.; Steiner, M.C. Bedside assessment of quadriceps muscle by ultrasound after admission for acute exacerbations of chronic respiratory disease. Am. J. Respir. Crit. Care Med. 2015, 192, 810–816. [Google Scholar] [CrossRef] [PubMed]
- Goodpaster, B.H.; Park, S.W.; Harris, T.B.; Kritchevsky, S.B.; Nevitt, M.; Schwartz, A.V.; Simonsick, E.M.; Tylavsky, F.A.; Visser, M.; Newman, A.B. The loss of skeletal muscle strength, mass, and quality in older adults: The Health, Aging and Body Composition Study. J. Gerontol. Ser. A Biol. Sci. Med. Sci. 2006, 61, 1059–1064. [Google Scholar] [CrossRef] [PubMed]
- Mayans, D.; Cartwright, M.S.; Walker, F.O. Neuromuscular Ultrasonography: Quantifying Muscle and Nerve Measurements. Phys. Med. Rehabil. Clin. N. Am. 2012, 23, 133–148. [Google Scholar] [CrossRef] [PubMed] [Green Version]
- Corcoran, M.P.; Lamon-Fava, S.; Fielding, R.A. Skeletal muscle lipid deposition and insulin resistance: Effect of dietary fatty acids and exercise. Am. J. Clin. Nutr. 2007, 85, 662–677. [Google Scholar] [PubMed]
- Ríos-Díaz, J.; del Baño-Aledo, M.E.; Tembl-Ferrairó, J.I.; Chumillas, M.J.; Vázquez-Costa, J.F.; Martínez-Payá, J.J. Quantitative neuromuscular ultrasound analysis as biomarkers in amyotrophic lateral sclerosis. Eur. Radiol. 2019, 29, 4266–4275. [Google Scholar] [CrossRef] [PubMed]
- Miljkovic, I.; Zmuda, J.M. Epidemiology of myosteatosis. Curr. Opin. Clin. Nutr. Metab. Care 2010, 13, 260–264. [Google Scholar] [CrossRef]
- Fukumoto, Y.; Yamada, Y.; Ikezoe, T.; Watanabe, Y.; Taniguchi, M.; Sawano, S.; Minami, S.; Asai, T.; Kimura, M.; Ichihasi, N. Association of physical activity with age-related changes in muscle echo intensity in older adults: A 4-year longitudinal study. Am. Physiol. Soc. 2018, 10, 1–15. [Google Scholar] [CrossRef]
- Mirón Mombiela, R.; Facal de Castro, F.; Moreno, P.; Borras, C. Ultrasonic Echo Intensity as a New Noninvasive In Vivo Biomarker of Frailty. J. Am. Geriatr. Soc. 2017, 65, 2685–2690. [Google Scholar] [CrossRef]
- Fukumoto, Y.; Ikezoe, T.; Yamada, Y.; Tsukagoshi, R.; Nakamura, M.; Mori, N.; Kimura, M.; Ichihashi, N. Skeletal muscle quality assessed from echo intensity is associated with muscle strength of middle-aged and elderly persons. Eur. J. Appl. Physiol. 2012, 112, 1519–1525. [Google Scholar] [CrossRef] [Green Version]

| Data | Multicomponent (n = 16) | Control (n= 14) | p-Value Cases vs. Controls |
|---|---|---|---|
| Age, y | 85.87 ± 7.18 | 86.57 ± 5.82 | 0.775 |
| Mass, kg | 64.70 ± 8.16 | 62.60 ± 13.16 | 0.599 |
| Height, m | 1.53 ± 0.12 | 1.53 ± 0.12 | 0.756 |
| BMI, kg/m2 | 27.69 ± 3.62 | 26.14 ± 4.74 | 0.321 |
| Intrasubject Effects | ||||
|---|---|---|---|---|
| Measure | Control n = 13 | Multicomponent n = 16 | Time Value F (Df); P (Eta2) | Treatment X Time F (Df); P (Eta2) |
| Right VL-PA | ||||
| Baseline | 12.0 ±3.7 | 12.3 ± 3.8 | F (1, 27) = 0.882; P = 0.356 (0.032) | F (1, 27) = 1.672; P = 0.207 (0.058) |
| 12-weeks | 10.8 ± 3.3 | 12.5 ± 2.1 | ||
| Left VL-PA | ||||
| Baseline | 11.4 ± 2.1 | 14.1 ± 5.7 | F (1, 27) = 2.136; P = 0.155 (0.073) | F (1, 27) = 0.277; P = 0.603 (0.010) |
| 12-weeks | 10.7 ± 4.0 | 12.7 ± 3.0 | ||
| Right RF-CSA | ||||
| Baseline | 2.5 ± 1.1 | 2.8 ± 1.2 | F (1, 27) = 0.020; P = 0.888 (0.001) | F (1, 27) = 0.475; P = 0.497 (0.017) |
| 12-weeks | 2.4 ± 0.7 | 3.0 ± 0.8 | ||
| Left RF-CSA | ||||
| Baseline | 2.5 ± 0.8 | 2.9 ± 1.3 | F (1, 27) = 0.006; P = 0.938 (0.001) | F (1, 27) = 1.029; P = 0.319 (0.037) |
| 12-weeks | 2.6 ± 0.7 | 2.8 ± 0.9 | ||
| Right RF-TH | ||||
| Baseline | 1.0 ± 0.2 | 1.2 ± 0.2 | F (1, 27) = 0.417; P = 0.524 (0.015) | F (1, 27) = 0.978; P = 0.331 (0.035) |
| 12-weeks | 1.0 ± 0.2 | 1.2 ± 0.2 | ||
| Left RF-TH | ||||
| Baseline | 1.1 ± 0.4 | 1.2 ± 0.3 | F (1, 27) = 0.763; P = 0.390 (0.027) | F (1, 27) = 0.386; P = 0.539 (0.014) |
| 12-weeks | 1.0 ± 0.3 | 1.2 ± 0.2 | ||
| Right RF-EI | ||||
| Baseline | 121.5 ± 26.4 | 120.8 ± 16.9 | F (1, 27) = 4.720; P = 0.039 (0.154) | F (1, 27) = 1.656; P = 0.209 (0.060) |
| 12-weeks | 118.5 ± 19.8 | 108.8 ± 17.3 | ||
| Left RF-EI | ||||
| Baseline | 123.6 ± 24.8 | 130.4 ± 11.4 | F (1, 27) = 21.856; P = 0.001 (0.457) | F (1, 27) = 6.862; P = 0.014 (0.035) |
| 12-weeks | 118.0 ± 22.7 | 110.3 ± 15.8 | ||
| Right RF-EV | ||||
| Baseline | 24.9 ± 5.3 | 20.0 ± 6.3 | F (1, 27) = 5.230; P = 0.031 (0.167) | F (1, 27) = 1.174; P = 0.288 (0.043) |
| 12-weeks | 26.7 ± 6.9 | 24.8 ± 9.4 | ||
| Left RF-EV | ||||
| Baseline | 24.6 ± 6.8 | 21.9 ± 4.7 | F (1, 27) = 7.926; P = 0.009 (0.234) | F (1, 27) = 0.677; P = 0.418 (0.025) |
| 12-weeks | 28.2 ± 6.1 | 23.9 ± 6.6 | ||
| Muscle Power | ||||
| Baseline | 168.27 ± 64.1 | 161.0 ± 62.3 | F (1, 27) = 19.645; P = 0.005 (0.278) | F (1, 27) = 9.321; P = 0.005 (0.272) |
| 12-weeks | 168.5 ± 52.9 | 195.9 ± 48.0 | ||
| Muscle Strenght | ||||
| Baseline | 534.5 ± 210.1 | 552.5 ± 145.2 | F (1, 27) = 1.569; P = 0.222 (0.059) | F (1, 27) = 1.352; P = 0.256 (0.051) |
| 12-weeks | 592.7 ± 224.5 | 554.6 ± 166.4 | ||
Publisher’s Note: MDPI stays neutral with regard to jurisdictional claims in published maps and institutional affiliations. |
© 2021 by the authors. Licensee MDPI, Basel, Switzerland. This article is an open access article distributed under the terms and conditions of the Creative Commons Attribution (CC BY) license (https://creativecommons.org/licenses/by/4.0/).
Share and Cite
López-López, S.; Pareja-Galeano, H.; Almazán-Polo, J.; Cotteret, C.; Téllez-González, P.; Calvo-Lobo, C.; Perea-Unceta, L.; Romero-Morales, C. Quantitative Ultrasound Changes in Echotexture and Functional Parameters after a Multicomponent Training Program in Pre-Frailty Individuals: A Pilot Randomized Clinical Trial. Healthcare 2021, 9, 1279. https://doi.org/10.3390/healthcare9101279
López-López S, Pareja-Galeano H, Almazán-Polo J, Cotteret C, Téllez-González P, Calvo-Lobo C, Perea-Unceta L, Romero-Morales C. Quantitative Ultrasound Changes in Echotexture and Functional Parameters after a Multicomponent Training Program in Pre-Frailty Individuals: A Pilot Randomized Clinical Trial. Healthcare. 2021; 9(10):1279. https://doi.org/10.3390/healthcare9101279
Chicago/Turabian StyleLópez-López, Sergio, Helios Pareja-Galeano, Jaime Almazán-Polo, Charles Cotteret, Patricia Téllez-González, César Calvo-Lobo, Luis Perea-Unceta, and Carlos Romero-Morales. 2021. "Quantitative Ultrasound Changes in Echotexture and Functional Parameters after a Multicomponent Training Program in Pre-Frailty Individuals: A Pilot Randomized Clinical Trial" Healthcare 9, no. 10: 1279. https://doi.org/10.3390/healthcare9101279