Article

Umbelliferone-Based Fluorescent Probe for Selective Recognition of Hydrogen Sulfide and Its Bioimaging in Living Cells and Zebrafish

1
State Key Laboratory of Southwestern Chinese Medicine Resources, School of Pharmacy, Chengdu University of Traditional Chinese Medicine, Chengdu 611137, China
2
Department of Chemistry, KU Leuven, Celestijnenlaan 200f-bus 02404, 3001 Leuven, Belgium
*
Authors to whom correspondence should be addressed.
Chemosensors 2022, 10(10), 427; https://doi.org/10.3390/chemosensors10100427
Submission received: 16 September 2022 / Revised: 10 October 2022 / Accepted: 15 October 2022 / Published: 17 October 2022
(This article belongs to the Special Issue Fluorescent Probe for Sensing and Bioimaging)

Abstract

:
Hydrogen sulfide (H2S) plays a crucial role in a variety of physiological and pathological processes, similar to other gaseous signaling molecules. The significant pathophysiological functions of H2S have sparked a great deal of interest in the creation of fluorescent probes for H2S monitoring and imaging. Using 3-cyanoumbelliferone as the push–pull fluorophore and a dinitrophenyl substituent as the response site, herein we developed a umbelliferone-based fluorescent probe 1 for H2S, which exhibited a remarkable turn-on fluorescence response with a low detection limit (79.8 nM), high sensitivity and selectivity. The H2S-sensing mechanism could be attributed to the cleavage of the ether bond between the dinitrophenyl group and the umbelliferone, leading to the recovery of an intermolecular charge transfer (ICT) process. Moreover, the probe had negligible cytotoxicity and good cell membrane permeability, which was successfully applied to image H2S in MCF-7 cells and zebrafish.

1. Introduction

Hydrogen sulfide (H2S), one of the prominent volatiles produced from the spoilage of food samples, is well-known to the public as a toxic gas with a rotten egg odor. In mammals, this gaseous molecule can be endogenously produced as the result of particular enzyme-catalyzed reactions of cysteine (Cys) and homocysteine (Hcy) in the presence of cystathionine β-synthetase (CBS), cystathionine γ-lyase (CSE) and/or 3-mercaptopyruvate sulfotransferase (3-MST) [1]. Endogenous H2S can be found in the brain, liver, kidneys, cardiovascular and inflammatory systems, which is closely related to the function in many physiological processes, including regulating inflammation, suppression of oxidative stress, mediation of neurotransmission, relaxation of vascular smooth muscles, antioxidant effects and the inhibition of insulin signaling [2,3,4,5,6]. Actually, H2S is the simplest and smallest reactive sulfur species (RSS), which is considered to be the third gaseous signaling molecule following nitric oxide (NO) and carbon monoxide (CO) [7,8,9]. However, an abnormal level of H2S could contribute to a variety of diseases, such as diabetes, Down’s syndrome, chronic kidney disease and liver cirrhosis [10,11,12]. Obviously, the assessment of H2S levels in vivo is of great significance, not only for the early diagnosis of specific diseases but also for a better understanding of the diverse physiological functions of H2S in complicated biological systems.
Up to now, a series of analytical methods have been developed for the quantitative detection of H2S, involving the titration method [13], gas chromatography [14], colorimetric assays [15], electrochemical methods [16], chemiluminescence (CL) assays [17], and fluorimetric assays [18]. Among them, fluorescence-based techniques are particularly attractive as they offer a low cost, real-time and in vivo biosensing, high sensitivity and selectivity, non-destructive testing and spatiotemporal resolution [19,20,21,22]. Not surprisingly, huge progress has been made in the development of fluorescent probes for the sensitive and selective tracking of various analytes [23,24,25,26]. For example, we have recently summarized the progress made so far in fluorescent chemosensors for f-block metal ions [27] and HOBr [28]. At present, numerous H2S-specific fluorescent probes have been developed, whose sensing mechanism involves an irreversible chemical reaction, as induced by H2S [29,30,31]. The reduction of azides or nitro compounds to amines with H2S and the thiolysis reaction in the presence of H2S (e.g., removal of the 2,4-dinitrobenzenesulfonyl group, dinitrophenyl ether or nitrobenzofurazan group) are two typical examples [32,33,34].
Structurally, fluorophore-based fluorescent probes coupled with H2S-reactive sites are mainly constructed from small organic dyes. Coumarin and its derivatives are a very large family of phytochemicals, whose backbone contains the unique 2H-chromen-2-one motif [35]. Despite negligible or weak fluorescence of the parent coumarin, the decorating of coumarin with a specific substituent group can readily afford various functionalities and sufficient fluorescence with diverse emission colors. For example, the introduction of electron-donor groups onto the 6- or 7-position or electron-withdrawing groups (e.g., -CN, -CF3, -NO2) in the 3- or 4-position of the coumarin core, can result in a bathochromic emission. Accordingly, a large variety of coumarin dyes have been rationally developed as fluorescent chemosensors for anions, metal ions, pH and biologically related species [36,37,38]. Particularly, fluorescent chemosensors based on the phytochemical coumarin possess excellent biocompatibility. With respect to umbelliferone, it possesses the 7-hydroxycoumarin structure that is widely distributed in umbelliferae families [39]. By virtue of its structural simplicity, umbelliferone is also a fluorescing compound that has been widely accepted as a synthon for more complex coumarins. As a result, we speculated that tethering specific units onto umbelliferone would result in a robust fluorescent probe for the selective recognition of certain guests.
With our continued interest in the construction of molecular receptors [40,41,42,43,44,45], we report herein on a umbelliferone-based fluorescent probe 1 capable of selective recognition of H2S with high sensitivity and selectivity. This probe contains the electron-withdrawing cyano (-CN) group at the 3-position and the reactive dinitrophenyl substituent at the 7-oxygen of the coumarin. Probe 1 itself exhibited negligible or very weak fluorescence due to the inhibition of an intramolecular charge transfer (ICT) process. The addition of H2S could selectively lead to obvious fluorescence enhancement, owing to the enhanced ICT effect and the restoration of the conjugation of the hydroxy and cyano groups resulting from the cleavage of the ether bond between the dinitrophenyl group and umbelliferone framework. In addition, the probe was successfully applied to visualize H2S in MCF-7 cells and zebrafish.

2. Experimental Section

2.1. Materials and Instruments

All materials, unless otherwise noted, were purchased from commercial sources and used without further purification. 1H NMR and 13C NMR were recorded on a Bruker Avance-600 MHz magnetic resonance spectrometer using tetramethylsilane (TMS) as an internal standard, and coupling constants (J) are denoted in Hz. Electrospray ionization mass spectra (ESI-MS) were measured with a Q Exactive Orbitrap mass spectrometer (Thermo Fisher Scientific, America). UV–vis absorption spectra were recorded on a TU-1901 spectrophotometer (Beijing, China). Fluorescence measurements were obtained using an F-380 fluorescence spectrophotometer (Tianjin Gangdong SCI &TECH, Tianjin, China). The pH value measurements were performed by a PHS-3C pH meter (Shanghai, China). Confocal laser shooting was measured with confocal fluorescence microscopy (Olympus FV1200, Tokyo, Japan).

2.2. Synthesis of Probe 1

3-Cyanoumbelliferone (200 mg, 1.00 equiv.) and 1-chloro-2,4-dinitrobenzene (260 mg, 1.20 equiv.) were dissolved in acetonitrile (20 mL) in the presence of K2CO3 (180 mg, 1.2 equiv.). The resulting mixture was refluxed at 80 °C for 10 h. After cooling to room temperature, the solvent was removed and the crude compound was purified by column chromatography (silica gel, EtOAc: PE = 1:2, v/v) to afford 1 (241 mg, 60%) as a white powder. 1H NMR (600 MHz, DMSO-d6) δ 8.95 (s, 2 H), 8.57 (dd, J = 9.2, 2.8 Hz, 1 H), 7.92 (d, J = 8.6 Hz, 1 H), 7.56 (d, J = 9.2 Hz, 1 H), 7.43 (d, J = 2.4 Hz, 1 H), and 7.32 (dd, J = 8.6, 2.4 Hz, 1 H). 13C NMR (151 MHz, DMSO-d6) δ 160.0, 156.6, 155.6, 152.7, 152.2, 143.2, 140.6, 132.2, 130.0, 122.7, 122.1, 116.2, 114.7, 114.5, 106.8, and 100.8. HRMS (ESI): m/z calculated for C16H7N3O7 [M + Na]+ 376.0182, found: m/z: 376.0185.

2.3. General Procedure for Absorption and Fluorescence Measurements

All stock and working solutions were prepared in CH3CN (spectroscopic grade) and ultrapure water. The samples of 1 (3.0 × 10⁻³ mol·L−1) were freshly prepared in CH3CN. The UV–vis absorption responses of probe 1 (10 μM) toward the analytes were investigated in CH3CN. The fluorescence responses of 1 (10 μM) toward these analytes were investigated in an aqueous PBS buffer (10 mM, pH = 7.4, containing 50% CH3CN) under excitation at 413 nm with 10 nm emission and excitation slit widths in the spectrofluorometer.

2.4. Cell Imaging

MCF-7 (human breast cancer cell line) cells were grown in Dulbecco’s modified Eagle’s medium (DMEM), which contains a supplement of 10% FBS (Fetal Bovine Serum) and antibiotics (100 U•mL−1 Penicillin and 100 g•L−1 streptomycin) in a 5% CO2 incubator at 37 °C. MCF-7 were inoculated in a 10 mm glass culture dish and further incubated with probe 1 (10 μM) for 30 min at 37 °C and 5% CO2 incubation. The cells were washed three times with PBS, then incubated with NaHS (100 μM) for another 30 min, followed by washing three times with PBS, and further imaging using a confocal fluorescence microscope.

2.5. Zebrafish Imaging

Pathogen-free zebrafish (AB strain) were cultured and reproduced on the zebrafish experimental platform of Chengdu University of Traditional Chinese Medicine (TCM). The zebrafish were reared in a fully enclosed circulatory system based on the standard zebrafish breeding protocols. Three-day-old zebrafish were cultured in probe 1 (10 μM) for 30 min, followed by treatment with NaHS (100 μM) for another 30 min. These zebrafish were transferred into a new confocal plate for imaging using confocal fluorescence microscopy.

3. Results and Discussion

3.1. Synthesis and Characterization

The preparation procedure for umbelliferone-based fluorescent probe 1 has been outlined in Scheme 1. Briefly, the key precursor 3-cyanoumbelliferone reacted with 1-chloro-2,4-dinitrobenzene in the presence of K2CO3 in acetonitrile solvent at 80 °C following the classical nucleophilic aromatic substitution reaction to offer the derivative 1 in a reasonable yield (60%). Its structure was confirmed by NMR spectroscopy and high-resolution mass spectrometry (HRMS) (Figures S1–S3, ESI†).

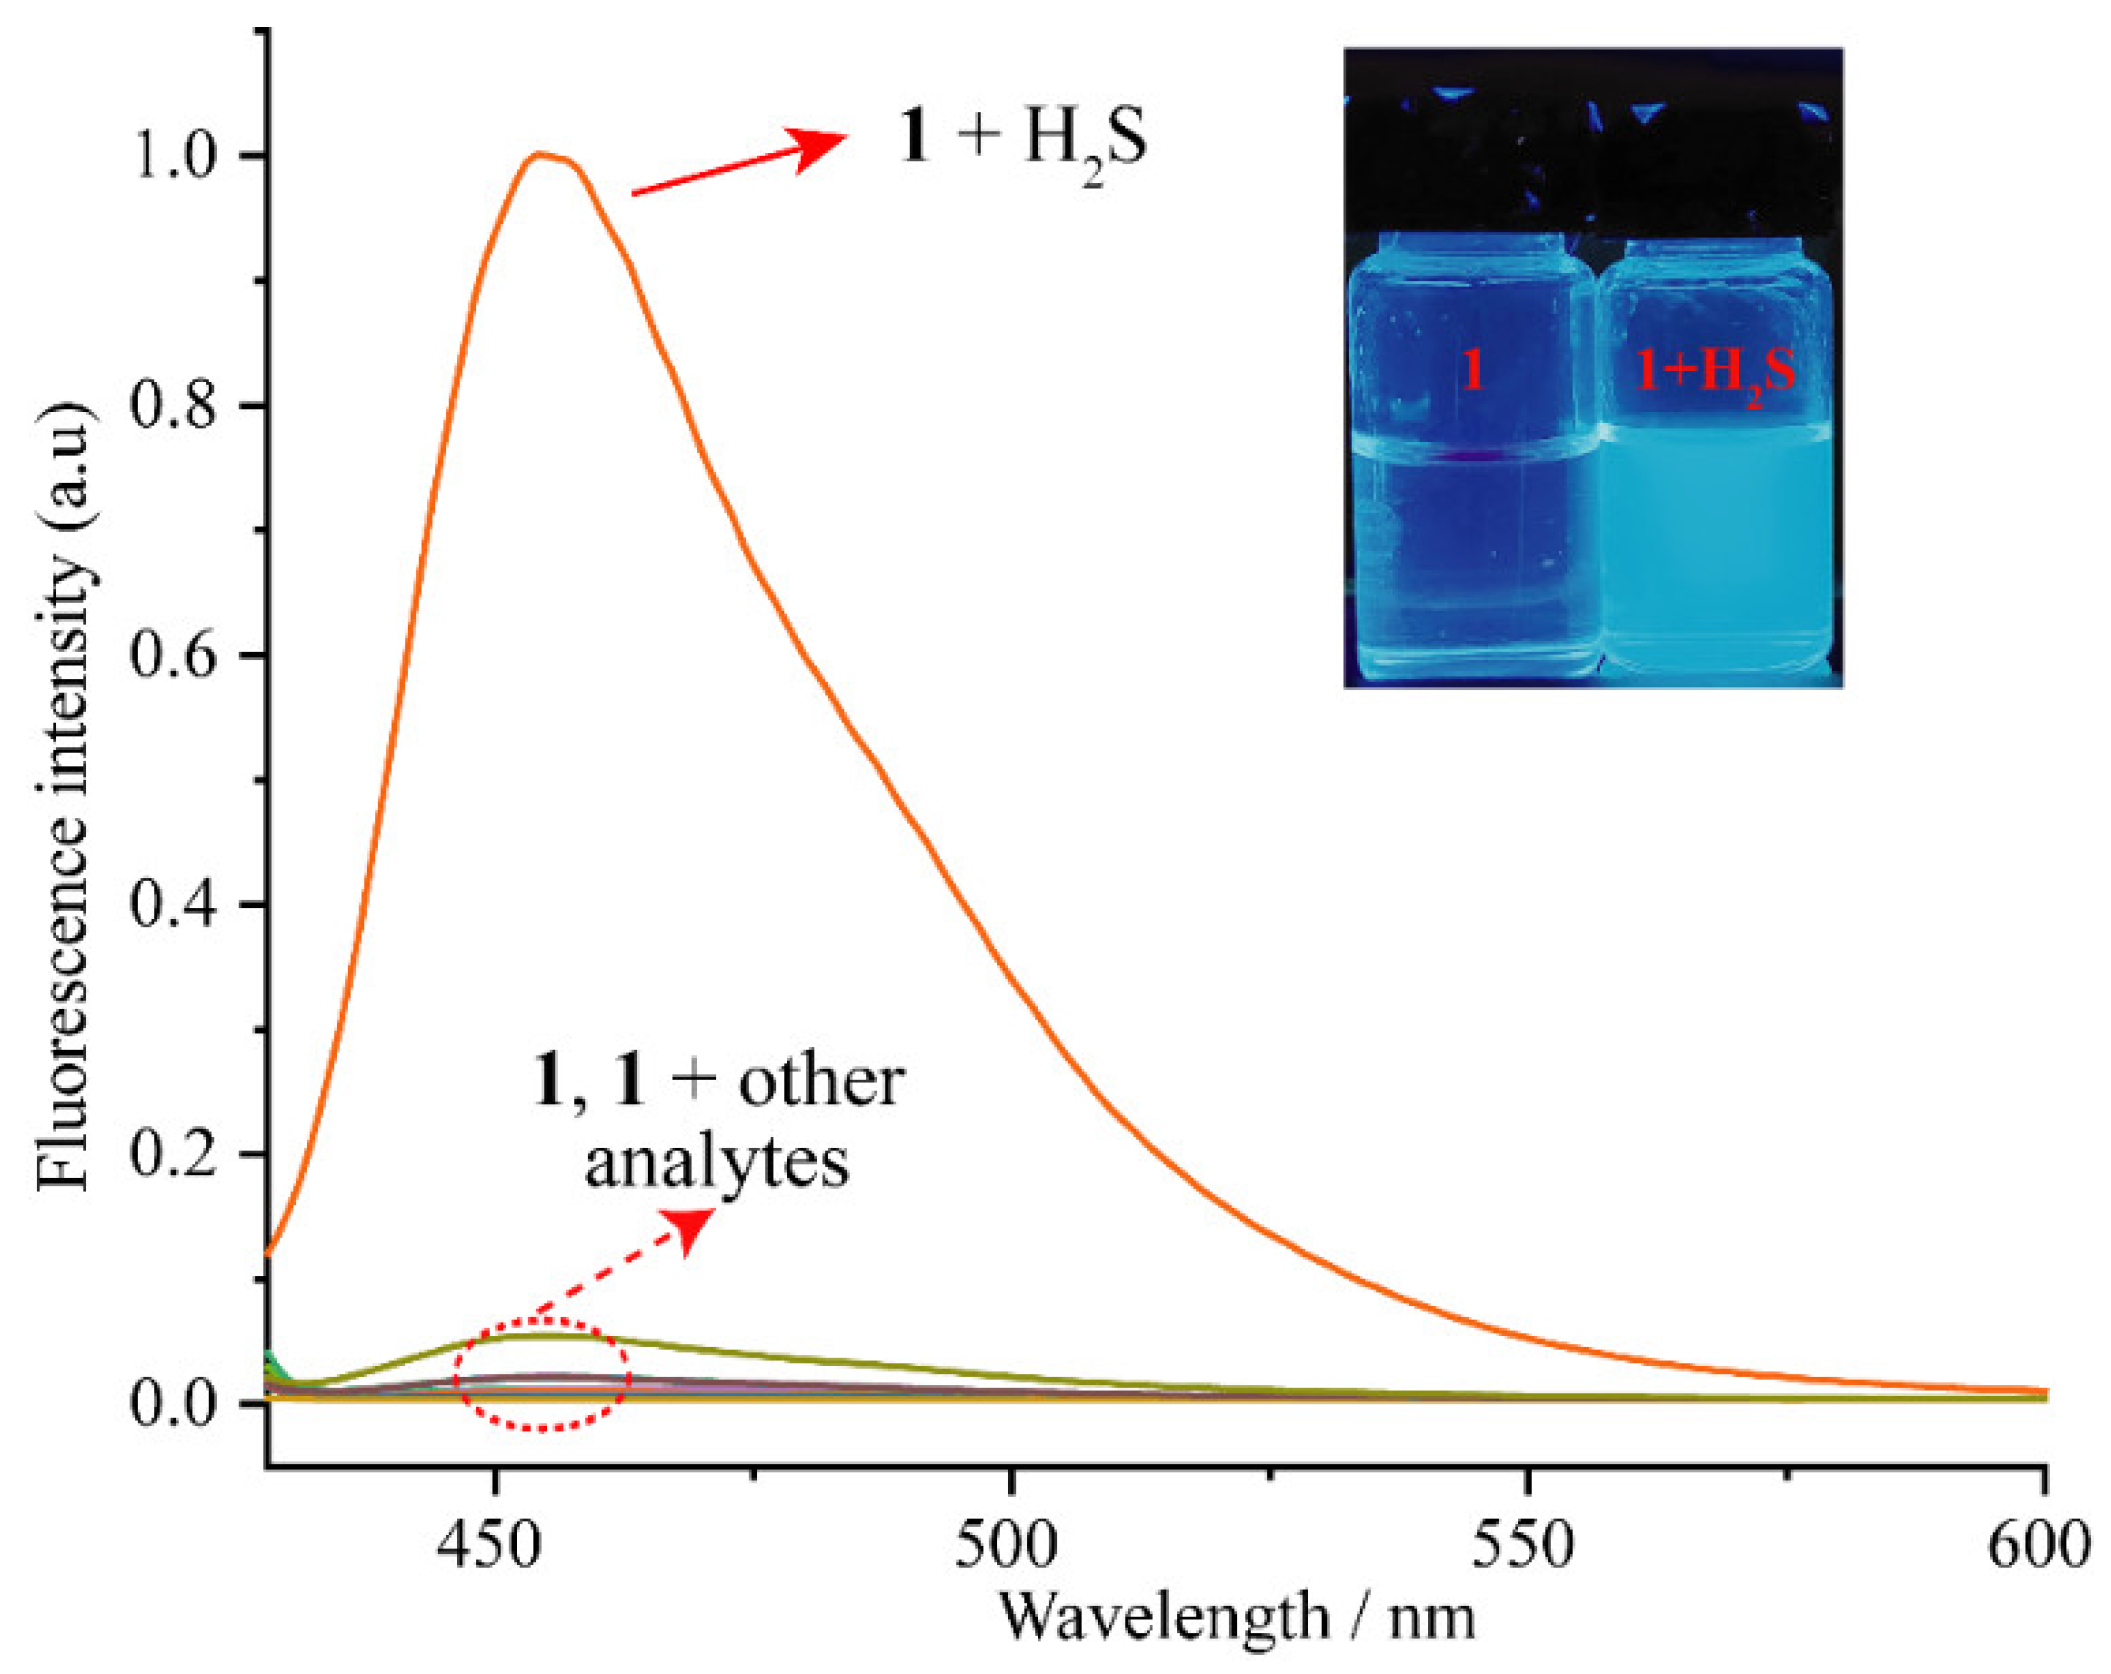
3.2. Optical Behavior of 1 to H2S

With probe 1 in hand, we firstly exploited its recognition behaviors toward various analytes by the screening of anions (HSO3-, CO32-, AcO-, Br-, Cl-, F-, H2PO4-, SO42-, NO3- and HS-), cations (NH4+, Mg2+ and Al3+) and amino acids (Ser, Met, Leu and Gly) using the UV–vis absorption technique in CH3CN at room temperature. Specifically, HS- can be used as the source of H2S as this gas molecule mainly exists in the form of HS- in an aqueous solution under physiological conditions [46,47,48]. As shown in Figure 1, probe 1 exhibited a strong absorption centered at 342 nm, along with a shoulder peak centered at approximately 307 nm. Upon the addition of 10 equiv. of the above-mentioned analytes, the intensities of these two absorption bands underwent a slight decrease, which was not comparable to that of H2S. Obviously, only in the case of the addition of H2S (NaHS is the source of H2S), a new absorption band peaking at 438 nm was observed, accompanied by a readily observable change from colorless to straw yellow under visible light (inset of Figure 1). These results preliminarily indicated that probe 1 had displayed a selective and favorable recognition of H2S.
Subsequently, the recognition behaviors of probe 1 were conducted by fluorescence spectroscopy in H2O-CH3CN (1:1, v/v, 10 mM PBS, pH = 7.40) mixed aqueous medium. The probe itself showed marginal background fluorescence upon excitation at 413 nm (Figure 2). After treatment with H2S, a strong enhancement of the fluorescence emission at 455 nm was observed. Meanwhile, the fluorescent color of 1 clearly changed from colorless to sky-blue in the presence of H2S when exposing the solution under UV light (365 nm) (inset of Figure 2). In contrast, the other analytes did not induce such a remarkable emission enhancement, suggesting that probe 1 selectively reacted with H2S. Then, HRESI-MS was employed to rationalize the H2S-sensing mechanism, and the MS spectrum was recorded after mixing 1 with H2S. A very strong ion peak in negative ion mode at m/z 186.0192 (calculated: 186.0191) corresponding to [3-CU-H]- could be observed (Figure S4). As a result, we ascribed the turn-on fluorescence response to the nucleophilic aromatic substitution with H2S, leading to the release of free 3-CU and the recovery of the intramolecular charge transfer (ICT) process of 3-CU after the reaction.

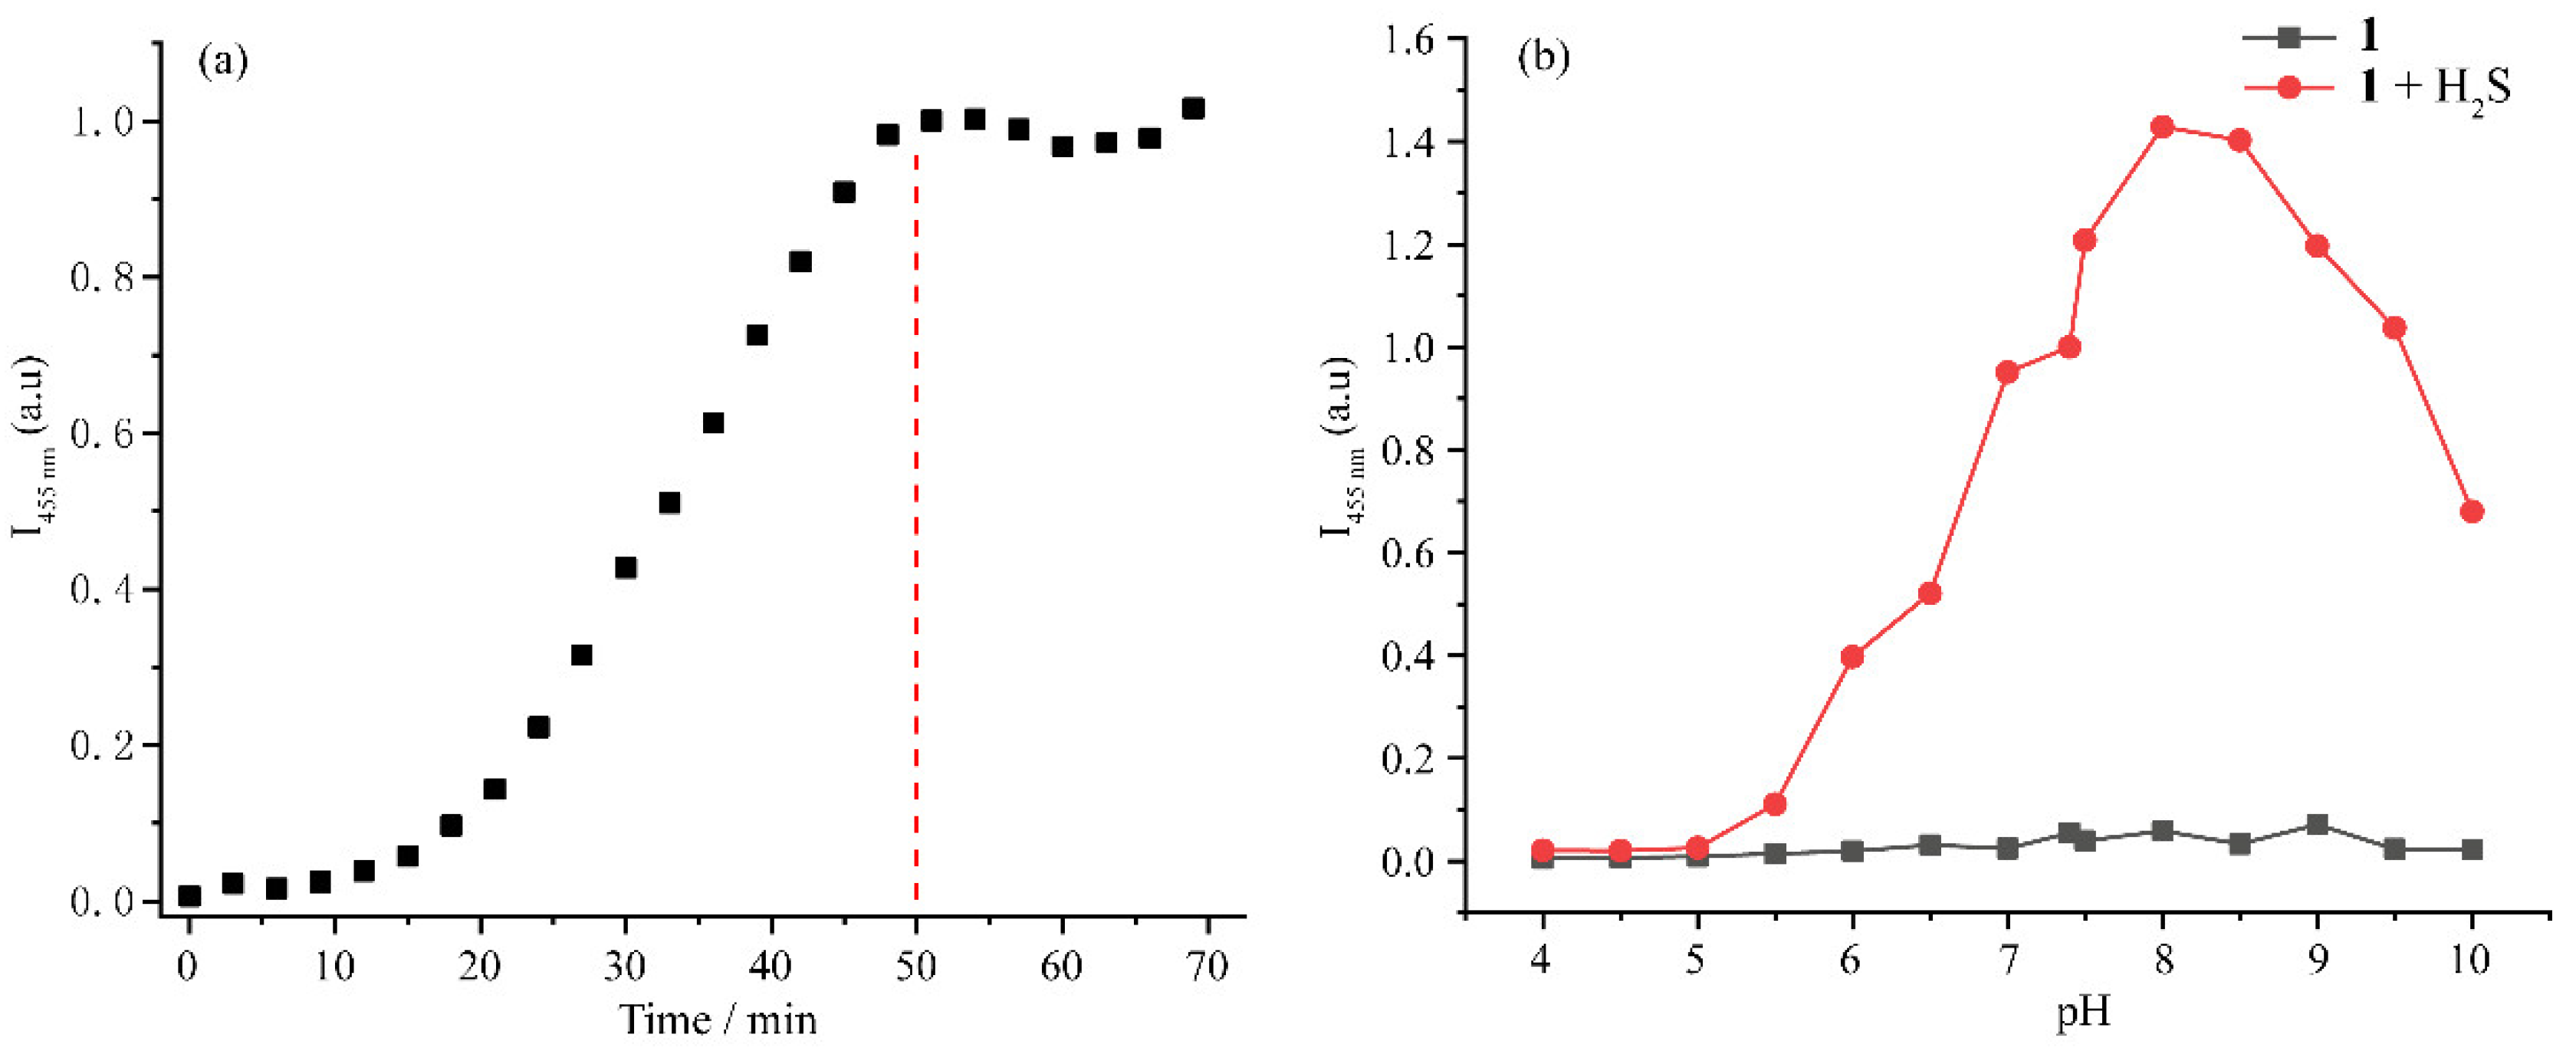
3.3. Time and pH-Dependent Fluorescence Response of 1 to H2S

One of the most important characteristics of a probe is its response time. In identical conditions, the kinetic profile of 1 in the presence of H2S was examined using fluorescence spectroscopy. After the addition of H2S, a notable increase in fluorescence at 455 nm was observed after 20 min incubation, which reached a maximum within 50 min (Figure 3a). A further extension of the incubation time had a small effect on its emission intensity, implying that the recognition event at room temperature needs 50 min to reach completion.
The pH level is a crucial variable that controls biological activities. To determine whether this probe is suitable for detecting H2S in biological systems, the effect of pH on 1 in the absence and presence of H2S was investigated. As shown in Figure 3b, the fluorescence intensity of probe 1 by itself at 455 nm did not significantly vary across the pH range of 4.0–10, demonstrating that the probe is pH-insensitive and has good stability over a broad pH range. Upon the addition of H2S, the fluorescence intensity at 455 nm gradually enhanced with the increase of pH value from 5.0–8.0. A further increment in pH value (pH > 8) led to a slight decrease in its fluorescence intensity, which was still obviously boosted compared with that of free 1. These findings showed that probe 1 had a considerable turn-on fluorescent recognition of H2S from a pH value of 6.0 to 10, signifying that our newly developed probe is suitable for measuring H2S under physiological pH conditions.

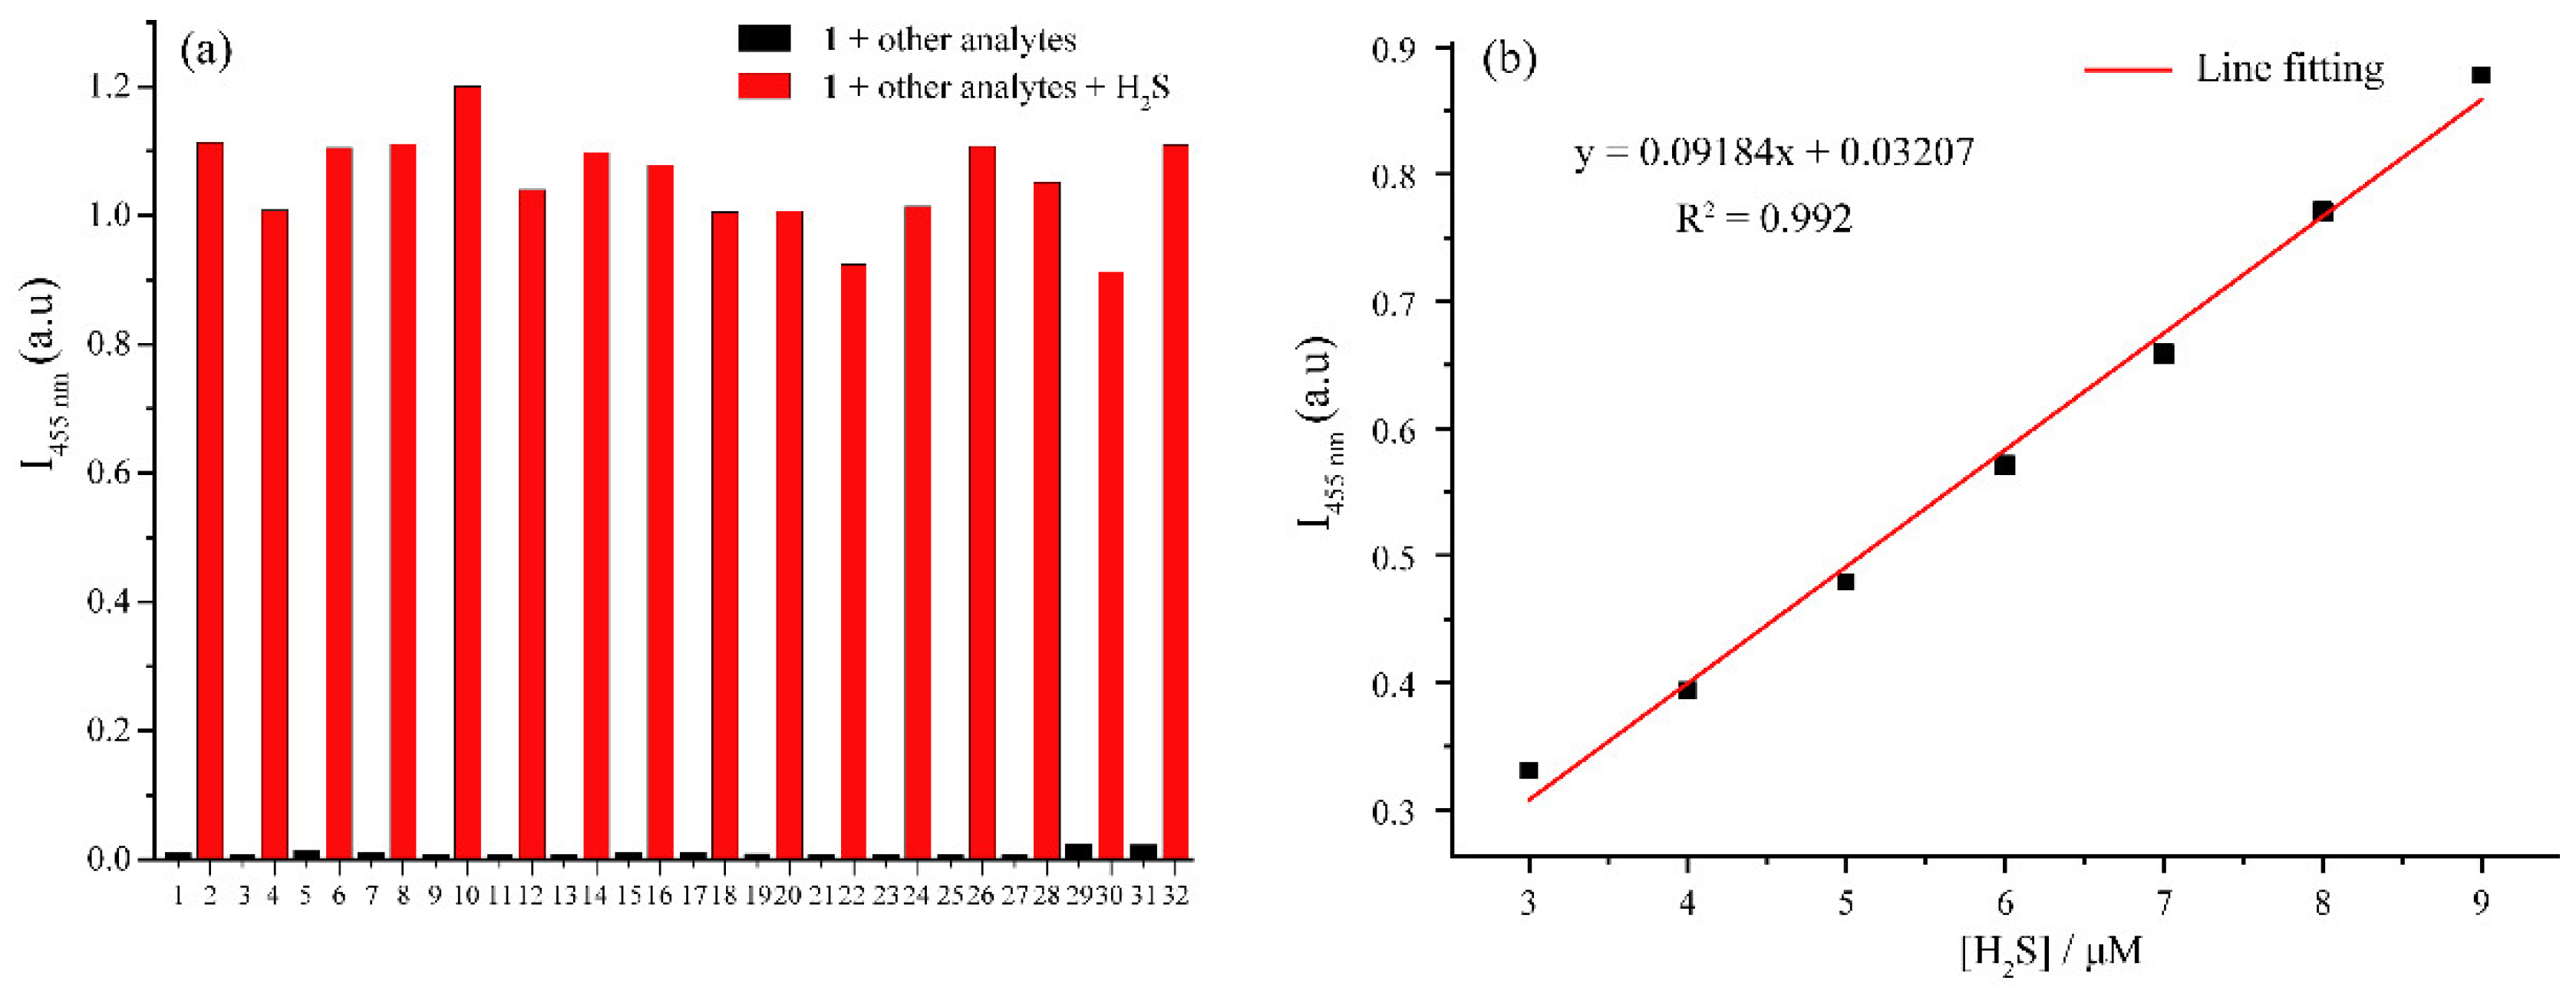
3.4. Selectivity and Detection Limit of 1 to H2S

In order to evaluate the selectivity of probe 1 toward H2S, a full 100 equiv. of the above-mentioned potentially interfering species were added into the H2O-CH3CN (1:1, v/v, 10 mM PBS, pH = 7.40) solutions containing probe 1 (10 μM), followed by the addition of 10 equiv. of H2S. As presented in Figure 4a, when these competitive species were added, the fluorescence intensity at 455 nm showed roughly the same pattern as that of free 1 alone. However, each of the emissions was significantly increased when H2S was subsequently added to the solution, which was comparable to that obtained in the presence of H2S alone, suggesting that none of the tested species interfered with the sensing of H2S. As a result, these results further proved that probe 1 was a highly sensitive and selective turn-on fluorescent sensor for H2S. In the same medium solution, fluorescence titration of probe 1 with various H2S concentrations was also investigated. The previous fluorescence emission band, which was centered at 455 nm, was noticeably amplified with the addition of increasing amounts of H2S. In particular, the measured fluorescence intensity was linearly related to the H2S concentration ranging from 3.0 to 9.0 μM (R2 = 0.992), from which the detection limit was determined to be 79.8 nM using the 3σ/k method.

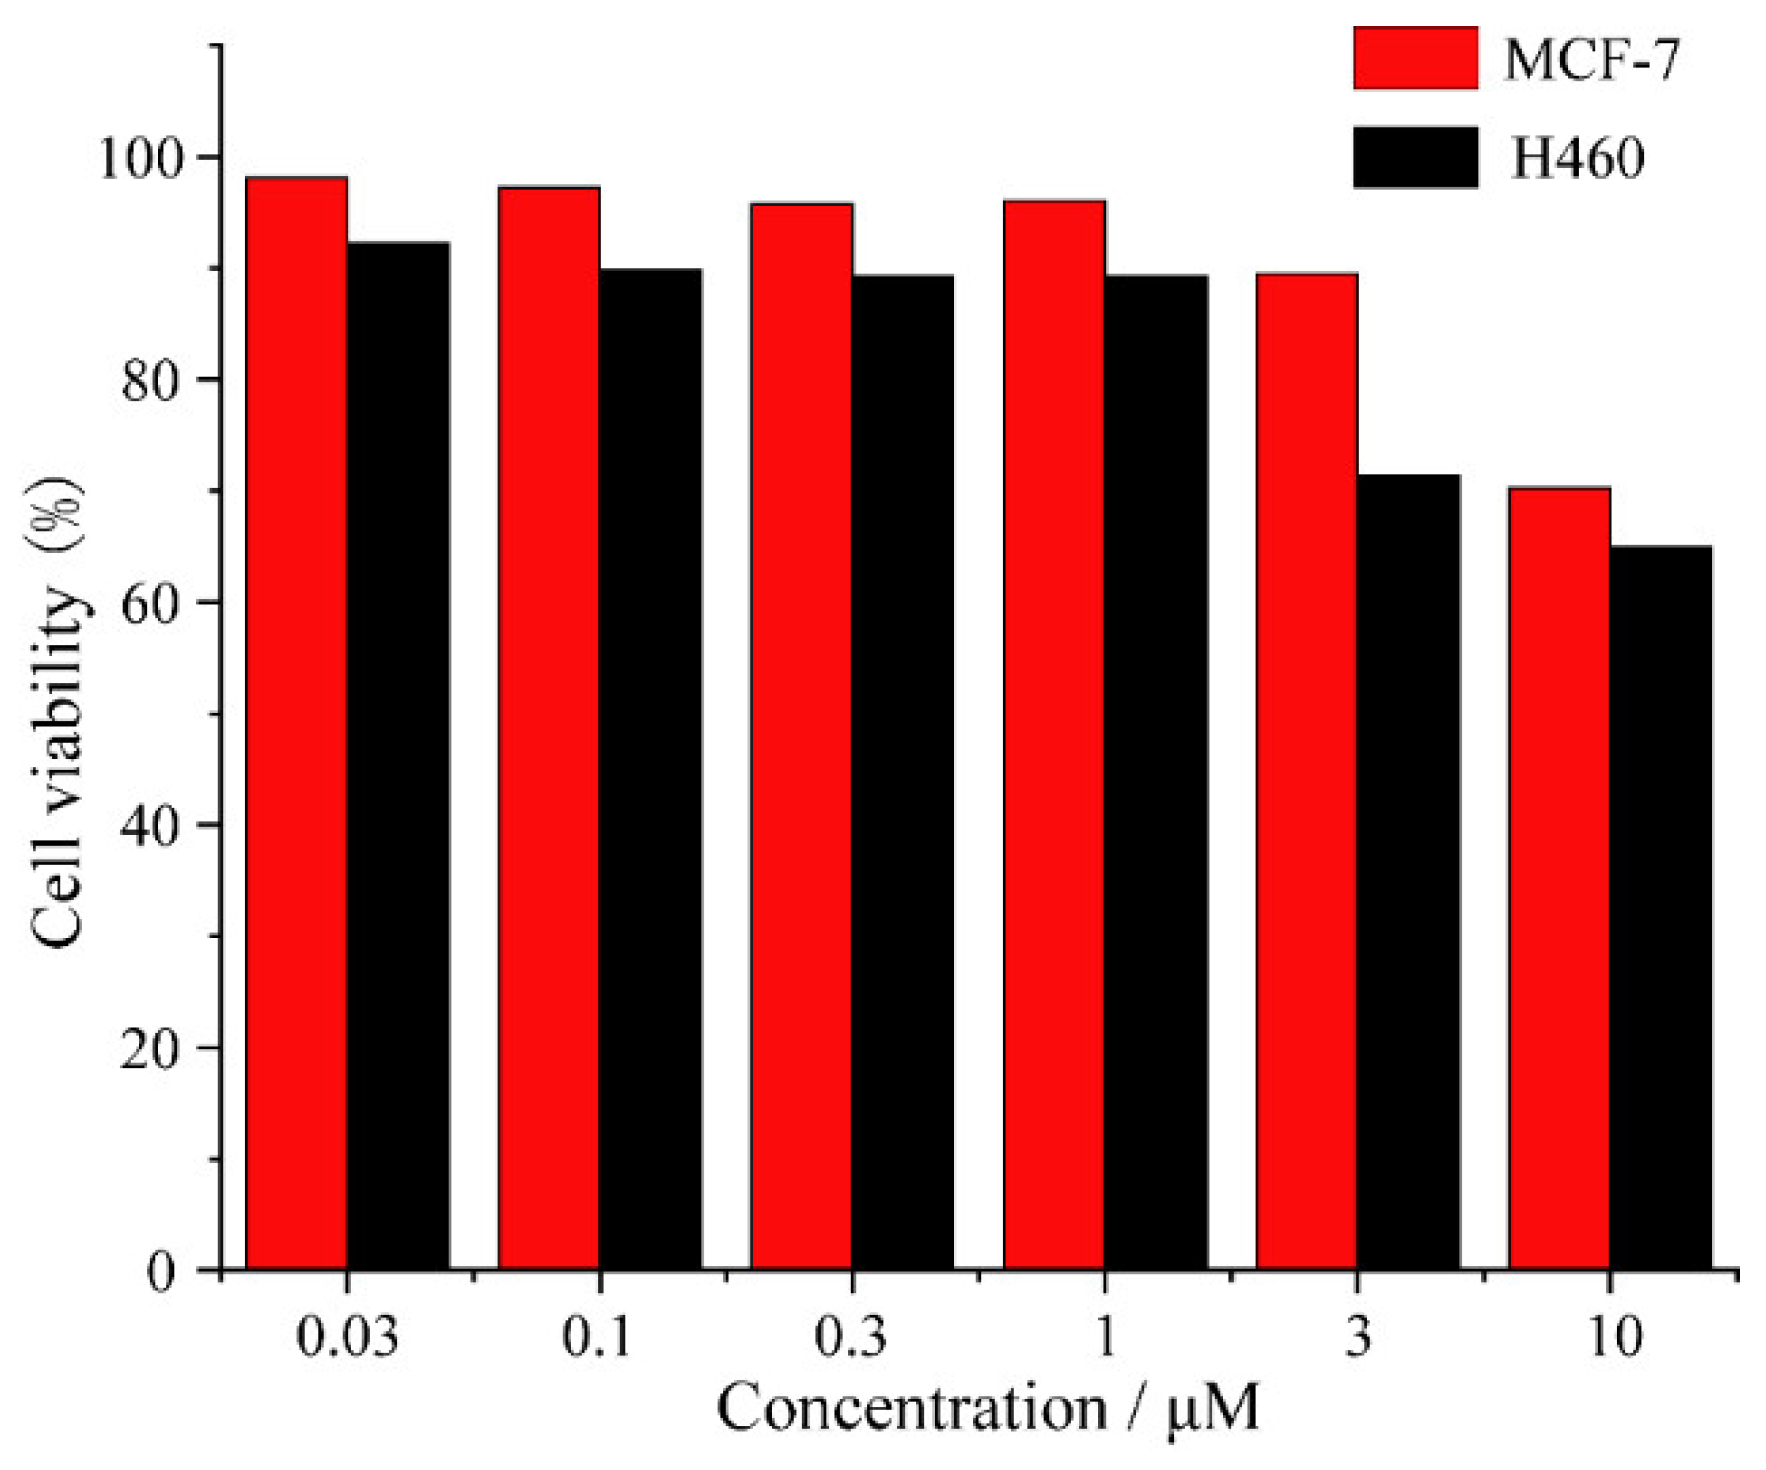
3.5. Cytotoxicity of 1

Before further exploring the potential imaging capability of 1 in living cells, a 3-(4,5-dimethylthiazol-2-yl)-2,5-diphenyl tetrazolium bromide (MTT) assay experiment, a frequently used technique for assessing the toxicity of a compound, was carried out to make sure that compound 1 was a safe probe to utilize in cells. Two different cell lines of human breast cancer cells (MCF-7) and human lung cancer cells (H460) were selected to test their cytotoxic activities. As depicted in Figure 5, after a long time of incubation (72 h) with 1 at various concentrations (0.03, 0.1, 0.3, 1.0, 3.0, and 10 μM), the cell viability of 1-treated cells remained at 70% for MCF-7 and 65% for H460, even at 10 μM of 1. These results demonstrated that probe 1 had good biocompatibility and negligible or extremely low cytotoxicity. Meanwhile, the cell viability of MCF-7 was slightly higher than that of H460 at all test concentrations.

3.6. Imaging of H2S in Cells by 1

The excellent H2S-recognition behavior prompted us to investigate whether the probe was suitable for imaging H2S in a cellular environment. Considering the relatively higher cytotoxicity to H460, we chose the MCF-7 cell lines in the cell imaging experiments. The MCF-7 were therefore incubated with probe 1 (10 μM) for 30 min at 37 °C before being visualized using laser scanning confocal fluorescence microscopy. As shown in Figure 6a–c, the cells only exhibited very weak or negligible intracellular fluorescence. By contrast, after further incubation with H2S, the 1-loaded cells showed considerable fluorescence amplification, and visible fluorescence signals in the blue channel could be observed (Figure 6d–f). These results indicated that our probe has good cell membrane permeability and can consistently detect intracellular H2S in living cells.

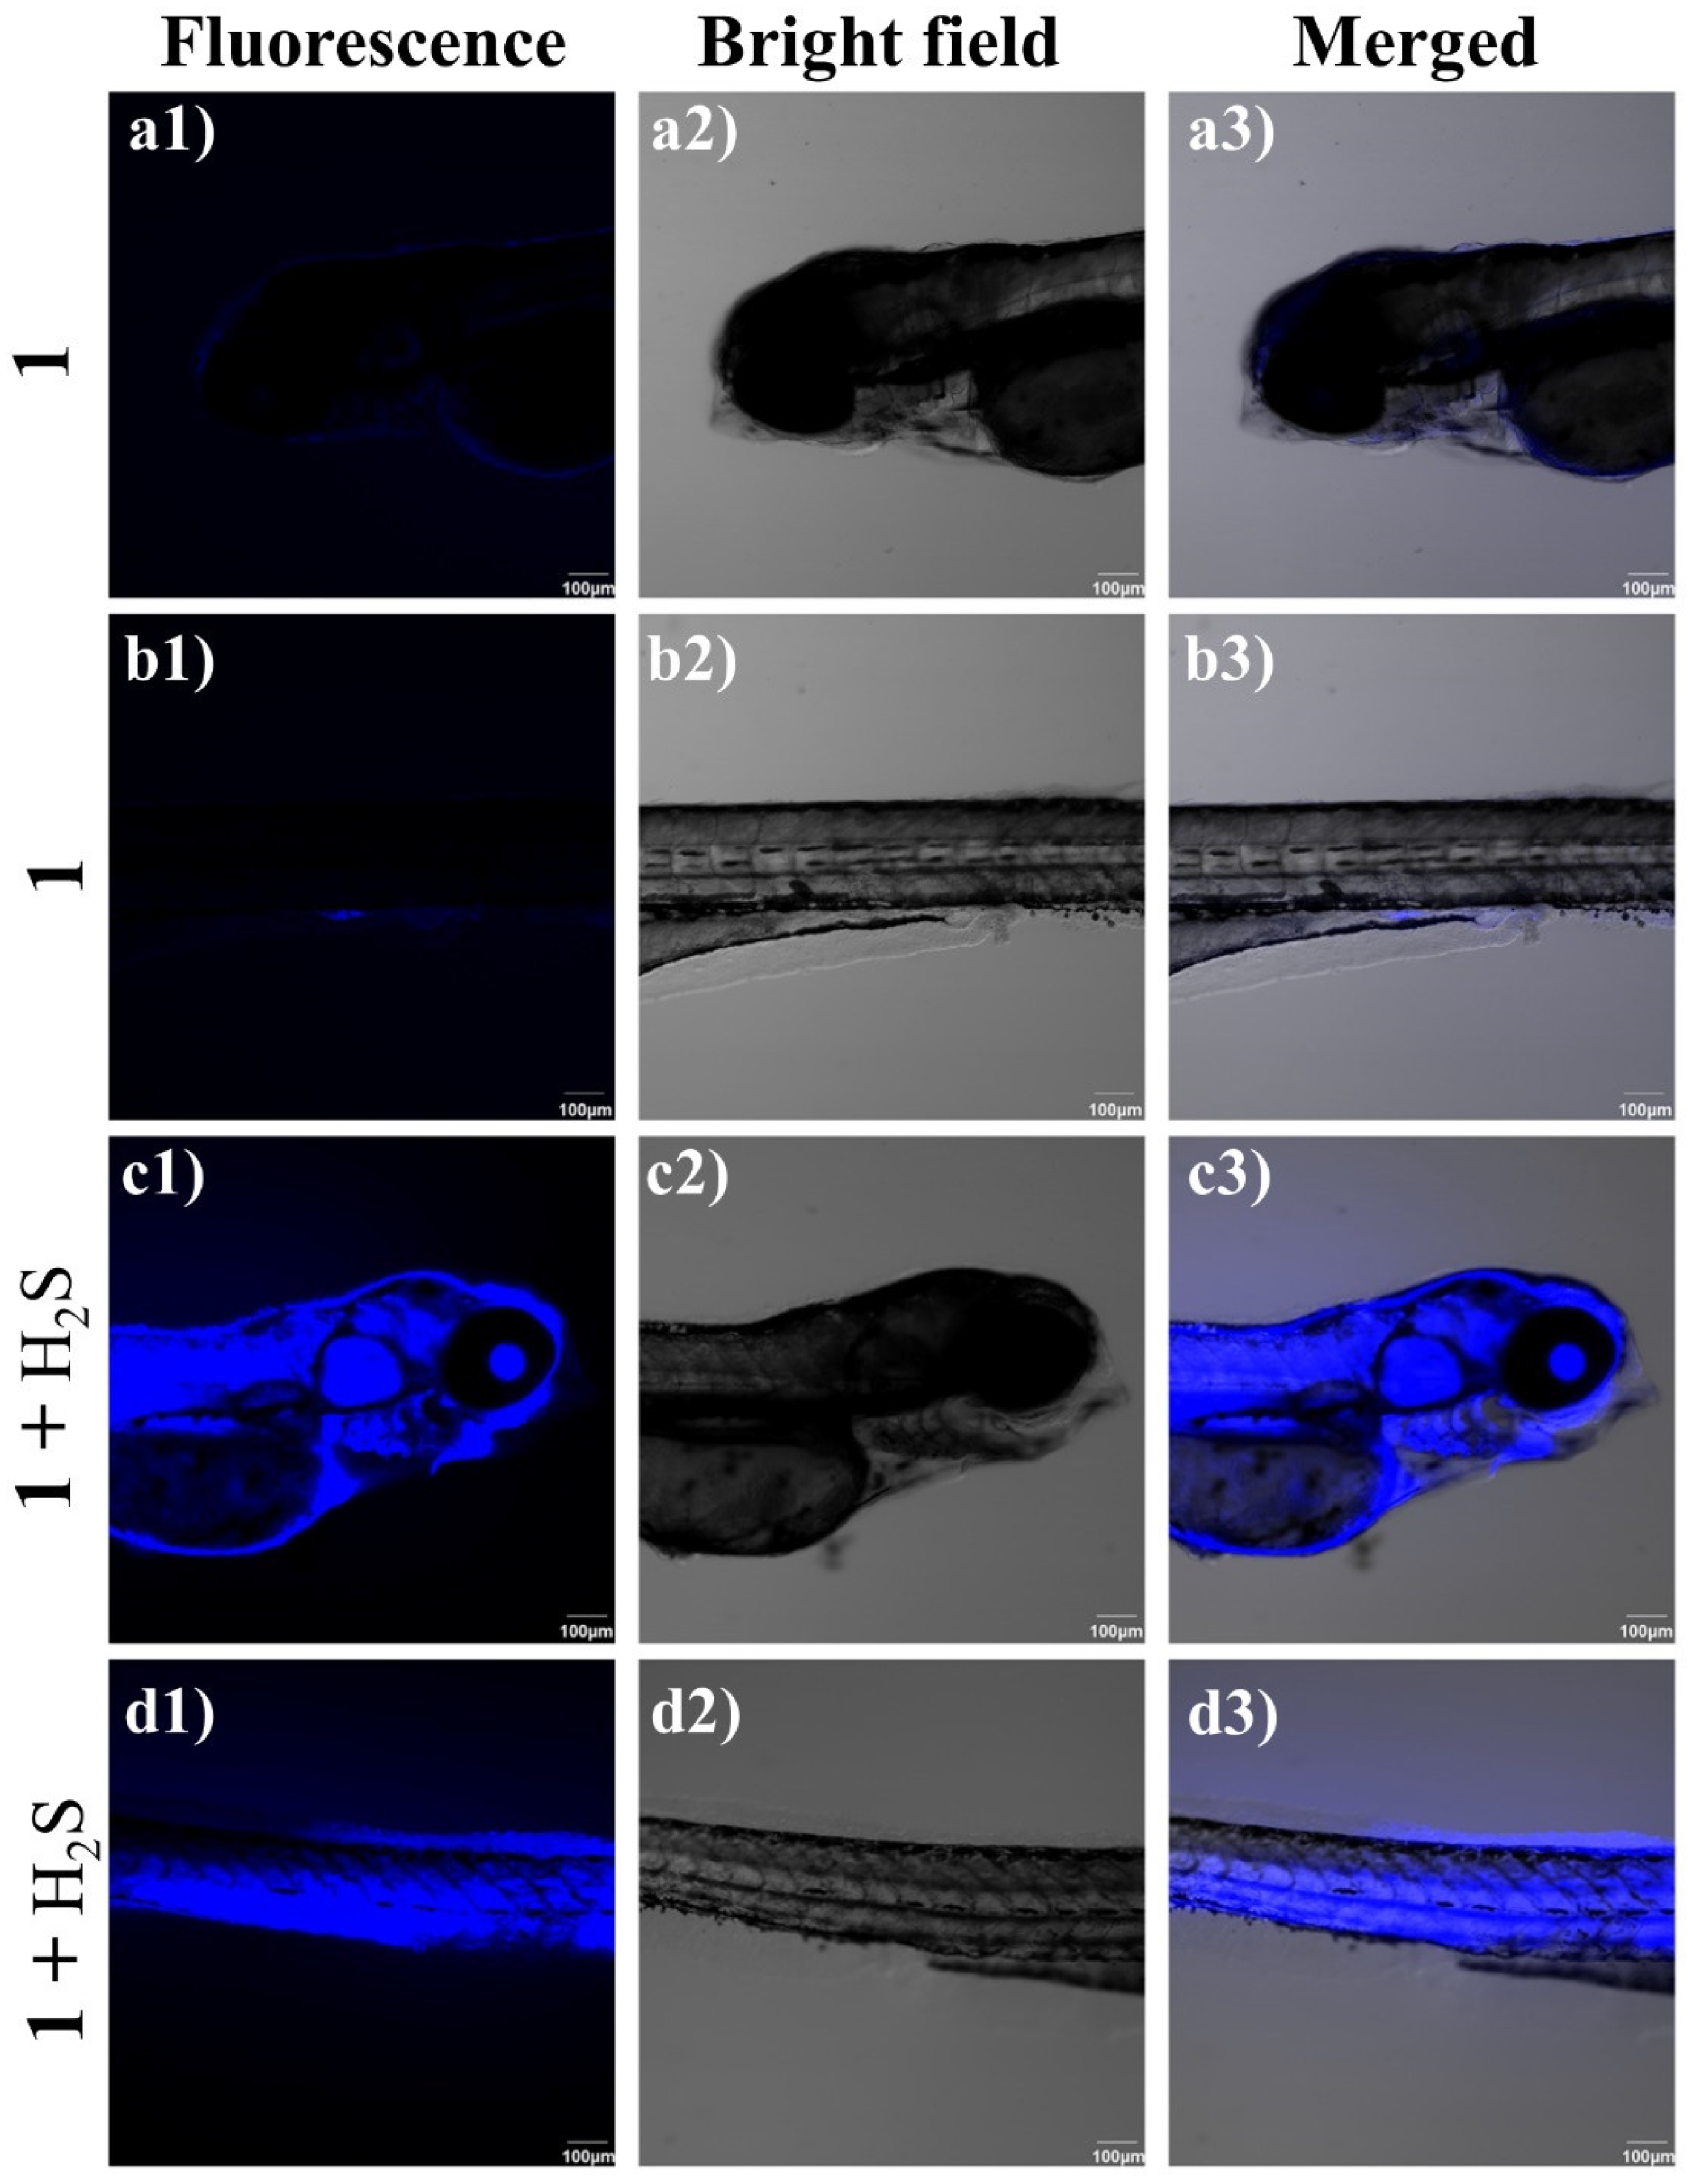
3.7. Imaging of H2S in Zebrafish by 1

Zebrafish are recognized as a significant vertebrate model for imitating human genetic illnesses owing to their unique advantages which include easy breeding, high homology with humans, rapid growth ability, specific translucent feature and facile operations. As a result, we also applied the probe to track H2S in living zebrafish. Three-day-old zebrafish were incubated in probe 1 (10 μM) for 30 min and then treated with H2S (100 μM) for another 30 min. These zebrafish were put onto a fresh confocal plate for imaging after being washed in PBS. As depicted in Figure 7, the zebrafish labeled with 1 displayed a very low fluorescence background. However, after additional incubation with H2S, the 1-labeled zebrafish showed a dramatically increased fluorescence intensity in the blue channel. These results demonstrated that our probe is capable of imaging exogenous H2S in a zebrafish model.

4. Conclusions

In summary, we have rationally designed and synthesized a umbelliferone-based fluorescent probe 1, which was composed of 3-cyanoumbelliferone as the push–pull fluorophore and a dinitrophenyl substituent as the response group. This probe showed impressive turn-on fluorescence recognition of H2S with excellent sensitivity and good selectivity, as well as a low detection limit. We ascribed the distinctive H2S-sensing mechanism to the nucleophilic aromatic substitution with H2S, resulting in the breaking of the ether bond between the dinitrophenyl group and umbelliferone framework and enabling a strong ICT process of 3-cyanoumbelliferone. Furthermore, the minimal cytotoxicity and good cell membrane penetrability allowed for in vivo visualization of H2S in MCF-7 cells and zebrafish. As a result, the probe might hold potential applications in the further investigation of H2S-related physiological and pathological processes.

Supplementary Materials

The following supporting information can be downloaded at: https://www.mdpi.com/article/10.3390/chemosensors10100427/s1, Figure S1: Figure S1 1H NMR spectrum (600 MHz, DMSO-d6) of 1 at 298 K. Figure S2: 13C NMR spectrum (151 MHz, CDCl3) of 1 at 298 K. Figure S3: ESI-HRMS spectrum of 1. Figure S4: ESI-HRMS spectrum of the mixture of 1 and H2S.

Author Contributions

Conceptualization, Y.F.; methodology, F.L.; validation, Y.F.; formal analysis, F.L. and Z.C.; resources, Y.F.; data curation, F.L. and Z.C.; writing—original draft preparation, Y.F.; writing—review and editing, C.P. and W.D.; supervision, C.P. and W.D.; project administration, C.P. and W.D.; funding acquisition, Y.F., C.P. and W.D. All authors have read and agreed to the published version of the manuscript.

Funding

This work was financially supported by the National Natural Science Foundation of China (No. 22007007, U19A2010, 81891012 and 81630101), Innovation Team and Talents Cultivation Program of National Administration of Traditional Chinese Medicine (ZYYCXTD-D-202209) and China Postdoctoral Science Foundation (No. 2022M710498) for financial support. Prof. Wim Dehaen acknowledges project financing from KU Leuven (grant number: C14/19/78).

Institutional Review Board Statement

Not applicable.

Informed Consent Statement

Not applicable.

Data Availability Statement

Not applicable.

Conflicts of Interest

The authors declare no conflict of interest.

References

  1. Aroca, A.; Gotor, C.; Bassham, D.C.; Romero, L.C. Hydrogen Sulfide: From a Toxic Molecule to a Key Molecule of Cell Life. Antioxidants 2020, 9, 621. [Google Scholar] [CrossRef] [PubMed]
  2. Szabo, C. Hydrogen Sulfide, an Endogenous Stimulator of Mitochondrial Function in Cancer Cells. Cells 2021, 10, 220. [Google Scholar] [CrossRef] [PubMed]
  3. Guo, J.; Li, G.; Yang, L. Role of H2S in pain: Growing evidences of mystification. Eur. J. Pharmacol. 2020, 883, 173322. [Google Scholar] [CrossRef] [PubMed]
  4. Kimura, H. Hydrogen Sulfide (H2S) and Polysulfide (H2Sn) Signaling: The First 25 Years. Biomolecules 2021, 11, 896. [Google Scholar] [CrossRef]
  5. Yang, N.; Liu, Y.; Li, T.; Tuo, Q. Role of Hydrogen Sulfide in Chronic Diseases. DNA Cell Biol. 2019, 39, 187–196. [Google Scholar] [CrossRef]
  6. Casin, K.M.; Calvert, J.W. Harnessing the Benefits of Endogenous Hydrogen Sulfide to Reduce Cardiovascular Disease. Antioxidants 2021, 10, 383. [Google Scholar] [CrossRef]
  7. Lefer, D.J. A new gaseous signaling molecule emerges: Cardioprotective role of hydrogen sulfide. Proc. Natl. Acad. Sci. USA 2007, 104, 17907–17908. [Google Scholar] [CrossRef] [Green Version]
  8. Han, Y.; Shang, Q.; Yao, J.; Ji, Y. Hydrogen sulfide: A gaseous signaling molecule modulates tissue homeostasis: Implications in ophthalmic diseases. Cell Death Dis. 2019, 10, 293. [Google Scholar] [CrossRef] [Green Version]
  9. Tan, B.H.; Wong, P.T.H.; Bian, J.-S. Hydrogen sulfide: A novel signaling molecule in the central nervous system. Neurochem. Int. 2010, 56, 3–10. [Google Scholar] [CrossRef]
  10. di Masi, A.; Ascenzi, P. H2S: A “Double face” molecule in health and disease. BioFactors 2013, 39, 186–196. [Google Scholar] [CrossRef]
  11. Sun, H.J.; Wu, Z.Y.; Nie, X.W.; Bian, J.S. Role of Endothelial Dysfunction in Cardiovascular Diseases: The Link between Inflammation and Hydrogen Sulfide. Front. Pharmacol. 2019, 10, 1568. [Google Scholar] [CrossRef] [Green Version]
  12. Quinzii, C.M.; Lopez, L.C. Abnormalities of hydrogen sulfide and glutathione pathways in mitochondrial dysfunction. J. Adv. Res. 2021, 27, 79–84. [Google Scholar] [CrossRef]
  13. Tamele, M.W.; Ryland, L.B.; McCoy, R.N. Simultaneous Determination of Hydrogen Sulfide and Mercaptans by Potentiometric Titration. Anal. Chem. 1960, 32, 1007–1011. [Google Scholar] [CrossRef]
  14. Ubuka, T.; Abe, T.; Kajikawa, R.; Morino, K. Determination of hydrogen sulfide and acid-labile sulfur in animal tissues by gas chromatography and ion chromatography. J. Chromatogr. B 2001, 757, 31–37. [Google Scholar] [CrossRef]
  15. Lee, J.; Lee, Y.J.; Ahn, Y.J.; Choi, S.; Lee, G.-J. A simple and facile paper-based colorimetric assay for detection of free hydrogen sulfide in prostate cancer cells. Sens. Actuators B Chem. 2018, 256, 828–834. [Google Scholar] [CrossRef]
  16. Xu, T.; Scafa, N.; Xu, L.-P.; Zhou, S.; Abdullah Al-Ghanem, K.; Mahboob, S.; Fugetsu, B.; Zhang, X. Electrochemical hydrogen sulfide biosensors. Analyst 2016, 141, 1185–1195. [Google Scholar] [CrossRef] [Green Version]
  17. Chen, Z.; Chen, G.; Lin, W.; Li, J.; Fang, L.; Wang, X.; Zhang, Y.; Chen, Y.; Lin, Z. Signal-On and Highly Sensitive Electrochemiluminescence Biosensor for Hydrogen Sulfide in Joint Fluid Based on Silver-Ion-Mediated Base Pairs and Hybridization Chain Reaction. Chemosensors 2022, 10, 250. [Google Scholar] [CrossRef]
  18. Xiao, P.; Liu, J.; Wang, Z.; Tao, F.; Yang, L.; Yuan, G.; Sun, W.; Zhang, X. A color turn-on fluorescent probe for real-time detection of hydrogen sulfide and identification of food spoilage. Chem. Commun. 2021, 57, 5012–5015. [Google Scholar] [CrossRef]
  19. Skorjanc, T.; Shetty, D.; Valant, M. Covalent Organic Polymers and Frameworks for Fluorescence-Based Sensors. ACS Sens. 2021, 6, 1461–1481. [Google Scholar] [CrossRef]
  20. Paganini, C.; Hettich, B.; Kopp, M.R.G.; Eördögh, A.; Capasso Palmiero, U.; Adamo, G.; Touzet, N.; Manno, M.; Bongiovanni, A.; Rivera-Fuentes, P.; et al. Rapid Characterization and Quantification of Extracellular Vesicles by Fluorescence-Based Microfluidic Diffusion Sizing. Adv. Healthc. Mater. 2022, 11, 2100021. [Google Scholar] [CrossRef]
  21. Jia, T.-T.; Li, Y.; Niu, H. Recent Progress in Fluorescent Probes for Diabetes Visualization and Drug Therapy. Chemosensors 2022, 10, 280. [Google Scholar] [CrossRef]
  22. Li, H.; An, Y.; Gao, J.; Yang, M.; Luo, J.; Li, X.; Lv, J.; Li, X.; Yuan, Z.; Ma, H. Recent Advances of Fluorescence Probes for Imaging of Ferroptosis Process. Chemosensors 2022, 10, 233. [Google Scholar] [CrossRef]
  23. Wu, L.; Sedgwick, A.C.; Sun, X.; Bull, S.D.; He, X.P.; James, T.D. Reaction-Based Fluorescent Probes for the Detection and Imaging of Reactive Oxygen, Nitrogen, and Sulfur Species. Acc. Chem. Res. 2019, 52, 2582–2597. [Google Scholar] [CrossRef] [Green Version]
  24. Wang, Y.; Nie, J.; Fang, W.; Yang, L.; Hu, Q.; Wang, Z.; Sun, J.Z.; Tang, B.Z. Sugar-Based Aggregation-Induced Emission Luminogens: Design, Structures, and Applications. Chem. Rev. 2020, 120, 4534–4577. [Google Scholar] [CrossRef]
  25. Huang, Y.; Chen, W.; Chung, J.; Yin, J.; Yoon, J. Recent progress in fluorescent probes for bacteria. Chem. Soc. Rev. 2021, 50, 7725–7744. [Google Scholar] [CrossRef]
  26. Liu, C.; Zhu, H.; Zhang, Y.; Su, M.; Liu, M.; Zhang, X.; Wang, X.; Rong, X.; Wang, K.; Li, X.; et al. Recent advances in Golgi-targeted small-molecule fluorescent probes. Coord. Chem. Rev. 2022, 462, 214504. [Google Scholar] [CrossRef]
  27. Fang, Y.; Dehaen, W. Small-molecule-based fluorescent probes for f-block metal ions: A new frontier in chemosensors. Coord. Chem. Rev. 2021, 427, 213524. [Google Scholar] [CrossRef]
  28. Fang, Y.; Dehaen, W. Fluorescent Probes for Selective Recognition of Hypobromous Acid: Achievements and Future Perspectives. Molecules 2021, 26, 363. [Google Scholar] [CrossRef]
  29. Li, H.; Fang, Y.; Yan, J.; Ren, X.; Zheng, C.; Wu, B.; Wang, S.; Li, Z.; Hua, H.; Wang, P.; et al. Small-molecule fluorescent probes for H2S detection: Advances and perspectives. TrAC Trends Anal. Chem. 2021, 134, 116117. [Google Scholar] [CrossRef]
  30. Park, S.Y.; Yoon, S.A.; Cha, Y.; Lee, M.H. Recent advances in fluorescent probes for cellular antioxidants: Detection of NADH, hNQO1, H2S, and other redox biomolecules. Coord. Chem. Rev. 2021, 428, 213613. [Google Scholar] [CrossRef]
  31. Wang, J.; Huo, F.; Yue, Y.; Yin, C. A review: Red/near-infrared (NIR) fluorescent probes based on nucleophilic reactions of H2S since 2015. Luminescence 2020, 35, 1156–1173. [Google Scholar] [CrossRef] [PubMed]
  32. Zhong, K.; Zhou, S.; Yan, X.; Li, X.; Hou, S.; Cheng, L.; Gao, X.; Tang, L. A simple H2S fluorescent probe with long wavelength emission: Application in water, wine, living cells and detection of H2S gas. Dye. Pigment. 2020, 174, 108049. [Google Scholar] [CrossRef]
  33. Niu, P.; Liu, J.; Rong, Y.; Liu, X.; Wei, L. A fluorescent probe for selective and instantaneous detection of hydrogen sulfide in living cells and zebrafish. Tetrahedron 2021, 89, 132174. [Google Scholar] [CrossRef]
  34. Saha, S.; Roy, P.K.; Maity, K.; Mandal, M.; Biradha, K. Comparative Study of Nitro- and Azide-Functionalized ZnII-Based Coordination Polymers (CPs) as Fluorescent Turn-On Probes for Rapid and Selective Detection of H2S in Living Cells. Chem. Eur. J. 2022, 28, e202103830. [Google Scholar] [CrossRef]
  35. Pal, D.; Saha, S. Coumarins: An Important Phytochemical with Therapeutic Potential. In Plant-Derived Bioactives: Chemistry and Mode of Action; Swamy, M.K., Ed.; Springer: Singapore, 2020; pp. 205–222. [Google Scholar]
  36. Cao, D.; Liu, Z.; Verwilst, P.; Koo, S.; Jangjili, P.; Kim, J.S.; Lin, W. Coumarin-Based Small-Molecule Fluorescent Chemosensors. Chem. Rev. 2019, 119, 10403–10519. [Google Scholar] [CrossRef]
  37. Gerasimova, E.; Gazizullina, E.; Radosteva, E.; Ivanova, A. Antioxidant and Antiradical Properties of Some Examples of Flavonoids and Coumarins—Potentiometric Studies. Chemosensors 2021, 9, 112. [Google Scholar] [CrossRef]
  38. Wang, W.; Zhao, H.; Zhao, B.; Liu, H.; Liu, Q.; Gao, Y. Highly Selective Recognition of Pyrophosphate by a Novel Coumarin-Iron(III) Complex and the Application in Living Cells. Chemosensors 2021, 9, 48. [Google Scholar] [CrossRef]
  39. Mazimba, O. Umbelliferone: Sources, chemistry and bioactivities review. Bull. Fac. Pharm. Cairo Univ. 2017, 55, 223–232. [Google Scholar] [CrossRef]
  40. Zheng, D.; Zhang, T.; Huang, Y.; Chen, H.; Li, Y.; Cao, Z.; Deng, Y.; Fang, Y.; Peng, C. Phenoxazine-conjugated-benzoeindolium as a novel mitochondria-targeted fluorescent probe for turn-on detection of sulfur dioxide and its derivatives in vivo. Microchem. J. 2022, 175, 107192. [Google Scholar] [CrossRef]
  41. Zheng, D.; Zhang, T.; Huang, J.; Wang, M.; Cao, Z.; Huang, Y.; Yang, Z.; Deng, Y.; Fang, Y. Indole-incorporated-benzoeindolium as a novel mitochondrial and ratiometric fluorescent probe for real-time tracking of SO2 derivatives in vivo and herb samples. Dye. Pigment. 2022, 198, 109973. [Google Scholar] [CrossRef]
  42. Wang, M.; Zhang, R.; Dehaen, W.; Fang, Y.; Qian, S.; Ren, Y.; Cheng, F.; Guo, Y.; Guo, C.; Li, Y.; et al. Specific recognition, intracellular assay and detoxification of fluorescent curcumin derivative for copper ions. J. Hazard. Mater. 2021, 420, 126490. [Google Scholar] [CrossRef]
  43. Fang, Y.; Deng, Y.; Dehaen, W. Tailoring pillararene-based receptors for specific metal ion binding: From recognition to supramolecular assembly. Coord. Chem. Rev. 2020, 415, 213313. [Google Scholar] [CrossRef]
  44. Fang, Y.; Wang, M.; Shen, Y.; Zhang, M.; Cao, Z.; Deng, Y. Highly sensitive and selective recognition behaviour for fluoride based on a homoditopic curcumin-difluoroboron receptor. Inorg. Chim. Acta 2020, 503, 119413. [Google Scholar] [CrossRef]
  45. Zhang, Y.; Deng, Y.; Ji, N.; Zhang, J.; Fan, C.; Ding, T.; Cao, Z.; Li, Y.; Fang, Y. A rationally designed flavone-based ESIPT fluorescent chemodosimeter for highly selective recognition towards fluoride and its application in live-cell imaging. Dye. Pigment. 2019, 166, 473–479. [Google Scholar] [CrossRef]
  46. Dhivya, R.; Kavitha, V.; Gomathi, A.; Keerthana, P.; Santhalakshmi, N.; Viswanathamurthi, P.; Haribabu, J. Dinitrobenzene ether reactive turn-on fluorescence probes for the selective detection of H2S. Anal. Methods 2022, 14, 58–66. [Google Scholar] [CrossRef]
  47. Li, B.; Mei, H.; Wang, M.; Gu, X.; Hao, J.; Xie, X.; Xu, K. A near-infrared fluorescent probe for imaging of endogenous hydrogen sulfide in living cells and mice. Dye. Pigment. 2021, 189, 109231. [Google Scholar] [CrossRef]
  48. Ge, C.; Li, J.; Liu, L.; Liu, H.K.; Qian, Y. A self-immolated fluorogenic agent triggered by H2S exhibiting potential anti-glioblastoma activity. Analyst 2021, 146, 3510–3515. [Google Scholar] [CrossRef]
Scheme 1. (a) Synthetic route of the umbelliferone-based fluorescent probe 1, and (b) its proposed recognition mechanism with H2S.
Chemosensors 10 00427 sch001
Figure 1. Absorption spectra of 1 (10 μM) treated with various analytes (10 equiv.) in CH3CN. The inset was the corresponding color change of 1 following the addition of H2S under visible light.
Chemosensors 10 00427 g001
Figure 2. Fluorescence emission spectra of 1 (10 μM) treated with various analytes (10 equiv.) in H2O-CH3CN (1:1, v/v, 10 mM PBS, pH = 7.40) mixed aqueous medium (λex = 413 nm, slit = 10 nm/10 nm). The inset was the corresponding color change of 1 following the addition of H2S under UV light (365 nm).
Chemosensors 10 00427 g002
Figure 3. (a) Time-dependent fluorescence intensity of 1 at 455 nm in the presence of 10 equiv. of H2S in H2O-CH3CN (1:1, v/v, 10 mM PBS, pH = 7.40) mixed aqueous medium (λex = 413 nm, slit = 10 nm/10 nm). (b) pH-dependent fluorescence intensity of 1 at 455 nm followed by the addition of 10 equiv. of H2S in H2O-CH3CN (sodium hydroxide and hydrochloric acid were used to modulate the pH values).
Chemosensors 10 00427 g003
Figure 4. (a) Fluorescence intensity at 455 nm of 1 (10 μM) treated with 100 equiv. of various species (black bar) followed by the addition of 10 equiv. of H2S (red bad) in the H2O-CH3CN (1:1, v/v, 10 mM PBS, pH = 7.40) (1: 1 + Ser; 2: 1 + Ser + H2S; 3: 1 + Met; 4: 1 + Met + H2S; 5: 1 + Leu; 6: 1 + Leu + H2S; 7: 1 + Gly; 8: 1 + Gly + H2S; 9: 1 + NH4+; 10: 1 + NH4+ + H2S; 11: 1 + HSO3-; 12: 1 + HSO3- + H2S; 13: 1 + CO32-; 14: 1 + CO32- + H2S; 15: 1 + Ac-; 16: 1 + Ac- + H2S; 17: 1 + Br-; 18: 1 + Br- + H2S; 19: 1 + Cl-; 20: 1 + Cl- + H2S; 21: 1 + F-; 22: 1 + F- + H2S; 23: 1 + H2PO4-; 24: 1 + H2PO4- + H2S; 25: 1 + SO42-; 26: 1 + SO42- + H2S; 27: 1 + NO3-; 28: 1 + NO3- + H2S; 29: 1 + Mg2+; 30: 1 + Mg2+ + H2S; 31: 1 + Al3+; 32: 1 + Al3+ + H2S;). (b) Linear correlation between the fluorescence intensity at 455 nm of 1 and the concentration of H2S in the range of 3.0–9.0 μM.
Chemosensors 10 00427 g004
Figure 5. Cytotoxicity assays of MCF-7 and H460 cells incubated with different concentrations of 1 (0.03–10 μM).
Chemosensors 10 00427 g005
Figure 6. (ac) Confocal fluorescence images of MCF-7 cells incubated with probe 1 (10 μM) for 30 min, and then (df) subsequently incubated with H2S (100 μM) for another 30 min (scale bar = 10 μm).
Chemosensors 10 00427 g006
Figure 7. Confocal images of H2S in zebrafish. Zebrafish were fed with probe 1 (10 μM) and cultured for 30 min (a1a3, b1b3), followed by incubation with H2S for another 30 min (c1c3, d1d3).
Chemosensors 10 00427 g007
Publisher’s Note: MDPI stays neutral with regard to jurisdictional claims in published maps and institutional affiliations.

