Abstract
Cell analysis at the single-cell level is of great importance to investigate the inherent heterogeneity of cell populations and to understand the morphology, composition, and function of individual cells. With the continuous innovation of analytical techniques and methods, single-cell analysis on microfluidic chip systems has been extensively applied for its precise single-cell manipulation and sensitive signal response integrated with various detection techniques, such as optical, electrical, and mass spectrometric analyses. In this review, we focus on the specific optical events in single-cell analysis on a microfluidic chip system. First, the four most commonly applied optical technologies, i.e., fluorescence, surface-enhanced Raman spectroscopy, surface plasmon resonance, and interferometry, are briefly introduced. Then, we focus on the recent applications of the abovementioned optical technologies integrated with a microfluidic chip system for single-cell analysis. Finally, future directions of optical technologies for single-cell analysis on microfluidic chip systems are predicted.
1. Introduction
Single cells are the fundamental components of organism, representing the complexity and factuality of life systems [1,2,3,4,5]. Studying cells at individual level is intuitive and effective to investigate cell behavior and function. However, analysis of one true cell is difficult due to the ultra-small size of cells [6,7]. Indeed, limited by the development of instruments and equipment for a long time, the vast majority of cell studies have depended on the averages of cell ensembles based on the assumption of underlying normal distributions, which often mask the information available to identify the morphology and composition of individual cells [8]. With the in-depth study of cells, as well as many experimental examples, the heterogeneities between individual cells have been gradually unveiled [9,10,11]. Therefore, progress in cell analysis at the single-cell level can solve the problems arising from the heterogeneity of cells in physiological processes, such as metabolism, breeding mechanisms, signal transduction, etc. [12]. In the last couple of years, interest in exploiting platforms that can directly study single biological cells has increased dramatically. With the continuous innovation of analytical techniques and methods, researchers have put forward intelligent approaches to overcome the challenge of obtaining and measuring individual cells, which include cell isolation or sorting programs integrated with innovative analytical tools [13,14,15].
As microfabrication technologies have become more advanced and accessible in recent decades, microfluidic chips have become the most ideal devices for single-cell analysis. These miniaturized devices can precisely manipulate single cells of picoliter-scale volumes, enable the integration of necessary multistep single-cell handling processes, and shorten the operating time [16,17,18]. On microfluidic devices, single-cell manipulation processing (such as culturing, trapping, sorting, selecting, and isolating) and analysis (including chemical and biological content analysis, dynamic response, signal transduction pathways, etc.) can be achieved because the chip architecture can be designed flexibly, and accurate fluid control can be obtained through well-designed fluid characteristics [19,20,21]. Moreover, microfluidic devices can be easily implemented in combination with a variety of analytical devices for single-cell analysis with good sensitivity and reproducibility [22,23,24,25]. As three of the most common detection methods, optical, electrochemical, and mass spectrometric techniques have been widely applied for cell analysis and integrated with microfluidic systems [26,27,28,29]. Significantly, optical methods are hugely popular for single-cell analysis because of their ability to directly visualize the response process in cells using super-resolution microscopy, as well as to realize single-cell analysis in a label-free manner [30,31].
A number of reviews have summarized the fabrication of microchips [32,33]. Single-cell manipulation and isolation on microfluidic chips with techniques including hydrodynamic cell traps, optical traps, electrical traps, droplets, microwells, integrated valve traps, etc., have been introduced in depth [34,35]. Single-cell detection techniques can be divided into three categories, i.e., optical, electrical, and mass spectrometric methods, which have also been reviewed [36,37]. Thus, in this review, the structures and functions of microfluidic chip designs are not presented. Instead, we focus on specific optical detection reports of single-cell analysis on microfluidic chip systems in recent years. The four most commonly applied optical technologies, i.e., fluorescence, surface-enhanced Raman spectroscopy (SERS), surface plasmon resonance (SPR), and interferometry, are first introduced briefly. Then, we focus on recent applications of the four abovementioned optical technologies integrated with microfluidic chip systems for single-cell analysis. Finally, future directions of optical technologies for single-cell analysis on microfluidic chip systems are predicted.
2. Optical Technologies
2.1. Fluorescence Technique
Fluorescence is the photoluminescent phenomenon of a particular substance irradiated by a certain excitation wavelength and immediately de-excited by emitting a characteristic spectrum [38]. These particular substances are usually called fluorescent dyes or fluorophores and are used as signal unit of fluorescence sensors for biological and chemical sensing, imaging, medical diagnosis, etc. As one of the most important optical methods, the fluorescence technique has been favored by researchers due to its simplicity, high sensitivity, and the multifarious commercially available wide-spectrum fluorescent probes. Light-emitting diodes (LEDs), mercury lamps, and lasers are the most common excitation light sources for fluorescent sensors. Charge-coupled detectors (CCDs), photomultiplier tubes (PMTs), and spectrometers are the main detectors used to collect emission signals and translate them into an electrical output or a microscopic image. As the fluorescence principle has been deeply understood by researchers, an increasing number of fluorescence imaging techniques, such as wide-field fluorescence imaging, laser confocal imaging, and fluorescence lifetime imaging, have been developed. Through fluorescence imaging, multiple fluorescence signals can be simultaneous obtained to offer different information about the concentration and distribution of bioactive molecules [39]. Oleksiievets et al. [40] combined the technique of DNA point accumulation for imaging in nanoscale topography (DNA-PAINT) with wide-field fluorescence lifetime imaging or confocal laser scanning (CLS) imaging to simultaneously image three targets in a cell (Figure 1A). In the field of microfluidic chip systems, fluorescence imaging methods have also been widely used for single-cell analysis, as there are no special processing requirements with the chips [41,42]. Furthermore, fluorescence imaging enables direct visualization of the response process in cellular systems via super-resolution microscopy. Araki et al. [43] observed vertical sections of live epithelial cells by fluorescence imaging on a simple microfluidic device (Figure 1B). In this assay, an epithelial cell line that forms a two-dimensional (2D) sheet was cultured to adhere to the vertical side wall so that its vertical section could be directly imaged using ordinal inverted-type laser scanning microscopy, and the detailed distribution of the intercellular apparatus (claudin and zonula occludens) and intracellular organelles (microtubules and mitochondria) was imaged with high spatiotemporal resolution with a single scan. Ren et al. [44] presented a non-destructive method to quantify nuclear and cytoplasmic elasticity through fluorescence imaging at single-cell resolution on a microfluidics system. This microfluidic chip included two arrays of pressure-level microchannels to drive two different kinds of cell lines. The physical properties of the intracellular nucleus and cytoplasm were non-destructively quantified by calculating cell deformation along the confining microchannel according to the immunofluorescence signal.
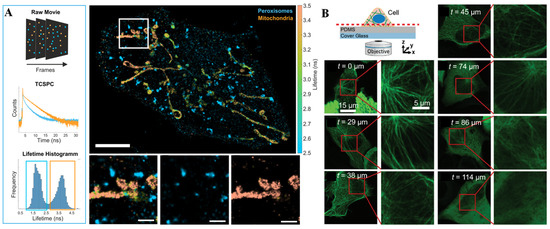
Figure 1.
Fluorescence technique and applications. (A) Multiplexed imaging of a fixed cell in nanoscale topography by fluorescence lifetime imaging. Reprinted with permission from ref. [40], Copyright 2022 Springer Nature. (B) Overview of the sensing device and example images of fluorescent microtubules obtained through laser scanning microscopy on a PDMS layer with various thicknesses. Reprinted with permission from ref. [43], Copyright 2020, Royal Society of Chemistry.
2.2. SERS Technique
Raman scattering is another common optical phenomenon that has a high sensitivity and causes less photobleaching compared with fluorescence. When a molecule irradiated by an incident light that may be absorbed, scattered, or passed straight through and the photon energy does not match to the energy gap between the ground state and the excited state of the molecule, inelastic scattering of the photon occurs [45]. Raman spectroscopy has an advantage, as it can achieve non-destructive measurement of almost all optically accessible samples without a sample pretreatment process. However, for a long time, the lower sensitivity of Raman scattering due to the poor efficiency of the inelastic scattering process inhibited its wide application—until the advent of SERS technology, which overcome the aforementioned limitation. In SERS, the scattering signal of molecules located near nanometric metallic structures can be significantly enhanced by more than a million times [46]. Over the past 40 years, SERS has evolved into a simple but efficient technique for ultrasensitive identification of analytes in various complex samples [47]. The implementation of SERS on microfluidic chips is popular, as high repeatability and stability can be obtained by this integrated platform. Li et al. [48] designed a microfluidic SERS biosensor that can monitor the release of dopamine from living cells in situ with ultra-high sensitivity and reliability (Figure 2A). SERS probes were formed by Ag nanoparticles (AgNPs) in combination with 5,5′-Dithiobis-(2-nitrobenzoic acid) (DTNB, acting as a Raman reporter) and dopamine aptamers. In addition, AgNPs labeled with dopamine aptamer-complementary DNA strands were self-assembled on a glass slide through electrostatic force. When the electrostatic repulsion and the base pairing between the abovementioned AgNPs and SERS probes achieved equilibrium, the DNA-assisted synthesis of zipper-like orthonanodimers (DaSON) was achieved. The DaSON-based SERS sensor was decorated onto a microfluidic chip containing a cell culture unit, as well as a detection unit, so in situ monitoring of dopamine release from living PC12 cells could be realized by SERS signals. Recently, using a SERS-integrated microfluidic chip, Zhang et al. [49] realized the 2D profiling of tumor chemotactic and molecular phenotypes at the single-cell level. In this assay, the chemotactic properties of individual cancer cells were estimated by cellular migratory behavior in the microfluidic channel. Multiplex SERS probes were synthesized by gold@silver core-shell nanoparticles (Au@Ag REPs) decorated with a Raman reporter and the DNA aptamers targeting various phenotype surface proteins. These synthesized SERS probes can monitor the protein expression of single tumor cells by different SERS signals in the microfluidic channel (Figure 2B).
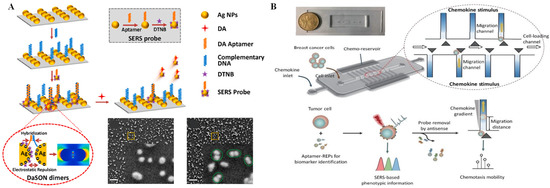
Figure 2.
SERS technique and applications. (A) Schematic diagram and SEM images of dopamine detection based on SERS sensors. Reprinted with permission from ref. [48], Copyright 2021, Elsevier B. V. (B) Schematic of the chip design and the working principle of on-chip 2D phenotype profiling of tumor cells. Reprinted with permission from ref. [49], Copyright 2022, Tsinghua University Press.
2.3. SPR Technique
In the past few decades, metal nanostructures have attracted broad attention due to their fascinating SPR properties [50]. SPR is excited by the interaction between an electromagnetic wave and the conduction electrons at the interface of metal/dielectric nanomaterials called “plasmons” [51]. Plasmons are collective oscillations of free electrons in which a negatively charged electron cloud is coherently displaced from its equilibrium position around a positively charged ion lattice. There are two main types of SPR: propagating SPR and localized SPR (LSPR) [52]. In the propagating SPR model, light with a high angle of incidence couples most efficiently with free electron gas, and the metal/dielectric surface is up to hundreds of micrometers. In contrast to propagating SPR, LSPR involves non-propagating excitations of plasmons in nanoparticles with a size much smaller than the photon wavelength. Both SPR and LSPR have received a great deal of attention in cellular analysis applications. Han et al. [53] utilized a microfluidic device to partition a SPR microscopy substrate into two closely spaced channels, one channel with poly-L-lysine deposited onto a preformed polyethylene glycol (PEG) self-assembled monolayer for cell immobilization and the other channel remaining PEG-covered for reference. Through this device, the binding interactions between wheat germ agglutinin and glycan on HFF cells were investigated, and the cell-to-cell variations of the kinetic parameters following a Gaussian distribution were also demonstrated. A hyperspectral surface plasmon resonance microscopy (HSPRM) system was recently reported by optically connecting a prism-based SPR sensor to a hyperspectral microscope through an imaging lens and a mirror (Figure 3A) [54]. HSPRM was demonstrated as an innovative breakthrough in SPR sensor technology, as the use of a hyperspectral microscope can magnify the selected region of interest in the SPR image for spatially resolved quantitative analysis, such as for quantification of monolayer graphene thickness distribution, inhomogeneous protein adsorption, single-cell adhesion, etc. In addition, LSPR biosensors are powerful tools for cell identification, as well as analysis of cell biological behavior and chemical composition [55]. For example, a flexible LSPR biosensor was designed by integrating a PDMS substrate with metal-insulator-metal (MIM) nanodisks [56]. As shown in Figure 3B, through investigation of the different geometries of MIM nanodisk, a flexible MIM-disk LSPR refractive index sensor with an enhanced spatial overlap of LSPR waves was decorated in the chamber of a PDMS microfluidic chip. With this integrated biosensor, A549 cancer cells could be sensitively detected based on the obviously red-shifted absorption peak of the MIM-disk LSPR sensor.
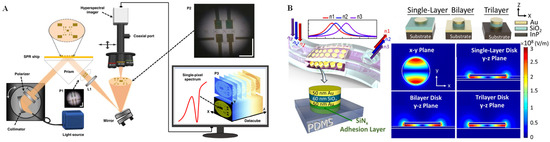
Figure 3.
SPR technique and applications. (A) Schematic diagram of the HSPRM system. Reprinted with permission from ref. [54], Copyright 2022, Nature communications. (B) Schematic of the MIM-disk LSPR refractive index sensor embedded in a flexible PDMS chip and the electric field mode profile with a different plane of this sensor. Reprinted with permission from ref. [56], Copyright 2018 Springer Nature.
2.4. Interferometry Technique
Interferometry was first demonstrated to be a vital optical measurement technique in the 1980s [57]. As evidenced by the widely used Mach-Zehnder (M-Z) and Michelson interferometers, the interferometry technique has become increasingly mature over the decades [58,59]. Additionally, interferometry microscopes with laser illumination sources and the white-light illumination sources have been rapidly developed. Regardless of the type of interference technique, the basic principle is that two coherent reference beams pass through optical paths with uneven distances by phase shift caused by a refractive index (RI) change in the waveguide medium. During this process, the invisible phase information can be converted into an interferogram, which can be directly obtained through a traditional imaging system [60]. Because RI is a significant physical property of substances and is sensitive to environmental conditions, interferometry-based sensors can be built for biochemical analysis by monitoring the changing interference intensity or pattern. Hou et al. [61] designed an M-Z interferometric optical system using multiphoton lithography for protein biomacromolecule monitoring. A complex 3D configuration design and arduous mesoscopic manufacturing at the nanoscale were required for this system. As shown in Figure 4A, on the femtosecond laser processing system, the input light was divided into two identical signals by a beam splitter, which were then transmitted through the two transmission arms and finally merged together at the beam combiner. Because the phase of the optical signal in each transmission arm could be changed, the output light intensity would be changed due to the phase difference between the two arms. In this way, the stimulus-responsive shrinking/swelling features of biomacromolecules and their formed gels could be studied. Owing to its label-free means of detection, this technique for interferometry-based biological and chemical sensing can be of great use for single-cell analysis. In recent decades, emerging quantitative phase imaging platforms with high imaging resolution, as well as high spatial and temporal resolution, have enabled label-free dynamics analysis of single cells. For example, waveguide chips have been integrated with the quantitative phase microscopy to explore changes in red blood cells during planar trapping and propulsion (Figure 4B) [62]. Through interferometric image acquisition, reconstruction, and quantitative analysis of the changes in phase values before and after planar cell trapping, the mechanical effects of cells can be explored. Although in previous studies, bright-field microscopy was often applied for the investigation of red blood cell deformation, this method cannot offer any quantitative information. By combining the advantages of waveguide trapping and quantitative phase microscopy, label-free imaging, as well as quantitative phase differences analysis, of red blood cells was realized.
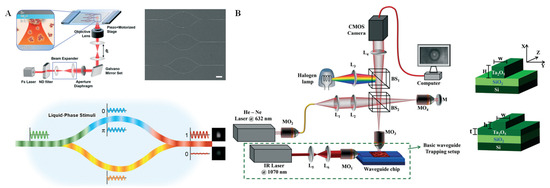
Figure 4.
Interferometry technique and applications. (A) Beam path diagram of the M-Z interferometric and the chemical sensing process of a protein hydrogel by liquid-phase stimuli. Reprinted with permission from ref. [61], Copyright 2020, Royal Society of Chemistry. (B) Schematic of the phase imaging flow of single cells by a microwave interferometric system on a chip, with strip and rib optical waveguide geometries. Reprinted with permission from ref. [62], Copyright 2018, Royal Society of Chemistry.
3. Optical Technologies for Single-Cell Analysis on Microchips
3.1. Fluorescence Technique for Single-Cell Analysis on Microchips
In wide-field fluorescence microscopy, a parallel beam produced by a single-wavelength mercury lamp or LED excites target fluorophores in the sample. Wide-field fluorescence imaging has been widely used for single-cell analysis due to its advantages including simple external connection equipment, convenient operation, and low price. Because single-cell signaling is a dynamic process that responds, in particular, to the complex extracellular microenvironment, it is challenging to simulate the complex extracellular microenvironment and capture single-cell dynamic signaling in real time. In recent years, efforts have been made by our group to probe dynamic signaling of single cells on a microfluidic chip system coupled with a CCD fluorescence imaging system. For example, a dynamic microfluidic cytometry method that combines the advantages of flow cytometry, microfluidic, and fluorescence microscopy was designed to realize cyclical cell trapping, stimulation, and automatic release [63]. On this integrated platform, G protein-coupled receptor signaling can be captured with high-throughput at single-cell resolution. Additionally, in order to simulate the complicated extracellular microenvironment and capture single-cell dynamic signaling with high efficiency, we designed a multichannel synchronous hydrodynamic gating device equipped with a concentration gradient generator [64]. The system consists of a microfluidic chip, two independent E/P transducers, a pressure control module, and a mercury lamp excited CCD fluorescence imaging module (Figure 5A). The microfluidic chip includes cell culture channels, hydrodynamic gate channels, and concentration gradient channels, on which multiple parallel experiments can be conducted using different combinations of amplitudes and frequencies to probe adenosine triphosphate (ATP) and histamine (HA) response in single HeLa cells. Feng et al. [65] also investigated dynamic calcium signal transmission between a pair of single cells by designing an open microfluidic probe connected with a tumor microtube (TM) structure. As shown in Figure 5B, the integrated system comprised an open microfluidic probe for in situ stimulation and a cell imaging platform for signal transmission observation; on this integrated platform, in situ regional stimulation on the single cell could be achieved without a complex cell capture process via the laminar flow effect in a stable flow region. As demonstrated, the signal transmission via TM structure, the heterogeneity of intercellular depolarization response, and the relationship between depolarization and opposite motion on tumor cells were explored in this assay. Because signaling pathways are related to cell growth, proliferation, and apoptosis, analysis of the cell signaling pathways is important in biochemical and cell biology. Lee et al. [66] studied the dynamics of yeast mitogen-activated protein kinase (MAPK) signaling pathways and their crosstalk using a microfluidic device coupled with quantitative microscopy. On this integrated platform, single yeast cells were trapped in a single focal plane, and the magnitudes of a given stress signal were modulated by microfluidic serial dilution while keeping other signaling inputs constant. With this device and single-cell analysis of microscopy images, concentration-dependent bimodal gene expression induced by osmotic stress was confirmed, and the crosstalk between the pheromone and cell wall integrity signaling pathways was quantified.
Compared with wide-field fluorescence microscopy, confocal laser scanning microscopy (CLSM) is inherently more complex and expensive. The greatest advantage of CLSM is the ability to obtain high-resolution fluorescence images, even revealing subcellular details, which is difficult using general optical microscopy. With confocal laser imaging, optical sectioning into the depth of a fluorescent sample or 3D tissue model can be achieved by collecting the light from a single focus plane. In recent years, CLSM coupled with microfluidic systems has been widely used for cell imaging. Pratt et al. [67] fabricated a drop-based microfluidic device coupled with CLSM to study the physiology of single microbial cells and to recognize the physiological differences of cells from a larger population with high throughput. As shown in Figure 5C, single cells were isolated into water-in-oil drops from a population with a 15 µm PDMS flow-focusing microfluidic drop-making device. The drops were arranged as a packed monolayer inside the PDMS microfluidic device, which enabled the maintenance of the drop position and volume during extended timelapse imaging. Using this strategy, the heterogeneity in growth rate and lag time of a large number of cells could be quantified. In addition, optofluidic scanning microscopy has been developed for live cell imaging with super-high resolution [68]. In this system, by taking advantage of the multi-focal excitation using the innate fluidic motion of the specimens, minimal instrumental complexity and full compatibility with various microfluidic configurations can be realized.

Figure 5.
Fluorescence technique for single-cell analysis on microchips. (A) Schematic overview of the experimental setup and the microfluidic channel structure for cell dynamic signaling through a stimulation phase and relaxation phase. Reprinted with permission from ref. [64], Copyright 2020 American Chemical Society. (B) Schematic diagram describing cell culture, calcium signaling, single-cell stimulation, signal transmission, and communication on the microfluidic platform. Reprinted with permission from ref. [65], Copyright 2022, Elsevier B. V. (C) Schematic overview of drop stabilization on the chip and physiological study of single microbial cells by CLSM. Reprinted with permission from ref. [67], Copyright 2019 Pratt, Zath, Akiyama, Williamson, Franklin and Chang. (D) Overview of the antibody kinetic analysis procedure by variable fluorescence decay time monitoring on a microfluidic chip integrated with a confocal scanner microscope. Reprinted with permission from ref. [69], Copyright 2022 American Chemical Society.

Fluorescence lifetime imaging (FLI), which is dependent of the intrinsic excited-state lifetime property of a fluorophore other than fluorescence intensity or local fluorophore concentration, has become an increasingly popular subject in the scientific research field in recent years. FLI microscopy can be implemented using wide-field microscopic or a laser scanning microscopic imaging modalities, and it has been actively explored for single-cell identification and kinetics analysis. Recently, Mathur et al. [69] used laser-excited FLI with open-space microfluidics to quantify spatially localized antibody binding kinetics on various biological substrates (such as cell/cells and tissues). As shown in Figure 5D, the surface protein of the biological substrate has no associated lifetime, as it is not labeled. Accordingly, by monitoring the change in the component yield or amplitude in lifetime contribution, the proportion of the bound antibody can be tracked, and a kinetic curve can be rebuilt. In this way, p53 kinetics with differential biomarker expression in ovarian cancer tissue sections can be directly measured. Furthermore, using FLI microscopy, Lee et al. [70] developed a fast and label-free recognition platform for individual leukemia cells from blood in a high-density microfluidic trapping array. Two parts are contained in this single-cell leukemia recognition platform: a microfluidic chip that consists of hydrodynamic filters and a single-cell trap array and an FLI microscope coupled with a computer. Because the expression of the reduced form of nicotinamide adenine dinucleotide (NADH) in leukemia cells is different from that in normal white blood cells and different forms of NADH have unique lifetimes independent of their concentration, single leukemia cells can be indirectly recognized by quantification of variations between free/bound NADH through real-time monitoring of FLI microscopy images and a phasor algorithm approach.
3.2. SERS Technique for Single-Cell Analysis on Microchips
Droplet technologies have long been popular for widespread applications on microfluidics platforms [71]. Droplet microfluidics can quickly and simply encapsulate single cells in monodisperse microcapsules by oil phase shear of the aqueous phase, offering a perfect microreactor for single-cell analysis. Therefore, this technique is especially favored for single-cell isolation and analysis in combination with various analysis techniques [72]. For example, the integration of droplet microfluidics and SERS provides a promising way to realize single-cell component analysis with high sensitivity and good reproducibility. In this integration, the aggregation time and the mixing degree of metallic nanoparticles can be controlled through a designable microfluidic channel structure and adjustable liquid flow rate. Using the SERS integrated microfluidic droplet method, Sun et al. [73] identified cell-to-cell heterogeneity by ultrasensitive analysis of single-cell alkaline phosphatase (ALP) activity. As a crucial disease biomarker, ALP is a zinc-doped glycoprotein that can dephosphorylate substrates containing phosphate groups. As shown in Figure 6A, 5-bromo-4-chloro-3-indolyl phosphate (BCIP) was selected as a substrate to be hydrolyzed by ALP and oxidized by oxygen to form SERS-active 5,5′-dibromo 4,4′-dichloro-1H,1H-[2,2′]biindolylidene-3,3′-dione (BCI). On the microfluidic platform, BCIP, AuNPs, and HepG2 cells were encapsulated in individual droplets. After collecting and incubating the droplets, BCI forms in the presence of ALP expression progress, and the droplets containing the BCI can be identified by detecting a strong SERS signal. In addition to ALP, telomerase is another important biomarker. Recently, a fluorescence dual-channel microfluidic droplet platform was integrated with SERS for in situ detection of telomerase activity with high sensitivity at single-cell resolution [74]. In this assay, a telomerase primer and Cy5-labeled complementary strand were modified onto AuNP surfaces. When the primer sequences were extended in the presence of the active telomerase, the Cy5-labeled strand was removed, resulting in turn-on fluorescence, as well as turn-off SERS, thus realizing the detection of telomerase activity in dual-channel mode. Using plasmonic imaging and a SERS dual-channel microfluidic droplet system, Cong et al. [75] detected a cancer biomarker, sialic acid (SA), in a single living cell level (Figure 6B). In this system, a multi-functional plasmonic probe was performed by modification of 4-mercaptophenylboronic acid (MPBA, which can recognize SA and serves as a Raman reporter) on the surface of AgNPs. SA expression on single cells can be explored by SERS spectroscopy, as well as plasmonic energy loss imaging.
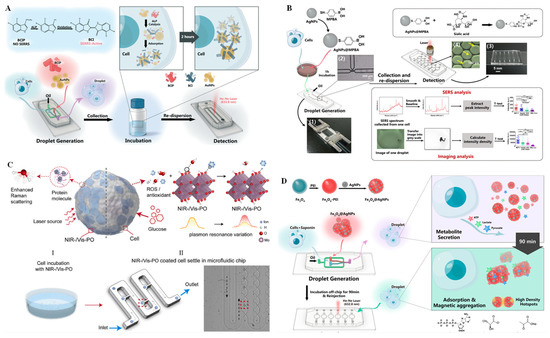
Figure 6.
SERS technique for single-cell analysis on microchips. (A) Schematic diagram of droplet generation for single-cell encapsulation and an SERRS-based sensor for single-cell ALP activity analysis on a microfluidic chip. Reprinted with permission from ref. [73], Copyright 2019, Royal Society of Chemistry. (B) Schematic overview of a microfluidic droplet-integrated SERS sensing platform for SA analysis at the level of a single living cell with the help of plasmon AuNPs. Reprinted with permission from ref. [75], Copyright 2019 Springer Nature. (C) Schematic illustration of the enhanced Raman scattering of protein molecules from a single cancer cell by a plasmonic oxide nanoprobe. Reprinted with permission from ref. [76], Copyright 2021, Elsevier B. V. (D) Schematic illustration of a microdroplet integrated with an Fe3O4@AgNP-based SERS sensing platform for the measurement of three different metabolites secreted by a single cell. Reprinted with permission from ref. [77], Copyright 2019 American Chemical Society.
Because labeled SERS involves complex labeling chemistry, which may damage the probe structure, SERS that can be performed in a label-free manner is favored. Recently, Zhang et al. [76] used label-free and biocompatible plasmonic oxide nanoprobes to discriminate single cancer cells with high accuracy using a machine learning algorithm on a microfluidic platform. By combining the advantages of dopant-driven tunable plasmonics and enhanced electromagnetic-field-driven SERS, single human embryonic kidney 293 can be distinguished from human macrophage cell line U937, and THP-1 cells can be distinguished from peripheral blood mononuclear cells with a maximum accuracy of >90% (Figure 6C). In addition, based on the SERS microfluidic droplet device, Sun et al. [77] implemented label-free detection of multiplexed metabolites at the individual cell level. As shown in Figure 6D, AgNPs decorated with Fe3O4 magnetic nanoparticles by polyethylenimine (PEI) linker (Fe3O4@AgNPs) served as a magnetic SERS substrate. An Fe3O4@AgNP substrate and single cells were encapsulated into water-in-oil droplets on the microfluidic chip. During off-chip cell collection and incubation, various metabolites secreted by the cells were adsorbed directly on the Fe3O4@AgNP substrate and spontaneously entrapped in droplets due to the strong magnetism of Fe3O4. The SERS signal of metabolites on Fe3O4@AgNP substrates was explored when the dynamic adsorption of the metabolites reached an equilibrium state. In this way, label-free and simultaneous monitoring of lactate, pyruvate, and ATP was achieved via their intrinsic SERS fingerprints.
3.3. SPR Technique for Single-Cell Analysis on Microchips
SPR based biosensors are intriguing because of their abilities in label-free detection and real-time monitoring of biological specimens [52]. Implementation of SPR sensing technology on microfluidics chip platforms provides a number of benefits, including precise control of each reaction stage, accelerating the reaction process and improving the sensing efficiency with high reproducibility. Inspired by the recent popular applications of SPR microfluidic chip detection units, Sugai et al. [78] designed a multichannel microfluidic chip sensing system for damage-free characterization of cells by pattern recognition. As shown in Figure 7A, the PDMS chip was embedded with five Au films that could immobilize five cysteine derivative independently. When the cell culture media flowed into the chip, the cell-secreted target analytes interacted with the cysteine derivatives and generated five different SPR sensorgrams simultaneously. From the automatic statistical program of the SPR sensorgrams, optimal kinetic parameters could be selected as the “pattern information” for subsequent multivariate analysis. Borile et al. [79] also reported label-free, real-time, on-chip sensing of living cells via grating-coupled SPR. Grating-coupled SPR was established by combining a nanostructured gold grating with an SPR excitation and detection system, which could be further integrated in a PDMS microfluidic chamber for real-time monitoring of cell adhesion capability and cell-surface interaction with integral cell structures during the operational process. Nootchanat et al. [80] fabricated a miniature SPR sensor chip via the confined sessile drop method (Figure 7B). By monitoring the deposition of layer-by-layer ultrathin films of poly(diallyldimethylammonium chloride)/poly(sodium 4-styrenesulfonate), the human immunoglobulin G could be detected with a higher sensitivity compared to common high-refractive-index glass SPR chips.
Because the LSPR peaks of metal nanoparticles can be tuned according to their size, shape, and composition, as well as the dielectric constant of the surrounding medium, attention on sensors based on LSPR continues to increase [81]. For example, a label-free LSPR-based biosensor was integrated with a biomimetic microfluidic chip platform for in situ monitoring of multiplexed cytokine secreted from obese adipose tissue with high-throughput (Figure 7C) [82]. The top PDMS layer of the integrated chip consisted of a cell culture chamber for adipocyte culturing and the formation of a crown-like structure induced by the macrophages. The bottom layer included an antibody-functionalized Au nanorod (AuNR) circular barcode, which was connected to the top layer for multiplexed LSPR detection. Multiplex determination of proinflammatory and anti-inflammatory cytokines secreted by the adipocytes and macrophages could be implemented simultaneously by recording different LSPR sensing signals on this “adipose-tissue-on-chip” nanoplasmonic sensing platform. Li et al. [83] also designed an LSPR biosensor on a PDMS chip for rapid erythrocyte counting and ABO blood group typing. In this biosensor, AuNPs functionalized with anti-A and anti-B antibodies were deposited on glass substrates of two independent sample cells for the identification of blood type (i.e., A, B, AB, and O); LSPR signals were obtained by a coupled ultraviolet-visible spectrometer.

Figure 7.
SPR technique for single-cell analysis on microchips. (A) Photograph of the multichannel chip and the SPR response patterns from the interactions between the molecular probes (cysteine derivatives) on the chip and the cell secretion components in the cell culture media. Reprinted with permission from ref. [78], Copyright 2020 American Chemical Society. (B) Schematic diagram of the miniature SPR sensor chip and the internal flow channel of the microfluidic flow cell. Reprinted with permission from ref. [80], Copyright 2019 American Chemical Society. (C) Overview of the chip design and the principle of cytokine detection on the AuNR-based LSPR sensor including SEM images and intensity data. Reprinted with permission from ref. [82], Copyright 2018, Royal Society of Chemistry.

3.4. Interferometry Technique for Single-Cell Analysis on Microchips
The RI information of biological cells can indicate the size, constituent, and state of a living cell with high repetition and precision, making the interferometric method extremely appropriate for the selective identification of single cells [84]. As mentioned above, RI is very sensitive to environmental conditions, such as temperature, pressure, and liquid, etc.; it is highly susceptible to slight variations in the environment, such as moving or shaking of the sensing device. Moreover, it is challenging for operators to conduct living cell interference experiments without disturbing the surrounding buffer solution around the cells. These obstacles make the microfluidics integrated interferometry method widely favored for interferometric analysis of single cells [85]. In order to better understand the functions of single cells, an integrated label-free nanoplasmonic circular interferometric biosensor was developed on a PDMS chip to investigate molecular secretion from the immune cells (Figure 8A) [86]. The applied nanoplasmonic interferometer technology can address the remarkable drawback of conventional SPR or LSPR spectroscopy, such as poor spatial resolution and broad linewidth. In this work, a narrow linewidth and high-contrast interference stripes from white-light illumination were observed by coupling the free light and surface plasmon polariton waves; the multiple RI intensity of the sensor array was recorded simultaneously by varying the bulk RI on the CCD camera. In this way, the metalloproteinase 9 secreted from human monocytic cells could be effectively monitored at different time points after lipopolysaccharide simulation. More recently, single-cell capture, isolation, and long-time in situ label-free imaging were realized on a microfluidic chip using quantitative self-interference spectroscopy [87]. As shown in Figure 8B, the cell incubator was integrated on the microfluidic chip for long-time single-cell culture after single-cell capture and separation in the microfluidic channels. The RI intensity changes induced by the multiple scattered light and transmitted light in the cell were reflected in the microscopic images. According to the quantitative analysis algorithm of the original RI data, the RI distribution of the single cell at the subcellular level could be obtained. In another work by the same group, monitoring of the dry mass of single cells with femtogram sensitivity was realized with a label-free and quantitative multichannel interferometric imaging technique [88]. Zhang et al. [89] proposed a microwave interferometric cytometry measurement system on a microfluidic chip for single yeast cell analysis. On this integrated platform, dielectric sensing can be applied for single S288C (a common Saccharomyces cerevisiae laboratory strain in) signal analysis at express speed by microwave interferometrics on a microchip, together with a software tool (Figure 8C)
Moreover, an imaging technique without any exogenous labels has received wide attention. In particular, quantitative phase microscopy, which can precisely record the phase shift caused by heterogeneous samples, is extremely favored by scientific researchers. Interferometric reflectance imaging is a label-free imaging mode. It can realize the overall measurement of the height difference of biofilm layers induced by the accumulation of the biomass on the surface of a functionalized sensor. Additionally, it is capable of detecting single biological particles, such as cells, bacteria, or whole virus. Using interferometric reflectance imaging, Zaraee et al. [90] realized label-free and highly sensitive digital detection of whole E. coli cells. This detection even allows for the visualization of individual pathogens captured on the surface without requiring extra sample preparation or modification (Figure 8D). By running the high-magnification imaging modality, the morphological characterization of single bacteria captured on the sensor surface can be visualized in this assay.

Figure 8.
Interferometry technique for single-cell analysis on microchips. (A) Schematic illustration of the microfluidic chip integrated with the interferometric imaging system, as well as the interferometer array transmission images from this biosensor for the detection of matrix metalloproteinase 9. Reprinted with permission from ref. [86], Copyright 2019, Royal Society of Chemistry. (B) Schematic diagram of the microfluidic chip channel structure and a partial enlargement of the single-cell operation process. Reprinted with permission from ref. [87], Copyright 2021, International Society for Advancement of Cytometry. (C) Schematic overview of the microfluidic chip integrated with a microwave interferometric cytometry system and a physical photo of the chip instrument. Reprinted with permission from ref. [89], Copyright 2022, MDPI. (D) Schematic diagram of the light path of the interferometric reflectance imaging system for the analysis of E. coli on the Si/SiO2 substrate of the chip. Reprinted with permission from ref. [90], Copyright 2021, Elsevier B. V.

4. Conclusions
Single-cell analysis is becoming the focus of life science research and plays an important role in tumorigenesis, developmental biology, microbiology, neuroscience, and other related fields. Analysis of single cells is challenging due to their small size and the inherent heterogeneity of cell populations. Fortunately, the advent of microfluidic chip technology has made single-cell manipulation less difficult. On these miniaturized devices, single-cell culturing, trapping, sorting, and selection can be completed. In recent decades, optical technology has been developed rapidly, and the manufacture of super-resolution microscopes combined with various optical techniques has enabled enable the visualization of individual cells and even subcellular structures. In this review, the four most commonly applied optical techniques, i.e., fluorescence, SERS, SPR, and interferometry, were introduced, and a number of selected examples were highlighted to summarize the application of these optical phenomena for single-cell analysis on microfluidic chips in recent years. A summary of these optical technologies for single-cell analysis on microchips is shown in Table 1. All these optical methods can be applied to single-cell analysis on chip platforms. The fluorescence technique benefits from high sensitivity and ease of use, but it always requires dye labeling. The SERS technique has many advantages, as it can achieve non-destructive measurement, but the imaging speed is slow. The SPR technique can realize label-free detection and real-time monitoring of biological specimens, but its sensitivity needs to be improved. The interferometry technique is suitable for monitoring cells in their natural state, as it can do so in a label-free manner; however, external conditions, such as temperature, pressure, and velocity, need to be strictly controlled.

Table 1.
A summary of optical technologies for single-cell analysis on microchips.
The selected examples in this review demonstrate the performance of single-cell analysis on microchips; however, comprehensive and thorough research on single cells is still lacking. Therefore, we suggest the following possibilities for future research focus on this topic: (1) Design and fabricate a fully integrated standalone microfluidic device that allows for multiple operations, such as single-cell culturing, sorting, and analysis, in a common microfluidic platform. (2) Integrate multiple optical detection modalities (such as fluorescence with SERS, SERS with SPR, SERS with interferometry, and even fluorescence with SERS and SPR) on the same microfluidic device to study single cells from various perspectives. (3) Manipulate a true one cell on a microfluidic platform under super-resolution microscopy and realize true one cell analysis with high sensitivity.
Author Contributions
Writing—original draft preparation, X.O.; writing—review and editing, P.C. and B.-F.L. All authors have read and agreed to the published version of the manuscript.
Funding
This work was supported by National Natural Science Foundation of China (22004029, 22074047) and the National Key Research and Development Program of China (2021YFA1101500).
Institutional Review Board Statement
Not applicable.
Informed Consent Statement
Not applicable.
Data Availability Statement
Not applicable.
Conflicts of Interest
The authors declare no conflict of interest.
References
- Cai, D.; Yi, Q.; Shen, C.; Lan, Y.; Urban, G.; Du, W. Direct enrichment of pathogens from physiological samples of high conductivity and viscosity using H-filter and positive dielectrophoresis. Biomicrofluidics 2018, 12, 014109. [Google Scholar] [CrossRef] [PubMed]
- Klein, A.M.; Mazutis, L.; Akartuna, I.; Tallapragada, N.; Veres, A.; Li, V.; Peshkin, L.; Weitz, D.A.; Kirschner, M.W. Droplet barcoding for single-cell transcriptomics applied to embryonic stem cells. Cell 2015, 161, 1187–1201. [Google Scholar] [CrossRef] [PubMed]
- Tang, F.; Barbacioru, C.; Wang, Y.; Nordman, E.; Lee, C.; Xu, N.; Wang, X.; Bodeau, J.; Tuch, B.B.; Siddiqui, A.; et al. mRNA-Seq whole-transcriptome analysis of a single cell. Nat. Methods 2009, 6, 377–382. [Google Scholar] [CrossRef]
- Hughes, A.J.; Spelke, D.P.; Xu, Z.; Kang, C.; Schaffer, D.V.; Herr, A.E. Single-cell western blotting. Nat. Methods 2014, 11, 749–755. [Google Scholar] [CrossRef] [PubMed]
- Huang, B.; Wu, H.; Bhaya, D.; Grossman, A.; Granier, S.; Kobilka, B.K.; Zare, R.N. Counting low-copy number proteins in a single cell. Science 2007, 315, 81–84. [Google Scholar] [CrossRef]
- De Silva, I.W.; Kretsch, A.R.; Lewis, H.; Bailey, M.; Verbeck, G.F. True one cell chemical analysis: A review. Analyst 2019, 144, 4733–4749. [Google Scholar] [CrossRef]
- Galler, K.; Brautigam, K.; Grosse, C.; Popp, J.; Neugebauer, U. Making a big thing of a small cell—Recent advances in single cell analysis. Analyst 2014, 139, 1237–1273. [Google Scholar] [CrossRef]
- Lo, S.; Yao, D. Get to understand more from single-cells: Current studies of microfluidic-based techniques for single-cell analysis. Int. J. Mol. Sci. 2015, 16, 16763–16777. [Google Scholar] [CrossRef]
- Volpato, V.; Webber, C. Addressing variability in iPSC-derived models of human disease: Guidelines to promote reproducibility. Dis. Model. Mech. 2020, 13, dmm042317. [Google Scholar] [CrossRef]
- Prasetyanti, P.R.; Medema, J.P. Intra-tumor heterogeneity from a cancer stem cell perspective. Mol. Cancer 2017, 16, 41. [Google Scholar] [CrossRef]
- Zheng, H.; Pomyen, Y.; Hernandez, M.O.; Li, C.; Livak, F.; Tang, W.; Dang, H.; Greten, T.F.; Davis, J.L.; Zhao, Y.; et al. Single-cell analysis reveals cancer stem cell heterogeneity in hepatocellular carcinoma. Hepatology 2018, 68, 127–140. [Google Scholar] [CrossRef] [PubMed]
- Oomen, P.E.; Aref, M.A.; Kaya, I.; Phan, N.T.N.; Ewing, A.G. Chemical analysis of single cells. Anal. Chem. 2019, 91, 588–621. [Google Scholar] [CrossRef] [PubMed]
- Li, Z.; Ju, R.; Sekine, S.; Zhang, D.; Zhuang, S.; Yamaguchi, Y. All-in-one microfluidic device for on-site diagnosis of pathogens based on an integrated continuous flow PCR and electrophoresis biochip. Lab Chip 2019, 19, 2663–2668. [Google Scholar] [CrossRef] [PubMed]
- Black, W.A.; Stocks, B.B.; Mellors, J.S.; Engen, J.R.; Ramsey, J.M. Utilizing microchip capillary electrophoresis electrospray ionization for hydrogen exchange mass spectrometry. Anal. Chem. 2015, 87, 6280–6287. [Google Scholar] [CrossRef] [PubMed]
- Chen, P.; Chen, D.; Li, S.; Ou, X.; Liu, B.F. Microfluidics towards single cell resolution protein analysis. Trends Anal. Chem. 2019, 117, 2–12. [Google Scholar] [CrossRef]
- Murphy, T.W.; Zhang, Q.; Naler, L.B.; Ma, S.; Lu, C. Recent advances in the use of microfluidic technologies for single cell analysis. Analyst 2017, 143, 6–8. [Google Scholar] [CrossRef]
- Cong, L.; Wang, J.; Li, X.; Tian, Y.; Xu, S.; Liang, C.; Xu, W.; Wang, W.; Xu, S. Microfluidic droplet-SERS platform for single-cell cytokine analysis via a cell surface bioconjugation strategy. Anal. Chem. 2022, 94, 10375–10383. [Google Scholar] [CrossRef]
- Wang, Y.; Chen, Z.; Li, Q. Microfluidic techniques for dynamic single-cell analysis. Microchim. Acta 2010, 168, 177–195. [Google Scholar] [CrossRef]
- Xie, T.; Zhang, Q.; Zhang, W.; Feng, S.; Lin, J. Inkjet-patterned microdroplets as individual microenvironments for adherent single cell culture. Small 2022, 18, 2107992. [Google Scholar] [CrossRef]
- Yan, S.; Yuan, D. Continuous microfluidic 3D focusing enabling microflow cytometry for single-cell analysis. Talanta 2021, 221, 121401. [Google Scholar] [CrossRef]
- Yan, S.; Chen, P.; Zeng, X.; Zhang, X.; Li, Y.; Xia, Y.; Wang, J.; Dai, X.; Feng, X.; Du, W.; et al. Integrated multifunctional electrochemistry microchip for highly efficient capture, release, lysis, and analysis of circulating tumor cells. Anal. Chem. 2017, 89, 12039–12044. [Google Scholar] [CrossRef] [PubMed]
- Feng, X.; Liu, B.F.; Li, J.; Liu, X. Advances in coupling microfluidic chips to mass spectrometry. Mass Spectrom. Rev. 2015, 34, 535–557. [Google Scholar] [CrossRef] [PubMed]
- Redman, E.A.; Ramos-Payan, M.; Mellors, J.S.; Ramsey, J.M. Analysis of hemoglobin glycation using microfluidic CE-MS: A rapid, mass spectrometry compatible method for assessing diabetes management. Anal. Chem. 2016, 88, 5324–5330. [Google Scholar] [CrossRef]
- Liu, X.; Zhao, Y.Y.; Chan, K.; Hrudey, S.E.; Li, X.F.; Li, J. Analysis of nitrosamines by capillary electrospray-high-field asymmetric waveform ion mobility spectrometry-MS with programmed compensation voltage. Electrocatalysis 2007, 28, 1327–1334. [Google Scholar] [CrossRef]
- Deng, Y.; Henion, J.; Li, J.; Thibault, P.; Wang, C.; Harrison, D.J. Chip-based capillary electrophoresis/mass spectrometry determination of carnitines in human urine. Anal. Chem. 2001, 73, 639–646. [Google Scholar] [CrossRef] [PubMed]
- Bondarenko, A.; Cortés-Salazar, F.; Gheorghiu, M.; Gáspár, S.; Momotenko, D.; Stanica, L.; Lesch, A.; Gheorghiu, E.; Girault, H.H. Electrochemical push–pull probe: From scanning electrochemical microscopy to multimodal altering of cell microenvironment. Anal. Chem. 2015, 87, 4479–4486. [Google Scholar] [CrossRef]
- Choi, J.; Song, H.; Sung, J.H.; Kim, D.; Kim, K. Microfluidic assay-based optical measurement techniques for cell analysis: A review of recent progress. Biosens. Bioelectron. 2016, 77, 227–236. [Google Scholar] [CrossRef] [PubMed]
- Wei, X.; Lu, Y.; Zhang, X.; Chen, M.; Wang, J. Recent advances in single-cell ultra-trace analysis. Trends Anal. Chem. 2020, 127, 115886. [Google Scholar] [CrossRef]
- Huang, Q.; Mao, S.; Khan, M.; Li, W.; Zhang, Q.; Lin, J. Single-cell identification by microfluidic-based in situ extracting and online mass spectrometric analysis of phospholipids expression. Chem. Sci. 2020, 11, 253–256. [Google Scholar] [CrossRef]
- Huo, D.; Liu, Z.; Hou, C.; Yang, J.; Luo, X.; Fa, H.; Dong, J.; Zhang, Y.; Zhang, G.; Li, J. Recent advances on optical detection methods and techniques for cell-based microfluidic systems. Chin. J. Anal. Chem. 2010, 38, 1357–1365. [Google Scholar] [CrossRef]
- Zhong, Q.; Huang, X.; Zhang, R.; Zhang, K.; Liu, B.F. Optical sensing strategies for probing single-cell secretion. ACS Sens. 2022, 7, 1779–1790. [Google Scholar] [CrossRef] [PubMed]
- Lu, S.; Long, Y. Confined nanopipette-a new microfluidic approach for single cell analysis. Trends Anal. Chem. 2019, 117, 39–46. [Google Scholar] [CrossRef]
- Xu, X.; Wang, J.; Wu, L.; Guo, J.; Song, Y.; Tian, T.; Wang, W.; Zhu, Z.; Yang, C. Microfluidic single-cell omics analysis. Small 2019, 16, 1903905. [Google Scholar] [CrossRef] [PubMed]
- Lin, S.; Liu, Y.; Zhang, M.; Xu, X.; Chen, Y.; Zhang, H.; Yang, C. Microfluidic single-cell transcriptomics: Moving towards multimodal and spatiotemporal omics. Lab Chip 2021, 21, 3829–3849. [Google Scholar] [CrossRef]
- Zhou, W.; Yan, Y.; Guo, Q.; Ji, H.; Wang, H.; Xu, T.; Makabel, B.; Pilarsky, C.; He, G.; Yu, X.; et al. Microfluidics applications for high-throughput single cell sequencing. J. Nanobiotechnol. 2021, 19, 312. [Google Scholar] [CrossRef]
- Anggraini, D.; Ota, N.; Shen, Y.; Tang, T.; Tanaka, Y.; Hosokawa, Y.; Li, M.; Yalikun, Y. Recent advances in microfluidic devices for single-cell cultivation: Methods and applications. Lab Chip 2022, 22, 1438–1468. [Google Scholar] [CrossRef]
- Tavakoli, H.; Zhou, W.; Ma, L.; Perez, S.; Ibarra, A.; Xu, F.; Zhan, S.; Li, X. Recent advances in microfluidic platforms for single-cell analysis in cancer biology, diagnosis and therapy. Trends Anal. Chem. 2019, 117, 13–26. [Google Scholar] [CrossRef]
- Sung, J.; Kim, P.; Saga, S.; Hayashi, S.; Osuka, A.; Kim, D. S2 fluorescence dynamics of meso-aryl-substituted subporphyrins. Angew. Chem. Int. Ed. 2013, 52, 12632–12635. [Google Scholar] [CrossRef]
- Blake, R.C.; Iredale, T. Quenching of fluorescence by van der waals forces. Nature 1946, 3982, 228–229. [Google Scholar]
- Oleksiievets, N.; Sargsyan, Y.; Thiele, J.C.; Mougios, N.; Sograte-Idrissi, S.; Nevskyi, O.; Gregor, I.; Opazo, F.; Thoms, S.; Enderlein, J.; et al. Fluorescence lifetime DNA-PAINT for multiplexed super-resolution imaging of cells. Commun. Biol. 2022, 5, 38. [Google Scholar] [CrossRef]
- Fan, Y.; Dong, D.; Li, Q.; Si, H.; Pei, H.; Li, L.; Tang, B. Fluorescent analysis of bioactive molecules in single cells based on microfluidic chips. Lab Chip 2018, 18, 1151–1173. [Google Scholar] [CrossRef] [PubMed]
- Wu, L.; Chen, P.; Dong, Y.; Feng, X.; Liu, B.F. Encapsulation of single cells on a microfluidic device integrating droplet generation with fluorescence-activated droplet sorting. Biomed. Microdevices 2013, 15, 553–560. [Google Scholar] [CrossRef] [PubMed]
- Araki, S.; Nakano, M.; Tsugane, M.; Sunaga, F.; Hattori, M.; Nakano, M.; Nagai, T.; Suzuki, H. A simple microfluidic device for live-imaging of the vertical section of epithelial cells. Analyst 2020, 145, 667–674. [Google Scholar] [CrossRef] [PubMed]
- Ren, J.; Li, Y.; Hu, S.; Liu, Y.; Tsao, S.W.; Lau, D.; Luo, G.; Tsang, C.M.; Lam, R. Nondestructive quantification of single-cell nuclear and cytoplasmic mechanical properties based on large whole-cell deformation. Lab Chip 2020, 20, 4175–4185. [Google Scholar] [CrossRef]
- Sharma, B.; Frontiera, R.R.; Henry, A.; Ringe, E.; Van Duyne, R.P. SERS: Materials, applications, and the future. Mater. Today 2012, 15, 16–25. [Google Scholar] [CrossRef]
- Fikiet, M.A.; Khandasammy, S.R.; Mistek, E.; Ahmed, Y.; Halámková, L.; Bueno, J.; Lednev, I.K. Surface enhanced raman spectroscopy: A review of recent applications in forensic science. Spectrochim. Acta A Mol. Biomol. Spectrosc. 2018, 197, 255–260. [Google Scholar] [CrossRef]
- Liebel, M.; Pazos-Perez, N.; van Hulst, N.F.; Alvarez-Puebla, R.A. Surface-enhanced raman scattering holography. Nat. Nanotechnol. 2020, 15, 1005–1011. [Google Scholar] [CrossRef]
- Li, L.; Lu, Y.; Qian, Z.; Yang, Z.; Yang, K.; Zong, S.; Wang, Z.; Cui, Y. Ultra-sensitive surface enhanced raman spectroscopy sensor for in-situ monitoring of dopamine release using zipper-like ortho-nanodimers. Biosens. Bioelectron. 2021, 180, 113100. [Google Scholar] [CrossRef]
- Zhang, Y.; Wu, L.; Yang, K.; Zong, S.; Wang, Z.; Cui, Y. 2D profiling of tumor chemotactic and molecular phenotype at single cell resolution using a SERS-microfluidic chip. Nano Res. 2022, 15, 4357–4365. [Google Scholar] [CrossRef]
- Preechaburana, P.; Gonzalez, M.C.; Suska, A.; Filippini, D. Surface plasmon resonance chemical sensing on cell phones. Angew. Chem. Int. Ed. 2012, 51, 11585–11588. [Google Scholar] [CrossRef]
- Su, Y.; Ke, Y.; Cai, S.; Yao, Q. Surface plasmon resonance of layer-by-layer gold nanoparticles induced photoelectric current in environmentally-friendly plasmon-sensitized solar cell. Light Sci. Appl. 2012, 1, e14. [Google Scholar] [CrossRef]
- Amendola, V.; Pilot, R.; Frasconi, M.; Maragò, O.M.; Iatì, M.A. Surface plasmon resonance in gold nanoparticles: A review. J. Phys. Condens. Matter 2017, 29, 203002. [Google Scholar] [CrossRef] [PubMed]
- Han, C.; Dong, T.; Wang, P.; Zhou, F. Microfluidically partitioned dual channels for accurate background subtraction in cellular binding studies by surface plasmon resonance microcopy. Anal. Chem. 2022, 94, 17303–17311. [Google Scholar] [CrossRef]
- Liu, Z.; Wu, J.; Cai, C.; Yang, B.; Qi, Z.M. Flexible hyperspectral surface plasmon resonance microcopy. Nat. Commun. 2022, 13, 6475. [Google Scholar] [CrossRef] [PubMed]
- Zhou, X.L.; Yang, Y.; Wang, S.; Liu, X.W. Surface plasmon resonance microscopy: From single-molecule sensing to single-cell imaging. Angew. Chem. Int. Ed. 2019, 132, 1792–1801. [Google Scholar] [CrossRef]
- Chang, C.; Lin, H.; Lai, M.; Shieh, T.; Peng, C.; Shih, M.; Tung, Y. Flexible localized surface plasmon resonance sensor with metal–insulator–metal nanodisks on PDMS substrate. Sci. Rep. 2018, 8, 11812. [Google Scholar] [CrossRef]
- Zuo, C.; Li, J.; Sun, J.; Fan, Y.; Zhang, J.; Lu, L.; Zhang, R.; Wang, B.; Huang, L.; Chen, Q. Transport of intensity equation: A tutorial. Opt. Lasers Eng. 2020, 135, 106187. [Google Scholar] [CrossRef]
- Saha, S.K. Modern optical astronomy: Technology and impact of interferometry. Rev. Mod. Phys. 2002, 74, 551–599. [Google Scholar] [CrossRef][Green Version]
- Ricchiuti, G.; Dabrowska, A.; Pinto, D.; Ramer, G.; Lendl, B. Dual-beam photothermal spectroscopy employing a Mach-Zehnder interferometer and an external cavity quantum cascade laser for detection of water traces in organic solvents. Anal. Chem. 2022, 94, 16353–16360. [Google Scholar] [CrossRef]
- Alexander, G. Bose–Einstein and Fermi–Dirac interferometry in particle physics. Rep. Prog. Phys. 2003, 66, 481–522. [Google Scholar] [CrossRef]
- Hou, Z.S.; Sun, Y.L.; Li, Q.S.; Fan, X.; Cheng, R. Smart bio-gel optofluidic Mach-Zehnder interferometers multiphoton-lithographically customized with chemo-mechanical-opto transduction and bio-triggered degradation. Lab Chip 2020, 20, 3815–3823. [Google Scholar] [CrossRef]
- Ahmad, A.; Dubey, V.; Singh, V.R.; Tinguely, J.C.; Oie, C.I.; Wolfson, D.L.; Mehta, D.S.; So, P.; Ahluwalia, B.S. Quantitative phase microscopy of red blood cells during planar trapping and propulsion. Lab Chip 2018, 18, 3025–3036. [Google Scholar] [CrossRef] [PubMed]
- Guo, Y.; Chen, P.; Gao, Z.; Li, Y.; Li, S.; Feng, X.; Liu, B.F. A time-coded multi-concentration microfluidic chemical waveform generator for high-throughput probing suspension single-cell signaling. Chin. Chem. Lett. 2022, 33, 3091–3096. [Google Scholar] [CrossRef]
- Guo, Y.; Gao, Z.; Liu, Y.; Li, S.; Zhu, J.; Chen, P.; Liu, B.F. Multichannel synchronous hydrodynamic gating coupling with concentration gradient generator for high-throughput probing dynamic signaling of single cells. Anal. Chem. 2020, 92, 12062–12070. [Google Scholar] [CrossRef]
- Feng, S.; Zhang, Q.; Xie, T.; Hou, Y.; Lin, J. In-situ monitoring calcium signaling through tumor microtubes for single cell-cell communication via an open microfluidic probe. Biosens. Bioelectron. 2022, 206, 114137. [Google Scholar] [CrossRef]
- Lee, B.; Jeong, S.G.; Jin, S.H.; Mishra, R.; Peter, M.; Lee, C.S.; Lee, S.S. Quantitative analysis of yeast MAPK signaling networks and crosstalk using a microfluidic device. Lab Chip 2020, 20, 2646–2655. [Google Scholar] [CrossRef] [PubMed]
- Pratt, S.L.; Zath, G.K.; Akiyama, T.; Williamson, K.S.; Franklin, M.J.; Chang, C.B. DropSOAC: Stabilizing microfluidic drops for time-lapse quantification of single-cell bacterial physiology. Front. Microbiol. 2019, 10, 2112. [Google Scholar] [CrossRef]
- Mandracchia, B.; Son, J.; Jia, S. Super-resolution optofluidic scanning microscopy. Lab Chip 2021, 21, 489–493. [Google Scholar] [CrossRef]
- Mathur, P.; Fomitcheva Khartchenko, A.; Stavrakis, S.; Kaigala, G.V.; DeMello, A.J. Quantifying antibody binding kinetics on fixed cells and tissues via fluorescence lifetime imaging. Anal. Chem. 2022, 94, 10967–10975. [Google Scholar] [CrossRef]
- Lee, D.; Li, X.; Ma, N.; Digman, M.A.; Lee, A.P. Rapid and label-free identification of single leukemia cells from blood in a high-density microfluidic trapping array by fluorescence lifetime imaging microscopy. Lab Chip 2018, 18, 1349–1358. [Google Scholar] [CrossRef]
- Wang, Z.; Zong, S.; Wu, L.; Zhu, D.; Cui, Y. SERS-activated platforms for immunoassay: Probes, encoding methods, and applications. Chem. Rev. 2017, 117, 7910–7963. [Google Scholar] [CrossRef] [PubMed]
- Joensson, H.N.; Andersson Svahn, H. Droplet microfluidics-a tool for single-cell Analysis. Angew. Chem. Int. Ed. 2012, 51, 12176–12192. [Google Scholar] [CrossRef] [PubMed]
- Sun, D.; Cao, F.; Cong, L.; Xu, W.; Chen, Q.; Shi, W.; Xu, S. Cellular heterogeneity identified by single-cell alkaline phosphatase (ALP) via a SERRS-microfluidic droplet platform. Lab Chip 2019, 19, 335–342. [Google Scholar] [CrossRef] [PubMed]
- Qi, G.; Du, X.; Yi, X.; Wang, M.; Zhu, H.; Sun, D. A SERS and fluorescence dual-channel microfluidic droplet platform for exploring telomerase activity at the single-cell level. Analyst 2022, 147, 5062–5067. [Google Scholar] [CrossRef]
- Cong, L.; Liang, L.; Cao, F.; Sun, D.; Yue, J.; Xu, W.; Liang, C.; Xu, S. Distinguishing cancer cell lines at a single living cell level via detection of sialic acid by dual-channel plasmonic imaging and by using a SERS-microfluidic droplet platform. Microchim. Acta 2019, 186, 367. [Google Scholar] [CrossRef]
- Zhang, B.Y.; Yin, P.; Hu, Y.; Szydzik, C.; Khan, M.W.; Xu, K.; Thurgood, P.; Mahmood, N.; Dekiwadia, C.; Afrin, S.; et al. Highly accurate and label-free discrimination of single cancer cell using a plasmonic oxide-based nanoprobe. Biosens. Bioelectron. 2022, 198, 113814. [Google Scholar] [CrossRef]
- Sun, D.; Cao, F.; Tian, Y.; Li, A.; Xu, W.; Chen, Q.; Shi, W.; Xu, S. Label-free detection of multiplexed metabolites at single-cell level via a SERS-microfluidic droplet Platform. Anal. Chem. 2019, 91, 15484–15490. [Google Scholar] [CrossRef]
- Sugai, H.; Tomita, S.; Ishihara, S.; Yoshioka, K.; Kurita, R. Microfluidic sensing system with a multichannel surface plasmon resonance chip: Damage-free characterization of cells by pattern recognition. Anal. Chem. 2020, 92, 14939–14946. [Google Scholar] [CrossRef]
- Borile, G.; Rossi, S.; Filippi, A.; Gazzola, E.; Capaldo, P.; Tregnago, C.; Pigazzi, M.; Romanato, F. Label-free, real-time on-chip sensing of living cells via grating-coupled surface plasmon resonance. Biophys. Chem. 2019, 254, 106262. [Google Scholar] [CrossRef]
- Nootchanat, S.; Jaikeandee, W.; Yaiwong, P.; Lertvachirapaiboon, C.; Shinbo, K.; Kato, K.; Ekgasit, S.; Baba, A. Fabrication of miniature surface plasmon resonance sensor chips by using confined sessile drop technique. ACS Appl. Mater. Interfaces 2019, 11, 11954–11960. [Google Scholar] [CrossRef]
- Zeng, S.; Baillargeat, D.; Ho, H.P.; Yong, K.T. Nanomaterials enhanced surface plasmon resonance for biological and chemical sensing applications. Chem. Soc. Rev. 2014, 43, 3426–3452. [Google Scholar] [CrossRef] [PubMed]
- Zhu, J.; He, J.; Verano, M.; Brimmo, A.T.; Glia, A.; Qasaimeh, M.A.; Chen, P.; Aleman, J.O.; Chen, W. An integrated adipose-tissue-on-chip nanoplasmonic biosensing platform for investigating obesity-associated inflammation. Lab Chip 2018, 18, 3550–3560. [Google Scholar] [CrossRef] [PubMed]
- Li, X.; Feng, H.; Wang, Y.; Zhou, C.; Jiang, W.; Zhong, M.; Zhou, J. Capture of red blood cells onto optical sensor for rapid ABO blood group typing and erythrocyte counting. Sens. Actuators B Chem. 2018, 262, 411–417. [Google Scholar] [CrossRef]
- Duval, D.; González-Guerrero, A.B.; Dante, S.; Osmond, J.; Monge, R.; Fernández, L.J.; Zinoviev, K.E.; Domínguez, C.; Lechuga, L.M. Nanophotonic lab-on-a-chip platforms including novel bimodal interferometers, microfluidics and grating couplers. Lab Chip 2012, 12, 1987. [Google Scholar] [CrossRef] [PubMed]
- Ferrier, G.A.; Romanuik, S.F.; Thomson, D.J.; Bridges, G.E.; Freeman, M.R. A microwave interferometric system for simultaneous actuation and detection of single biological cells. Lab Chip 2009, 9, 3406. [Google Scholar] [CrossRef] [PubMed]
- Qian, Y.; Zeng, X.; Gao, Y.; Li, H.; Kumar, S.; Gan, Q.; Cheng, X.; Bartoli, F.J. Intensity-modulated nanoplasmonic interferometric sensor for MMP-9 detection. Lab Chip 2019, 19, 1267–1276. [Google Scholar] [CrossRef] [PubMed]
- Fu, R.; Su, Y.; Wang, R.; Lin, X.; Jin, X.; Yang, H.; Du, W.; Shan, X.; Lv, W.; Huang, G. Single cell capture, isolation, and long-term in-situ imaging using quantitative self-interference spectroscopy. Cytom. A 2021, 99, 601–609. [Google Scholar] [CrossRef] [PubMed]
- Su, Y.; Fu, R.; Du, W.; Yang, H.; Ma, L.; Luo, X.; Wang, R.; Lin, X.; Jin, X.; Shan, X.; et al. Label-free and quantitative dry mass monitoring for single cells during in situ culture. Cells 2021, 10, 1635. [Google Scholar] [CrossRef]
- Zhang, M.; Huo, G.; Bao, J.; Markovic, T.; Dijck, P.V.; Nauwelaers, B. Microwave interferometric cytometry for signal analysis of single yeast cells. Chemosensors 2022, 10, 318. [Google Scholar] [CrossRef]
- Zaraee, N.; Kanik, F.E.; Bhuiya, A.M.; Gong, E.S.; Geib, M.T.; Lortlar Ünlü, N.; Ozkumur, A.Y.; Dupuis, J.R.; Ünlü, M.S. Highly sensitive and label-free digital detection of whole cell E. coli with interferometric reflectance imaging. Biosens. Bioelectron. 2020, 162, 112258. [Google Scholar] [CrossRef]


Disclaimer/Publisher’s Note: The statements, opinions and data contained in all publications are solely those of the individual author(s) and contributor(s) and not of MDPI and/or the editor(s). MDPI and/or the editor(s) disclaim responsibility for any injury to people or property resulting from any ideas, methods, instructions or products referred to in the content. |
© 2023 by the authors. Licensee MDPI, Basel, Switzerland. This article is an open access article distributed under the terms and conditions of the Creative Commons Attribution (CC BY) license (https://creativecommons.org/licenses/by/4.0/).