
Microfluidic Platforms for Single Cell Analysis: Applications in Cellular Manipulation and Optical Biosensing
 , , and
Abstract
:
1. Introduction
2. Analysis of Single Cells
2.1. Cellular Bioanalytics
2.2. Sample Preparation
3. Microfluidics for Cellular Manipulation
3.1. Trapping and Sorting of Single Cells
3.1.1. Micro-Trapping of Cells
3.1.2. Droplet Encapsulation
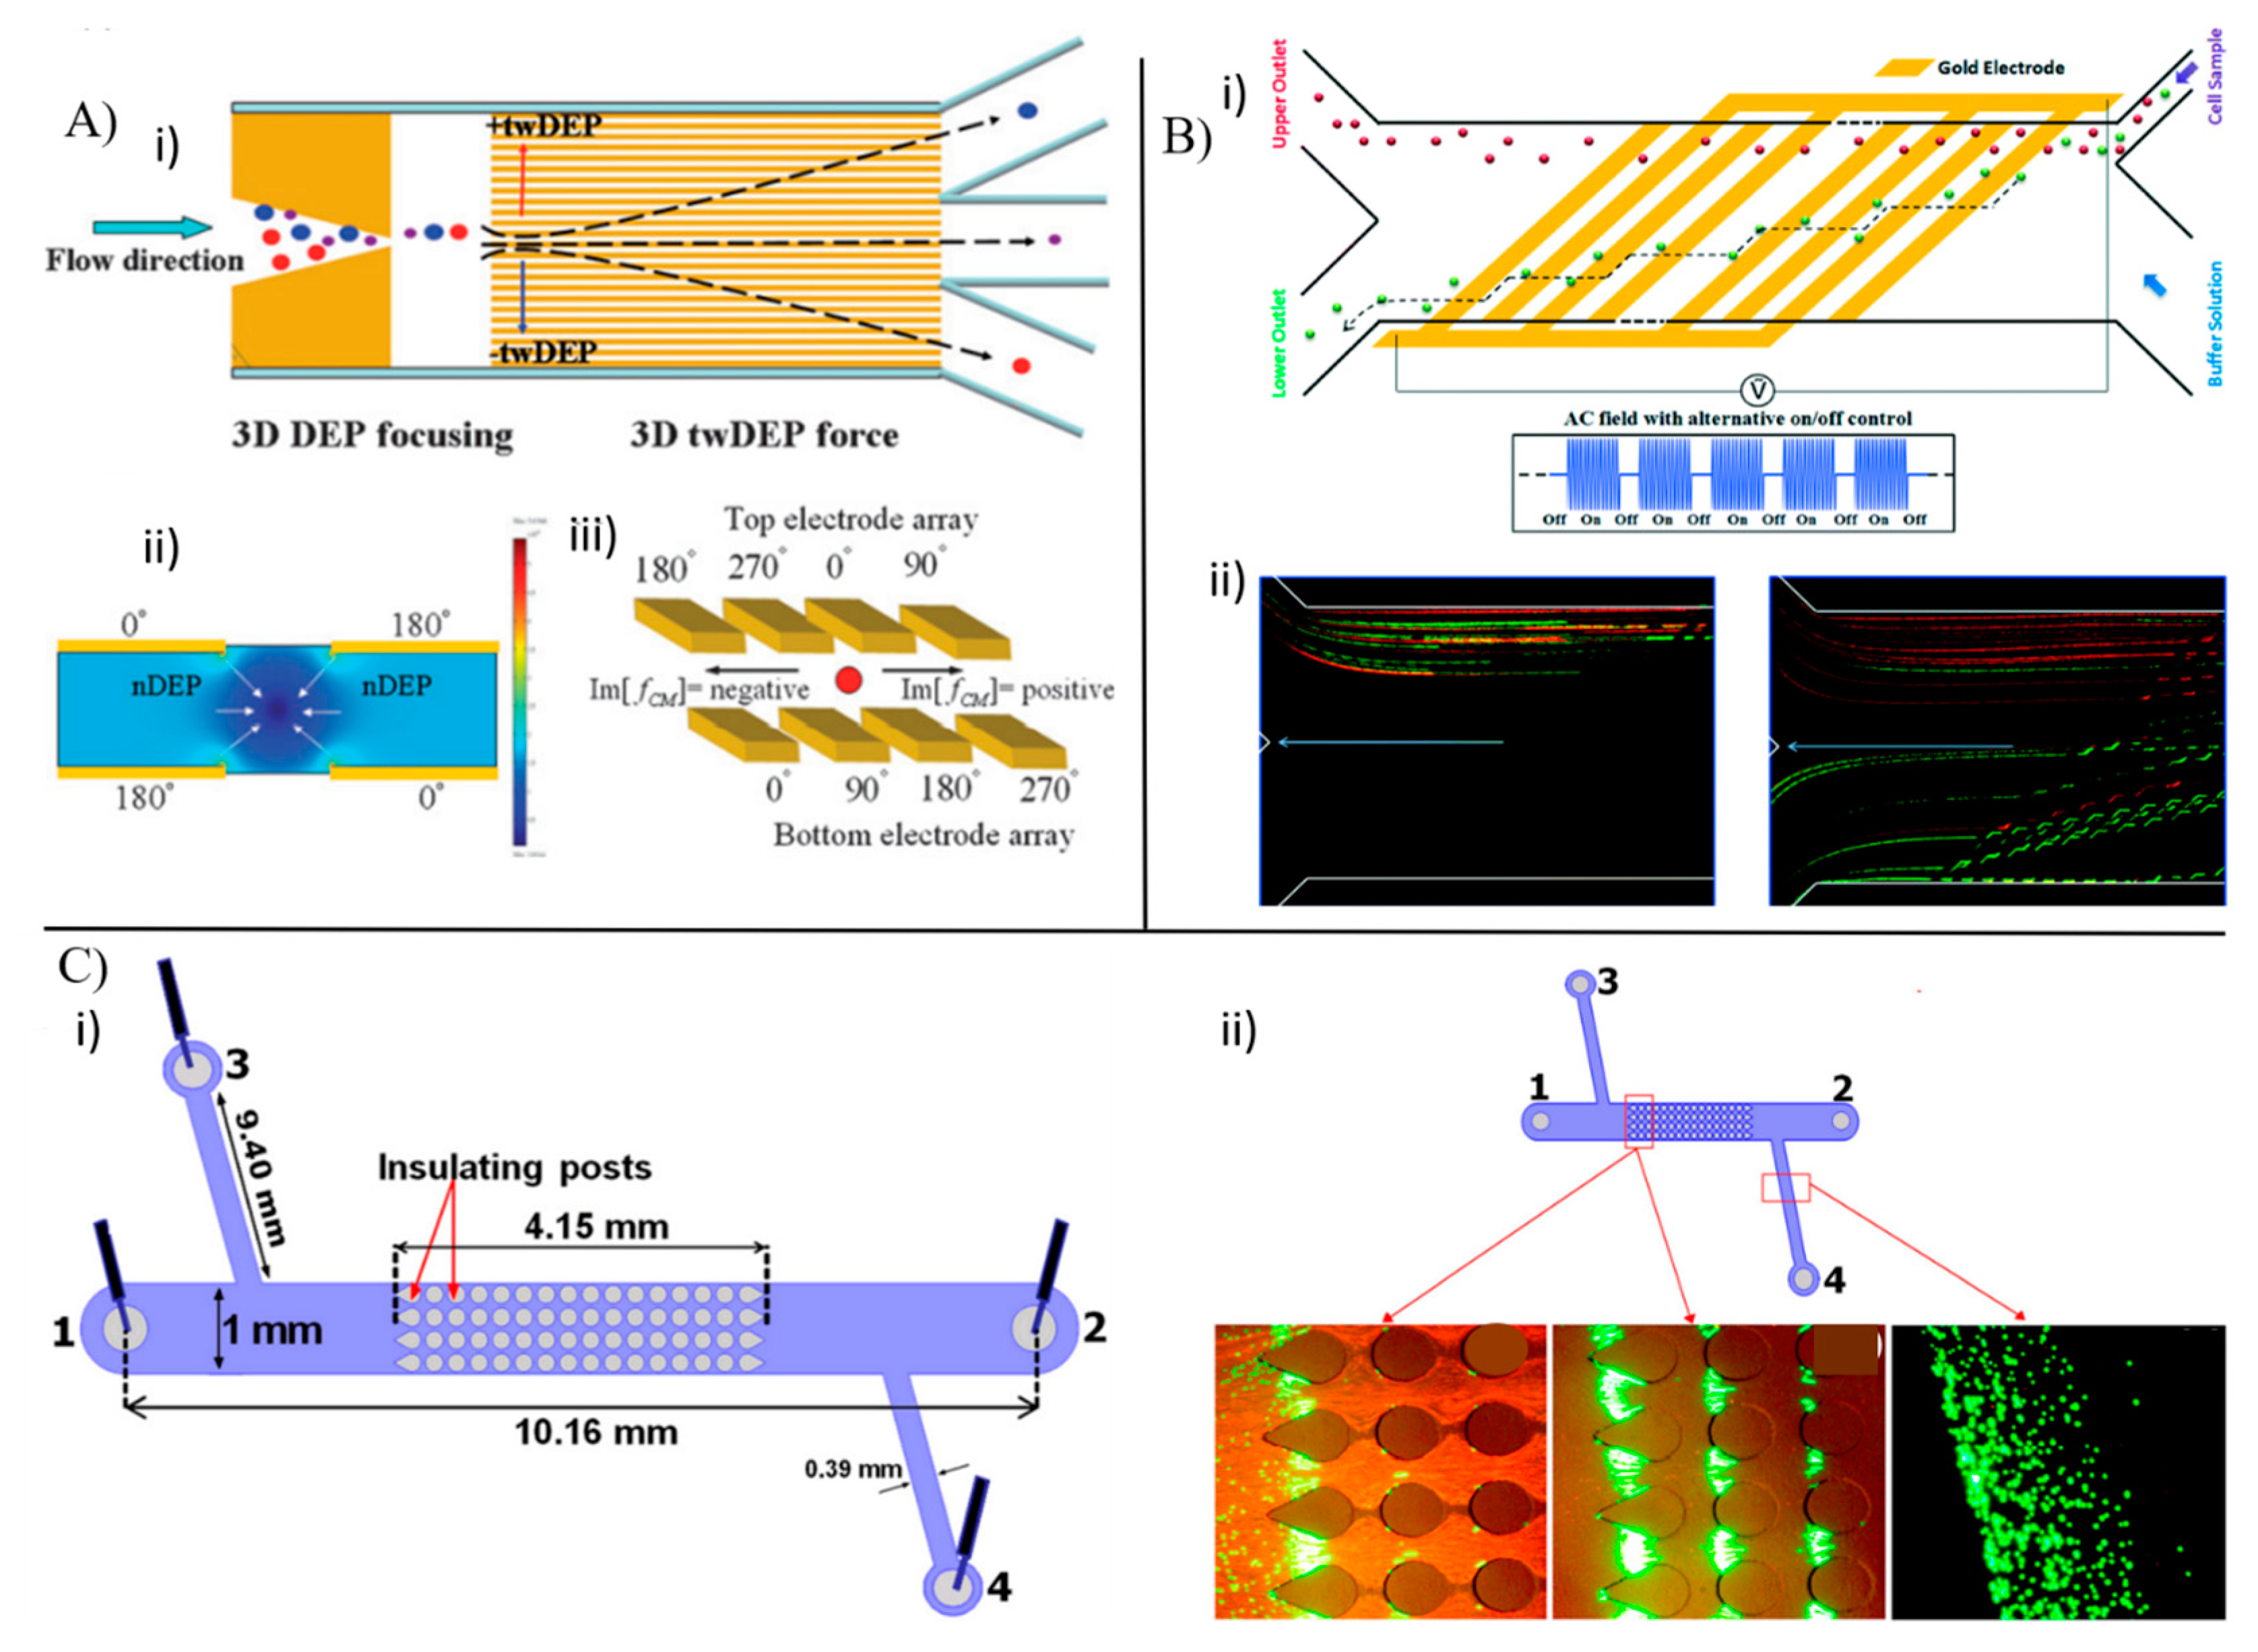
3.1.3. Dielectrophoresis
3.1.4. Magnetophoresis
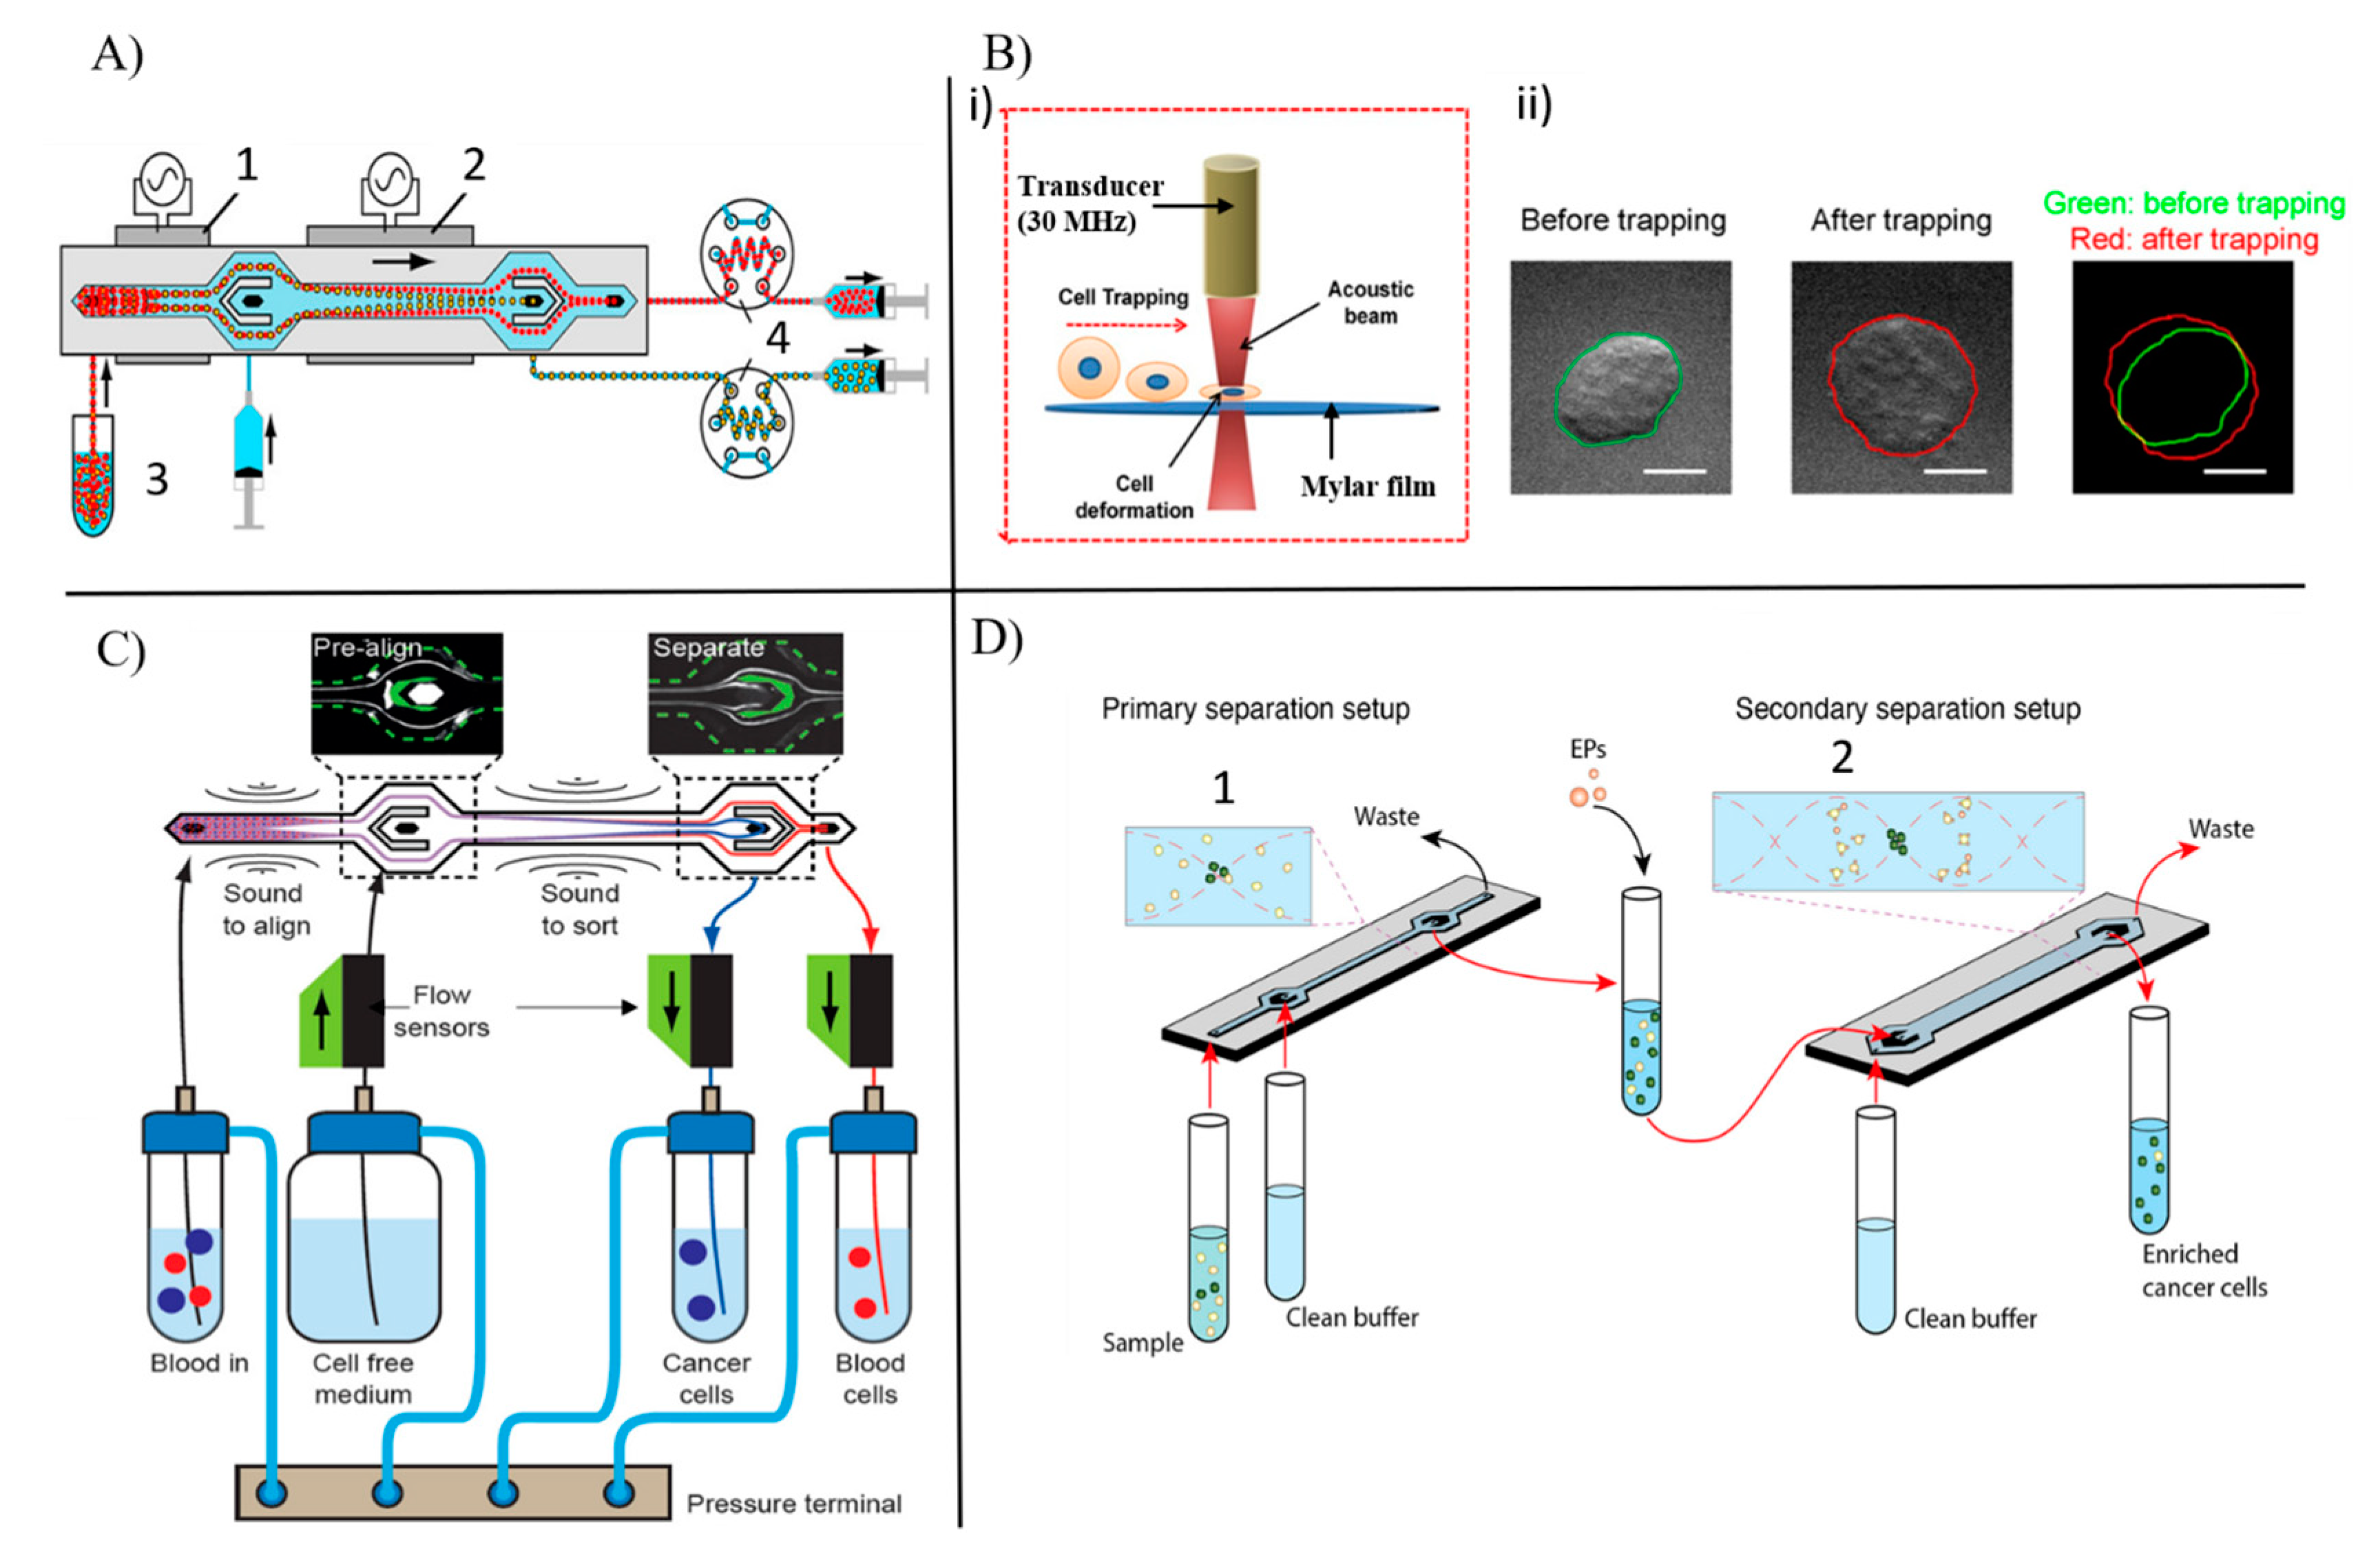
3.1.5. Acoustophoresis
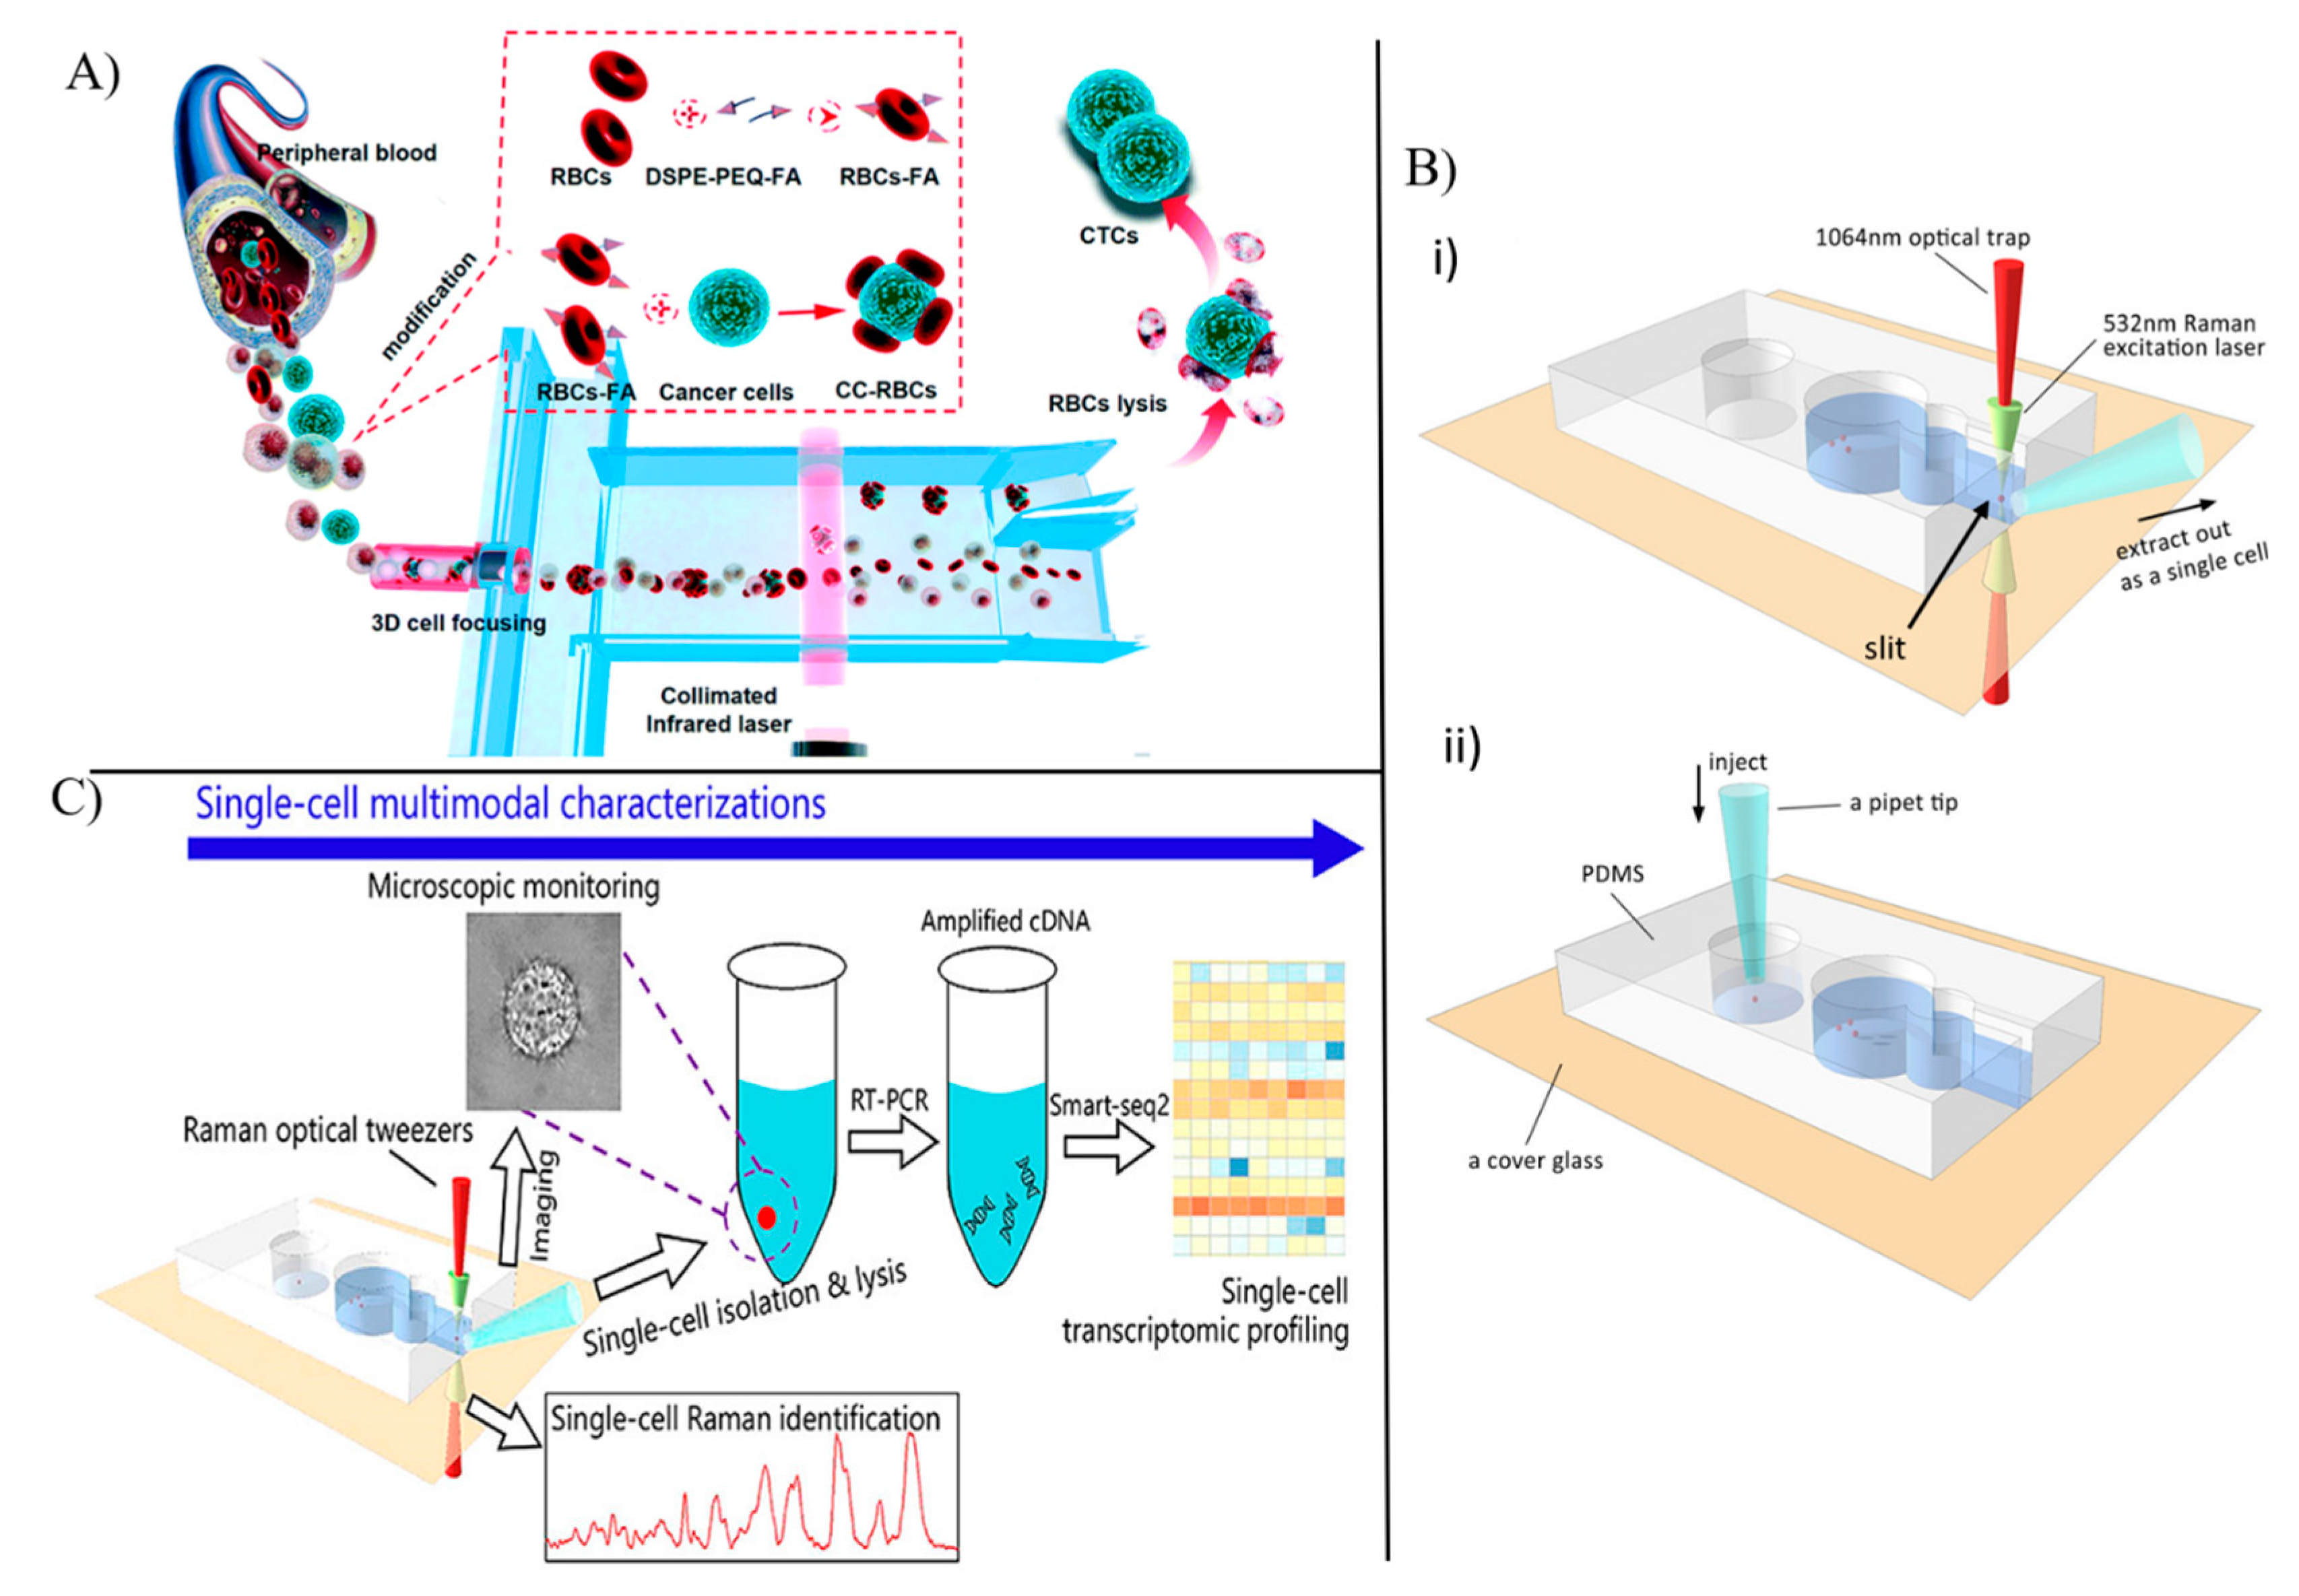
3.1.6. Optical Tweezers
3.2. Optical Sensors for Single Cell Analysis
3.2.1. Surface Plasmon Resonance (SPR) Spectroscopy and Imaging
3.2.2. Surface-Enhanced Raman Scattering (SERS)
3.2.3. Absorbance-Based Detection
3.2.4. Fluorometry
3.3. Single Circulating Tumor Cell Detection
4. Conclusions
Author Contributions
Funding
Institutional Review Board Statement
Informed Consent Statement
Data Availability Statement
Conflicts of Interest
References
- Lawson, D.A.; Kessenbrock, K.; Davis, R.; Pervolarakis, N.; Werb, Z. Tumour heterogeneity and metastasis at single-cell resolution. Nat. Cell Biol. 2018, 20, 1349–1360. [Google Scholar] [CrossRef]
- Goldman, S.L.; MacKay, M.; Afshinnekoo, E.; Melnick, A.M.; Wu, S.; Mason, C.E. The impact of heterogeneity on single-cell sequencing. Front. Genet. 2019, 10, 8. [Google Scholar] [CrossRef] [PubMed]
- Dodd, S.J.; Williams, M.; Suhan, J.P.; Williams, D.S.; Koretsky, A.P. Detection of single mammalian cells by high-resolution magnetic resonance imaging. Biophys. J. 1999, 76, 103. [Google Scholar] [CrossRef]
- Buggenthin, F.; Marr, C.; Schwarzfischer, M.; Hoppe, P.S.; Hilsenbeck, O.; Schroeder, T.; Theis, F.J. An automatic method for robust and fast cell detection in bright field images from high-throughput microscopy. BMC Bioinform. 2013, 14, 297. [Google Scholar] [CrossRef] [PubMed]
- Kelly, B.S.; Levy, J.G.; Sikora, L. The use of the enzyme-linked immunosorbent assay (ELISA) for the detection and quantification of specific antibody from cell cultures. Immunology 1979, 37, 45–52. [Google Scholar] [PubMed]
- Reagan, M.R.; Kaplan, D.L. Concise Review: Mesenchymal Stem Cell Tumor-Homing: Detection Methods in Disease Model Systems. Stem Cells 2011, 29, 920–927. [Google Scholar] [CrossRef] [PubMed]
- Deans, R.J.; Moseley, A.B. Mesenchymal stem cells: Biology and potential clinical uses. Exp. Hematol. 2000, 28, 875–884. [Google Scholar] [CrossRef]
- Zhao, X.; Hilliard, L.R.; Mechery, S.J.; Wang, Y.; Bagwe, R.P.; Jin, S.; Tan, W. A rapid bioassay for single bacterial cell quantitation using bioconjugated nanoparticles. Proc. Natl. Acad. Sci. USA 2004, 101, 15027–15032. [Google Scholar] [CrossRef] [PubMed]
- Edgar, R.; McKinstry, M.; Hwang, J.; Oppenheim, A.B.; Fekete, R.A.; Giulian, G.; Merril, C.; Nagashima, K.; Adhya, S. High-sensitivity bacterial detection using biotin-tagged phage and quantum-dot nanocomplexes. Proc. Natl. Acad. Sci. USA 2006, 103, 4841–4845. [Google Scholar] [CrossRef]
- Alunni-Fabbroni, M.; Sandri, M.T. Circulating tumour cells in clinical practice: Methods of detection and possible characterization. Methods 2010, 50, 289–297. [Google Scholar] [CrossRef]
- Nebe-Von-Caron, G.; Stephens, P.; Hewitt, C.; Powell, J.; Badley, R.A. Analysis of bacterial function by multi-colour fluorescence flow cytometry and single cell sorting. J. Microbiol. Methods 2000, 42, 97–114. [Google Scholar] [CrossRef] [PubMed]
- Cho, S.H.; Chen, C.H.; Tsai, F.S.; Godin, J.M.; Lo, Y.-H. Human mammalian cell sorting using a highly integrated micro-fabricated fluorescence-activated cell sorter (μFACS). Lab Chip 2010, 10, 1567–1573. [Google Scholar] [CrossRef]
- Bin Lim, S.; Menon, N.V.; Lim, C.T. Microfluidic tools for probing micro-culprits. EMBO Rep. 2020, 21, e49749. [Google Scholar]
- Lee, G.H.; Kim, S.H.; Ahn, K.; Lee, S.H.; Park, J.Y. Separation and sorting of cells in microsystems using physical principles. J. Micromech. Microeng. 2015, 26, 013003. [Google Scholar] [CrossRef]
- Oomen, P.E.; Aref, M.A.; Kaya, I.; Phan, N.T.N.; Ewing, A.G. Chemical Analysis of Single Cells. Anal. Chem. 2019, 91, 588–621. [Google Scholar] [CrossRef]
- He, C.K.; Chen, Y.W.; Wang, S.H.; Hsu, C.H. Hydrodynamic shuttling for deterministic high-efficiency multiple single-cell capture in a microfluidic chip. Lab Chip 2019, 19, 1370–1377. [Google Scholar] [CrossRef]
- Piya, R.; Zhu, Y.; Soeriyadi, A.H.; Silva, S.M.; Reece, P.J.; Gooding, J.J. Micropatterning of porous silicon B ragg reflectors with poly(ethylene glycol) to fabricate cell microarrays: Towards single cell sensing. Biosens. Bioelectron. 2019, 127, 229–235. [Google Scholar] [CrossRef]
- Davis-Marcisak, E.F.; Deshpande, A.; Stein-O’Brien, G.L.; Ho, W.J.; Laheru, D.; Jaffee, E.M.; Fertig, E.J.; Kagohara, L.T. From bench to bedside: Single-cell analysis for cancer immunotherapy. Cancer Cell 2021, 39, 1062–1080. [Google Scholar] [CrossRef]
- Luo, G.; Gao, Q.; Zhang, S.; Yan, B. Probing infectious disease by single-cell RNA sequencing: Progresses and perspectives. Comput. Struct. Biotechnol. J. 2020, 18, 2962–2971. [Google Scholar] [CrossRef] [PubMed]
- Lin, W.N.; Tay, M.Z.; Lu, R.; Liu, Y.; Chen, C.; Cheow, L.F. The Role of Single-Cell Technology in the Study and Control of Infectious Diseases. Cells 2020, 9, 1440. [Google Scholar] [CrossRef]
- Li, M.; Liu, H.; Zhuang, S.; Goda, K. Droplet flow cytometry for single-cell analysis. RSC Adv. 2021, 11, 20944–20960. [Google Scholar] [CrossRef]
- Taylor, M.J.; Lukowski, J.K.; Anderton, C.R. Spatially Resolved Mass Spectrometry at the Single Cell: Recent Innovations in Proteomics and Metabolomics. J. Am. Soc. Mass Spectrom. 2021, 32, 872–894. [Google Scholar] [CrossRef] [PubMed]
- Mikami, H.; Lei, C.; Nitta, N.; Sugimara, T.; Ito, T.; Ozeki, Y.; Goda, K. High-Speed Imaging Meets Single-Cell Analysis. Chem 2018, 4, 2278–2300. [Google Scholar] [CrossRef]
- Robin, J.D.; Wright, W.E.; Zou, Y.; Cossette, S.A.; Lawlor, M.W.; Gussoni, E. Isolation and Immortalization of Patient-derived Cell Lines from Muscle Biopsy for Disease Modeling. J. Vis. Exp. 2015, 95, 52307. [Google Scholar] [CrossRef]
- Uchida, N.; Buck, D.W.; He, D.; Reitsma, M.J.; Masek, M.; Phan, T.V.; Tsukamoto, A.S.; Gage, F.H.; Weissman, I.L. Direct isolation of human central nervous system stem cells. Proc. Natl. Acad. Sci. USA 2000, 97, 14720–14725. [Google Scholar] [CrossRef]
- Klein, D.; Weißhardt, P.; Kleff, V.; Jastrow, H.; Jakob, H.G.; Ergün, S. Vascular wall-resident CD44+ multipotent stem cells give rise to pericytes and smooth muscle cells and contribute to new vessel maturation. PLoS ONE 2011, 6, e20540. [Google Scholar] [CrossRef]
- Eschenhagen, T.; Fink, C.; Remmers, U.; Scholz, H.; Wattchow, J.; Weil, J.; Zimmermann, W.; Dohmen, H.H.; Schäfer, H.; Bishopric, N.; et al. Three-dimensional reconstitution of embryonic cardiomyocytes in a collagen matrix: A new heart muscle model system. FASEB J. 1997, 11, 683–694. [Google Scholar] [CrossRef] [PubMed]
- Hamburger, A.W.; Dunn, F.E.; White, C.P. Percoll density gradient separation of cells from human malignant effusions. Br. J. Cancer 1985, 51, 253–258. [Google Scholar] [CrossRef]
- Zuk, P.A.; Zhu, M.; Ashjian, P.; Ugarte, D.A.D.; Huang, J.I.; Mizuno, H.; Alfonso, Z.C.; Fraser, J.K.; Benhaim, P.; Hedrick, M.H. Human Adipose Tissue Is a Source of Multipotent Stem Cells. Mol. Biol. Cell 2002, 13, 4279–4295. [Google Scholar] [CrossRef]
- Emmert-Buck, M.R.; Bonner, R.F.; Smith, P.D.; Chuaqui, R.F.; Zhuang, Z.; Goldstein, S.R.; Weiss, R.A.; Liotta, L.A. Laser Capture Microdissection. Science 1996, 274, 998–1001. [Google Scholar] [CrossRef]
- Yi, C.; Li, C.W.; Ji, S.; Yang, M. Microfluidics technology for manipulation and analysis of biological cells. Anal. Chim. Acta 2006, 560, 1–23. [Google Scholar] [CrossRef]
- Hattersley, S.M.; Dyer, C.E.; Greenman, J.; Haswell, S.J. Development of a microfluidic device for the maintenance and interrogation of viable tissue biopsies. Lab Chip 2008, 8, 1842–1846. [Google Scholar] [CrossRef] [PubMed]
- Qiu, X.; De Jesus, J.; Pennell, M.; Troiani, M.; Haun, J.B. Microfluidic device for mechanical dissociation of cancer cell aggregates into single cells. Lab Chip 2014, 15, 339–350. [Google Scholar] [CrossRef] [PubMed]
- Mazutis, L.; Gilbert, J.; Ung, W.L.; Weitz, D.A.; Griffiths, A.D.; Heyman, J.A. Single-cell analysis and sorting using droplet-based microfluidics. Nat. Protoc. 2013, 8, 870–891. [Google Scholar] [CrossRef] [PubMed]
- Edd, J.F.; Carlo, D.D.; Humphry, K.J.; Köster, S.; Irimia, D.; Weitz, D.A.; Toner, M. Controlled encapsulation of single-cells into monodisperse picolitre drops. Lab Chip 2008, 8, 1262–1264. [Google Scholar] [CrossRef]
- Kemna, E.W.M.; Schoeman, R.M.; Wolbers, F.; Vermes, I.; Weitz, D.A.; Berg, A.v.d. High-yield cell ordering and deterministic cell-in-droplet encapsulation using Dean flow in a curved microchannel. Lab Chip 2012, 12, 2881–2887. [Google Scholar] [CrossRef]
- Rettig, J.R.; Folch, A. Large-scale single-cell trapping and imaging using microwell arrays. Anal. Chem. 2005, 77, 5628–5634. [Google Scholar] [CrossRef] [PubMed]
- Wang, X.; Chen, S.; Kong, M.; Wang, Z.; Costa, K.D.; Li, R.A.; Sun, D. Enhanced cell sorting and manipulation with combined optical tweezer and microfluidic chip technologies. Lab Chip 2011, 11, 3656–3662. [Google Scholar] [CrossRef]
- Lee, D.-H.; Li, X.; Ma, N.; Digman, M.A.; Lee, A.P. Rapid and label-free identification of single leukemia cells from blood in a high-density microfluidic trapping array by fluorescence lifetime imaging microscopy. Lab Chip 2018, 18, 1349–1358. [Google Scholar] [CrossRef]
- Yang, H.; Li, H.; Xu, D. High-density micro-well array with aptamer-silver conjugates for cell sorting and imaging at single cells. Anal. Chim. Acta 2019, 1063, 127–135. [Google Scholar] [CrossRef]
- Li, P.C.H.; Harrison, D.J. Transport, Manipulation, and Reaction of Biological Cells On-Chip Using Electrokinetic Effects. Anal. Chem. 1997, 69, 1564–1566. [Google Scholar] [CrossRef] [PubMed]
- Huang, L.; Bian, S.; Cheng, Y.; Shi, G.; Liu, P.; Ye, X.; Wang, W. Microfluidics cell sample preparation for analysis: Advances in efficient cell enrichment and precise single cell capture. Biomicrofluidics 2017, 11, 011501. [Google Scholar] [CrossRef] [PubMed]
- Wheeler, A.R.; Throndset, W.R.; Whelan, R.J.; Leach, A.M.; Zare, R.N.; Liao, Y.H.; Farrell, K.; Manger, I.D.; Daridon, A. Microfluidic device for single-cell analysis. Anal. Chem. 2003, 75, 3581–3586. [Google Scholar] [CrossRef] [PubMed]
- Li, X.; Li, P.C.H. Microfluidic Selection and Retention of a Single Cardiac Myocyte, On-Chip Dye Loading, Cell Contraction by Chemical Stimulation, and Quantitative Fluorescent Analysis of Intracellular Calcium. Anal. Chem. 2005, 77, 4315–4322. [Google Scholar] [CrossRef] [PubMed]
- Kobel, S.; Valero, A.; Latt, J.; Renaud, P.; Lutolf, M. Optimization of microfluidic single cell trapping for long-term on-chip culture. Lab Chip 2010, 10, 857–863. [Google Scholar] [CrossRef]
- Park, H.; Kim, D.; Yun, K.S. Single-cell manipulation on microfluidic chip by dielectrophoretic actuation and impedance detection. Sens. Actuators B Chem. 2010, 150, 167–173. [Google Scholar] [CrossRef]
- Benavente-Babace, A.; Gallego-Pérez, D.; Hansford, D.J.; Arana, S.; Pérez-Lorenzo, E.; Mujika, M. Single-cell trapping and selective treatment via co-flow within a microfluidic platform. Biosens. Bioelectron. 2014, 61, 298–305. [Google Scholar] [CrossRef]
- Mitterboeck, R.; Kokkinis, G.; Berris, T.; Keplinger, F.; Giouroudi, I. Magnetic microfluidic system for isolation of single cells. Bio-MEMS Med. Microdevices II 2015, 9518, 37–45. [Google Scholar] [CrossRef]
- Mak, W.C.; Cheung, K.Y.; Trau, D. Diffusion Controlled and Temperature Stable Microcapsule Reaction Compartments for High-Throughput Microcapsule-PCR. Adv. Funct. Mater. 2008, 18, 2930–2937. [Google Scholar] [CrossRef]
- Leong, T.S.H.; Martin, G.J.O.; Ashokkumar, M. Ultrasonic encapsulation—A review. Ultrason. Sonochem. 2017, 35, 605–614. [Google Scholar] [CrossRef]
- Ramji, R.; Wang, M.; Bhagat, A.A.S.; Weng, D.T.S.; Thakor, N.V.; Lim, C.T.; Chen, C.H. Single cell kinase signaling assay using pinched flow coupled droplet microfluidics. Biomicrofluidics 2014, 8, 034104. [Google Scholar] [CrossRef] [PubMed] [Green Version]
- Song, H.; Tice, J.D.; Ismagilov, R.F. A Microfluidic System for Controlling Reaction Networks in Time. Angew. Chemie Int. Ed. 2003, 42, 768–772. [Google Scholar] [CrossRef]
- Guo, M.T.; Rotem, A.; Heyman, J.A.; Weitz, D.A. Droplet microfluidics for high-throughput biological assays. Lab Chip 2012, 12, 2146–2155. [Google Scholar] [CrossRef]
- Ackerman, C.M.; Thakku, S.G.; Freije, C.A.; Metsky, H.C.; Yang, D.K.; Ye, S.H.; Boehm, C.K.; Kosoko-Thoroddsen, T.F.; Kehe, J.; Nguyen, T.G. Massively multiplexed nucleic acid detection with Cas13. Nature 2020, 582, 277–282. [Google Scholar] [CrossRef]
- Miller, T.E.; Bebeyton, T.; Schwander, T.; Diehl, C.; Girault, M.; Mclean, R.; Chotel, T.; Claus, P.; Cortina, N.S.; Baret, J. Light-powered CO2 fixation in a chloroplast mimic with natural and synthetic parts. Science 2020, 368, 649–654. [Google Scholar] [CrossRef]
- Chabert, M.; Viovy, J.L. Microfluidic high-throughput encapsulation and hydrodynamic self-sorting of single cells. Proc. Natl. Acad. Sci. USA 2018, 105, 3191–3196. [Google Scholar] [CrossRef]
- Teh, S.Y.; Lin, R.; Hung, L.H.; Lee, A.P. Droplet microfluidics. Lab Chip 2008, 8, 198–220. [Google Scholar] [CrossRef]
- Thorsen, T.; Roberts, R.W.; Arnold, F.H.; Quake, S.R. Dynamic Pattern Formation in a Vesicle-Generating Microfluidic Device. Phys. Rev. Lett. 2001, 86, 4163. [Google Scholar] [CrossRef] [PubMed]
- Clausell-Tormos, J.; Lieber, D.; Baret, J.; El-Harrak, A.; Miller, O.J.; Frenz, L.; Blouwolff, J.; Humphry, K.J.; Köster, S.; Duan, H.; et al. Droplet-Based Microfluidic Platforms for the Encapsulation and Screening of Mammalian Cells and Multicellular Organisms. Chem. Biol. 2008, 15, 427–437. [Google Scholar] [CrossRef] [PubMed]
- Anna, S.L.; Bontoux, N.; Stone, H.A. Formation of dispersions using “flow focusing” in microchannels. Appl. Phys. Lett. 2003, 82, 364. [Google Scholar] [CrossRef]
- Wong, A.H.H.; Li, H.; Jia, Y.; Mak, P.I.; Martins, R.P.S.; Liu, Y.; Vong, C.M.; Wong, H.C.; Wong, P.K.; Wang, H. Drug screening of cancer cell lines and human primary tumors using droplet microfluidics. Sci. Rep. 2017, 7, 9109. [Google Scholar] [CrossRef] [Green Version]
- Navi, M.; Abbasi, N.; Jeyhani, M.; Gnyawali, V.; Tsai, S.S.H. Microfluidic diamagnetic water-in-water droplets: A biocompatible cell encapsulation and manipulation platform. Lab Chip 2018, 18, 3361–3370. [Google Scholar] [CrossRef]
- Nan, L.; Yang, Z.; Lyu, H.; Lau, K.Y.Y.; Shum, H.C. A Microfluidic System for One-Chip Harvesting of Single-Cell-Laden Hydrogels in Culture Medium. Adv. Biosyst. 2019, 3, 1900076. [Google Scholar] [CrossRef] [PubMed]
- Nan, L.; Lai, M.Y.A.; Tang, M.U.H.; Chan, Y.K.; Poon, L.L.M.; Shum, H.C. On-Demand Droplet Collection for Capturing Single Cells. Small 2020, 16, 1902889. [Google Scholar] [CrossRef] [PubMed]
- Pohl, H.A. The Motion and Precipitation of Suspensoids in Divergent Electric Fields. J. Appl. Phys. 2004, 22, 869. [Google Scholar] [CrossRef]
- Pohl, H.A.; Crane, J.S. Dielectrophoretic force. J. Theor. Biol. 1972, 37, 1–13. [Google Scholar] [CrossRef]
- Çetin, B.; Li, D. Dielectrophoresis in microfluidics technology. Electrophoresis 2011, 32, 2410–2427. [Google Scholar] [CrossRef]
- Gascoyne, P.R.C.; Vykoukal, J. Particle separation by dielectrophoresis. Electrophoresis 2002, 23, 1973. [Google Scholar] [CrossRef]
- Li, M.; Li, W.; Zhang, J.; Alici, G.; Wen, W. A review of microfabrication techniques and dielectrophoretic microdevices for particle manipulation and separation. J. Phys. D Appl. Phys. 2014, 47, 063001. [Google Scholar] [CrossRef]
- Cheng, I.F.; Froude, V.E.; Zhu, Y.; Chang, H.C.; Chang, H.C. A continuous high-throughput bioparticle sorter based on 3D traveling-wave dielectrophoresis. Lab Chip 2009, 9, 3193–3201. [Google Scholar] [CrossRef]
- Melvin, E.M.; Moore, B.R.; Gilchrist, K.H.; Grego, S.; Velev, O.D. On-chip collection of particles and cells by AC electroosmotic pumping and dielectrophoresis using asymmetric microelectrodes. Biomicrofluidics 2011, 5, 034113. [Google Scholar] [CrossRef] [Green Version]
- Song, H.; Rosano, J.M.; Wang, Y.; Garson, C.J.; Prabhakarpandian, B.; Pant, K.; Klarmann, G.J.; Perantoni, A.; Alvarez, L.M.; Lai, E. Continuous-flow sorting of stem cells and differentiation products based on dielectrophoresis. Lab Chip 2015, 15, 1320–1328. [Google Scholar] [CrossRef] [PubMed]
- LaLonde, A.; Romero-Creel, M.F.; Saucedo-Espinosa, M.A.; Lapizco-Encinas, B.H. Isolation and enrichment of low abundant particles with insulator-based dielectrophoresis. Biomicrofluidics 2015, 9, 064113. [Google Scholar] [CrossRef] [PubMed]
- Khamenehfar, A.; Beischlag, T.V.; Russell, P.J.; Ling, M.T.P.; Nelson, C.; Li, P.C.H. Label-free isolation of a prostate cancer cell among blood cells and the single-cell measurement of drug accumulation using an integrated microfluidic chip. Biomicrofluidics 2015, 9, 064104. [Google Scholar] [CrossRef]
- Khamenehfar, A.; Gandhi, M.K.; Chen, Y.; Hogge, D.E.; Li, P.C.H. Dielectrophoretic Microfluidic Chip Enables Single-Cell Measurements for Multidrug Resistance in Heterogeneous Acute Myeloid Leukemia Patient Samples. Anal. Chem. 2016, 88, 5680–5688. [Google Scholar] [CrossRef]
- Demircan Yalçın, Y.; Töral, T.B.; Sukas, S.; Yıldırım, Y.; Zorlu, O.; Gündüz, U.; Külah, H. A microfluidic device enabling drug resistance analysis of leukemia cells via coupled dielectrophoretic detection and impedimetric counting. Sci. Rep. 2021, 11, 13193. [Google Scholar] [CrossRef]
- Zhang, Y.; Nguyen, N.T. Magnetic digital microfluidics—A review. Lab Chip 2017, 17, 994–1008. [Google Scholar] [CrossRef]
- Zhou, Y.; Wang, Y.; Lin, Q. A Microfluidic Device for Continuous-Flow Magnetically Controlled Capture and Isolation of Microparticles. J. Microelectromech. Syst. 2010, 19, 743–751. [Google Scholar] [CrossRef]
- Hoshino, K.; Huang, Y.Y.; Lane, N.; Huebschman, M.; Uhr, J.W.; Frenkel, E.P.; Zhang, X. Microchip-based immunomagnetic detection of circulating tumor cells. Lab Chip 2011, 11, 3449–3457. [Google Scholar] [CrossRef] [PubMed]
- Furlani, E.P. Magnetophoretic separation of blood cells at the microscale. J. Phys. D Appl. Phys. 2007, 40, 1313. [Google Scholar] [CrossRef]
- Nam, J.; Huang, H.; Lim, H.; Lim, C.; Shin, S. Magnetic separation of malaria-infected red blood cells in various developmental stages. Anal. Chem. 2013, 85, 7316–7323. [Google Scholar] [CrossRef] [PubMed]
- Wyatt Shields, C.; Livingston, C.E.; Yellen, B.B.; López, G.P.; Murdoch, D.M. Magnetographic array for the capture and enumeration of single cells and cell pairs. Biomicrofluidics 2014, 8, 041101. [Google Scholar] [CrossRef]
- Yousuff, C.M.; Ho, E.T.W.; Hussain K, I.; Hamid, N.H.B. Microfluidic Platform for Cell Isolation and Manipulation Based on Cell Properties. Micromachines 2017, 8, 15. [Google Scholar] [CrossRef]
- Ding, X.; Lin, S.C.S.; Kiraly, B.; Yue, H.; Li, S.; Chiang, I.K.; Shi, J.; Benkovic, S.J.; Huang, T.J. On-chip manipulation of single microparticles, cells, and organisms using surface acoustic waves. Proc. Natl. Acad. Sci. USA 2012, 109, 11105–11109. [Google Scholar] [CrossRef]
- Wyatt Shields Iv, C.; Reyes, C.D.; López, G.P. Microfluidic cell sorting: A review of the advances in the separation of cells from debulking to rare cell isolation. Lab Chip 2015, 15, 1230–1249. [Google Scholar] [CrossRef]
- Baudoin, M.; Thomas, J.L.; Sahely, R.A.; Gerbedoen, J.C.; Gong, Z.; Sivery, A.; Matar, O.B.; Smagin, N.; Favreau, P.; Vlandas, A. Spatially selective manipulation of cells with single-beam acoustical tweezers. Nat. Commun. 2020, 11, 4244. [Google Scholar] [CrossRef] [PubMed]
- Augustsson, P.; Magnusson, C.; Nordin, M.; Lilja, H.; Laurell, T. Microfluidic, label-free enrichment of prostate cancer cells in blood based on acoustophoresis. Anal. Chem. 2012, 84, 7954–7962. [Google Scholar] [CrossRef] [PubMed]
- Guo, F.; Mao, Z.; Chen, Y.; Xie, J.; Lata, J.P.; Li, P.; Ren, L.; Yang, J.; Dao, M.; Suresh; et al. Three-dimensional manipulation of single cells using surface acoustic waves. Proc. Natl. Acad. Sci. USA 2016, 113, 1522–1527. [Google Scholar] [CrossRef] [PubMed]
- Hwang, J.Y.; Kim, J.; Park, J.M.; Lee, C.; Jung, H.; Lee, J.; Shung, K.K. Cell Deformation by Single-beam Acoustic Trapping: A Promising Tool for Measurements of Cell Mechanics. Sci. Rep. 2016, 6, 27238. [Google Scholar] [CrossRef]
- Magnusson, C.; Augustsson, P.; Lenshof, A.; Ceder, Y.; Laurell, T.; Lilja, H. Clinical-Scale Cell-Surface-Marker Independent Acoustic Microfluidic Enrichment of Tumor Cells from Blood. Anal. Chem. 2017, 89, 11954–11961. [Google Scholar] [CrossRef]
- Undvall Anand, E.; Magnusson, C.; Lenshof, A.; Ceder, y.; Lilja, H.; Laurell, T. Two-Step Acoustophoresis Separation of Live Tumor Cells from Whole Blood. Anal. Chem. 2021, 93, 17076–17085. [Google Scholar] [CrossRef]
- Ashkin, A. Acceleration and Trapping of Particles by Radiation Pressure. Phys. Rev. Lett. 1970, 24, 156–159. [Google Scholar] [CrossRef]
- Zhang, H.; Liu, K.K. Optical tweezers for single cells. J. R. Soc. Interface 2008, 5, 671–690. [Google Scholar] [CrossRef]
- Hu, X.; Zhu, D.; Chen, M.; Chen, K.; Liu, H.; Liu, W.; Yang, Y. Precise and non-invasive circulating tumor cell isolation based on optical force using homologous erythrocyte binding. Lab Chip 2019, 19, 2549–2556. [Google Scholar] [CrossRef]
- Liberale, C.; Cojoc, G.; Bragheri, F.; Mibizioni, P.; Perzziello, G.; Rocca, R.L.; Ferrara, L.; Rajaanickam, V.; Fabrizio, E.D.; Cristiani, I. Integrated microfluidic device for single-cell trapping and spectroscopy. Sci. Rep. 2013, 3, 1258. [Google Scholar] [CrossRef] [PubMed]
- Fang, T.; Shang, W.; Liu, C.; Xu, J.; Zhao, D.; Liu, Y.; Ye, A. Nondestructive identification and accurate isolation of single cells through a chip with raman optical tweezers. Anal. Chem. 2019, 91, 9932–9939. [Google Scholar] [CrossRef] [PubMed]
- Fang, T.; Shang, W.; Liu, C.; Liu, Y.; Ye, A. Single-Cell Multimodal Analytical Approach by Integrating Raman Optical Tweezers and RNA Sequencing. Anal. Chem. 2020, 92, 10433–10441. [Google Scholar] [CrossRef] [PubMed]
- Borile, G.; Rossi, S.; Filippi, A.; Gazzola, E.; Capaldo, P.; Tregnago, C.; Pigazzi, M.; Romanato, F. Label-free, real-time on-chip sensing of living cells via grating-coupled surface plasmon resonance. Biophys. Chem. 2019, 254, 106262. [Google Scholar] [CrossRef]
- Sugai, H.; Tomita, S.; Ishihara, S.; Yoshioka, K.; Kurita, R. Microfluidic Sensing System with a Multichannel Surface Plasmon Resonance Chip: Damage-Free Characterization of Cells by Pattern Recognition. Anal. Chem. 2020, 92, 14939–14946. [Google Scholar] [CrossRef]
- Willner, M.R.; McMillan, K.S.; Graham, D.; Vikesland, P.J.; Zagnoni, M. Surface-Enhanced Raman Scattering Based Microfluidics for Single-Cell Analysis. Anal. Chem. 2018, 90, 12004–12010. [Google Scholar] [CrossRef]
- Dina, N.E.; Zhou, H.; Colniţă, A.; Leopold, N.; Szoke-Nagy, T.; Coman, C.; Haisch, C. Rapid single-cell detection and identification of pathogens by using surface-enhanced Raman spectroscopy. Analyst 2017, 142, 1782–1789. [Google Scholar] [CrossRef]
- Jabbar, A.A.; Alwan, A.M.; Zayer, M.Q.; Bohan, A.J. Efficient single cell monitoring of pathogenic bacteria using bimetallic nanostructures embedded in gradient porous silicon. Mater. Chem. Phys. 2020, 241, 122359. [Google Scholar] [CrossRef]
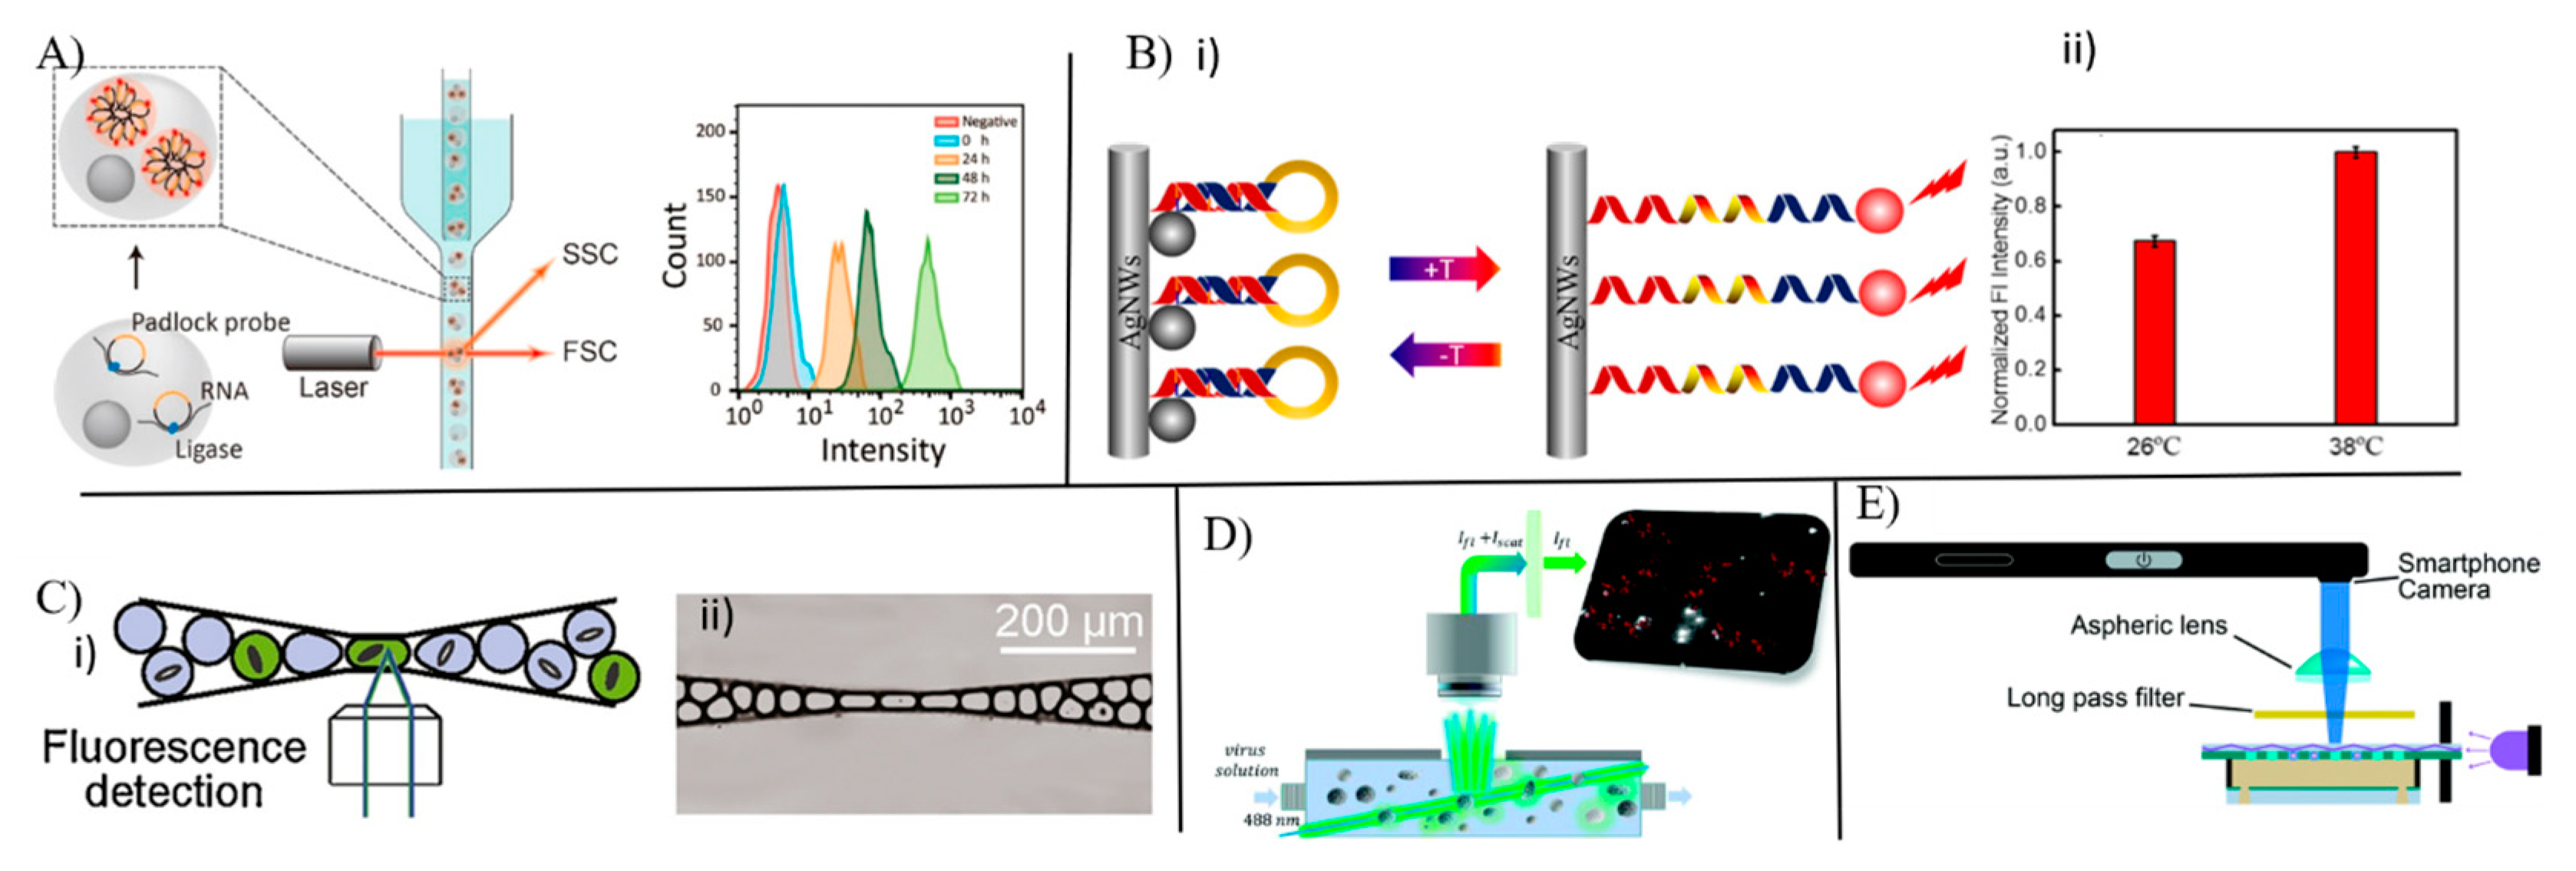
- Bu, C.; Mu, L.; Cao, X.; Chen, M.; She, G.; Shi, W. Silver Nanowire-Based Fluorescence Thermometer for a Single Cell. ACS Appl. Mater. Interfaces 2018, 10, 33416–33422. [Google Scholar] [CrossRef]
- Szakács, Z.; Mészáros, T.; de Jonge, M.I.; Gyurcsányi, R.E. Selective counting and sizing of single virus particles using fluorescent aptamer-based nanoparticle tracking analysis. Nanoscale 2018, 10, 13942–13948. [Google Scholar] [CrossRef]
- Minagawa, Y.; Ueno, H.; Tabata, K.V.; Noji, H. Mobile imaging platform for digital influenza virus counting. Lab Chip 2019, 19, 2678–2687. [Google Scholar] [CrossRef]
- Banoth, E.; Kasula, V.K.; Gorthi, S.S. Portable optofluidic absorption flow analyzer for quantitative malaria diagnosis from whole blood. Appl. Opt. 2016, 55, 8637–8643. [Google Scholar] [CrossRef]
- Duncombe, T.A.; Ponti, A.; Seebeck, F.P.; Dittrich, P.S. UV–Vis Spectra-Activated Droplet Sorting for Label-Free Chemical Identification and Collection of Droplets. Anal. Chem. 2021, 93, 13008–13013. [Google Scholar] [CrossRef] [PubMed]
- Obořilová, R.; Šimečková, H.; Pastucha, M.; Klimovič, Š.; Víšová, I.; Přibyl, J.; Vaisocherová-Lísalová, H.; Pantůček, R.; Skládal, P.; Mašlaňová, I.; et al. Atomic force microscopy and surface plasmon resonance for real-time single-cell monitoring of bacteriophage-mediated lysis of bacteria. Nanoscale 2021, 13, 13538–13549. [Google Scholar] [CrossRef]
- Wang, W.; Wang, S.; Liu, Q.; Wu, J.; Tao, N. Mapping single-cell–substrate interactions by surface plasmon resonance microscopy. Langmuir 2012, 28, 13373–13379. [Google Scholar] [CrossRef]
- Peterson, A.W.; Halter, M.; Tona, A.; Plant, A.L. High resolution surface plasmon resonance imaging for single cells. BMC Cell Biol. 2014, 15, 35. [Google Scholar] [CrossRef]
- Pipatpanukul, C.; Takeya, S.; Baba, A.; Amarit, R.; Somboonkaew, A.; Sutapun, B.; Kitpoka, P.; Kunakorn, M.; Srikhirin, T. Rh blood phenotyping (D, E, e, C, c) microarrays using multichannel surface plasmon resonance imaging. Biosens. Bioelectron. 2018, 102, 267–275. [Google Scholar] [CrossRef]
- Peungthum, P.; Sudprasert, K.; Amarit, R.; Somboonkaew, A.; Sutapun, B.; Vongsakulyanon, A.; Seedacoon, W.; Kitpoka, P.; Kunakorn, M.; Srikhirin, T. Surface plasmon resonance imaging for ABH antigen detection on red blood cells and in saliva: Secretor status-related ABO subgroup identification. Analyst 2017, 142, 1471–1481. [Google Scholar] [CrossRef] [PubMed]
- Wang, S.; Shan, X.; Patel, U.; Huang, X.; Lu, J.; Li, J.; Tao, N. Label-free imaging, detection, and mass measurement of single viruses by surface plasmon resonance. Proc. Natl. Acad. Sci. USA 2010, 107, 16028–16032. [Google Scholar] [CrossRef]
- Yu, H.; Shan, X.; Wang, S.; Tao, N. Achieving High Spatial Resolution Surface Plasmon Resonance Microscopy with Image Reconstruction. Anal. Chem. 2017, 89, 2704–2707. [Google Scholar] [CrossRef]
- Zhang, Q.; Zhang, P.; Gou, H.; Mou, C.; Huang, W.E.; Yang, M.; Xu, J.; Ma, B. Towards high-throughput microfluidic Raman-activated cell sorting. Analyst 2015, 140, 6163–6174. [Google Scholar] [CrossRef]
- Yan, S.; Qiu, J.; Guo, L.; Li, D.; Xu, D.; Liu, Q. Development overview of Raman-activated cell sorting devoted to bacterial detection at single-cell level. Appl. Microbiol. Biotechnol. 2021, 105, 1315–1331. [Google Scholar] [CrossRef] [PubMed]
- Wang, X.; Xin, Y.; Ren, L.; Sun, Z.; Zhu, P.; Ji, Y.; Li, C.; Xu, J.; Ma, B. Positive dielectrophoresis-based Raman-activated droplet sorting for culture-free and label-free screening of enzyme function in vivo. Sci. Adv. 2020, 6, 3521–3528. [Google Scholar] [CrossRef]
- Cong, L.; Wang, J.; Li, X.; Tian, Y.; Xu, S.; Liang, C.; Xu, W.; Wang, W.; Xu, S. Microfluidic Droplet-SERS Platform for Single-Cell Cytokine Analysis via a Cell Surface Bioconjugation Strategy. Anal. Chem. 2022, 94, 10375–10383. [Google Scholar] [CrossRef]
- Rahman, A.; Kang, S.; Wang, W.; Huang, Q.; Kim, I.; Vikesland, P.J. Lectin-Modified Bacterial Cellulose Nanocrystals Decorated with Au Nanoparticles for Selective Detection of Bacteria Using Surface-Enhanced Raman Scattering Coupled with Machine Learning. ACS Appl. Nano Mater. 2022, 5, 259–268. [Google Scholar] [CrossRef]
- Sai, V.V.R.; Kundu, T.; Deshmukh, C.; Titus, S.; Kumar, P.; Mukherji, S. Label-free fiber optic biosensor based on evanescent wave absorbance at 280 nm. Sens. Actuators B Chem. 2010, 143, 724–730. [Google Scholar] [CrossRef]
- Ke, R.; Lin, C.; Wu, P.; Chen, X.; Zhao, Y.; Li, Y.; Chen, L.; Nilsson, M.; Ke, R. Single cell RNA expression analysis using flow cytometry based on specific probe ligation and rolling circle amplification. ACS Sens. 2020, 5, 3031–3036. [Google Scholar]
- Feng, G.; Zhang, H.; Zhu, X.; Zhang, J.; Fang, J. Fluorescence thermometers: Intermediation of fundamental temperature and light. Biomater. Sci. 2022, 10, 1855–1882. [Google Scholar] [CrossRef] [PubMed]
- Mei, M.; Mu, L.; Wang, Y.; Liang, S.; Zhao, Q.; Huang, L.; She, G.; Shi, W. Simultaneous Monitoring of the Adenosine Triphosphate Levels in the Cytoplasm and Nucleus of a Single Cell with a Single Nanowire-Based Fluorescent Biosensor. Anal. Chem. 2022, 94, 11813–11820. [Google Scholar] [CrossRef] [PubMed]
- Lyu, F.; Pan, M.; Patil, S.; Wang, J.H.; Matin, A.C.; Andrews, J.R.; Tang, S.K. Phenotyping antibiotic resistance with single-cell resolution for the detection of heteroresistance. Sens. Actuators B Chem. 2018, 270, 396–404. [Google Scholar] [CrossRef]
- Lu, H.; Caen, O.; Vrignon, J.; Zonta, E.; El Harrak, Z.; Nizard, P.; Baret, J.C.; Taly, V. High throughput single cell counting in droplet-based microfluidics. Sci. Rep. 2017, 7, 1366. [Google Scholar] [CrossRef]
- Zhuang, J.; Yin, J.; Lv, S.; Wang, B.; Mu, Y. Advanced “lab-on-a-chip” to detect viruses—Current challenges and future perspectives. Biosens. Bioelectron. 2020, 163, 112291. [Google Scholar] [CrossRef] [PubMed]
- Andree, K.C.; van Dalum, G.; Terstappen, L.W. Challenges in circulating tumor cell detection by the CellSearch system. Mol. Oncol. 2016, 10, 395–407. [Google Scholar] [CrossRef]
- Zhang, X.; Liu, C.; Pei, Y.; Song, W.; Zhang, S. Preparation of a Novel Raman Probe and Its Application in the Detection of Circulating Tumor Cells and Exosomes. ACS Appl. Mater. Interfaces 2019, 11, 28671–28680. [Google Scholar] [CrossRef]
- Dutta, R.; Liba, O.; SoRelle, E.D.; Winetraub, Y.; Ramani, V.C.; Jeffrey, S.S.; Sledge, G.W.; de la Zerda, A. Real-Time Detection of Circulating Tumor Cells in Living Animals Using Functionalized Large Gold Nanorods. Nano Lett. 2019, 19, 2334–2342. [Google Scholar] [CrossRef] [PubMed]
- Abate, M.F.; Jia, S.; Ahmed, M.G.; Li, X.; Lin, L.; Chen, X.; Zhu, Z.; Yang, C. Visual Quantitative Detection of Circulating Tumor Cells with Single-Cell Sensitivity Using a Portable Microfluidic Device. Small 2019, 15, 1804890. [Google Scholar] [CrossRef]
- Zhu, L.; Feng, X.; Yang, S.; Wang, J.; Pan, Y.; Ding, J.; Li, C.; Yin, X.; Yu, Y. Colorimetric detection of immunomagnetically captured rare number CTCs using mDNA-wrapped single-walled carbon nanotubes. Biosens. Bioelectron. 2021, 172, 112780. [Google Scholar] [CrossRef]
- Lee, A.C.; Svedlund, J.; Darai, E.; Lee, Y.; Lee, D.; Lee, H.-B.; Kim, S.-M.; Kim, O.; Bae, H.J.; Choi, A.; et al. OPENchip: An on-chip in situ molecular profiling platform for gene expression analysis and oncogenic mutation detection in single circulating tumour cells. Lab Chip 2020, 20, 912–922. [Google Scholar] [CrossRef]
- Gao, Q.; Zeng, Q.; Wang, Z.; Li, C.; Xu, Y.; Cui, P.; Zhu, X.; Lu, H.; Wang, G.; Cai, S.; et al. Circulating cell-free DNA for cancer early detection. Innovation 2022, 3, 100259. [Google Scholar] [CrossRef]
- Cheng, Y.H.; Wang, C.H.; Hsu, K.F.; Lee, G.B. Integrated Microfluidic System for Cell-Free DNA Extraction from Plasma for Mutant Gene Detection and Quantification. Anal. Chem. 2022, 94, 4311–4318. [Google Scholar] [CrossRef]
- Wen, N.; Zhao, Z.; Fan, B.; Chen, D.; Men, D.; Wang, J.; Chen, J. Development of Droplet Microfluidics Enabling High-Throughput Single-Cell Analysis. Molecules 2016, 21, 881. [Google Scholar] [CrossRef] [Green Version]


| Techniques | Target | Sensing Platform | Throughput/Assay Time | Applications/Conclusion | References |
|---|---|---|---|---|---|
| SPR | Leukemia cells (SHI-1) | Grating Coupled SPR | NA | Real-time cellular studies—adhesion and external stimuli at single cell level | [98] |
| Living cells (lung and liver) | Cysteine-Derivative-Immobilized Au Films | 5 SPR sensograms in 10 min | Multichannel SPR chip for single cell characterizations | [99] | |
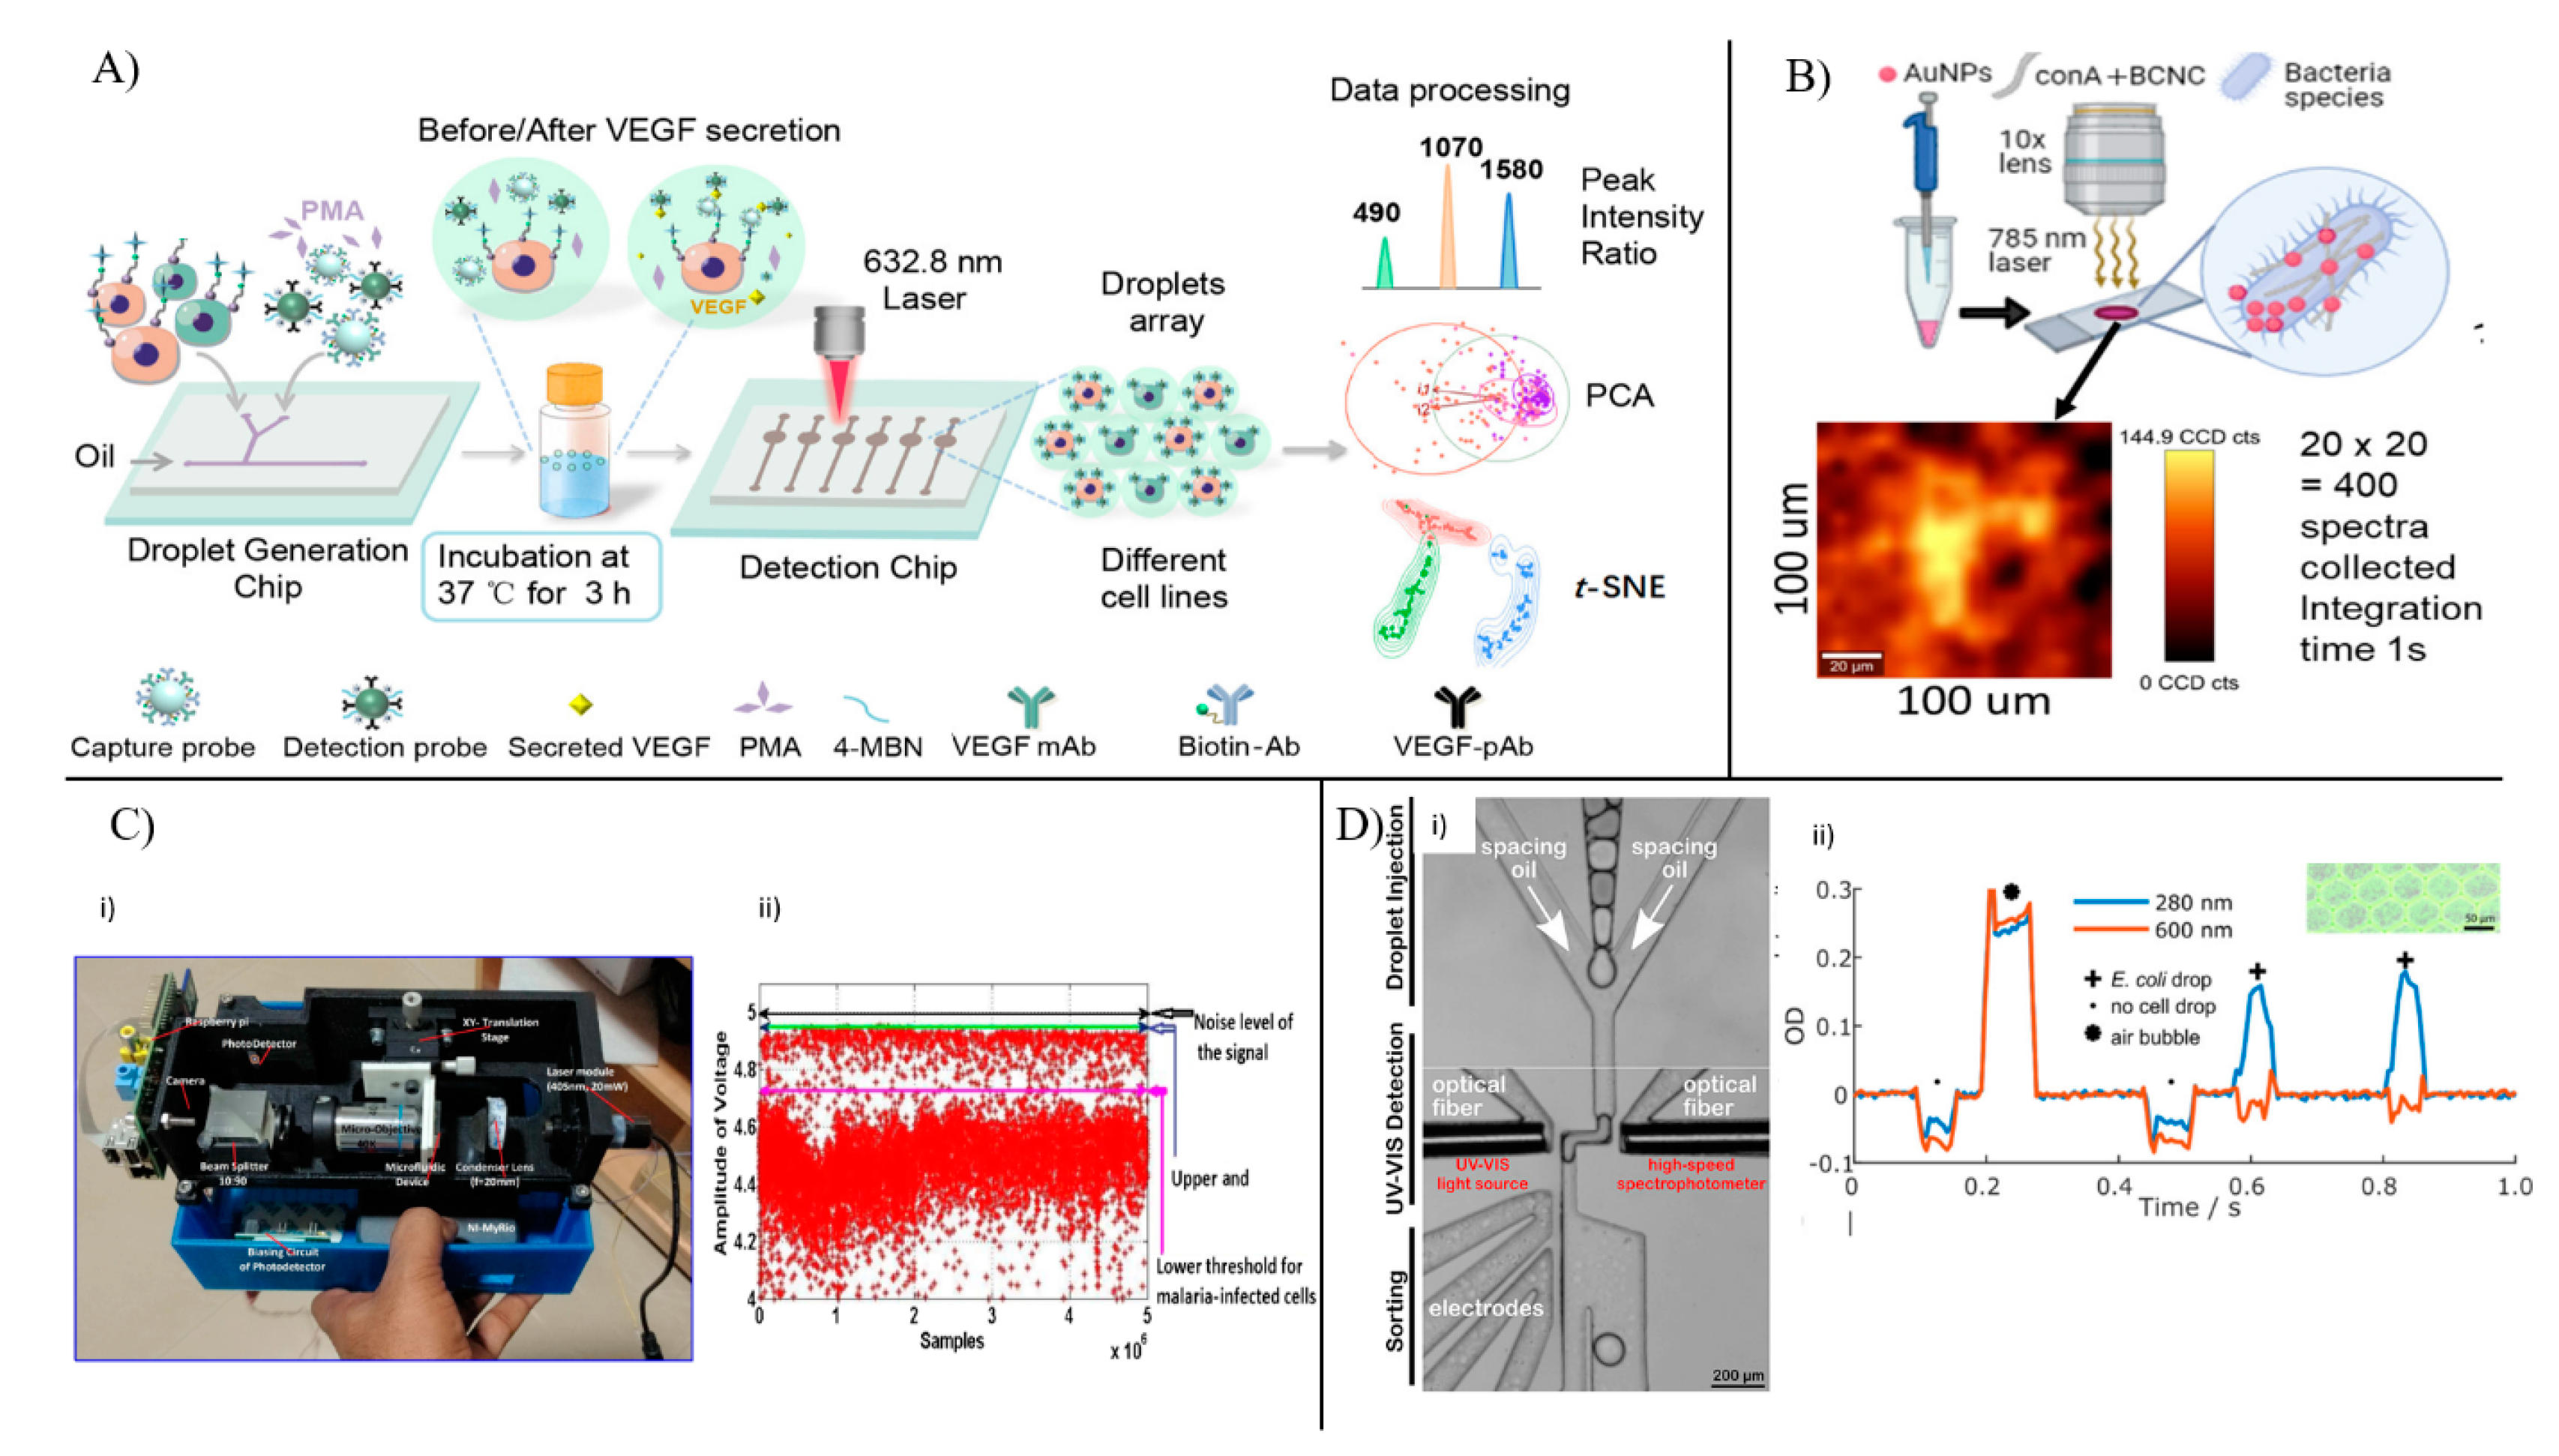
| SERS | Prostate cancer cells | Wheat germ agglutin-conjugated gold nanoparticles | ~100 cells can be imaged and analyzed together using image processing | In-droplet cell-to-cell variability analysis in terms of size and number of glycan islands on cellular membrane | [100] |
| Pathogens (E. coli, M. morganii, E. lactis, L. casei) | Silver nanoparticles | <5 min per sample | Pathogen identification and detection using spectral analysis | [101] | |
| E. coli cells | Silver and palladium bimetallic nanoparticles within porous silicon layers | 10 sec | Cell detection, quantification, and monitoring of single pathogen type | [102] | |
| Fluorometric | HeLa cells | Texas Red-tagged DNA stem–loops bound to silver nanowires | NA | Cellular temperature | [103] |
| Human respiratory syncytial virus | Fluorescent aptamers targeted towards viral glycoproteins | 6.5 μL/min | Counting and size determination of single viruses | [104] | |
| Influenza virus (IF) | 2′-(4-Methylumbelliferyl)-α-d-N-acetylneuraminic acid, a fluorogenic substrate which emits fluorescence in the presence of neuraminidase present on the viral surface. | NA | Mobile imaging platform for virus detection and counting | [105] | |
| Absorbance | Blood cells | Optofluidic platform monitoring cells at 405 nm | 2000 cells/min | Differentiating between malaria-infected and healthy cells | [106] |
| E. coli cells | Optofluidic platform monitoring cells at 280 and 600 nm | 2100 spectra/sec | In-droplet analysis by UV-visible spectra acquisition and droplet sorting | [107] |
Disclaimer/Publisher’s Note: The statements, opinions and data contained in all publications are solely those of the individual author(s) and contributor(s) and not of MDPI and/or the editor(s). MDPI and/or the editor(s) disclaim responsibility for any injury to people or property resulting from any ideas, methods, instructions or products referred to in the content. |
© 2023 by the authors. Licensee MDPI, Basel, Switzerland. This article is an open access article distributed under the terms and conditions of the Creative Commons Attribution (CC BY) license (https://creativecommons.org/licenses/by/4.0/).
Share and Cite
Kumari, S.; Saha, U.; Bose, M.; Murugan, D.; Pachauri, V.; Sai, V.V.R.; Madaboosi, N. Microfluidic Platforms for Single Cell Analysis: Applications in Cellular Manipulation and Optical Biosensing. Chemosensors 2023, 11, 107. https://doi.org/10.3390/chemosensors11020107
Kumari S, Saha U, Bose M, Murugan D, Pachauri V, Sai VVR, Madaboosi N. Microfluidic Platforms for Single Cell Analysis: Applications in Cellular Manipulation and Optical Biosensing. Chemosensors. 2023; 11(2):107. https://doi.org/10.3390/chemosensors11020107
Chicago/Turabian StyleKumari, Shrishti, Udiptya Saha, Mayilvahanan Bose, Divagar Murugan, Vivek Pachauri, V. V. Raghavendra Sai, and Narayanan Madaboosi. 2023. "Microfluidic Platforms for Single Cell Analysis: Applications in Cellular Manipulation and Optical Biosensing" Chemosensors 11, no. 2: 107. https://doi.org/10.3390/chemosensors11020107