Article

Effects of Addition of CuxO to Porous SnO2 Microspheres Prepared by Ultrasonic Spray Pyrolysis on Sensing Properties to Volatile Organic Compounds

Graduate School of Engineering, Nagasaki University, 1-14 Bunkyo-Machi, Nagasaki 852-8521, Japan
*
Author to whom correspondence should be addressed.
Chemosensors 2023, 11(1), 59; https://doi.org/10.3390/chemosensors11010059
Submission received: 19 December 2022 / Revised: 5 January 2023 / Accepted: 9 January 2023 / Published: 11 January 2023
(This article belongs to the Collection Sustainable Metal Oxide Materials for Sensing Applications)

Abstract

:
Porous (pr-)SnO2-based powders were synthesized by ultrasonic spray pyrolysis employing home-made polymethylmethacrylate (PMMA) microspheres (typical particle size: 70 nm in diameter), and effects of the CuxO addition to the pr-SnO2 powder on the acetone and toluene sensing properties were investigated. Well-developed spherical pores reflecting the morphology of the PMMA microsphere templates were formed in the SnO2-based powders, which were quite effective in enhancing the acetone and toluene responses. The 0.8 wt% Cu-added pr-SnO2 sensor showed the largest acetone response at 350 °C among all the sensors. Furthermore, we clarified that the addition of CuxO onto the pr-SnO2 decreased the concentration of carrier electrons and the acetone-oxidation activity, leading to the improvement of the acetone-sensing properties of the pr-SnO2 sensor.

1. Introduction

Volatile organic compounds (VOCs) are emitted from factories, automobiles, adhesives, paints, etc., and they are known to be harmful to the human body even at low concentrations [1,2,3]. In addition, the exhaled breath of patients contains a higher concentration of specific VOCs or volatile sulfide compounds (VSCs) than that of healthy people. For example, patients suffering from lung cancer and diabetes are known to release high concentrations of toluene and acetone, respectively [4,5,6,7,8,9,10]. The establishment of highly sensitive and selective gas-sensing systems effectively prevents the VOC exposure in the living environment as well as sufficiently contributes to the realization of sophisticated non-invasive diagnostic methods for lung cancer and diabetes in the near future. Therefore, compact, inexpensive, and lightweight gas sensors were actively developed by various research and development organizations. Among them, semiconductor-type gas sensors employing metal oxides have been used as gas-leak detectors for the detection of reducing gases such as CO and hydrocarbons. The sensing mechanism of the semiconductor-type gas sensors is based on the change in electrical resistance of the sensing materials, mainly n-type semiconductors (e.g., SnO2, WO3, and In2O3), upon exposure to target gases. Oxygen molecules exist as negatively adsorbed oxygen species (O and/or O2− at elevated temperatures) on the metal-oxide surface, and they trap a certain number of free electrons from the conduction band of the metal oxide. These oxygen adsorbates react with reducing gases, and then trapped electrons go back to the conduction band of the metal oxide, which results in a decrease in the sensor resistance. A comparable amount of the reducing gases are oxidized and consumed in the process of gas diffusion from the top of the thick film sensor to the vicinity of the interdigitated electrodes located at the innermost portion of the thick film sensor. Therefore, the structural controls of mesopores as well as macropores of the semiconducting metal oxides is of great importance to improve the gas diffusivity, gas-adsorption properties, and catalytic combustion behavior of the reducing gases. Therefore, our group has focused on the precise control of the microstructural morphology of various gas-sensing materials during the last 20 years. For example, we have synthesized mesoporous and macroporous oxides by utilizing the assembly of surfactants with a size of several nanometers and commercial polymethylmethacrylate (PMMA) microspheres with a diameter of more than 150 nm, respectively, and the introduction of such well-developed porous structures into the sensor materials improved their response properties to various gases [11]. Recently, we have also synthesized the middle-sized PMMA microspheres (10–100 nm in diameter) as a template for middle-sized pores by ultrasonic-assisted polymerization, and we have succeeded in developing spherical metal-oxide powders (SnO2 and In2O3) with well-developed middle-sized pores by ultrasonic-spray pyrolysis employing these PMMA microspheres as a template. The semiconductor-type gas sensors fabricated with their porous SnO2 and In2O3 powders exhibited very large responses to H2 and NO2, respectively [12,13,14]. In addition, we have also demonstrated that the Au loading on the porous In2O3 (pr-In2O3) powder was effective in enhancing the NO2 response [15,16,17].
Generally, n-type semiconductors such as SnO2 and WO3 are common gas-sensitive materials. For further improvement of their gas sensing properties, the loading with various materials on the surface (e.g., noble metals or p-type semiconductors) has been reported in the past couple of decades. The loading with noble-metal nanoparticles such as Au or Pt effectively enhances their VOC-sensing properties [18,19,20,21,22]. However, the excessive utilization of noble metals hinders the sensor devices from cost-effective fabrication. On the other hand, it is also well known that the loading of p-type metal oxides on the surface of n-type metal oxides and thus the forming of p–n heterojunctions between them are quite effective in improving the gas-sensing properties [23,24,25,26,27,28,29,30]. Jayababu et al. reported that the NiO-loaded SnO2 sensor showed a larger response to ethanol than the SnO2 or NiO sensor, and an increase in the thickness of the depletion layer at the p–n heterojunction was interpreted as a possible reason for the enhanced sensor responses [25]. Cai et al. successfully synthesized the SnO2 nanowires loaded with and without Cr2O3 nanoparticles, and they clarified that the p–n heterojunctions formed on the nanowire surface improved the ethanol response [26]. Namely, the forming of p–n heterojunctions is one important technique in improving the gas-sensing properties. Furthermore, the control of catalytic activities of the gas-sensing materials for the oxidation of the target gas is one very important factor in improving their sensor responses [31,32,33].
In this study, porous (pr-)SnO2 and CuxO-added pr-SnO2 powders were synthesized by ultrasonic spray pyrolysis employing homemade PMMA microspheres (typical particle size: 70 nm in diameter), and their acetone and toluene sensing properties were examined. We also evaluated changes in resistance between dry nitrogen and dry synthetic air (21% O2) as well as catalytic activities of acetone and toluene oxidation by the addition of CuxO. Based on the results obtained, the effects of the addition of CuxO on the improved acetone response of the sensors are discussed.

2. Materials and Methods

2.1. Preparation of Pr-SnO2 Powders

Porous (pr-)SnO2 and CuxO-added pr-SnO2 powders were synthesized by ultrasonic spray pyrolysis employing homemade PMMA microspheres as a template in a similar manner reported previously [12,13,14,17,23,34,35]. The typical particle size of the PMMA microspheres used was ca. 70 nm. A precursor solution was prepared by mixing the PMMA microspheres (0.32 g dm−3, 40 mL) with SnCl4 aqueous solution (0.05 mol dm−3, 60 mL). An appropriate amount of CuCl2 aqueous solution (0.05 mol dm−3) was also prepared in order to add CuxO to pr-SnO2. The prepared solution was atomized by ultrasonication, and it was introduced into an electric furnace at 1100 °C under flowing air (1500 cm3 min−1). After the evaporation of water and the thermal decomposition of SnCl4, CuCl2, and PMMA microspheres, spherical porous SnO2 powder was produced in the electric furnace, and CuxO nanoparticles were highly dispersed in the SnO2 powder. The obtained pr-SnO2 powders added with and without CuxO were denoted as pr-wCu-SnO2 and pr-SnO2 [w: the additive amount of Cu (wt%), w = 0.4, 0.8, 1.6], respectively. For comparative purposes, a spherical dense SnO2 (d-SnO2) powder was also prepared by a similar preparation technique using the precursor solution without containing PMMA microspheres.

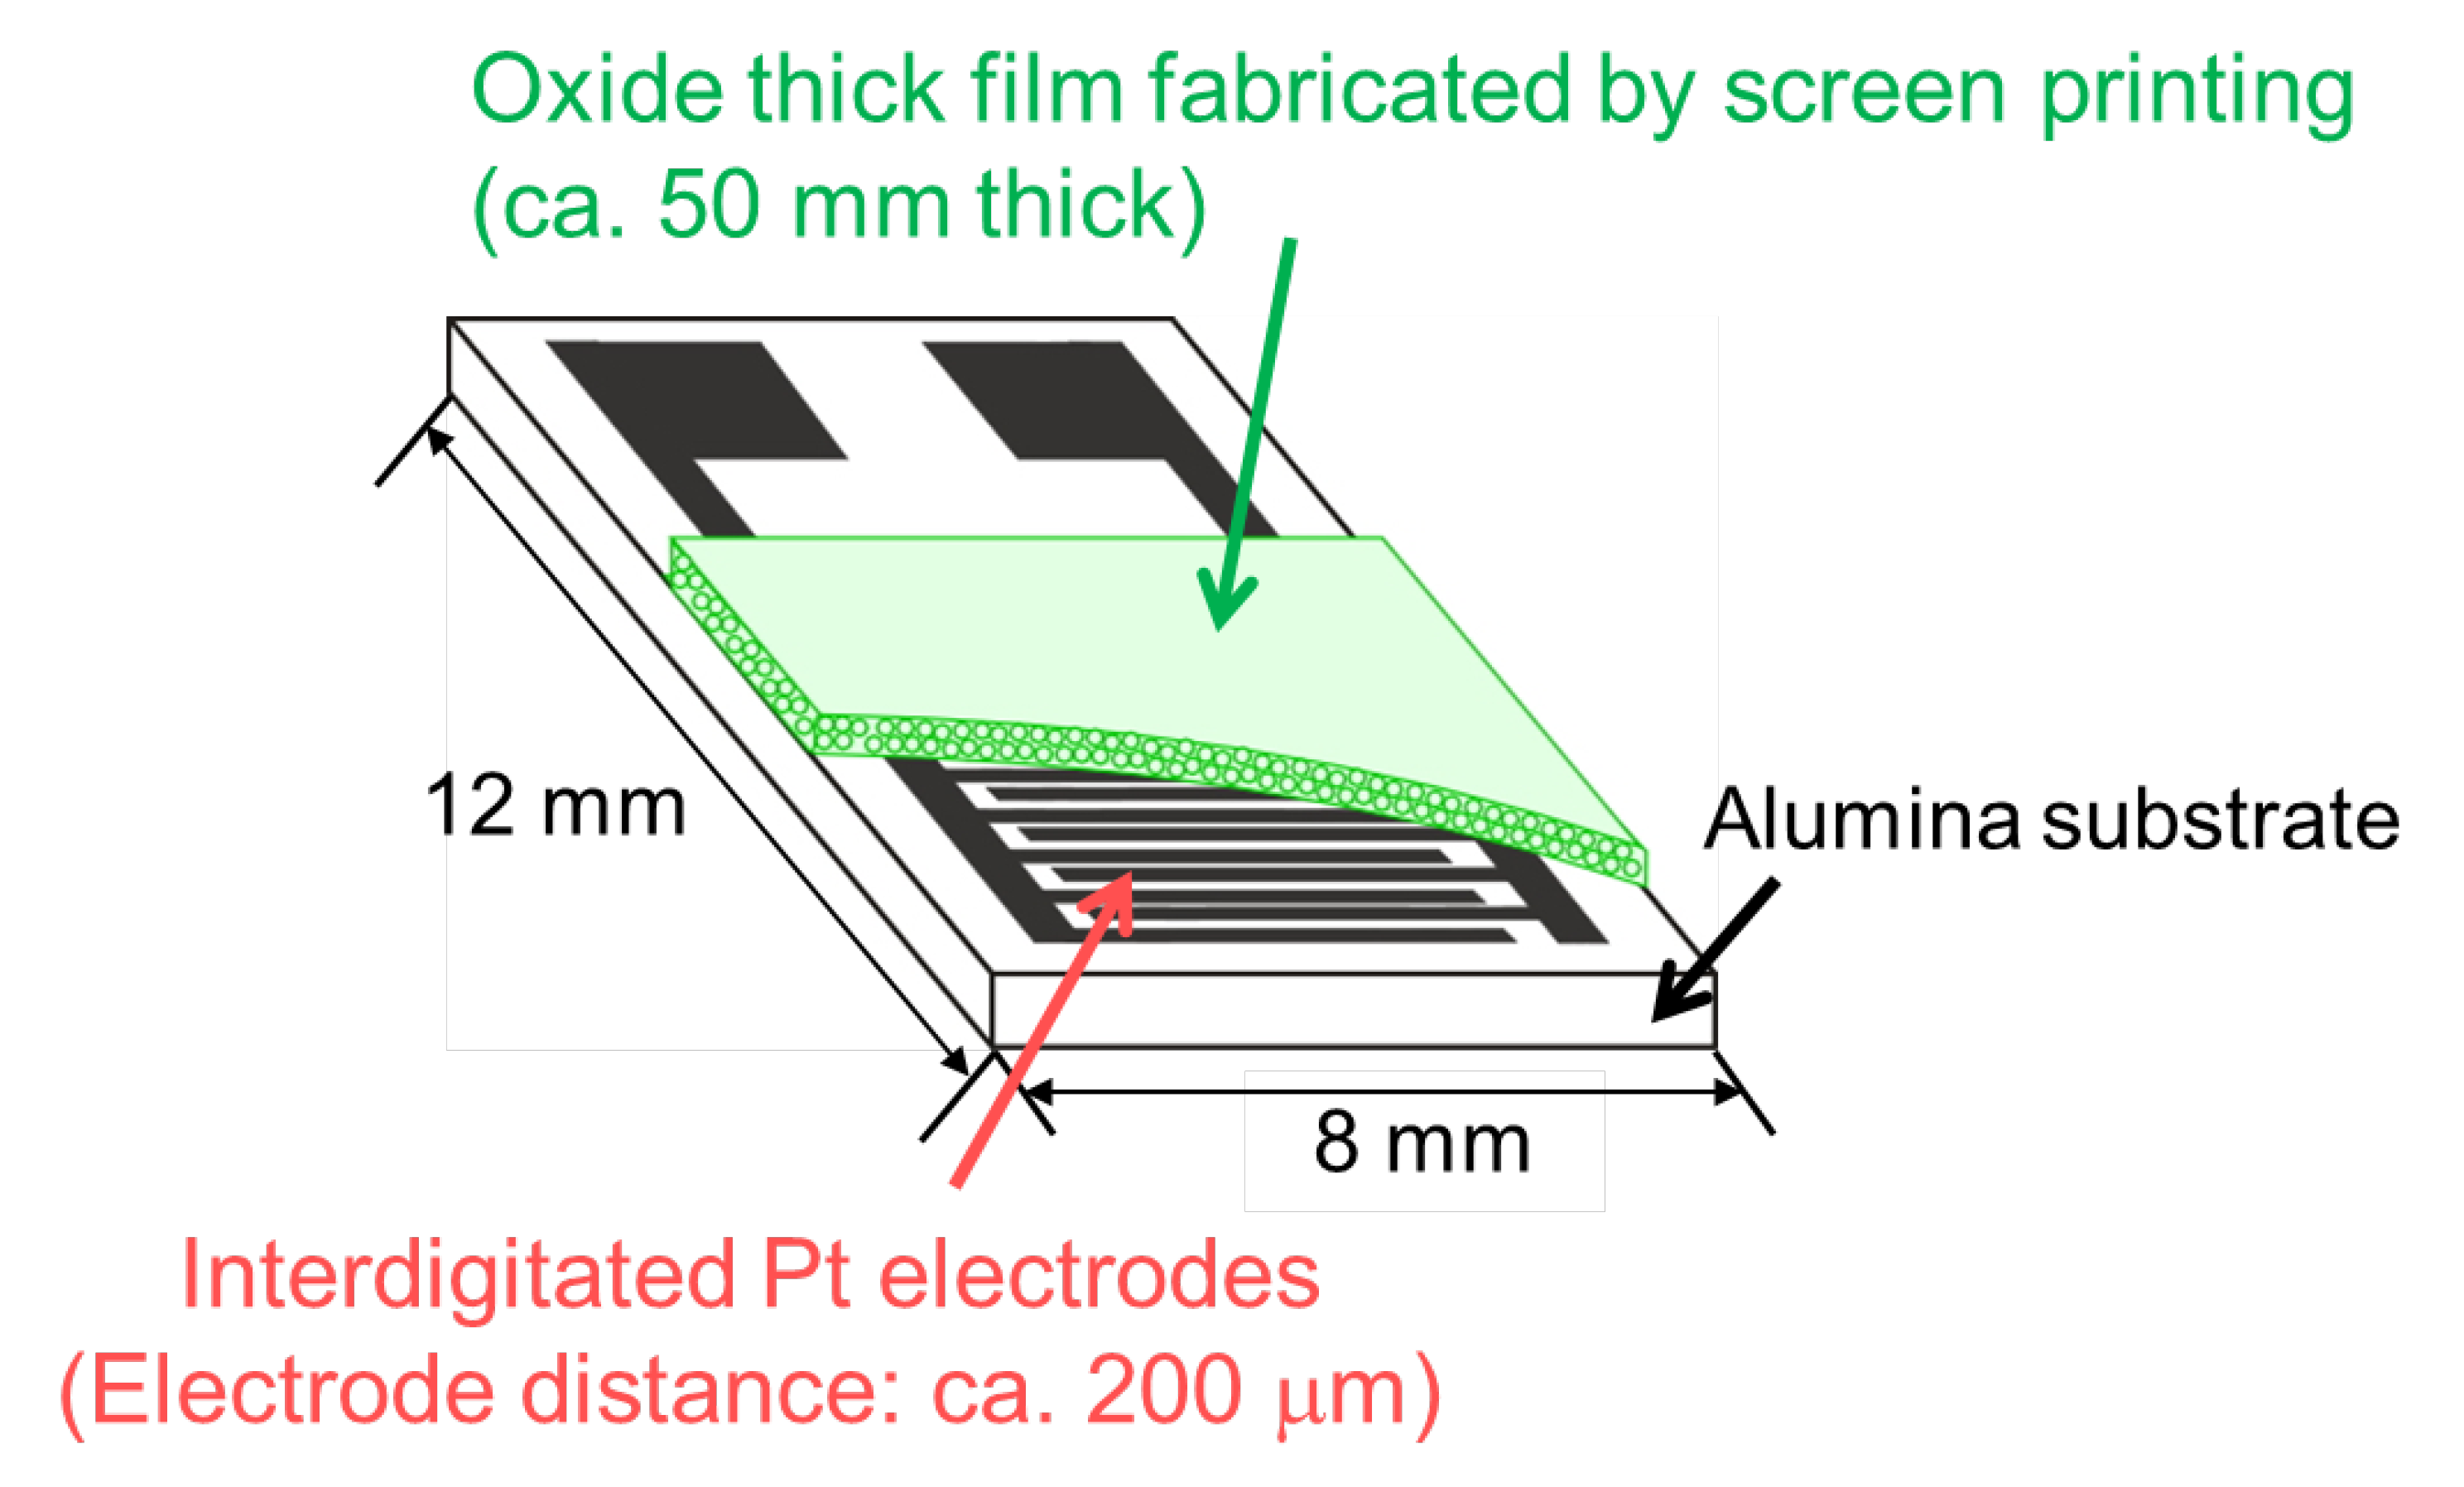
2.2. Sensor Fabrication and Gas Sensing Measurements

The SnO2-based powder was mixed with α-terpineol at a weight ratio of 1:2 to make a paste, and the paste was screen printed onto an alumina substrate equipped with a pair of interdigitated Pt electrodes (gap size: ca. 200 µm), followed by drying at 100 °C. Then, they are calcined at 550 °C for 5 h in ambient air. Figure 1 shows a schematic drawing of the sensor element. Gas responses of these sensors to 20, 50, and 100 ppm VOCs (acetone and toluene) balanced with dry air were measured using a conventional gas-flow apparatus equipped with a furnace in an operating temperature of 300–500 °C. The total flow rate was fixed at 100 cm3 min−1. The resistance of the sensors was directly measured by using a data acquisition system (Keysight Technologies, Inc., Santa Rosa, CA, USA, DAQ 970A). The magnitude of response to VOCs was defined as the ratio (Ra/Rg), where Rg and Ra are the resistance in VOCs balanced with air and that in air.

2.3. Characterization

Scanning electron microscopy (SEM) images of synthesized powders were collected by using an electron microscope (JEOL Ltd., Tokyo, Japan, JSM-7500F). The more detailed structure of these powders was observed by transmission electron microscopy (TEM; JEOL Ltd., JEM-ARM200F) and scanning transmission electron microscopy with energy dispersive X-ray spectroscopy for elemental mapping (STEM-EDS; JEOL Ltd., JEM-ARM200F). N2 adsorption-desorption isotherms were recorded, and the pore-size distribution and specific surface area (SSA) of these powders were calculated by using Barrett–Joyner–Halenda (BJH) and Brunauer–Emmett–Teller (BET) methods, respectively (Micromeritics Instrument Corp., Norcross, GA, USA, Tristar3000). The phase and crystal structure of these powders were confirmed by X-ray diffraction analysis (XRD; Rigaku Corp., Tokyo, Japan, Minflex600-DX) using Cu Kα radiation (40 kV, 40 mA), and their crystallite size (CS) was calculated by utilizing the Scherrer equation (shaper factor: 0.9). Chemical state of the surface of these powders was characterized by X-ray photoelectron spectroscopy using Al Kα radiation (XPS, Kratos Analytical Ltd., Manchester, UK, Axis Ultra DLD).

2.4. Catalytic Combustion Activity

Granules of the pr-SnO2 or pr-1.6Cu-SnO2 (ca. 20–60 mesh) were prepared by a press of the powders into discs and crushed. The granules of about 0.05 g were fixed in a glass reactor connected to a flow apparatus. They were exposed to 100 ppm acetone balanced with dry air, at a flow rate of 30 cm3 min−1 (a gas hourly space velocity (GHSV) of 12,732 h−1). The pr-SnO2 or the pr-1.6Cu-SnO2 powder was heated in the temperature range of 30–500 °C, and the outlet gas was characterized by using a gas chromatograph/mass spectroscope (GC-MS; Shimadzu Corp., Kyoto, Japan, GCMS-QP2010SE with a capillary column, PoraPLOT Q) and a GC equipped with an FID detector (Shimadzu Corp., Kyoto, Japan, GC-2010 with a capillary column, DB-5)).

3. Results and Discussion

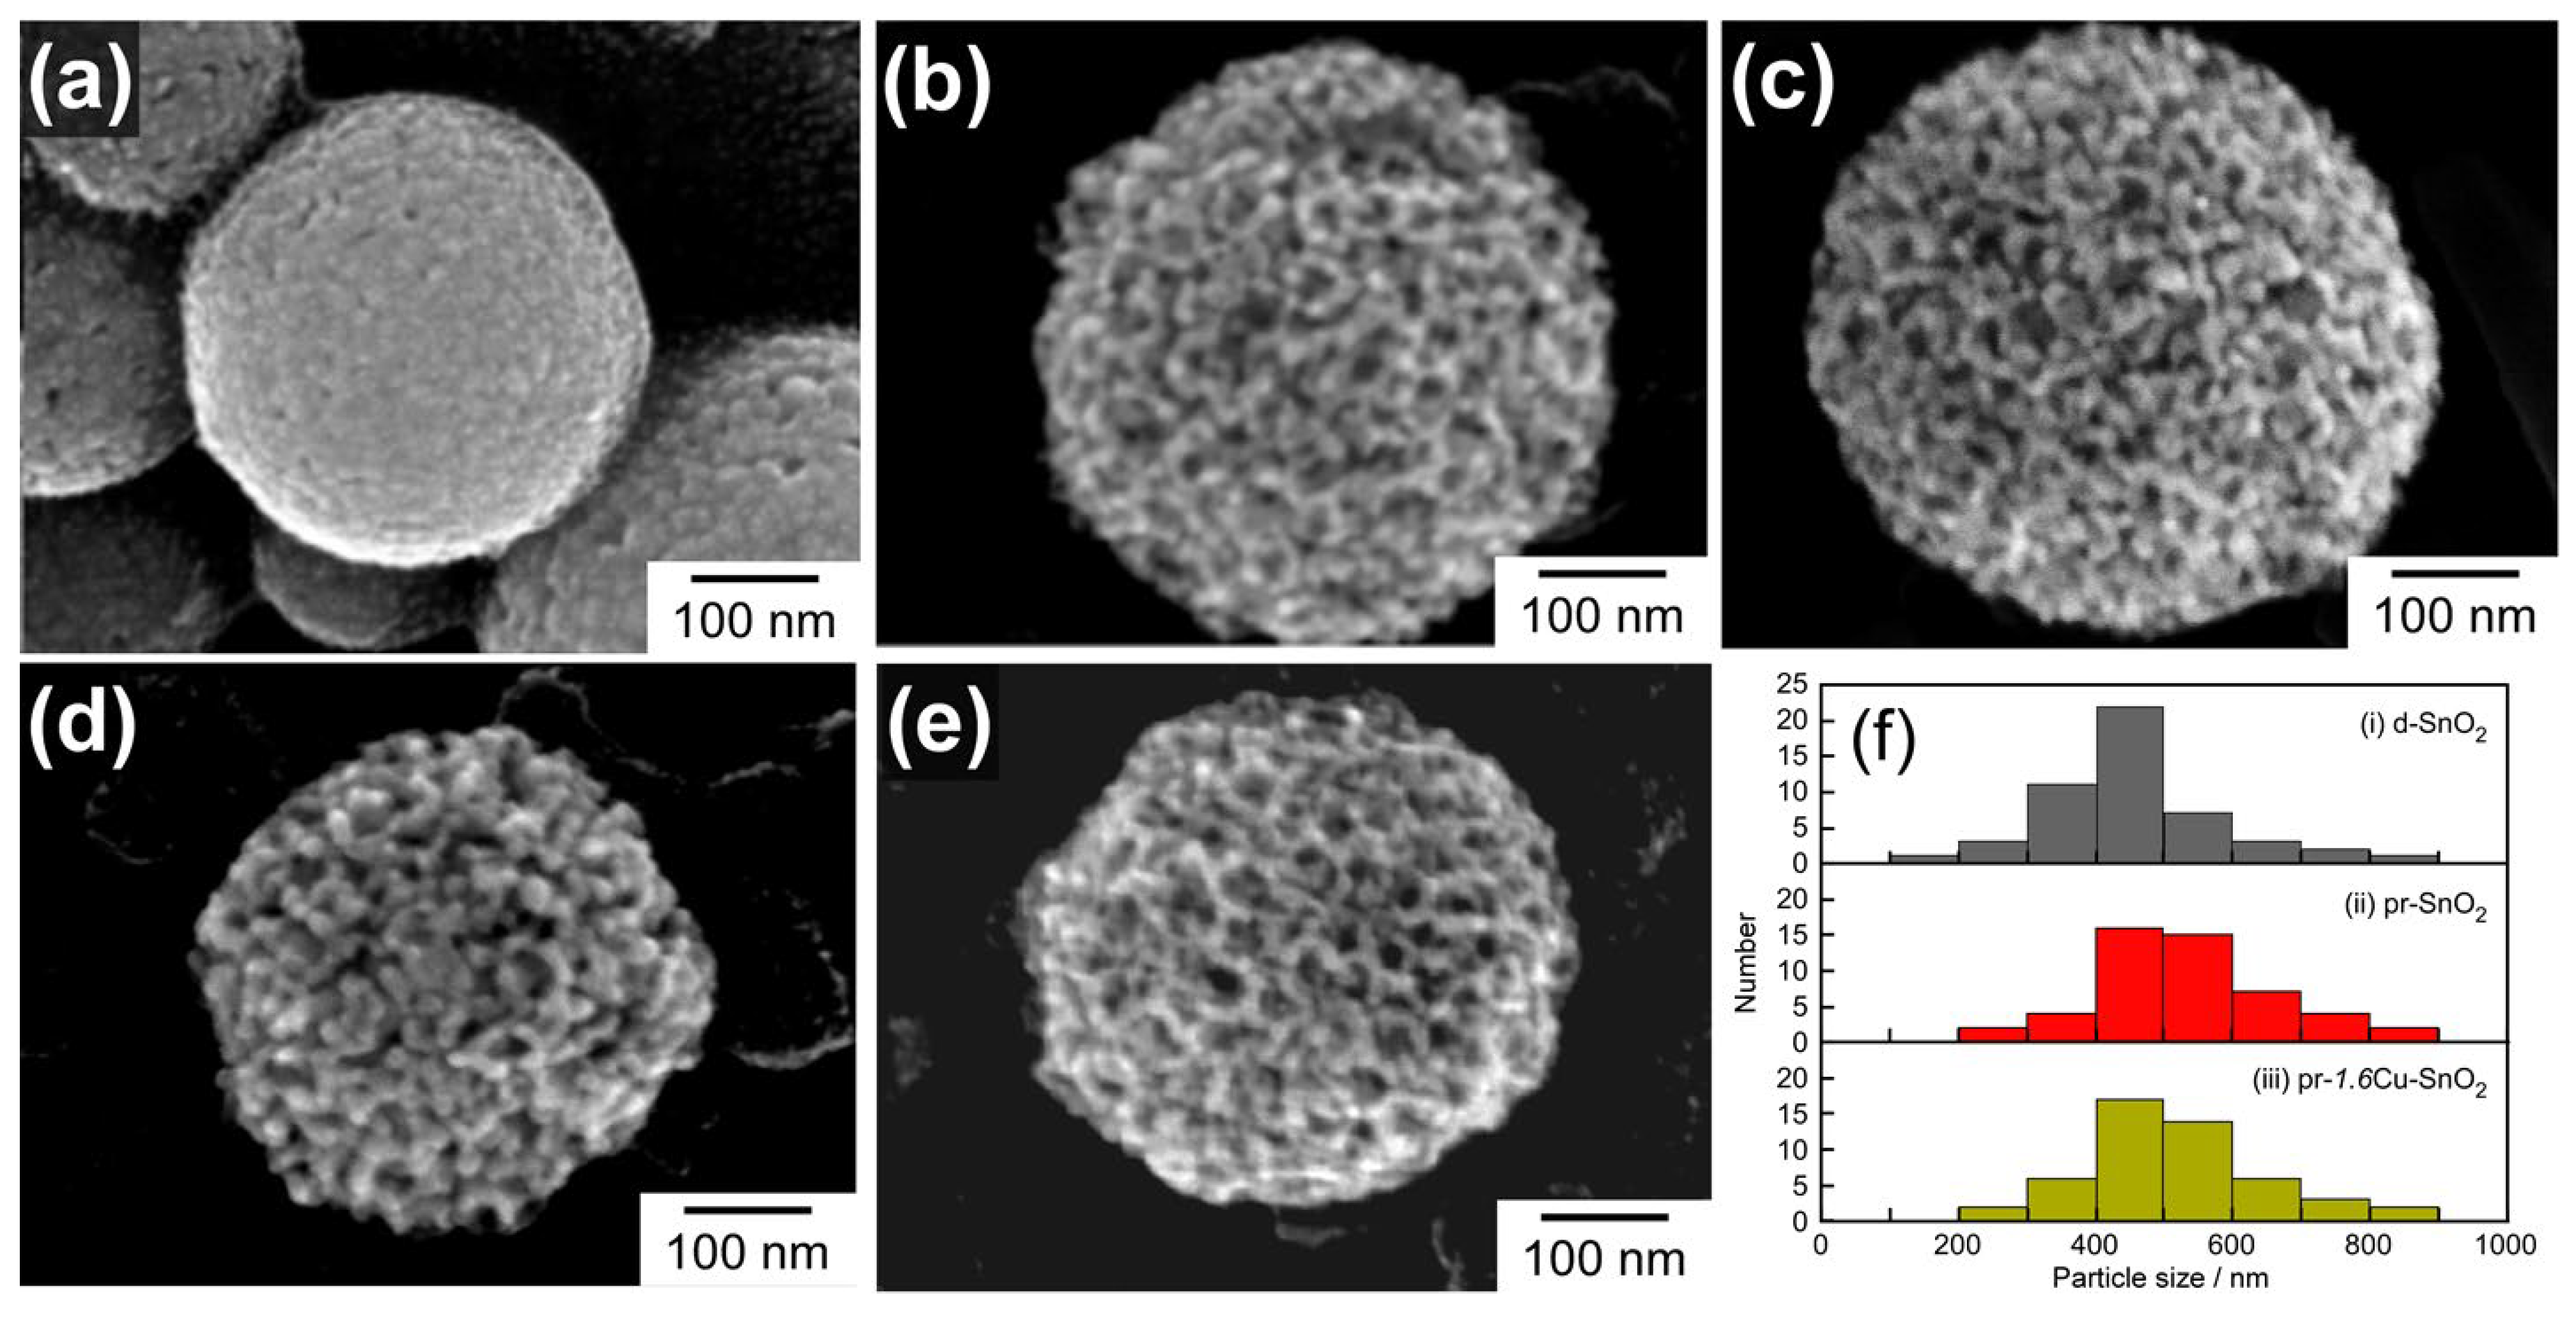
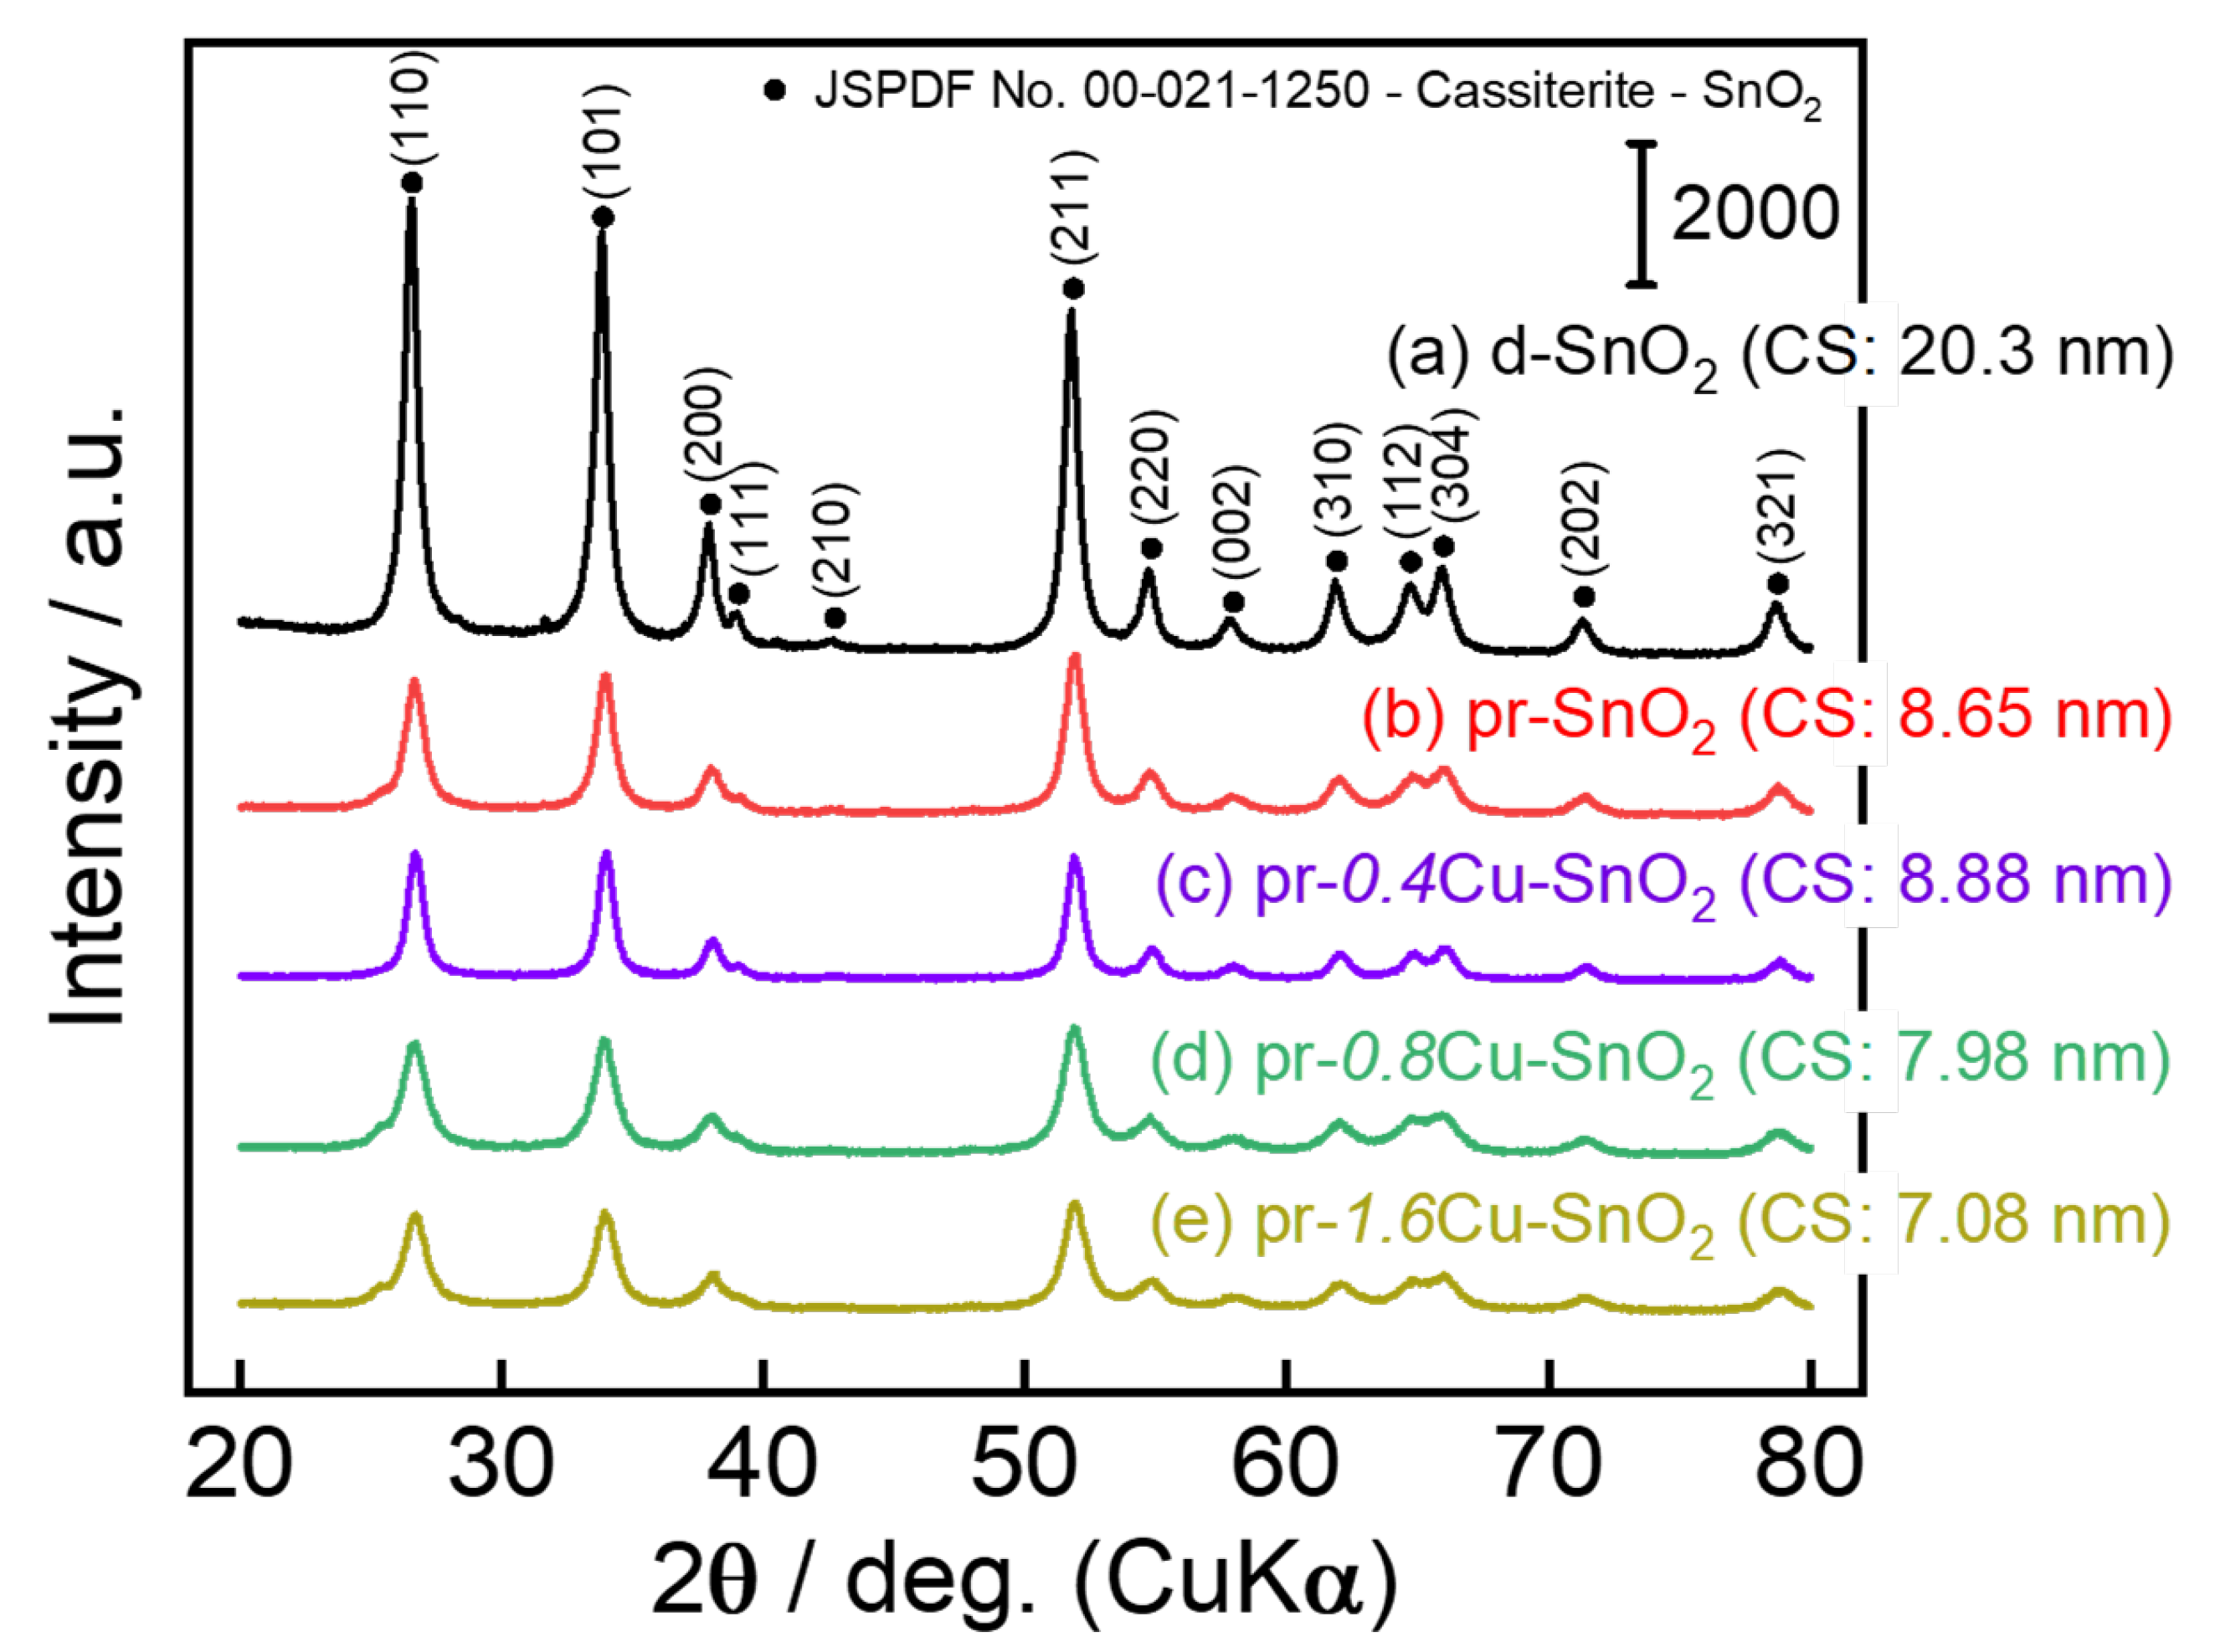
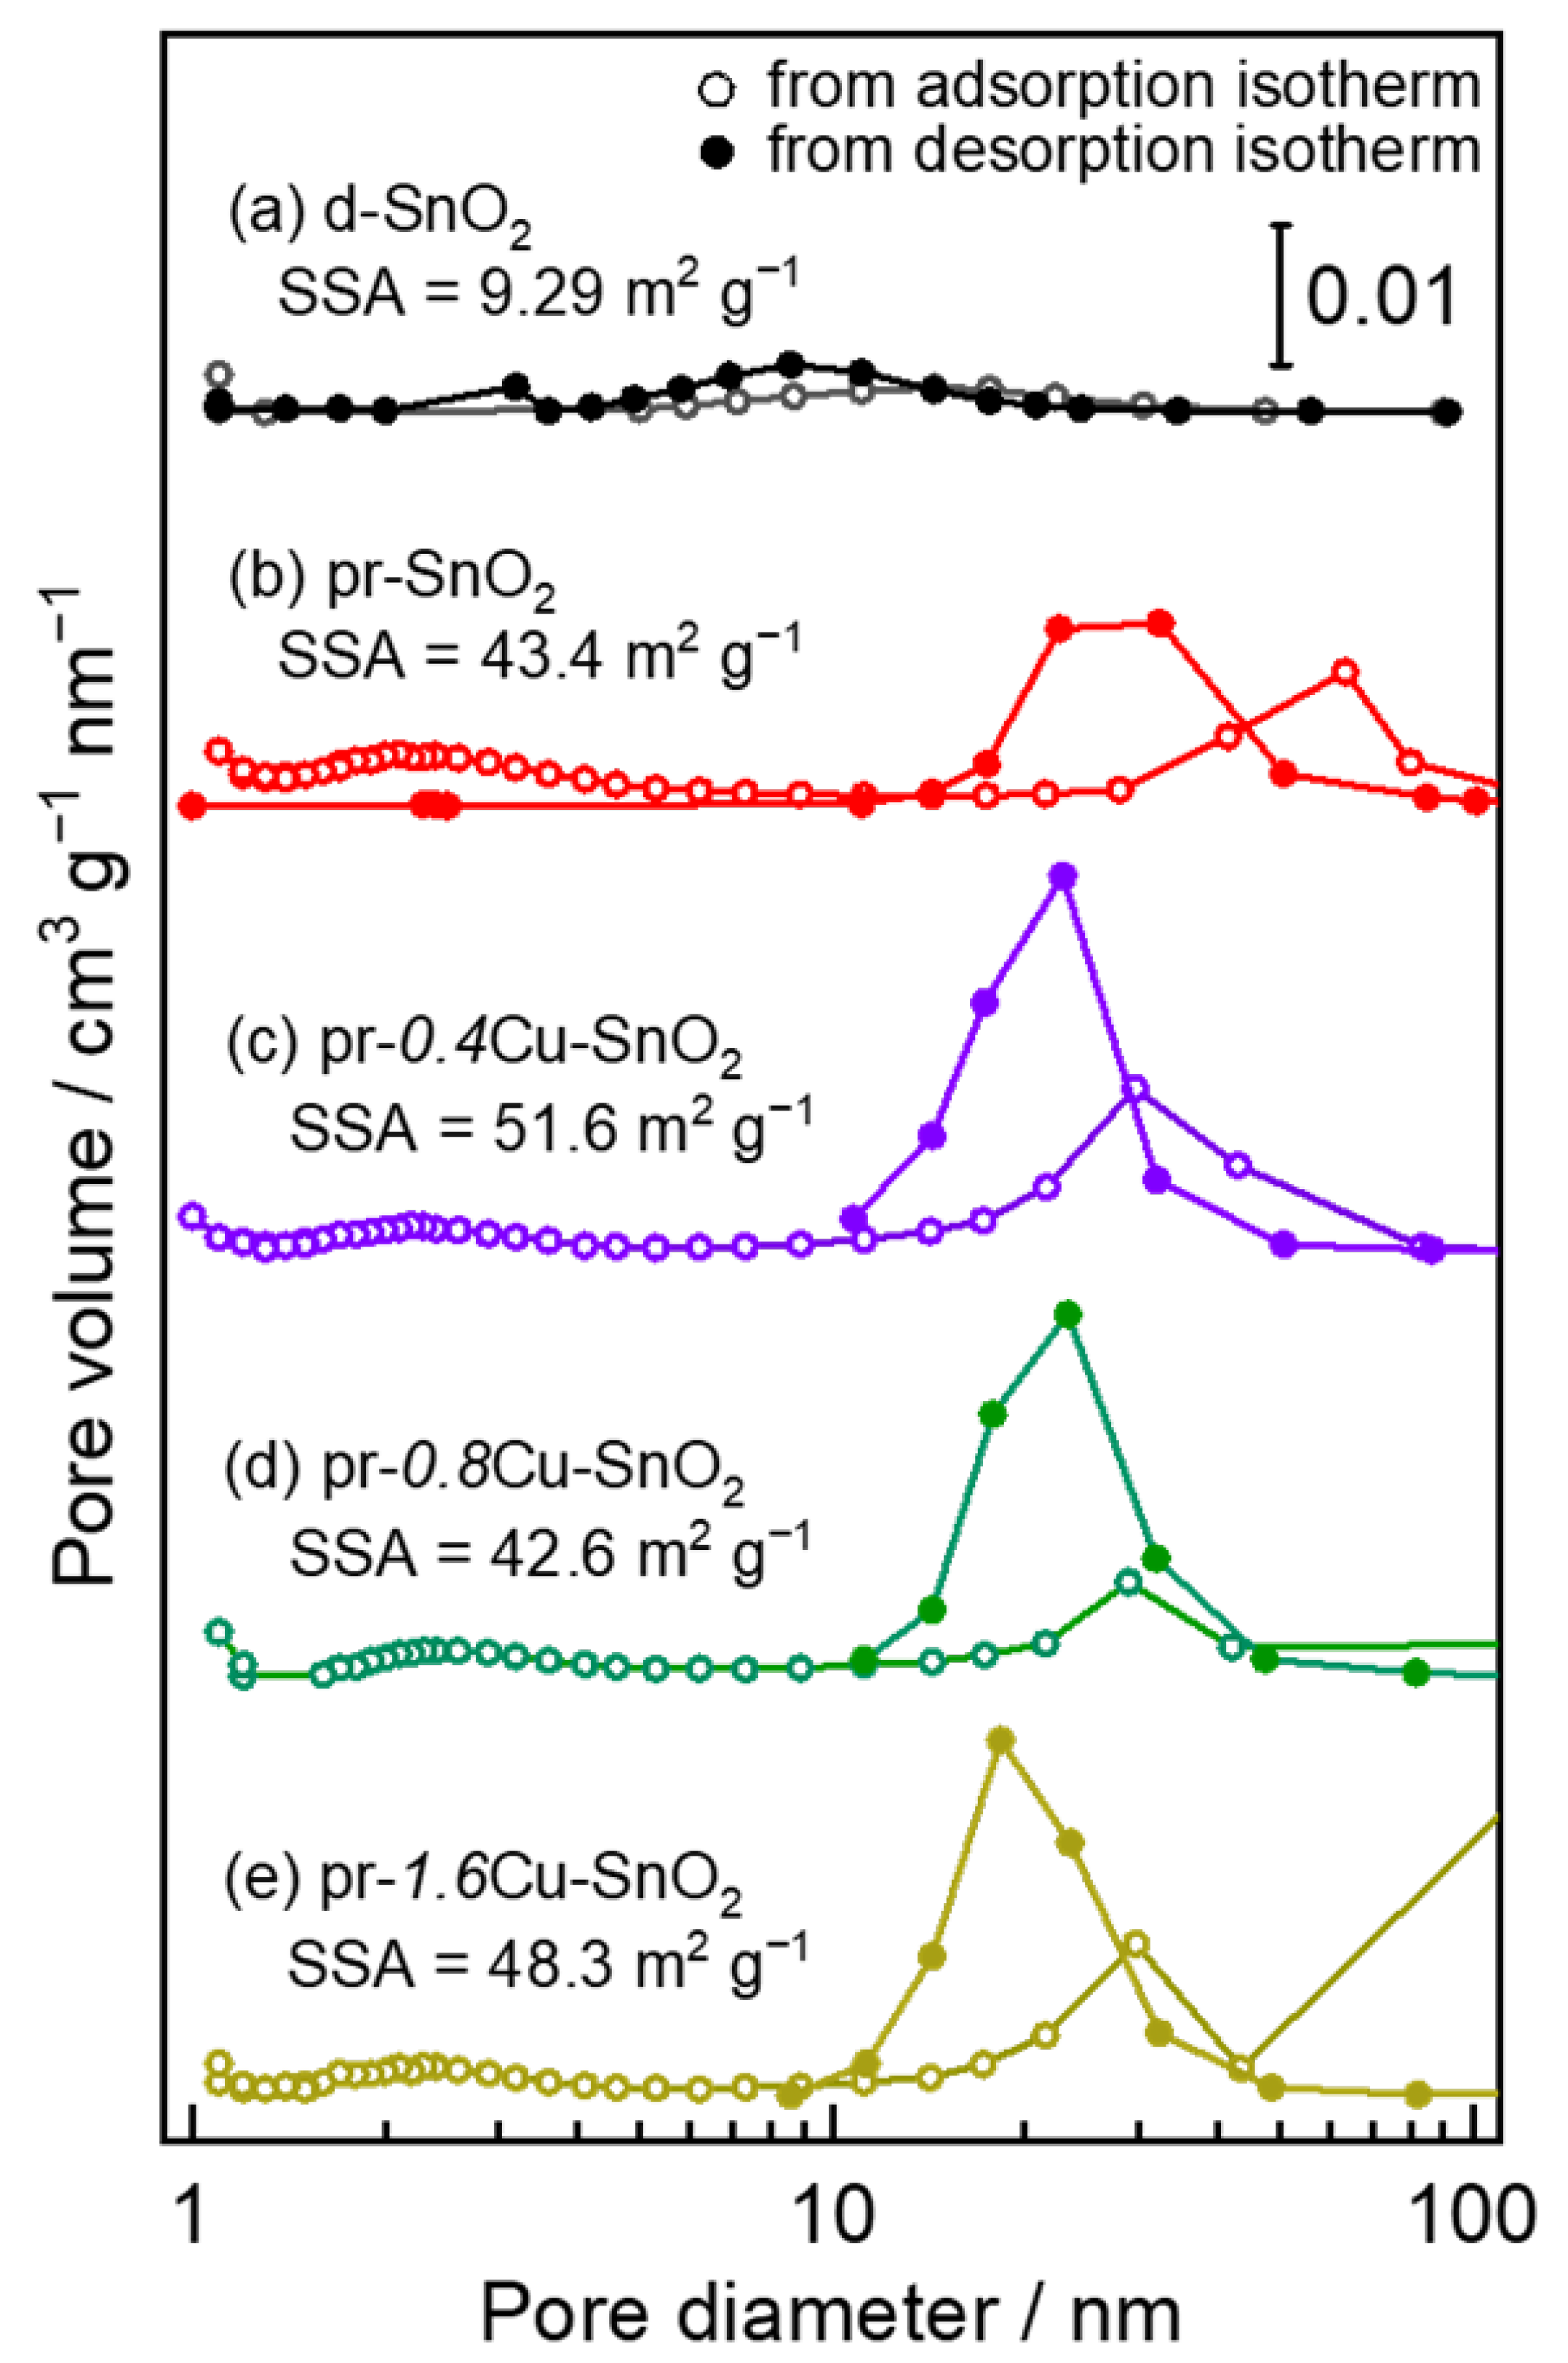
3.1. Crystal Structure and Morphology of the Powder

Figure 2 shows SEM photographs of representative as-prepared d-SnO2, pr-SnO2, and pr-wCu-SnO2 (w: 0.4, 0.8, 1.6) powders, together with the particle-size distributions of their powders obtained by counting 50 particles in their SEM images. The obtained powders were almost spherical with diameters of 100–900 nm, which were widely distributed depending on the size of the precursor mists which were fed into the electric furnace [16]. The pores were hardly formed on the surface of the d-SnO2 powder. On the other hand, the well-developed pores were structured on the surface of the pr-SnO2 and pr-wCu-SnO2 powders, because they originated from the thermal decomposition of the PMMA microspheres added into the precursor solution subjected to the ultrasonic spray pyrolysis. Their morphologies and particle sizes were almost independent of the amounts of CuxO added.
Figure 3 shows TEM photographs of as-prepared pr-SnO2 and pr-1.6Cu-SnO2 powders. It is confirmed that the porous structure was well developed even in the internal region of these spherical powders (Figure 3(ai,bi)). The TEM images showed that the size of SnO2 polycrystals was ca. 10–30 nm in diameter (Figure 3(aii,bii)). The elemental mapping of the pr-1.6Cu-SnO2 powder by using STEM-EDS showed uniform dispersion of Cu components in the prepared powder as shown in Figure 3(biii,iv). The amount of Cu added to the pr-1.6Cu-SnO2 powder, which was measured by EDS, was ca. 1.88 wt%.
Figure 4 shows XRD patterns of d-SnO2, pr-SnO2, and pr-wCu-SnO2 (w: 0.4, 0.8, 1.6) powders. All powders exhibited three large peaks corresponding to the (110), (101), and (211) planes of the cassiterite-type structure (JCPDF No. 00-021-1250). In addition, no diffraction patterns of CuxO were observed in these XRD spectra. The crystallite size of pr-SnO2 (ca. 8.65 nm) was smaller than that of d-SnO2 (ca. 20.3 nm), due to the formation of the porous SnO2 structure via the decomposition of PMMA template [12,13,14,17,23,34,35]. In contrast, the small amount of CuxO addition (0.4 wt%) caused a slight increase in the crystallite size from ca. 8.65 nm to ca. 8.88 nm, whereas the further increase in the Cu content tended to decrease the crystallite size (e.g., ca. 7.08 nm for pr-1.6Cu-SnO2).
Figure 5 shows the pore-size distributions of the d-SnO2, pr-SnO2, and pr-wCu-SnO2 (w: 0.4, 0.8, 1.6) powders. Most of the pores of the d-SnO2 powder which was calculated from the N2 desorption isotherm were observed below 20 nm, and the mixing of PMMA microspheres into the precursor solution for the ultrasonic-spray pyrolysis largely increased the pore volume as well as the pore size in the spherical SnO2 powders. The pore size of the peaks derived from the N2 adsorption isotherms of all the pr-wCu-SnO2 (w: 0.4, 0.8, 1.6) powders was larger than those derived from their N2 desorption isotherms, whereas the pore volume of the peaks derived from the N2 adsorption isotherms of all the powders was smaller than those derived from their N2 desorption isotherms. Generally, the difference between pore diameters calculated from N2 adsorption and desorption isotherms arises from the ink-bottle porous morphology of the synthesized powders. Therefore, the pore diameter calculated from the N2 desorption isotherm reflects the width of the necks formed between the spherical pores which originate from the morphology of PMMA microspheres as a template, whereas the one calculated from N2 adsorption isotherm reflects the diameter of the spherical pores. Actually, the size of pores on the surface of the pr-wCu-SnO2 powders (Figure 2) was quite similar to the pore diameter (ca. 30 nm) calculated from their N2 adsorption isotherms. However, the pore diameter of the pr-SnO2 powder calculated from N2 adsorption isotherm (ca. 60–70 nm) is larger than that of observed by the SEM photograph (ca. 30 nm). This indicates that larger pores exist inside the pr-SnO2 powder. The specific surface area (SSA) of the pr-SnO2 powder (ca. 43.4 m2 g−1) was much larger than that of d-SnO2 powder (ca. 9.29 m2 g−1). This clearly showed that the formation of porous structures inside of the spherical SnO2 powders by using the PMMA microspheres significantly increased the SSA. The addition of CuxO tends to increase the SSA slightly.
Figure 6 shows representative XPS spectra of pr-SnO2 and pr-1.6Cu-SnO2 powders. The Sn 3d spectra were clearly assigned to the highest oxidation state of Sn (i.e., Sn4+ of SnO2) [36,37]. However, the loading of CuxO onto SnO2 negatively shifted the peak energy of the Sn 3d5/2 (495.5 eV to 495.3 eV) and Sn 3d3/2 (487.1 eV to 486.9 eV), which can be attributed to the electron transfer from CuxO to SnO2 [28,29,30,31,32,33,34,35,36,37,38,39,40]. The O 1s spectra of the pr-SnO2 and pr-1.6Cu-SnO2 powders were deconvoluted into three components (531.1, 531.8, and 532.5 eV for pr-SnO2 and 530.9, 531.8, and 532.4 eV for pr-1.6Cu-SnO2), which originate from lattice oxygen (O2−), chemisorbed oxygen (Oads), and hydroxyl surface groups (OH), respectively [41,42,43,44]. The binding energies of the Cu components showed a major doublet of both Cu 2p3/2 and Cu 2p1/2 (ca. 932.7 eV and 952.5 eV, respectively, derived from Cu+ of Cu2O), together with a minor doublet (934.6 eV (Cu 2p3/2) and 954.3 eV (Cu 2p1/2), derived from Cu2+ of CuO) [37,45]. In addition, the Cu content of the pr-1.6Cu-SnO2 powders was estimated to be 1.68 wt%, based on the XPS results. These results indicated that Cu2O was mainly dispersed into the pr-1.6Cu-SnO2 powders and that the p–n junctions were formed at the interfaces between Cu2O and SnO2.

3.2. Gas-Sensing Properties

Figure 7 shows representative response transients of pr-SnO2 and pr-1.6Cu-SnO2 sensors to 20, 50, and 100 ppm acetone at 300 °C and 400 °C in air. Figure 8 shows temperature dependences of (a) resistances in air and responses to (b) 100 ppm acetone and (c) 100 ppm toluene of the d-SnO2, pr-SnO2, and pr-wCu-SnO2 sensors, together with (d) concentration dependences of responses to acetone of the pr-SnO2 and pr-wCu-SnO2 sensors at 350 °C in air. The resistance of the pr-SnO2 sensor in the air was much smaller than that of the d-SnO2 sensor. Besides, the addition of CuxO to the pr-SnO2 powder increased the resistance in air, and the resistance of the pr-wCu-SnO2 sensor in the air increased with an increase in the additive amount of CuxO, because of the formation of the p–n heterojunction between SnO2 and the surface CuxO.
The resistance of all the sensors decreased upon exposure to acetone and toluene, and the resistance decreased with an increase in their concentrations. The d-SnO2 sensor exhibited a relatively smaller response to acetone and toluene than the pr-SnO2 sensor over the whole temperature range. The responses of all the pr-wCu-SnO2 sensors to 100 ppm acetone were larger than that of the pr-SnO2 sensor over the whole temperature range. The pr-0.4Cu-SnO2 and pr-0.8Cu-SnO2 sensors showed the largest acetone response at 350 °C. On the other hand, the acetone response of the pr-SnO2 and the pr-1.6Cu-SnO2 sensors monotonically decreased with increasing operating temperature. The pr-0.8Cu-SnO2 sensor showed the largest acetone response (ca. 11.9) at 350 °C among all the sensors. The addition of 0.4 wt% Cu to pr-SnO2 decreased the toluene response over the whole temperature range, whereas the further increase in the additive amount of CuxO to pr-SnO2 improved the toluene response, especially at low temperatures. The pr-1.6Cu-SnO2 sensor showed the largest toluene response at 300 °C. The toluene responses of all sensors at each temperature were smaller than that of the acetone responses. All the sensors showed a linear dependence between the acetone response and the logarithm of concentration (Figure 8d). The response of the pr-0.8Cu-SnO2 sensor to 20 ppm acetone (ca. 6.24) was larger than that of the pr-SnO2 sensor (ca. 3.55), and the slope of the response of the pr-0.8Cu-SnO2 sensor was smaller than that of the pr-SnO2. Therefore, the pr-0.8Cu-SnO2 sensor seems to detect the lower concentrations of acetone. The detection limit of a sensor is commonly defined as three times the standard deviation of its noise [46,47,48,49]. According to the results obtained in this study, the detection limit of the pr-0.8Cu-SnO2 sensor was expected to be about 158 ppb (noise: ca. 85 kΩ).
Figure 9 shows response transients to dry synthetic air (21% O2) of the pr-SnO2 sensor and the pr-1.6Cu-SnO2 in dry N2. The resistance in N2 of both the sensors largely increased upon exposure to oxygen, which indicates that the negatively charged oxygen species adsorbed on the sensor surface in the air. In other words, there is little adsorption of negatively charged oxygen species on the sensor surface in N2. The resistance of the pr-SnO2 sensor at 350 °C in N2 is ca. 50 kΩ, whereas that of the pr-1.6Cu-SnO2 sensor is ca. 1 MΩ. Based on the results of STEM-EDS and XPS of the pr-1.6Cu-SnO2 powders, it is confirmed that CuxO nanoparticles uniformly exist on the SnO2 surface. Therefore, the drastic increase in the resistance by the CuxO addition indicates the appearance of the p–n heterojunction between SnO2 and the surface CuxO. The resistance of both sensors increased with the negatively charged adsorption of oxygen. The resistances of the pr-SnO2 and pr-1.6Cu-SnO2 sensors increased by about 18.7 and 32.3 times, respectively. This indicates that the change in resistance becomes greater when the electron concentration in the sensor material is lower, even if the same amount of oxygen adsorbates is formed on the surface of the sensor material. Assuming that no oxygen is adsorbed on the surface in nitrogen, the magnitude of the increase in resistance of these sensors corresponds to the magnitude of their theoretical maximum responses.
Figure 10 shows the catalytic combustion behavior of 100 ppm acetone over the pr-SnO2 and pr-1.6Cu-SnO2 powders in dry air. Acetone started to oxidize at 100 °C over the pr-SnO2 powder. Its oxidation reaction was accelerated with a rise in the temperature, and it was completely oxidized to CO2 at 450 °C. The acetone–conversion ratio of both the powders was larger than their CO2-production ratio in the temperature range at the same temperatures between 100 °C and 420 °C, which indicates that acetone was partially decomposed to be converted to some intermediates [50]. In addition, the temperature at which 50% of acetone was converted to CO2, T50, of the pr-1.6Cu-SnO2 powder (ca. 330 °C) was higher than that of the pr-SnO2 powder (ca. 300 °C). In other words, the oxidation activity of acetone on the pr-1.6Cu-SnO2 powder was smaller than that on the pr-SnO2 powder.
Based on all the results obtained in this study, the acetone-sensing mechanism of the sensor is discussed as described below. First, the thickness of the depletion layer of the pr-SnO2 sensor is quite thin in dry N2, because of the small number of negatively charged oxygen adsorbates (O2−) on the SnO2 surface. When the pr-SnO2 sensor is exposed to air, the thickness of the depletion layer increases with an increase in the oxygen adsorbates to decrease the number of electrons in the bulk. The p–n heterojunction forms the depletion layer on the pr-wCu-SnO2 surface even in dry N2, which contributes to the further decrease in the concentration of carrier electrons. Moreover, the thickness of the depletion layer increases and the concentration of carrier electrons decreases with an increase in the amount of oxygen concentration in the base gas. Since the concentration of carrier electrons of the pr-wCu-SnO2 sensor is much lower than that of the pr-SnO2 sensor, the resistance of the pr-wCu-SnO2 sensor is quite sensitive to a change in the concentration of carrier electrons (i.e., the amount of reaction of oxygen adsorbates with target gases) than that of the pr-SnO2 sensor. This is one of the reasons why the response of the pr-wCu-SnO2 sensor is larger than that of the pr-SnO2 sensor. This effect of the p–n heterojunction increases with an increase in the amount of Cu components loaded onto the pr-SnO2.
Second, the catalytic activity of acetone oxidation of the pr-wCu-SnO2 sensor is smaller than that of the pr-SnO2 sensor, as shown in Figure 10. While acetone diffuses in the pr-SnO2 and pr-wCu-SnO2 films (film thickness: ca. 15 μm), acetone is oxidized on the surface of these oxide particles. Therefore, the concentration of acetone in the innermost region of the pr-wCu-SnO2 films is higher than that of the pr-SnO2 film. Thus, the amount of reaction of oxygen adsorbates with acetone on the pr-wCu-SnO2 surface is anticipated to be larger than that on the pr-SnO2 surface. This is the second reason why the response of the pr-wCu-SnO2 sensor is larger than that of the pr-SnO2 sensor. The catalytic effect also increases with an increase in the additive amount of CuxO components loaded onto the pr-SnO2.
Considering that the microstructure of the pr-wCu-SnO2 powders is comparable to that of the pr-SnO2 powder, the results obtained in this study show that the adequate control of both the formation of the p–n heterojunction (increase in the resistance) and the decrease in the catalytic activity by the loading of CuxO components onto the pr-SnO2 are essential in improving the VOC-sensing properties of the pr-SnO2 sensor.

4. Conclusions

Spherical pr-SnO2 and pr-wCu-SnO2 powders were prepared by ultrasonic spray pyrolysis using SnCl4 and CuCl2 aqueous solutions containing PMMA microspheres as a template. All the powders were confirmed to show a porous structure formed by the thermal decomposition of PMMA microspheres. The pr-0.8Cu-SnO2 sensor showed the largest acetone response at 350 °C among all the sensors. In addition, pr-wCu-SnO2 (w: 0.4, 0.8, 1.6) sensors showed linear dependences between the acetone response and the logarithm of the concentration, and the slope of the response of the pr-0.8Cu-SnO2 sensor was smaller than that of the pr-SnO2. Therefore, the pr-0.8Cu-SnO2 sensor seems to detect the lower concentrations of acetone. The resistance of the pr-1.6Cu-SnO2 sensor in dry N2 was much larger than that of the pr-SnO2 sensor, due to the formation of the p–n heterojunction between SnO2 and CuxO, and the resistance of the pr-1.6Cu-SnO2 sensor largely increased upon exposure to dry air in comparison with that of the pr-SnO2 sensor. Therefore, the addition of CuxO to the pr-SnO2 powder increased the theoretical maximum response. In addition, the oxidation activity of acetone on the pr-1.6Cu-SnO2 surface was smaller than that on the pr-SnO2 surface, which indicates that the concentration of acetone in the innermost region of the pr-1.6Cu-SnO2 film was higher than that of the pr-SnO2 film. This is another reason for the relatively large response of the pr-1.6Cu-SnO2 sensor.

Author Contributions

Conceptualization, S.T. and T.U.; investigation, S.T., T.U. and K.K.; writing—original draft preparation, S.T.; writing—review and editing, T.H.; supervision, T.H. and Y.S.; funding acquisition, T.U., T.H. and Y.S. All authors have read and agreed to the published version of the manuscript.

Funding

This research received no external funding.

Institutional Review Board Statement

Not applicable.

Informed Consent Statement

Not applicable.

Data Availability Statement

The data that support the findings of this study are available from the corresponding author upon reasonable request.

Acknowledgments

This study was supported, in part, by the Nagasaki University WISE Programme Research Grant for Global Health Research.

Conflicts of Interest

The authors declare no conflict of interest.

References

  1. Mølhave, L.; Clausen, G.; Berglund, B.; Ceaurriz, J.; Kettrup, A.; Lindvall, T.; Maroni, M.; Pickering, A.C.; Risse, U.; Rothweiler, H.; et al. Total Volatile Organic Compounds (TVOC) in Indoor Air Quality Investigations. Indoor Air 1997, 7, 225–240. [Google Scholar] [CrossRef]
  2. Gong, Y.; Wei, Y.; Cheng, J.; Jiang, T.; Chen, L.; Xu, B. Health risk assessment and personal exposure to Volatile Organic Compounds (VOCs) in metro carriages—A case study in Shanghai, China. Sci. Total Environ. 2017, 574, 1432–1438. [Google Scholar] [CrossRef] [PubMed]
  3. Haick, H.; Broza, Y.Y.; Mochalski, P.; Ruzsanyi, V.; Amann, A. Assessment, origin, and implementation of breath volatile cancer markers. Chem. Soc. Rev. 2014, 43, 1423–14497. [Google Scholar] [CrossRef] [PubMed] [Green Version]
  4. Koo, W.-T.; Choi, S.-J.; Kim, N.-H.; Jang, J.-S.; Kim, I.-D. Catalyst-decorated hollow WO3 nanotubes using layer-by-layer self-assembly on polymeric nanofiber templates and their application in exhaled breath sensor. Sens. Actuators B 2016, 223, 301–310. [Google Scholar] [CrossRef]
  5. Yaegaki, K.; Sanada, K. Volatile sulfur compounds in mouth air from clinically healthy subjects and patients with periodontal disease. J. Periodont. Res. 1992, 27, 233–238. [Google Scholar] [CrossRef] [PubMed]
  6. Kalidoss, R.; Umapathy, S. An overview on the exponential growth of non-invasive diagnosis of diabetes mellitus from exhaled breath by nanostructured metal oxide Chemi-resistive gas sensors and μ-preconcentrator. Biomed. Microdev. 2020, 22, 2–9. [Google Scholar] [CrossRef]
  7. Li, W.; Dai, W.; Liu, M.; Long, Y.; Wang, C.; Xie, S.; Liu, Y.; Zhang, Y.; Shi, Q.; Peng, X.; et al. VOC biomarkers identification and predictive model construction for lung cancer based on exhaled breath analysis: Research protocol for an exploratory study. BMJ Open 2019, 9, e028448. [Google Scholar] [CrossRef] [Green Version]
  8. Peng, G.; Tisch, U.; Adams, O.; Hakim, M.; Shehada, N.; Broza, Y.Y.; Billan, S.; Bortnyak, R.A.; Kuten, A.; Haick, H. Diagnosing lung cancer in exhaled breath using gold nanoparticles. Nat. Nanotechnol. 2009, 4, 669–673. [Google Scholar] [CrossRef] [PubMed]
  9. Amann, A.; Corradi, M.; Mazzone, P.; Mutti, A. Lung cancer biomarkers in exhaled breath. Expert Rev. Mol. Diagn. 2011, 11, 207–217. [Google Scholar] [CrossRef]
  10. Shin, J.; Choi, S.-J.; Lee, I.; Youn, D.-Y.; Park, C.O.; Lee, J.-H.; Tuller, H.L.; Kim, I.-D. Thin-wall assembled SnO2 fibers functionalized by catalytic Pt nanoparticles and their superior exhaled-breath-sensing properties for the diagnosis of diabetes. Adv. Funct. Mater. 2013, 23, 2357–2367. [Google Scholar] [CrossRef]
  11. Hieda, K.; Hyodo, T.; Shimizu, Y.; Egashira, M. Preparation of porous tin dioxide powder by ultrasonic spray pyrolysis and their application to sensor materials. Sens. Actuators B 2008, 133, 144–150. [Google Scholar] [CrossRef] [Green Version]
  12. Hyodo, T.; Iwanaga, A.; Ishida, K.; Kamada, K.; Ueda, T.; Shimizu, Y. Effects of noble-metal loading and ultraviolet-light irradiation on gas sensing properties of porous indium oxide films at room temperature. J. Ceram. Soc. Jpn. 2021, 129, 676–682. [Google Scholar] [CrossRef]
  13. Hyodo, T.; Fujii, E.; Ishida, K.; Ueda, T.; Shimizu, Y. Microstructural control of porous In2O3 powders prepared by ultrasonic-spray pyrolysis employing self-synthesized polymethylmethacrylate microspheres as a template and their NO2-sensing properties. Sens. Actuators B 2017, 244, 992–1003. [Google Scholar] [CrossRef] [Green Version]
  14. Hyodo, T.; Furuno, S.; Fujii, E.; Matsuo, K.; Motokucho, S.; Kojio, K.; Shimizu, Y. Porous In2O3 powders prepared by ultrasonic-spray pyrolysis as a NO2-sensing material: Utilization of polymethylmethacrylate microspheres synthesized by ultrasonic-assisted emulsion polymerization as a template. Sens. Actuators B 2013, 187, 495–502. [Google Scholar] [CrossRef] [Green Version]
  15. Ueda, T.; Boehme, I.; Hyodo, T.; Shimizu, Y.; Weimar, U.; Barsan, N. Effects of gas adsorption properties of an Au-loaded porous In2O3 sensor on NO2-sensing properties. ACS Sens. 2021, 6, 4019–4026. [Google Scholar] [CrossRef] [PubMed]
  16. Ueda, T.; Boehme, I.; Hyodo, T.; Shimizu, Y.; Weimar, U.; Barsan, N. Enhanced NO2-sensing properties of Au-loaded porous In2O3 gas sensors at low operating temperatures. Chemosensors 2020, 8, 72. [Google Scholar] [CrossRef]
  17. Ueda, T.; Ishida, K.; Kamada, K.; Hyodo, T.; Shimizu, Y. Improvement in NO2 sensing properties of semiconductor-type gas sensors by loading of Au into porous In2O3 powders. Front. Mater. 2019, 6, 81. [Google Scholar] [CrossRef] [Green Version]
  18. Sang, L.; Xu, G.; Chen, Z.; Wang, X.; Cui, H.; Zhang, G.; Dou, Y. Synthesis and characterization of Au-loaded SnO2 mesoporous spheres by spray drying and their gas sensing property. Mater. Sci. Semicond. Process. 2020, 105, 104710. [Google Scholar] [CrossRef]
  19. Liu, Y.; Li, X.; Wang, Y.; Li, X.; Cheng, P.; Zhao, Y.; Dang, F.; Zhang, Y. Hydrothermal synthesis of Au@SnO2 hierarchical hollow microspheres for ethanol detection. Sens. Actuators B Chem. 2020, 319, 128299. [Google Scholar] [CrossRef]
  20. Bouchikhi, B.; Chludziński, T.; Saidi, T.; Smulko, J.; Bari, N.E.; Wen, H.; Ionescu, R. Formaldehyde detection with chemical gas sensors based on WO3 nanowires decorated with metal nanoparticles under dark conditions and UV light irradiation. Sens. Actuators B Chem. 2020, 320, 128331. [Google Scholar] [CrossRef]
  21. Zeb, S.; Sun, G.; Nie, Y.; Cui, Y.; Jiang, X. Synthesis of highly oriented WO3 nanowire bundles decorated with Au for gas sensing application. Sens. Actuators B Chem. 2020, 321, 128439. [Google Scholar] [CrossRef]
  22. Lian, X.; Li, Y.; Zhu, J.; An, D.; Wang, Q. Fabrication of Au-decorated SnO2 nanoparticles with enhanced n-buthanol gas sensing properties. Mater. Sci. Semicond. Process. 2019, 101, 198–205. [Google Scholar] [CrossRef]
  23. Tammanoon, N.; Iwamoto, T.; Ueda, T.; Hyodo, T.; Wisitsoraat, A.; Liewhiran, C.; Shimizu, Y. Synergistic effects of PdOx-CuOx loadings on methylmercaptan sensing of porous WO3 microspheres prepared by ultrasonic spray pyrolysis. ACS Appl. Mater. Interfaces 2020, 12, 41728–41739. [Google Scholar] [CrossRef] [PubMed]
  24. Staerz, A.; Kim, T.-H.; Lee, J.-H.; Weimar, U.; Barsan, N. Nanolevel control of gas sensing characteristics via p−n heterojunction between Rh2O3 Clusters and WO3 crystallites. J. Phys. Chem. C 2017, 121, 24701–24706. [Google Scholar] [CrossRef]
  25. Jayababu, N.; Poloju, M.; Shruthi, J.; Reddy, M.V.R. Semi shield driven p-n heterostructures and their role in enhancing the room temperature ethanol gas sensing performance of NiO/SnO2 nanocomposites. Ceram. Int. 2019, 45, 15134–15142. [Google Scholar] [CrossRef]
  26. Cai, Z.; Park, S. Enhancement mechanisms of ethanol-sensing properties based on Cr2O3 nanoparticle-anchored SnO2 nanowires. J. Mater. Res. Technol. 2020, 9, 271–281. [Google Scholar] [CrossRef]
  27. Kim, H.; Cai, Z.; Chang, S.P.; Park, S. Improved sub-ppm acetone sensing properties of SnO2 nanowire-based sensor by attachment of Co3O4 nanoparticles. J. Mater. Res. Technol. 2020, 9, 1129–1136. [Google Scholar] [CrossRef]
  28. Xu, Y.; Zheng, L.; Yang, C.; Liu, X.; Zhang, J. Highly sensitive and selective electronic sensor based on Co catalyzed SnO2 nanospheres for acetone detection. Sens. Actuators B Chem. 2020, 304, 127237. [Google Scholar] [CrossRef]
  29. Kou, X.; Xie, N.; Chen, F.; Wang, T.; Guo, L.; Wang, C.; Wang, Q.; Ma, J.; Sun, Y.; Zhang, H.; et al. Superior acetone gas sensor based on electrospun SnO2 nanofibers by Rh doping. Sens. Actuators B Chem. 2018, 256, 861–869. [Google Scholar] [CrossRef]
  30. Gu, C.; Cui, Y.; Wang, L.; Sheng, E.; Shim, J.J.; Huang, J. Synthesis of the porous NiO/SnO2 microspheres and microcubes and their enhanced formaldehyde gas sensing performance. Sens. Actuators B Chem. 2017, 241, 298–307. [Google Scholar] [CrossRef]
  31. Gschwend, P.M.; Schenk, F.M.; Gogos, A.; Prasinis, S.E. Acetone sensing and catalytic conversion by Pd-loaded SnO2. Materials 2021, 14, 5921. [Google Scholar] [CrossRef] [PubMed]
  32. Güntner, A.T.; Weber, I.C.; Pratsinis, S.E. Catalytic filter for continuous and selective ethanol removal prior to gas sensing. ACS Sens. 2020, 5, 1058–1067. [Google Scholar] [CrossRef]
  33. Weber, I.C.; Braun, H.P.; Krumeich, F.; Güntner, A.T.; Pratsinis, S.E. Superior acetone selectivity in gas mixtures by catalyst-filtered chemoresistive sensors. Adv. Sci. 2020, 7, 20001503. [Google Scholar] [CrossRef]
  34. Kato, T.; Tashiro, M.; Sugimura, K.; Hyodo, T.; Shimizu, Y.; Egashira, M. Preparation of hollow alumina microspheres by ultrasonic spray pyrolysis. J. Ceram. Soc. Jpn. 2002, 110, 146–148. [Google Scholar] [CrossRef] [Green Version]
  35. Hyodo, T.; Inoue, H.; Motomura, H.; Matsuo, K.; Hashishin, T.; Tamaki, J.; Shimizu, Y.; Egashira, M. NO2 sensing properties of macroporous In2O3-based powders fabricated by utilizing ultrasonic spray pyrolysis employing polymethylmethacrylate microspheres as a template. Sens. Actuators B 2010, 151, 265–273. [Google Scholar] [CrossRef] [Green Version]
  36. Costa, I.M.; Colmenares, Y.N.; Pizani, P.S.; Leite, E.R.; Chiquito, A.J. Sb doping of VLS synthesized SnO2 nanowires probed by Raman and XPS spectroscopy. Chem. Phys. Lett. 2018, 695, 125–130. [Google Scholar] [CrossRef]
  37. Choi, K.-I.; Kim, H.-J.; Kang, Y.C.; Lee, J.-H. Ultraselective and ultrasensitive detection of H2S in highly humid atmosphere using CuO-loaded SnO2 hollow spheres for real-time diagnosis of halitosis. Sens. Actuators B Chem. 2014, 194, 371–376. [Google Scholar] [CrossRef]
  38. Kim, J.-S.; Na, C.W.; Kwak, C.-H.; Li, H.-Y.; Yoon, J.W.; Kim, J.-H.; Jeong, S.-Y.; Lee, J.-H. Humidity-Independent gas sensors using Pr-doped In2O3 macroporous spheres: Role of cyclic Pr3+/Pr4+ redox reactions in suppression of water-poisoning effect. ACS Appl. Mater. Interfaces 2019, 11, 25322–25329. [Google Scholar] [CrossRef] [PubMed]
  39. Du, N.; Zhang, H.; Chen, B.D.; Ma, X.Y.; Liu, Z.H.; Wu, J.B.; Yang, Y.R. Porous indium oxide nanotubes: Layer-by-layer assembly on carbon-nanotube templates and application for room-temperature NH3 gas sensors. Adv. Mater. 2017, 19, 1641–1645. [Google Scholar] [CrossRef]
  40. Sun, Y.; Zhao, Z.; Suematsu, K.; Li, P.; Yu, Z.; Zhang, W.; Hu, J.; Shimanoe, K. Rapid and stable detection of carbon monoxide in changing humidity atmospheres using clustered In2O3/CuO Nanospheres. ACS Sens. 2020, 4, 1040–1049. [Google Scholar] [CrossRef] [PubMed]
  41. Sun, L.; Liu, X.; Liu, K.; Yin, S.; Chen, Q.L.; Kuang, Q.; Han, X.G.; Xie, Z.X.; Wang, C. Template-free construction of hollow α-Fe2O3 hexagonal nanocolumn particles with an exposed special surface for advanced gas sensing properties. Nanoscale 2015, 21, 9416–9420. [Google Scholar] [CrossRef]
  42. Mao, Y.Z.; Ma, S.; Li, X.B.; Wang, C.Y.; Li, F.M. Effect of Mn doping on the microstructures and sensing properties of ZnO nanofibers. Appl. Surf. Sci. 2014, 298, 109–115. [Google Scholar] [CrossRef]
  43. Gonzalez-Elipe, A.R.; Espinos, J.P.; Fernandez, A.; Munuera, G. XPS study of the surface carbonation/hydroxylation state of metal oxides. Appl. Surf. Sci. 1990, 45, 103–108. [Google Scholar] [CrossRef]
  44. Wang, L.; Ma, S.; Xu, X.; Li, J.; Yang, T.; Cao, P.; Yun, P.; Wang, S.; Han, T. Oxygen vacancy-based Tb-doped SnO2 nanotubes as an ultra-sensitive sensor for ethanol detection. Sens. Actuators B Chem. 2021, 344, 130111. [Google Scholar] [CrossRef]
  45. Poulston, S.; Parlett, P.M.; Stone, P.; Bowker, M. Surface oxidation and reduction of CuO and Cu2O studied using XPS and XAES. Surf. Interface Anal. 1996, 24, 811–820. [Google Scholar] [CrossRef]
  46. Sun, J.; Sun, L.; Han, N.; Chu, H.; Bai, S.; Shu, X.; Luo, R.; Chen, A. rGO decorated CdS/CdO composite for detection of low concentration NO2. Sens. Actuators B Chem. 2019, 299, 126832. [Google Scholar] [CrossRef]
  47. Mahdavifar, A.; Navaei, M.; Hesketh, P.J.; Findlay, M.; Stetter, J.R.; Hunter, W.G. Transient thermal response of micro-thermal conductivity detector (µTCD) for the identification of gas mixtures: An ultra-fast and low power method. Microsyst. Nanoeng. 2015, 1, 15025. [Google Scholar] [CrossRef] [Green Version]
  48. Struk, D.; Shirke, A.; Mahdavifar, A.; Hesketh, P.J.; Stetter, J.R. Investigating time-resolved response of micro thermal conductivity sensor under various modes of operation. Sens. Actuators B Chem. 2018, 254, 771–777. [Google Scholar] [CrossRef]
  49. Jung, G.; Shin, W.; Hong, S.; Jeong, Y.; Park, J.; Kim, D.; Bae, J.H.; Park, B.G.; Lee, J.H. Comparison of the characteristics of semiconductor gas sensors with different transducers fabricated on the same substrate. Sens. Actuators B Chem. 2021, 335, 129661. [Google Scholar] [CrossRef]
  50. Bianchi, C.L.; Gatto, S.; Pirola, C.; Naldoni, A.; Di Michele, A.; Cerrato, G.; Crocellà, V.; Capucci, V. Photocatalytic degradation of acetone, acetaldehyde and toluene in gas-phase: Comparison between nano and micro-sized TiO2. Appl. Catal. B Environ. 2014, 146, 123–130. [Google Scholar] [CrossRef]
Figure 1. Schematic drawing of a sensor element.
Chemosensors 11 00059 g001
Figure 2. SEM photographs of as-prepared (a) d-SnO2, (b) pr-SnO2, and representative pr-wCu-SnO2 (w: (c) 0.4, (d) 0.8, (e) 1.6) powders, together with (f) their particle-size distributions obtained by counting of 50 particles in their SEM images.
Chemosensors 11 00059 g002
Figure 3. TEM photographs of as-prepared (a) (i,ii) pr-SnO2 and (b) (i,ii) pr-1.6Cu-SnO2 powders. STEM photograph of as-prepared pr-1.6Cu-SnO2 powders ((b) (iii)) and their EDS elemental mappings ((b) (iv): Cu and (b) (v): Sn).
Chemosensors 11 00059 g003
Figure 4. XRD patterns of d-SnO2, pr-SnO2, and pr-wCu-SnO2 (w: 0.4, 0.8, 1.6) powders.
Chemosensors 11 00059 g004
Figure 5. Pore-size distributions of as-prepared d-SnO2, pr-SnO2, and pr-wCu-SnO2 (w: 0.4, 0.8, 1.6) powders, together with their specific surface area (SSA).
Chemosensors 11 00059 g005
Figure 6. (a) Sn 3d, (b) O 1s, and (c) Cu 2p XPS spectra of as-prepared pr-SnO2 and pr-1.6Cu-SnO2 powders.
Chemosensors 11 00059 g006
Figure 7. Response transients of (a) pr-SnO2 and (b) pr-1.6Cu-SnO2 sensors to 20, 50, and 100 ppm acetone at (i) 300 °C and (ii) 400 °C in air.
Chemosensors 11 00059 g007
Figure 8. Temperature dependences of (a) resistances in air and responses to (b) 100 ppm acetone and (c) 100 ppm toluene of d-SnO2, pr-SnO2, and pr-wCu-SnO2 sensors, together with (d) concentration dependences of responses to acetone of pr-SnO2 and pr-wCu-SnO2 sensors at 350 °C in air.
Chemosensors 11 00059 g008
Figure 9. Response transients to dry synthetic air (21% O2) of pr-SnO2 and pr-1.6Cu-SnO2 sensors in dry N2.
Chemosensors 11 00059 g009
Figure 10. Catalytic combustion behavior of 100 ppm acetone over pr-SnO2 and pr-1.6Cu-SnO2 powders in air; (a) acetone conversion, (b) CO2 production ratio.
Chemosensors 11 00059 g010
Disclaimer/Publisher’s Note: The statements, opinions and data contained in all publications are solely those of the individual author(s) and contributor(s) and not of MDPI and/or the editor(s). MDPI and/or the editor(s) disclaim responsibility for any injury to people or property resulting from any ideas, methods, instructions or products referred to in the content.

