Abstract
Oxytetracycline (OTC) is an environmental pollutant caused by the abuse of antibiotics, and its content in water is closely related to human health. Therefore, the development of a simple, rapid, and accurate method to detect OTC has become desirable. In this work, a ratiometric fluorescence probe based on deep red emissive CdTe quantum dots (QDs) modified by mercaptopropionic acid and Eu3+ is developed to accurately and rapidly detect OTC in water. After the addition of OTC, the photoluminescence intensity of CdTe QDs at 698 nm remains almost unchanged, while the peak at 617 nm intensifies within 40 s due to the coordination of Eu3+ with OTC. An excellent linear relationship is present between the photoluminescence intensity ratio of I617/I698 and the concentration of OTC. The limit of detection of the probe towards OCT is 5.4 nM. In addition, the probe shows good selectivity and anti-interference ability for OTC in the presence of other antibiotics, including other antibiotics, ions, and amino acids. The probe has been successfully applied to detect OTC in actual samples, demonstrating its potential for environmental application.
1. Introduction
Oxytetracycline (OTC) is widely used in agriculture and aquaculture as a growth promoter. Unfortunately, OTC residues in soil and water affect animals, plants, and human health through the ecological cycle [1]. Several approaches have been developed to detect OTC, such as high-performance liquid chromatography, enzyme-linked immunosorbent assays, liquid chromatography-mass spectrometry, molecular imprinted electrochemical sensing, plasmonic sensors, surface-enhanced Raman spectroscopy, and aptasensors [2,3,4,5,6,7,8]. However, these analysis methods have strict requirements for operators and instruments, and the analysis process is complex. Therefore, there is an urgent need to develop simple, rapid, and accurate means to detect OTC residues in the environment.
As a new sensing technology, fluorescence-based sensing has been developed rapidly in recent years due to its advantages of fast response speed and simple operation [9,10,11]. Some fluorescent materials, such as small organic molecules, polymers, carbon dots (CDs), metal-organic frameworks (MOFs), semiconductor quantum dots, etc., are used to detect tetracycline (TC) antibiotics [12,13,14]. Zhuang et al. have designed a novel organic fluorescence probe based on conjugated tetraphenylethylene polymers with a limit of detection (LOD) of 1.23 μg/mL, whose fluorescence can be quenched by tetracycline through the photoinduced electron transfer (PET) mechanism [15]. Yan et al. also prepared yellow-green emissive CDs at room temperature by amine-aldehyde condensation and applied them as a fluorescence probe to detect TC through the inner filter effect (IFE) with a LOD of 6.0 μM [16]. Besides this, Liu et al. designed two kinds of MOFs as fluorescence probes to detect the various TCs in water and egg. In the presence of TCs, the fluorescence of MOFs was quenched through fluorescence resonance energy transfer (FRET), IFE, and PET mechanisms [17]. Nevertheless, most of the above-mentioned fluorescent probes are based on quenching of the fluorescence signals. However, several factors, including temperature, probe concentration, solution pH, etc., can affect the fluorescence intensity of the probe [18]. Therefore, fluorescent probes based on quenching of a single fluorescence signal are prone to false positive results. In contrast, ratiometric fluorescent probes have better accuracy and sensitivity determination than fluorescence quenching probes [19,20,21].
CdTe quantum dots (CdTe QDs) have the advantages of high fluorescence quantum yield, good photostability, and adjustable emission wavelength. Hence, they are often used as fluorescent probes to detect metal ions and some small organic molecules [22,23,24]. For example, Hua et al. reported a kind of CdTe QDs with near-infrared (NIR) emission at 713 nm to selectively detect uranyl ions with a LOD of 7.88 nM. The fluorescence quenching of CdTe QDs was attributed to the coordination interaction between sulfur groups on the surface of CdTe QDs and uranium ions [25]. Fan et al. exploited a visual fluorescent probe based on CdTe QDs with emission at 580 nm for the detection of aminoglycoside antibiotics (NEO). With the addition of NEO, the fluorescence intensity of CdTe QDs was gradually quenched, and the emission wavelength shifted from 580 to 617 nm on account of the hydrogen bond interaction [26]. Besides, Eu3+, as a representative metal of the lanthanide series, is often applied as a response group to construct ratiometric probes with other fluorescence materials due to its bright red emission, narrow full-width at half-maximum, and low interference [27,28,29].
In this work, we have constructed a ratiometric fluorescence probe based on deep red emissive CdTe QDs modified by mercaptopropionic acid (MPA) and Eu3+ for rapid and accurate detection of OTC in aqueous environmental samples (Figure 1). After adding 0 to 10 μM OTC gradually, the photoluminescence intensity of CdTe QDs at 698 nm hardly changed, while that of Eu3+ enhanced within 40 s, attributable to the coordination interaction between Eu3+ and OTC, which is beneficial to sensitize Eu3+ by energy transfer from OTC to Eu3+. Besides, the bright deep red emission of CdTe QDs can contribute to reducing the background interference. Moreover, the photoluminescence ratio of I617/I698 and the concentration of OTC exhibited an excellent linear relationship. This probe shows the potential practical application because of its excellent selectivity, good recovery rate (93.9–112.3%), rapid response within 40 s, and great sensitivity (LOD of 5.4 nM).

Figure 1.
(a) Synthetic route of CdTe QDs. (b) Construction of ratiometric fluorescence probe and its application for OTC detection.
2. Experimental
2.1. Materials and Instrumentation
Te powder, CdCl2·2.5H2O, EuCl3·6H2O, KCl, MgSO4, Na2CO3, Al(NO3)3, L-aspartic acid (L-Asp), L-cysteine (L-Cys), L-tyrosine (L-Tyr), and L-lysine (L-Lys) were obtained from Titan Co. Ltd (Shanghai, China). OTC, TC, doxycycline hydrochloride (DC), chlortetracycline hydrochloride (ClTC), chloramphenicol (ClMC), amoxicillin (AMC), ampicillin (APC), gentamicin sulfate (GTMC), roxithromycin (RMX), and kanamycin sulfate (KNMC) were purchased from Heowns Co. Ltd (Tianjin, China). Metronidazole (MTZ) and tinidazole (TNZ) were obtained from Macklin Biochemical Technology Co. Ltd (Shanghai, China). NaBH4 and MPA were purchased from TCI Chemical Co. Ltd (Shanghai, China).
Transmission electron microscopy (TEM) was performed on Talos F200X TEM (Thermo Fisher Scientific, Waltham, MA, US). Fourier transform infrared (FTIR) spectra were measured on a Nicolet iS20 IR spectrometer (Thermo Fisher Scientific, America). RF-6000 spectrophotometer and UV-2600 spectrophotometer (Thermo Fisher Scientific, America) were used to measure the fluorescence and UV-vis absorption spectra, respectively. ζ-potentials were measured by using ZetaPALS (Brookhaven Instruments Corporation, Holtsville, NY, USA). Luminescence lifetimes were performed on the Edinburgh FLS1000 fluorescence spectrograph (Edinburgh, England).
2.2. Synthesis of CdTe QDs
CdTe QDs were prepared according to the procedure presented in detail in our work [30]. In brief, Te powder (0.06 g), NaBH4 (0.1 g), and ultrapure water (10 mL) were mixed into a three-necked flask. The resultant black mixture was reacted for 8 h under the N2 atmosphere in an ice bath. The NaHTe precursor was obtained in the liquid supernatant.
210 μL MPA and 0.228 g CdCl2·2.5H2O were added to a 100 mL three-necked flask, and the solution pH was adjusted to 9. Next, the solution was bubbled with N2 for 30 min to remove the soluble oxygen. Then, NaHTe precursor was added to the above mixture, and the resulting solution was kept at 100 °C for 48 h under a N2 atmosphere to obtain CdTe QDs. The CdTe QDs were precipitated by acetone and dissolved into 100 mL ultrapure water.
2.3. OTC Detection
The ratiometric fluorescence probe CdTe QDs-Eu3+ was designed by reacting 10 μL CdTe QDs, 0.3 mM Eu3+, and 2 mL HEPEs buffer solution (pH = 7.1). Various concentrations of OTC, ranging from 0 to 10 μM, were added into the probe solution during sensing experiments to detect OTC. The photoluminescence spectra were collected at 390 nm excitation wavelength.
2.4. OTC Recovery Experiment
The actual OTC samples (2 mM) were prepared with river water and tap water. Amounts of 3 μM, 5 μM, and 8 μM practical samples were added to the probe for recovery.
3. Results and Discussion
3.1. Characterization of CdTe QDs
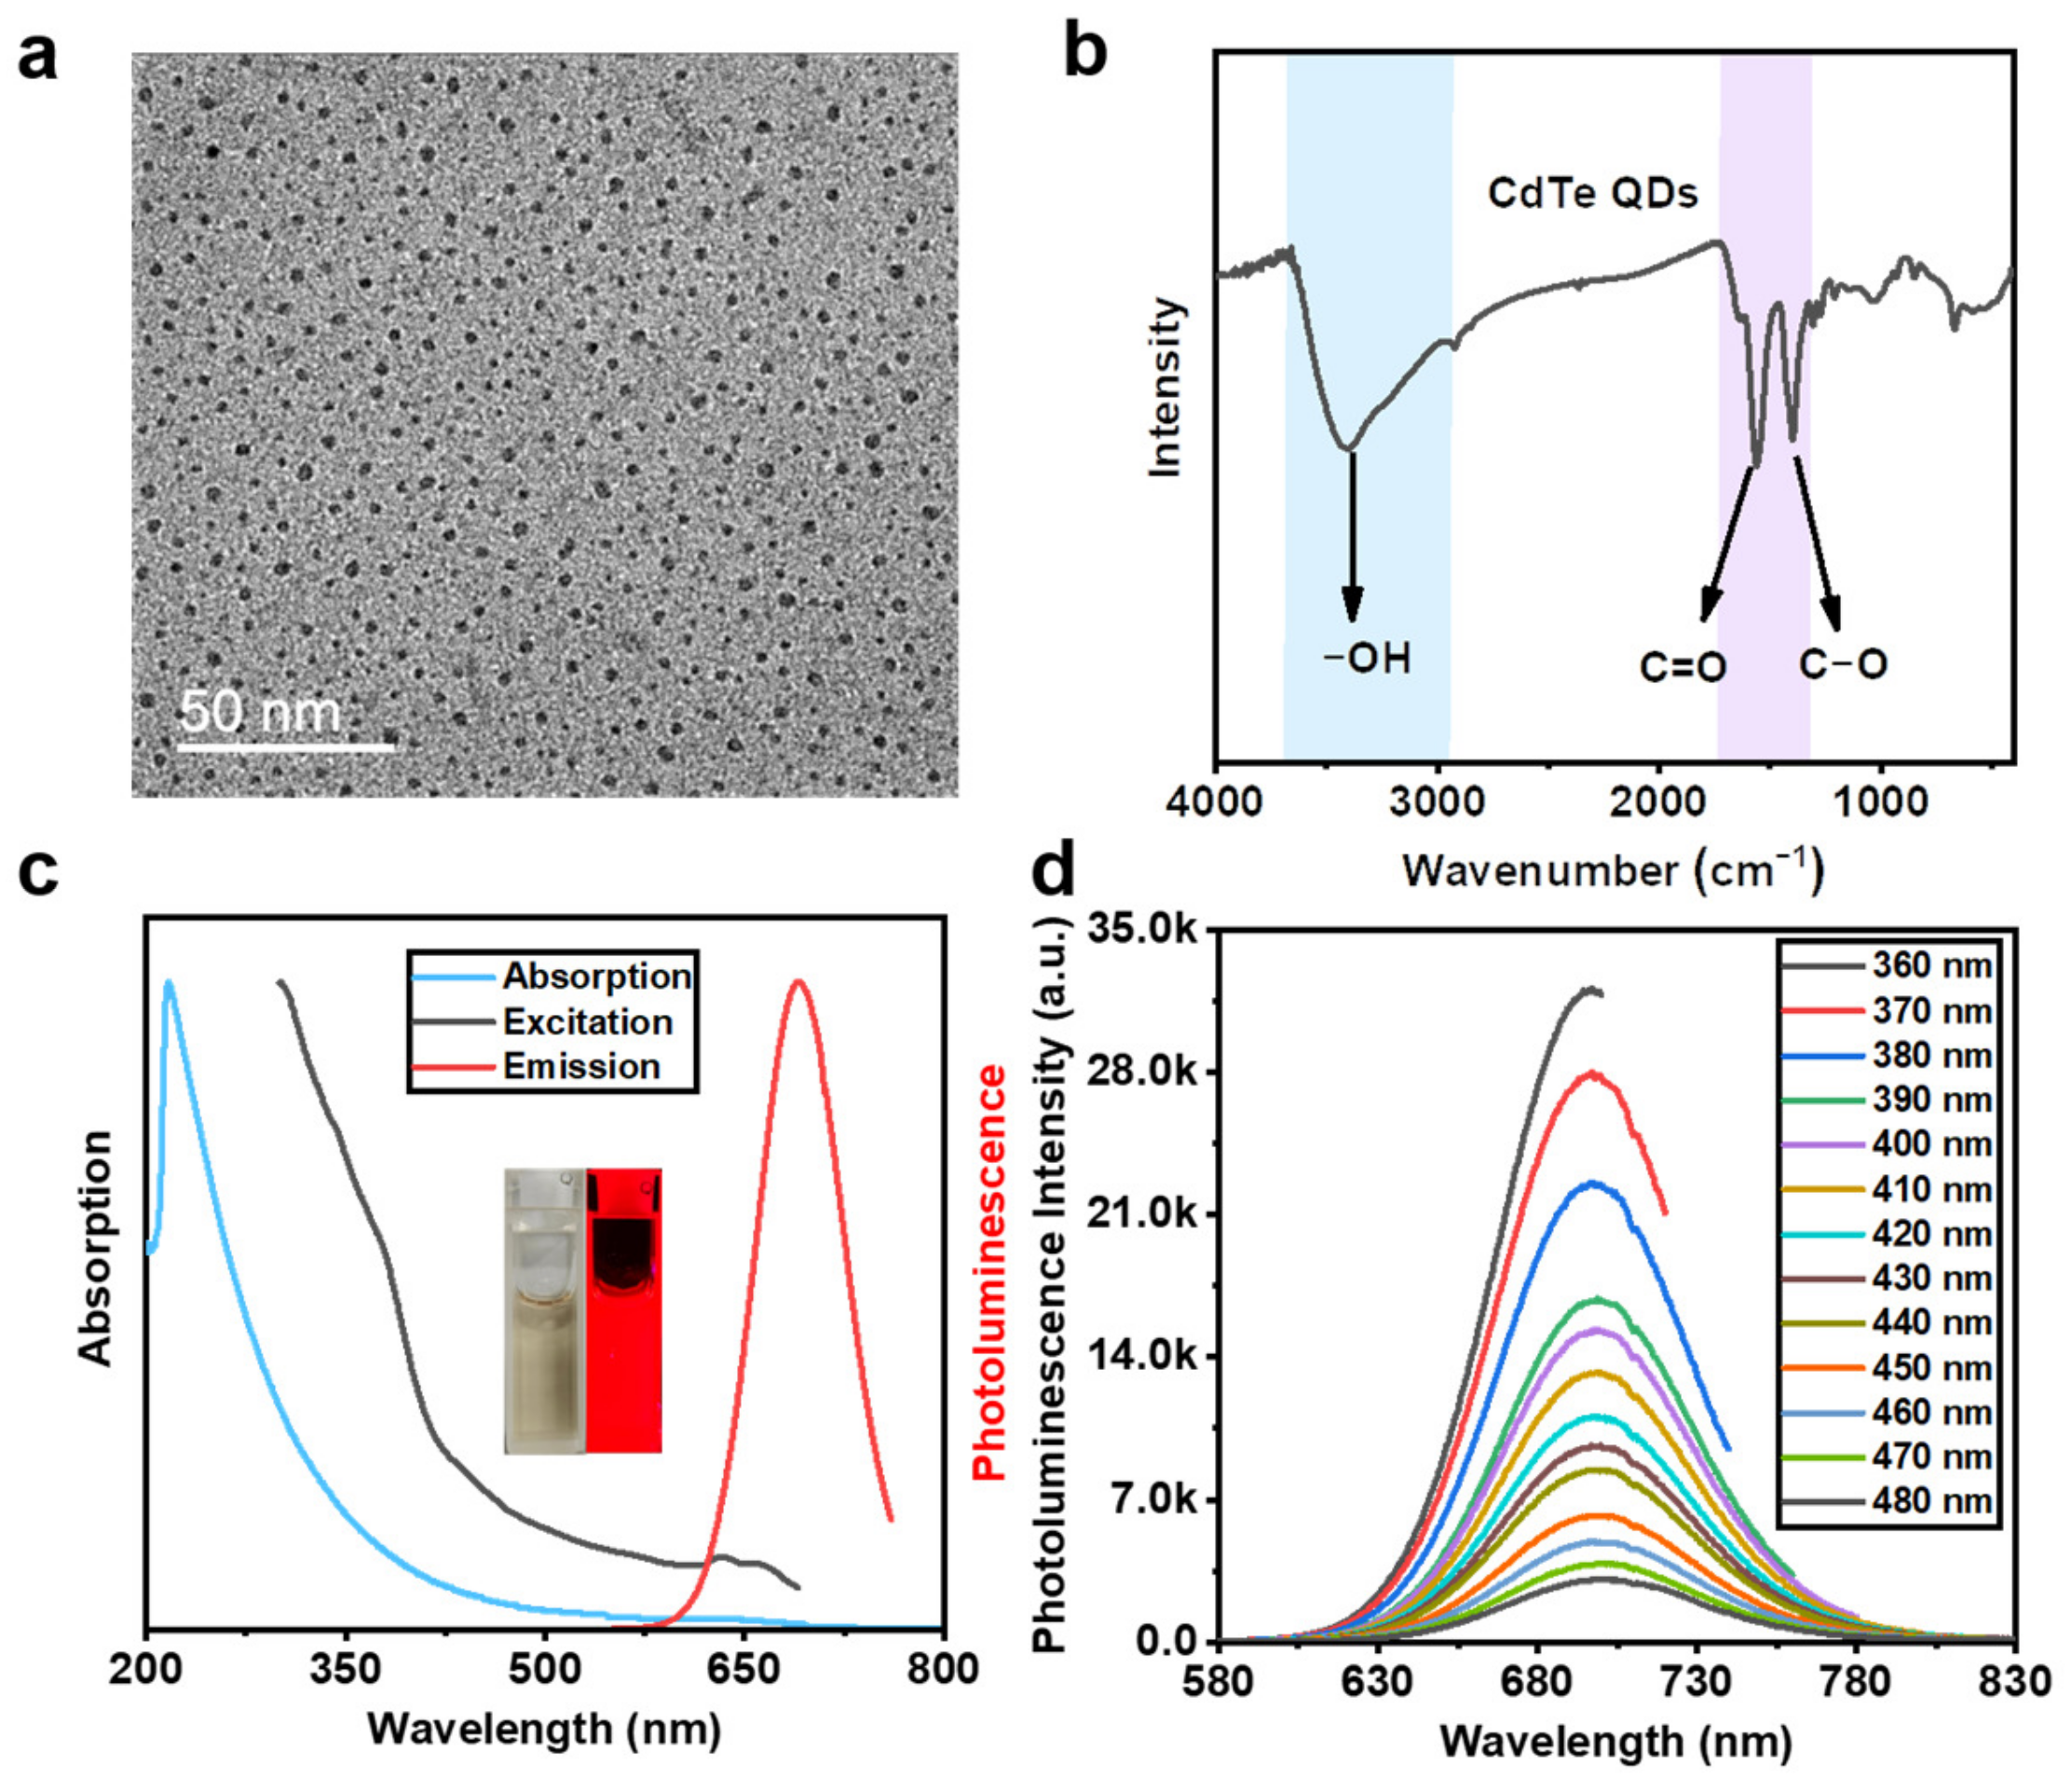
Deep red fluorescent CdTe QDs modified by MPA were prepared by following Figure 1a. CdTe QDs was prepared by cheap and readily available materials (Te powder, CdCl2·2.5H2O, and MPA) under mild, controlled reaction conditions, which possess good water solubility and are environmentally friendly. The morphology and particle size distribution of CdTe QDs were investigated by TEM. As seen in Figure 2a, CdTe QDs were uniformly distributed. The surface functional groups of CdTe QDs were determined by the FTIR spectrum. As observed in Figure 2b, CdTe QDs show a strong peak at 3406 cm−1, attributed to the stretching vibration of the hydroxyl group of MPA. Two strong and sharp peaks are also evident at ~1560 cm−1 and 1400 cm−1, ascribed to the C=O and C–O bonds of the MPA carboxyl group, respectively. The characteristic peak in the FTIR spectrum further proved that the surface of CdTe QDs is rich in −COOH groups, helpful in enhancing its hydrophilicity. The three obvious diffraction peaks at 25.2°, 42.3°, and 49.8° observed in the XRD pattern of CdTe QDs, as exhibited in Figure S1, are assigned to (111), (220), and (311) planes of CdTe QDs.
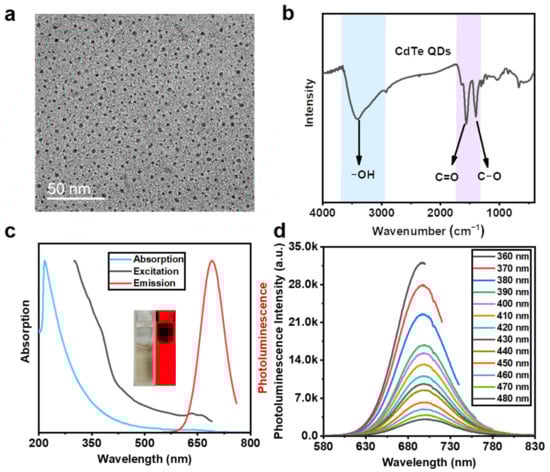
Figure 2.
(a) TEM image and (b) FTIR spectrum of CdTe QDs. (c) Absorption (blue), excitation (black), and emission (red) spectra of CdTe QDs. Insets show the solution pictures of CdTe QDs under natural light (left) and 365 nm UV light (right). (d) Excitation wavelength-dependent photoluminescence spectra of CdTe QDs.
The absorption and photoluminescence spectra of CdTe QDs are shown in Figure 2c. CdTe QDs show no obvious absorption peak. However, at 390 nm wavelength excitation, CdTe QDs displayed a strong emission peak at 690 nm. The CdTe QDs aqueous solution is clear and transparent brown and yellow under natural light, while it emits a bright deep red fluorescence under the UV lamp irradiation at 365 nm. At different excitation wavelengths from 360 to 480 nm, the emission maximum peak did not shift, but the photoluminescence intensity gradually decreased (Figure 2d), matching the excitation spectrum.
3.2. Ratiometric Fluorometric Detection for OTC
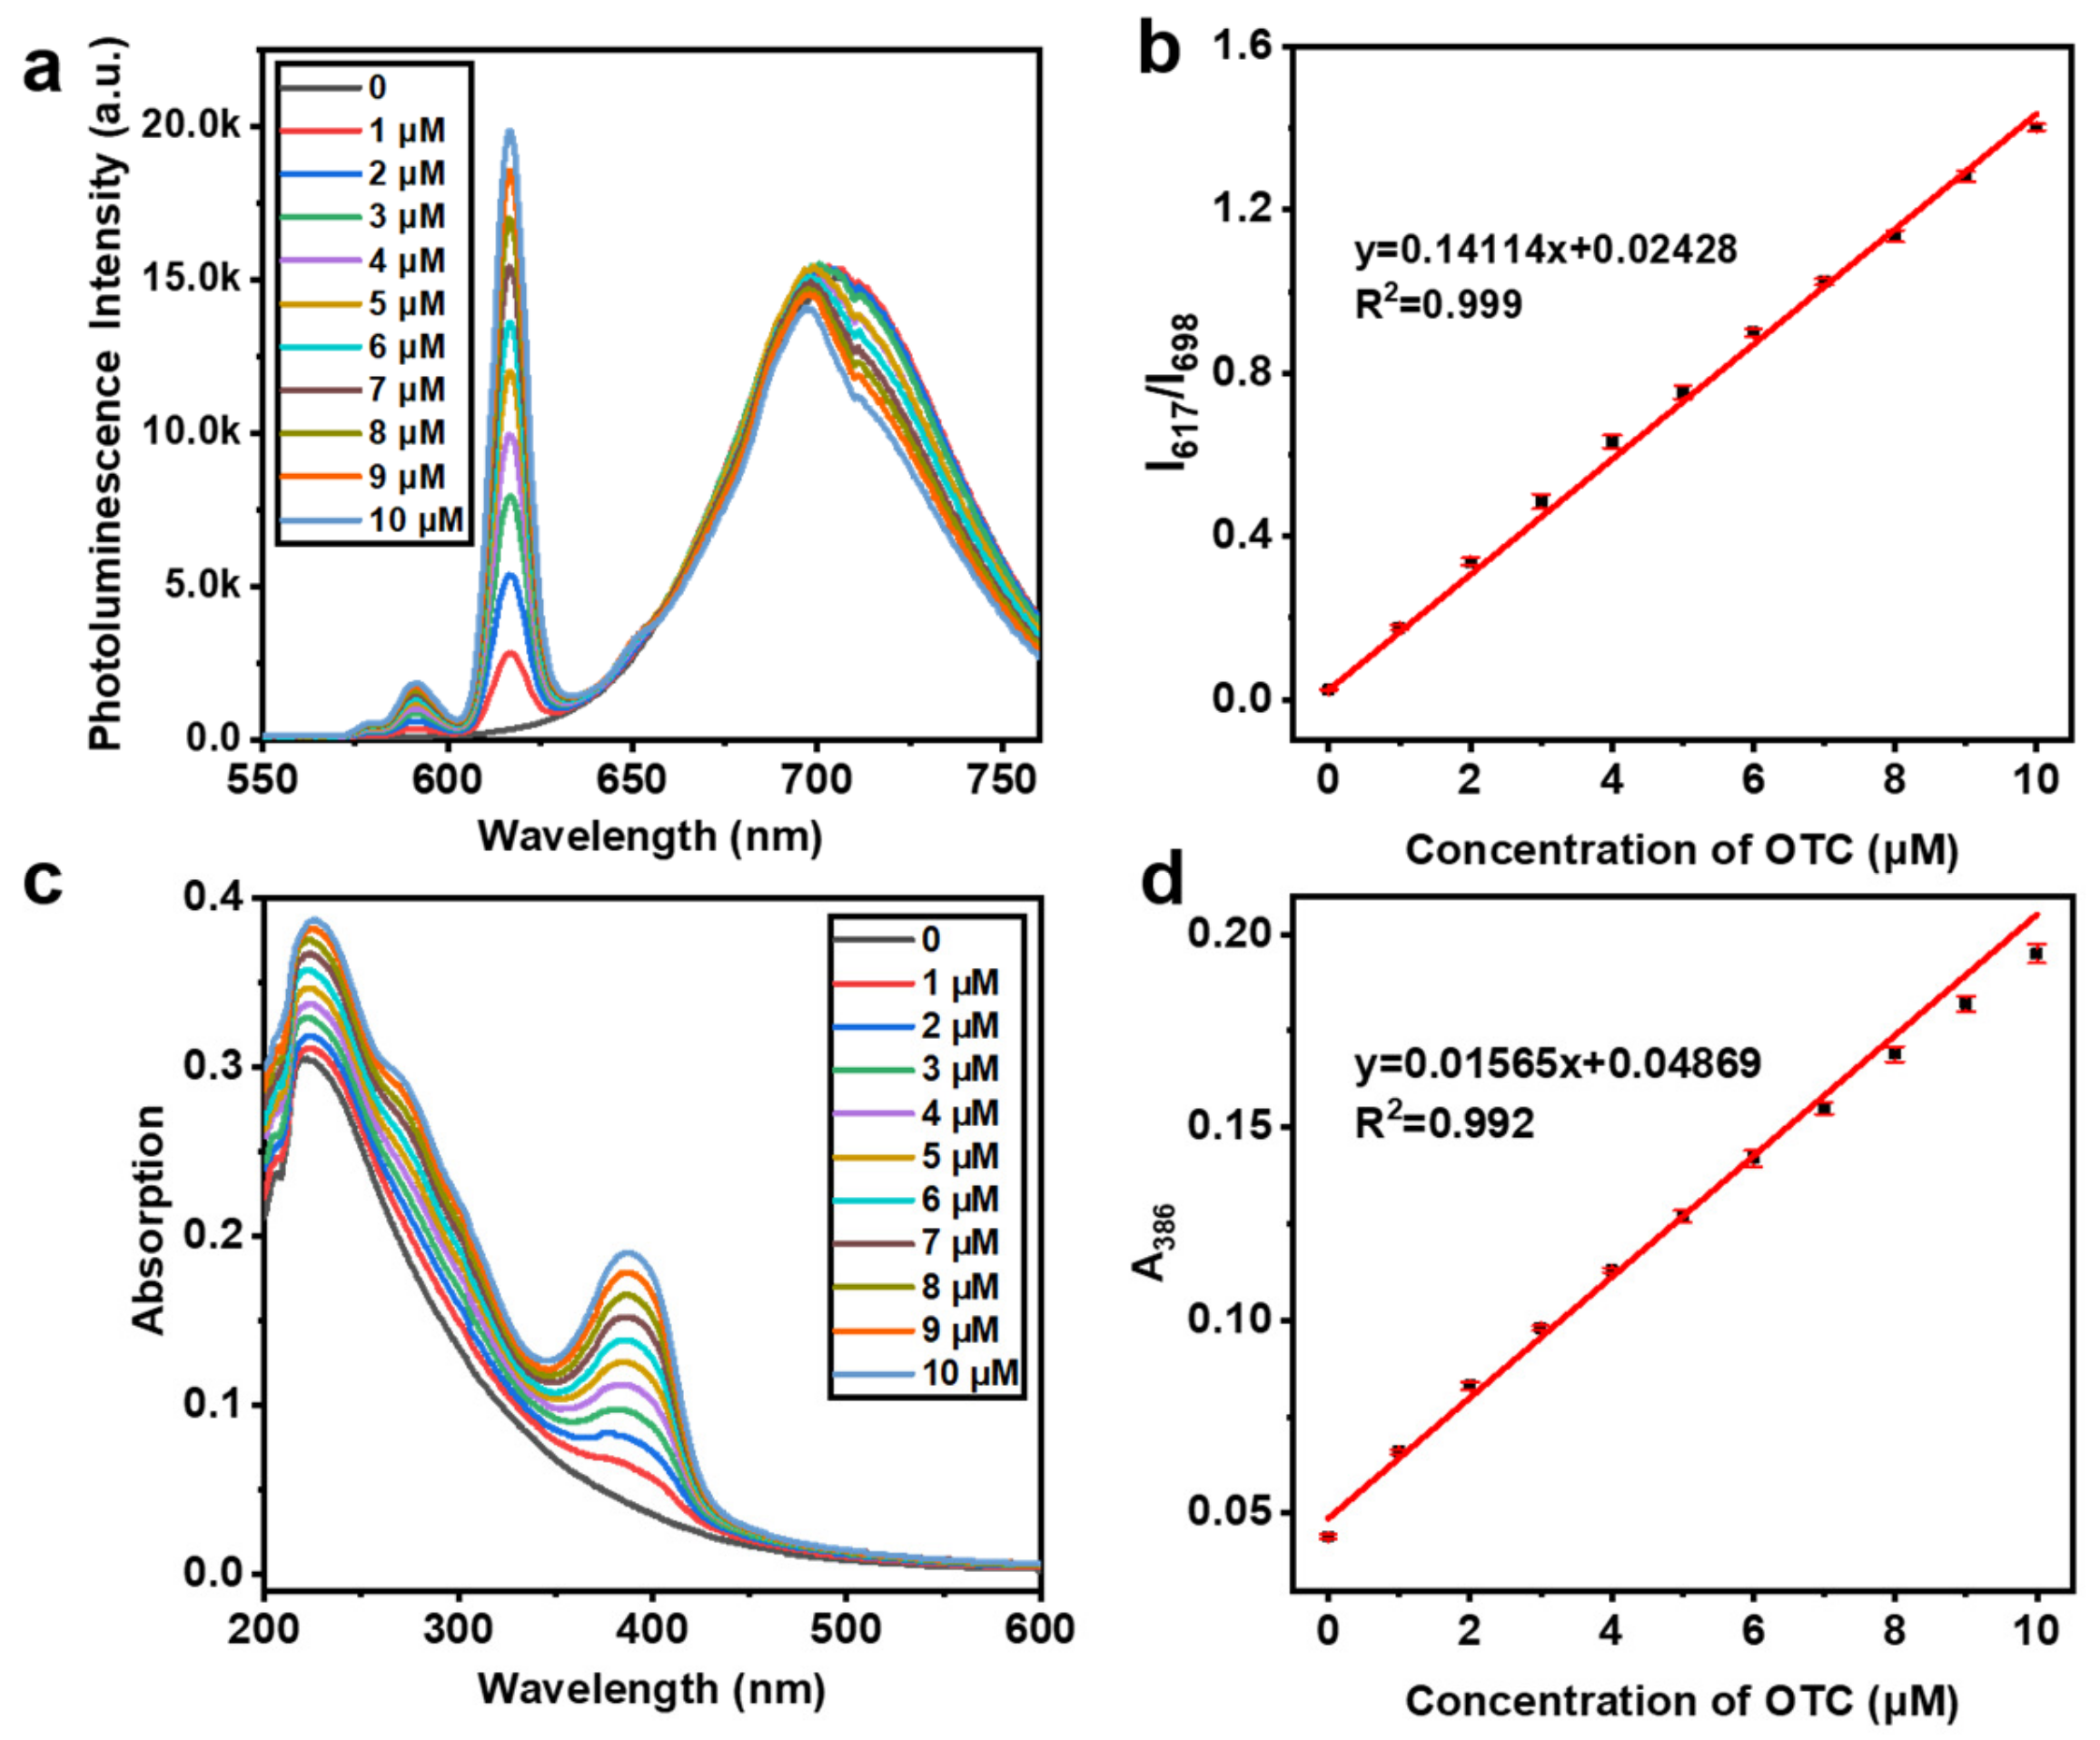
The mixed solution of CdTe QDs and Eu3+ was used as a ratiometric fluorescence probe to detect OTC. As observable in Figure 3a, upon increasing the concentration of OTC from 0 to 10 μM, the emission peak of CdTe QDs decreased slightly, which can be ignored. As expected, the Eu3+ emission at 617 nm enhanced gradually. The intensity ratio of I617/I698 exhibited a good linear relationship (R2 = 0.999) with the concentration of OTC in the 0–10 μM range (Figure 3b). During the titration with successive increments of OTC concentration, the absorption peak of CdTe QDs at 386 nm gradually increased, as shown evident from absorption spectra in Figure 3c. Similarly, a good linear relationship (R2 = 0.992) between the absorbance at 386 nm and OTC concentration was obtained (Figure 3d). The LOD of CdTe QDs-Eu3+ towards OTC was calculated to be 5.4 nM after five parallel experiments, which is lower than most fluorescent probes used for OTC (Table 1). These results demonstrate that CdTe QDs can detect OTC with high accuracy and sensitivity.
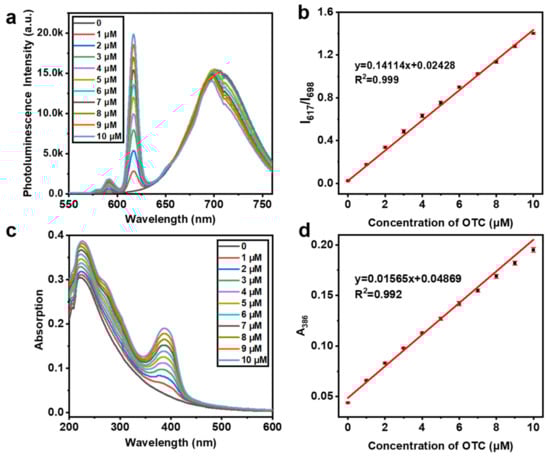
Figure 3.
(a) Photoluminescence and (c) absorption spectra of mixed CdTe QDs and Eu3+ solution upon addition of (0–10) μM OTC with the concentration interval of 1 μM. The linear relationship graph of (b) I617/I698 and (d) absorbance at 386 nm with increasing concentration of OTC.

Table 1.
Comparison of different fluorescent probes for TCs detection.
3.3. Mechanism of OTC Detection
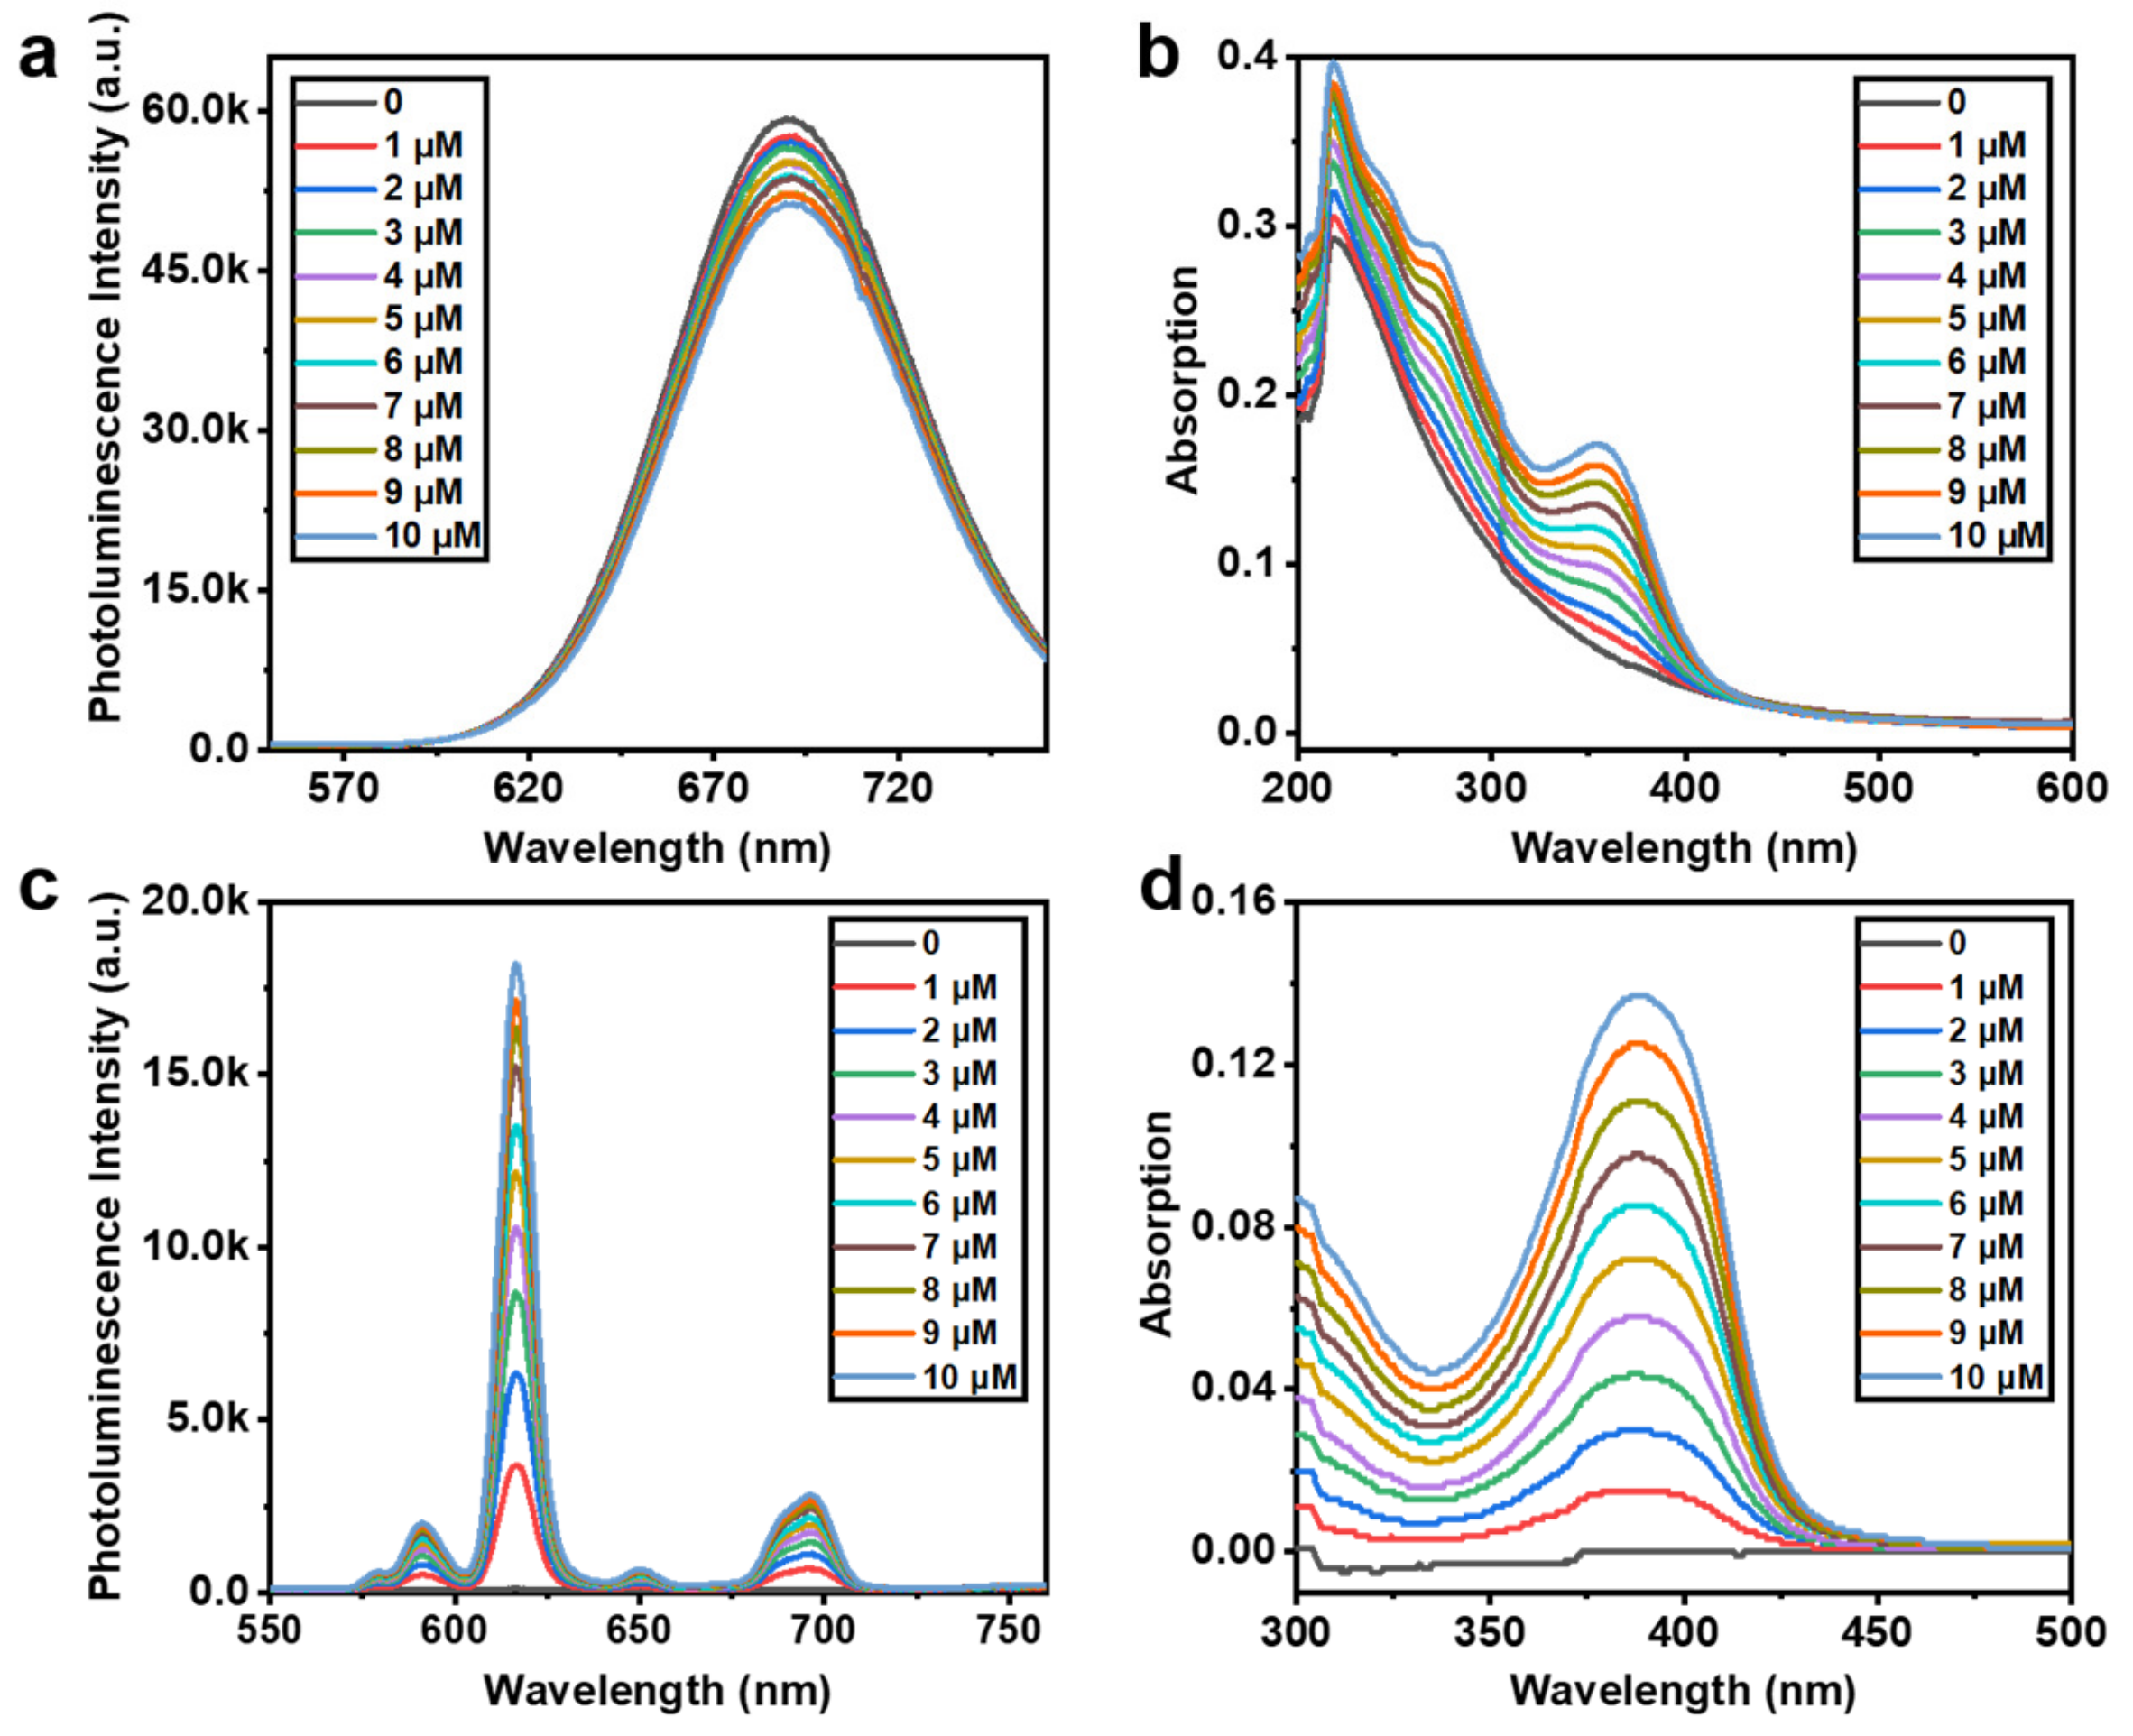
In order to explore the detection mechanism of OTC, the response of CdTe QDs and Eu3+ was investigated individually towards different concentrations of OTC. The photoluminescence intensity of CdTe QDs somewhat decreased (Figure 4a), while the absorption peak at 356 nm, which belongs to OTC, increased (Figure 4b) upon adding OTC solutions of increased concentrations from 0 to 10 μM. These observations imply that mixing CdTe QDs with OTC produces no new substance. In contrast, a new fluorescence peak at 617 nm emerged and intensified with 0–10 μM OTC addition due to the coordination between the Eu3+ and OTC (Figure 4c) [42]. Thus, OTC serves as the antenna ligand exerting the antenna effect and transferring the energy to Eu3+ [43]. The newly generated absorption peak at 386 nm in Figure 4d also indicates that a new complex is formed after adding OTC into the Eu3+ solution, which is discrepant with the absorption at 356 nm of OTC (Figure 4b). This peak is consistent with the absorption titration response peak of the fluorescent probe with OTC, evident in Figure 4c.
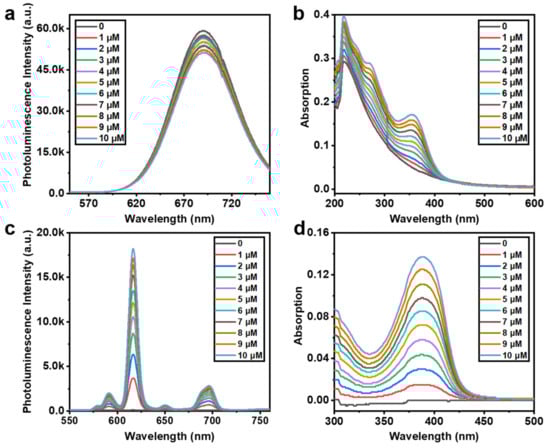
Figure 4.
Photoluminescence and absorption spectra of CdTe QDs (a,b) and Eu3+ (c,d) upon the addition of different concentrations of OTC in the range of 0 to 10 μM with the concentration interval of 1 μM.
To further verify our inference, we also tested the zeta potential of CdTe QDs, CdTe QDs-Eu3+, and CdTe QDs-Eu3+-OTC (Table S1), which was −17.0 mV, 30.9 mV, and 28.6 mV, respectively, demonstrating that the probe was formed through the electrostatic attraction between -COOH groups of CdTe QDs and Eu3+. After adding OTC, Eu3+ can stabilize the electron-rich groups of OTC by forming coordination bonds. Moreover, the lifetime of the probe at 617 nm was 26.3 ns, which increased to 35.6 μs in the presence of OTC (Figure S2) because of the sensibilization of OTC by Eu3+, which further confirmed the energy transfer between OTC and Eu3+. The FTIR analysis (Figure S3) also corroborates the above conclusion.
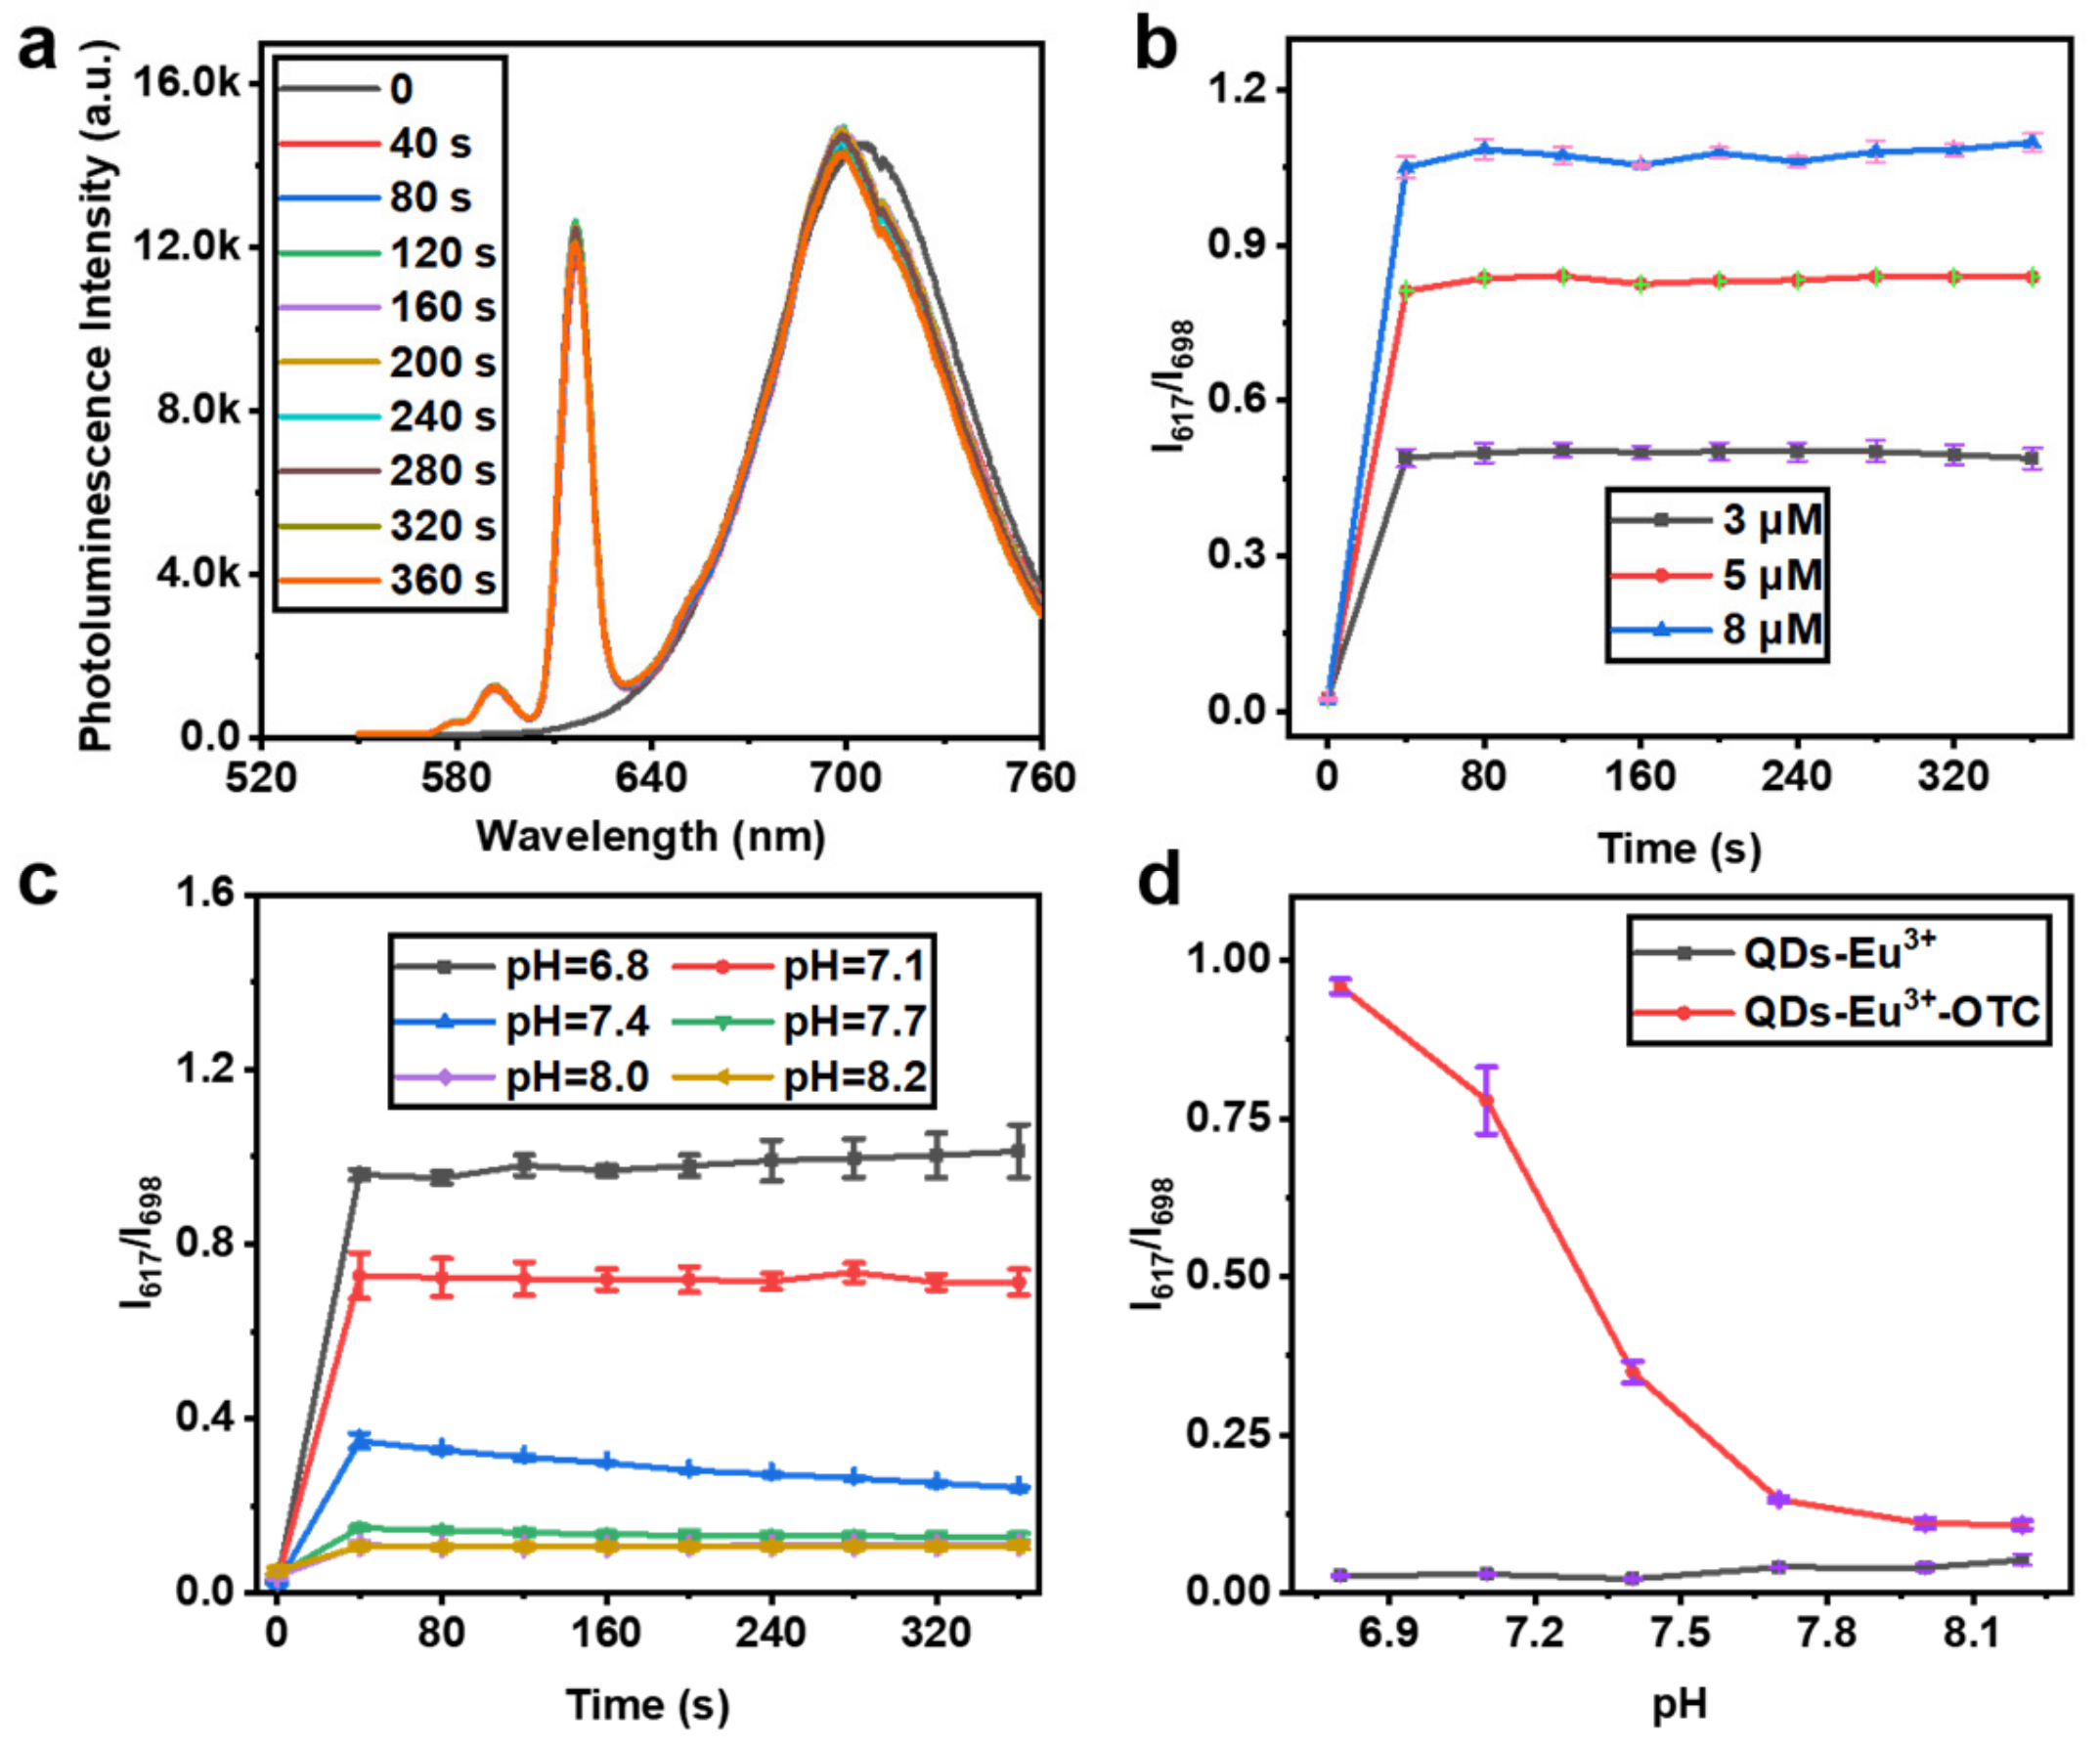
3.4. Time and pH-Dependent Response
The response speed and pH-dependency of the probe for OTC detection were explored by testing the response time of the probe at different concentrations of OTC and different pH. As shown in Figure 5a, the photoluminescence intensity of the probe at 617 nm and 698 nm remained nearly constant after 40 s for 5 μM OTC solution at pH 7.1. The point plot in Figure 5b also illustrates that the photoluminescence ratio of I617/I698 at different concentrations of OTC (3 μM, 5 μM, and 8 μM) in pH 7.1 HEPEs buffer solution also stabilized after 40 s (Figure S4). Similarly, the reaction of the probe and 5 μM OTC was also accomplished in 40 s at various pH (6.8, 7.1, 7.4, 7.7, 8.0, and 8.2) in Figure 5c. However, the pH change from 6.8 to 8.2 resulted in a significant decrease in I617/I698 ratio due to the increased photoluminescence intensity of CdTe QDs at 698 nm in alkaline conditions (Figure 5d). HEPEs buffer solution (pH = 7.1) was used to dilute the probe, so the adding of OTC aqueous solution has little effect on the pH of the probe solution. The above results demonstrate that the probe CdTe QDs-Eu3+ can rapidly and sensitively detect OTC in neutral conditions.
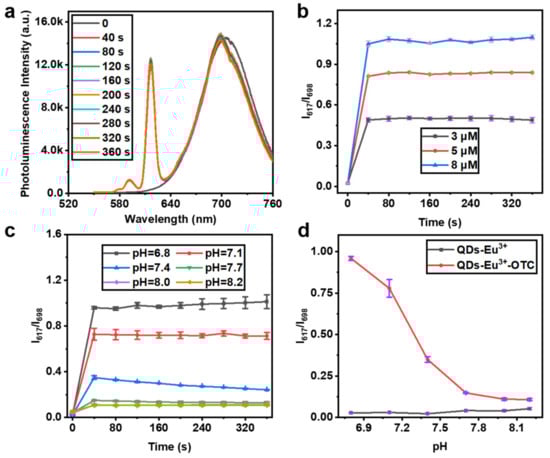
Figure 5.
(a) Changes in photoluminescence of probe solution in the presence of 5 μM OTC with reaction time increasing from (0 to 360) s. Point plot of I617/I698 of the probe for OTC detection at various concentrations of OTC (3 μM, 5 μM, and 8 μM) (b) and different pH (6.8–8.2) (c). (d) pH influence on probe response towards 5 μM OTC.
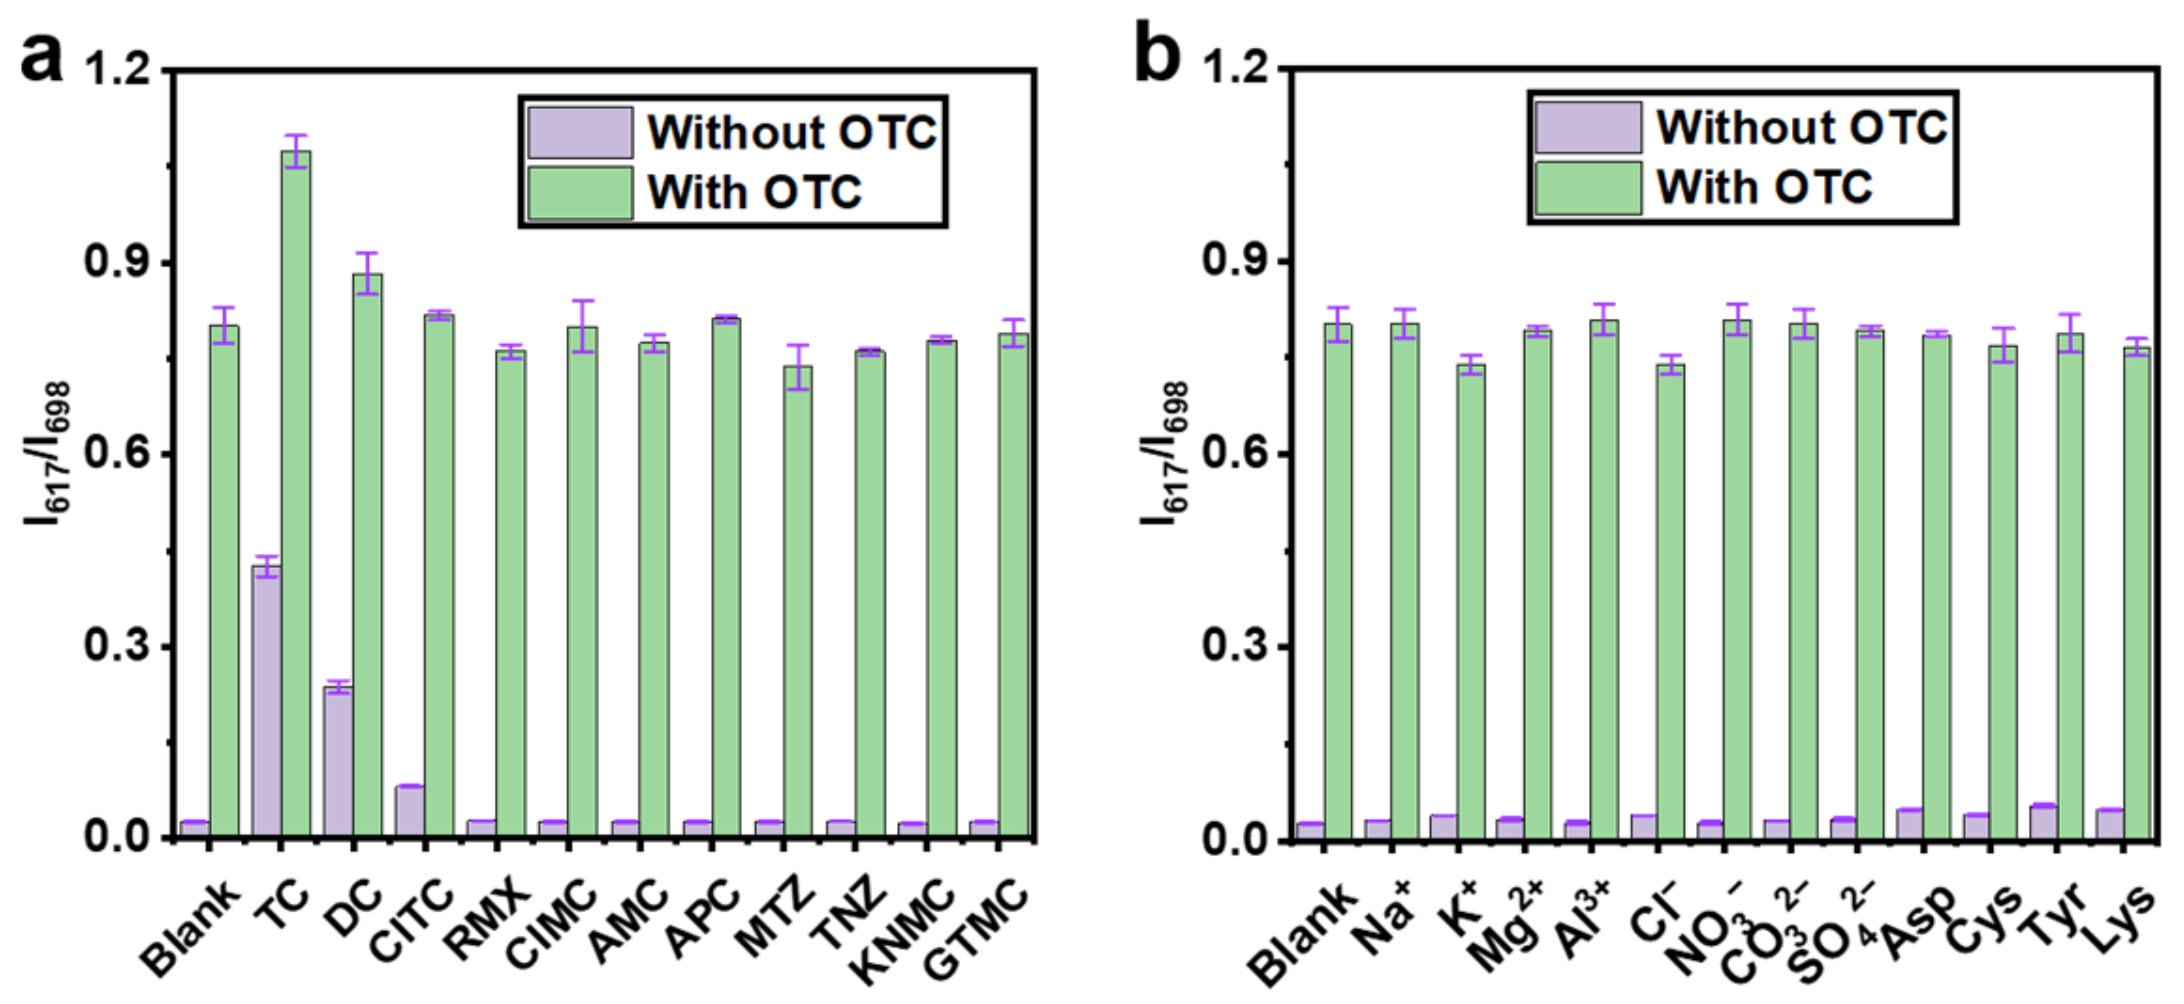
3.5. Selectivity and Anti-Interference
The selectivity of probe CdTe QDs-Eu3+ towards OTC and the effect of interfering species were also studied by introducing other antibiotics, cations, anions, and amino acids during the sensing experiment. As shown in Figure 6, this probe only responded to TCs, including OTC, TC, DC, and ClTC. At the same time, in the presence of other interfering substances (ions and amino acids), OTC was still able to significantly enhance the ratio of I617/I698, which was comparable to the control group. The specific response of the probe to TCs originates because Eu3+ can form coordination bonds with TCs possessing rich electron-donating groups, such as β-diketone moieties, acetamides, and hydroxyl groups.
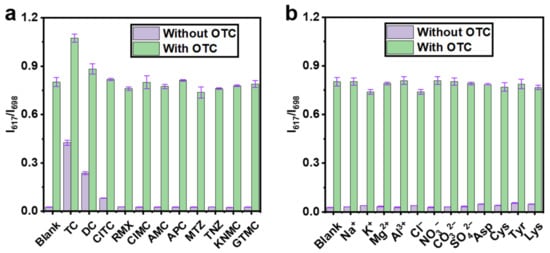
Figure 6.
Selectivity and anti-interference ability of probe for OTC detection in the presence of other antibiotics (a), cations, anions, and amino acids (b).
3.6. Real Samples Analysis
The detection ability of the CdTe QDs-Eu3+ probe towards OTC was also demonstrated in actual water samples. As shown in Table 2, the recovery of different concentrations of OTC (3 μM, 5 μM, 8 μM) from river water and tap water were in the range of 93.9% to 112.3%, respectively, demonstrating the feasibility of using the CdTe QDs-Eu3+ probe to detect OTC accurately and sensitively.
Table 2.
Detection of OTC in real samples.
4. Conclusions
In this work, we constructed a ratiometric fluorescence probe consisting of deep-red emissive CdTe QDs and Eu3+ to selectively and rapidly detect OTC with a low LOD of 5.4 nM. Upon the introduction of 0 to 10 μM OTC into the probe solution, the photoluminescence intensity of CdTe QDs almost remained unchanged, whereas the photoluminescence emission peak at 617 nm was generated and intensified due to the energy transfer from OTC to Eu3+ through coordination bonds. The photoluminescence intensity ratio I617/I698 presented a good linear relationship with the concentration of OTC (R2 = 0.999). The selectivity, anti-interference capability, and good actual sample recovery demonstrated the potential of this probe as a promising platform for specific and accurate detection of OTC in a practical environment.
Supplementary Materials
The following supporting information can be downloaded at: https://www.mdpi.com/article/10.3390/chemosensors11010062/s1, Figure S1: The XRD pattern of CdTe QDs, Figure S2: The lifetime of CdTe QDs-Eu3+ and CdTe QDs-Eu3+-OTC at 617 nm, Figure S3: The FTIR spectra of CdTe QDs, CdTe QDs-Eu3+, and CdTe QDs-Eu3+-OTC, Figure S4: The fluorescence spectra of probe for OTC detection at different concentration of OTC at 3 μM (a), 5 μM (b), and 8 μM (c) with reaction time changing from 0 to 360 s, Figure S5: The fluorescence spectra of probe for OTC detection at different pH at 6.8 (a), 7.1 (b), 7.4 (c), 7.7 (d), 8.0 (e), and 8.2 (f) with reaction time changing from (0 to 360) s, Table S1: The zeta potential of CdTe QDs, CdTe QDs-Eu3+ and CdTe QDs-Eu3+-OTC.
Author Contributions
M.L. planned and supervised the project. S.T. and Q.W. contributed equally to this work. S.T. and Q.W. designed and carried out the detailed experiments, analyzed the data, and wrote the whole paper. Q.T. helped for the fluorescence and absorption determination for CdTe QDs. L.H. provided the real water samples and discussion of the paper. S.Z., B.W. and X.S. contributed to the structure characterization and photophysical experiments of CdTe QDs. All authors have read and agreed to the published version of the manuscript.
Funding
This research was funded by National Natural Science Foundation of China [62175262]; Fundamental Research Funds for the Central South Universities [2020CX021]; Key R & D plan of Hunan Province: [2022SK2101]; The science and technology innovation Program of Hunan Province [2022RC1201].
Institutional Review Board Statement
Not applicable.
Informed Consent Statement
Not applicable.
Data Availability Statement
Data will be made available upon request.
Acknowledgments
This work was supported by the National Natural Science Foundation of China (No. 62175262), Fundamental Research Funds for the Central South Universities (No. 2020CX021), the Key R & D plan of Hunan Province (No. 2022SK2101), and The Science and Technology Innovation Program of Hunan Province (No. 2022RC1201).
Conflicts of Interest
The authors declare no conflict of interest.
References
- Zhao, Y.; Ong, S.; Chen, Y.; Huang, P.-J.J.; Liu, J. Label-free and Dye-free Fluorescent Sensing of Tetracyclines Using a Capture-Selected DNA Aptamer. Anal. Chem. 2022, 94, 10175–10182. [Google Scholar] [CrossRef] [PubMed]
- Chern, M.; Garden, P.M.; Baer, R.C.; Galagan, J.E.; Dennis, A.M. Transcription Factor Based Small-Molecule Sensing with a Rapid Cell Phone Enabled Fluorescent Bead Assay. Angew. Chem. Int. Ed. 2020, 59, 21597–21602. [Google Scholar] [CrossRef] [PubMed]
- Wang, S.; Sun, M.Y.; Zhang, Y.H.; Li, H.; Zhang, Y.H.; Li, H.; Gao, J.W.; Song, S.; Sun, J.; Liu, H.; et al. Ultrasensitive antibiotic perceiving based on aptamer-functionalized ultraclean graphene field-effect transistor biosensor. Anal. Chem. 2022, 94, 14785–14793. [Google Scholar] [CrossRef] [PubMed]
- Li, Y.; Wang, Y.; Du, P.; Zhang, L.; Liu, Y.; Lu, X. Fabrication of carbon dots@hierarchical mesoporous ZIF-8 for simultaneous ratiometric fluorescence detection and removal of tetracycline antibiotics. Sens. Actuators B Chem. 2022, 358, 131526. [Google Scholar] [CrossRef]
- Zong, L.-P.; Li, J.; Shu, G.; Liu, X.; Marks, R.S.; Zhang, X.-J.; Cosnier, S.; Shan, D. Rational Design of a Highly Dispersed Fe–N–C Nanosheet with 1,10-Phenanthroline-2,9-Dicarboxylic Acid as a Preorganized Ligand: Boosted Electrochemiluminescence Detection of Tetracycline. Anal. Chem. 2022, 94, 1325–1332. [Google Scholar] [CrossRef]
- Zhao, W.; Dai, B.L.; Zhu, F.X.; Tu, X.Y.; Xu, J.M.; Zhang, L.L.; Li, S.Y.; Leung, D.Y.C.; Sun, C. A novel 3D plasmonic p-n heterojunction photocatalyst: Ag nanoparticles on flower-like p-Ag2S/n-BiVO4 and its excellent photocatalytic reduction and oxidation activities. Appl. Catal. B Environ. 2018, 229, 171–180. [Google Scholar]
- Liu, B.; Zheng, S.; Li, H.; Xu, J.; Tang, H.; Wang, Y.; Wang, Y.; Sun, F.; Zhao, X. Ultrasensitive and facile detection of multiple trace antibiotics with magnetic nanoparticles and core-shell nanostar SERS nanotags. Talanta 2022, 237, 122955. [Google Scholar] [CrossRef]
- Wang, X.Y.; Rong, X.J.; Zhang, Y.; Luo, F.; Qiu, B.; Wang, J.; Lin, Z.Y. Homogeneous photoelectrochemical aptasensors for tetracycline based on sulfur-doped g-C3N4/n-GaN heterostructures formed through self-assembly. Anal. Chem. 2022, 94, 3735–3742. [Google Scholar] [CrossRef]
- Li, X.; Hu, Q.; Yang, K.; Zhao, S.; Zhu, S.; Wang, B.; Zhang, Y.; Yi, J.; Song, X.; Lan, M. Red fluorescent carbon dots for sensitive and selective detection and reduction of Au3+. Sens. Actuators B Chem. 2022, 371, 132534. [Google Scholar] [CrossRef]
- Li, X.; Xing, X.; Zhao, S.; Zhu, S.; Wang, B.; Lan, M.; Song, X. Carbon dot-based fluorescent and colorimetric sensor for sensitive and selective visual detection of benzoyl peroxide. Chin. Chem. Lett. 2022, 33, 1632. [Google Scholar] [CrossRef]
- Dou, W.-T.; Han, H.-H.; Sedgwick, A.C.; Zhu, G.-B.; Zang, Y.; Yang, X.-R.; Yoon, J.; James, T.D.; Li, J.; He, X.-P. Fluorescent probes for the detection of disease-associated biomarkers. Sci. Bull. 2022, 67, 853–878. [Google Scholar] [CrossRef]
- Wang, J.; Zhang, Q.; Liu, Z.; Yang, C.; Li, Y.; Ma, X.; Lv, T.; Sun, C. Label-Free Fluorescence Sensing Strategy Based on Functional Nucleic Acids via Energy Transfer between DNA-Templated Silver Nanoclusters and Gold Nanorods. J. Agric. Food Chem. 2022, 70, 12220–12231. [Google Scholar] [CrossRef]
- Wang, X.; Li, L.; Jiang, H.; Zhangsun, H.; Wang, Q.; Sun, X.; Wang, L. Highly selective and sensitive fluorescence detection of tetracyclines based on novel tungsten oxide quantum dots. Food Chem. 2022, 374, 131774. [Google Scholar] [CrossRef]
- Huang, C.Y.; Luo, Y.X.; Li, J.C.; Liu, C.; Zhou, T.S.; Deng, J.J. pH-regulated H4TCPE@Eu/AMP ICP sensor array and its fingerprinting on test papers: Toward point-of-use systematic analysis of environmental antibiotics. Anal. Chem. 2021, 93, 9183–9192. [Google Scholar] [CrossRef]
- Zhuang, Q.; Zhang, C.; Zhuang, H.; Deng, H.; Lin, X.; Li, Y.; Chen, H.; Xie, A.; Dong, W. Heteroatom-free conjugated tetraphenylethylene polymers for selectively fluorescent detection of tetracycline. Anal. Chim. Acta 2022, 1190, 339236. [Google Scholar] [CrossRef]
- Yan, Y.; Liu, J.H.; Li, R.S.; Li, Y.F.; Huang, C.Z.; Zhen, S.J. Carbon dots synthesized at room temperature for detection of tetracycline hydrochloride. Anal. Chim. Acta 2019, 1063, 144–151. [Google Scholar] [CrossRef]
- Liu, L.; Chen, Q.; Lv, J.; Li, Y.P.; Wang, K.C.; Li, J.R. Stable meta-organic frameworks for fluorescent detection of tetracycline antibiotics. Inorg. Chem. 2022, 61, 8015–8021. [Google Scholar] [CrossRef]
- Chen, B.-B.; Liu, M.-L.; Gao, Y.-T.; Chang, S.; Qian, R.-C.; Li, D.-W. Design and applications of carbon dots-based ratiometric fluorescent probes: A review. Nano Res. 2022, 1–20. [Google Scholar] [CrossRef]
- Wang, K.; Liu, L.; Mao, D.; Xu, S.; Tan, C.; Cao, Q.; Mao, Z.; Liu, B. A Polarity-Sensitive Ratiometric Fluorescence Probe for Monitoring Changes in Lipid Droplets and Nucleus during Ferroptosis. Angew. Chem. Int. Ed. 2021, 60, 15095–15100. [Google Scholar] [CrossRef]
- Park, S.-H.; Kwon, N.; Lee, J.-H.; Yoon, J.; Shin, I. Synthetic ratiometric fluorescent probes for detection of ions. Chem. Soc. Rev. 2020, 49, 143–179. [Google Scholar] [CrossRef]
- Li, X.; Zhao, S.; Li, B.; Yang, K.; Lan, M.; Zeng, L. Advances and perspectives in carbon dot-based fluorescent probes: Mechanism, and application. Co-Ord. Chem. Rev. 2021, 431, 213686. [Google Scholar] [CrossRef]
- Lee, T.; Enomoto, K.; Ohshiro, K.; Inoue, D.; Kikitsu, T.; Hyeon-Deuk, K.; Pu, Y.-J.; Kim, D. Controlling the dimension of the quantum resonance in CdTe quantum dot superlattices fabricated via layer-by-layer assembly. Nat. Commun. 2020, 11, 5471. [Google Scholar] [CrossRef] [PubMed]
- Jiang, R.; Lin, D.; Zhang, Q.; Li, L.; Yang, L. Multiplex chroma-response based fluorescent smartphone sensing platform for rapid and visual quantitative determination of antibiotic residues. Sens. Actuators B Chem. 2022, 350, 130902. [Google Scholar] [CrossRef]
- Liu, Q.; Lin, Y.; Xiong, J.; Wu, L.; Hou, X.; Xu, K.; Zheng, C. Disposable Paper-Based Analytical Device for Visual Speciation Analysis of Ag(I) and Silver Nanoparticles (AgNPs). Anal. Chem. 2019, 91, 3359–3366. [Google Scholar] [CrossRef] [PubMed]
- Hua, M.; Yang, S.; Ma, J.; He, W.; Kuang, L.; Hua, D. Highly selective and sensitive determination of uranyl ion by the probe of CdTe quantum dot with a specific size. Talanta 2018, 190, 278–283. [Google Scholar] [CrossRef]
- Fan, Y.; Che, S.Y.; Zhang, L.; Zhou, C.S.; Fu, H.Y.; She, Y.B. Highly sensitive visual fluorescence sensor for aminoglycoside antibiotics in food samples based on mercaptosuccinic acid-CdTe quantum dots. Food Chem. 2023, 404, 134040. [Google Scholar] [CrossRef]
- Wang, Q.; Li, X.; Yang, K.; Zhao, S.; Zhu, S.; Wang, B.; Yi, J.; Zhang, Y.; Song, X.; Lan, M. Carbon Dots and Eu3+ Hybrid-Based Ratiometric Fluorescent Probe for Oxytetracycline Detection. Ind. Eng. Chem. Res. 2022, 61, 5825–5832. [Google Scholar] [CrossRef]
- Xu, D.; Chen, W.; Zeng, M.; Xue, H.; Chen, Y.; Sang, X.; Xiao, Y.; Zhang, T.; Unocic, R.R.; Xiao, K.; et al. Crystal-Field Tuning of Photoluminescence in Two-Dimensional Materials with Embedded Lanthanide Ions. Angew. Chem. Int. Ed. 2018, 57, 755–759. [Google Scholar] [CrossRef]
- Wang, Y.; Li, B.; Song, X.; Shen, R.; Wang, D.; Yang, Y.; Feng, Y.; Cao, C.; Zhang, G.-L.; Liu, W. Mito-Specific Ratiometric Terbium(III)-Complex-Based Luminescent Probe for Accurate Detection of Endogenous Peroxynitrite by Time-Resolved Luminescence Assay. Anal. Chem. 2019, 91, 12422–12427. [Google Scholar] [CrossRef]
- Fu, Y.; Wu, S.; Zhou, H.; Zhao, S.; Lan, M.; Huang, J.; Song, X. Carbon Dots and a CdTe Quantum Dot Hybrid-Based Fluorometric Probe for Spermine Detection. Ind. Eng. Chem. Res. 2020, 59, 1723–1729. [Google Scholar] [CrossRef]
- Anand, S.K.; Sivasankaran, U.; Jose, A.R.; Kumar, K.G. Interaction of tetracycline with l-cysteine functionalized CdS quantum dots-Fundamentals and sensing application. Spectrochim. Acta Part A Mol. Biomol. Spectrosc. 2019, 213, 410–415. [Google Scholar] [CrossRef]
- Qian, S.; Qiao, L.; Xu, W.; Jiang, K.; Wang, Y.; Lin, H. An inner filter effect-based near-infrared probe for the ultrasensitive detection of tetracyclines and quinolones. Talanta 2019, 194, 598–603. [Google Scholar] [CrossRef]
- Liu, G.-N.; Xu, R.-D.; Zhao, R.-Y.; Sun, Y.; Bo, Q.-B.; Duan, Z.-Y.; Li, Y.-H.; Wang, Y.-Y.; Wu, Q.; Li, C. Hybrid Copper Iodide Cluster-Based Pellet Sensor for Highly Selective Optical Detection of o-Nitrophenol and Tetracycline Hydrochloride in Aqueous Solution. ACS Sustain. Chem. Eng. 2019, 7, 18863–18873. [Google Scholar] [CrossRef]
- Wang, T.; Mei, Q.; Tao, Z.; Wu, H.; Zhao, M.; Wang, S.; Liu, Y. A smartphone-integrated ratiometric fluorescence sensing platform for visual and quantitative point-of-care testing of tetracycline. Biosens. Bioelectron. 2020, 148, 111791. [Google Scholar] [CrossRef]
- Shi, C.; Qi, H.; Ma, R.; Sun, Z.; Xiao, L.; Wei, G.; Huang, Z.; Liu, S.; Li, J.; Dong, M.; et al. N,S-self-doped carbon quantum dots from fungus fibers for sensing tetracyclines and for bioimaging cancer cells. Mater. Sci. Eng. C 2019, 105, 110132. [Google Scholar] [CrossRef]
- Yao, R.; Li, Z.; Huo, P.; Gong, C.; Li, J.; Fan, C.; Pu, S. A Eu3+-based high sensitivity ratiometric fluorescence sensor for determination of tetracycline combining bi-functional carbon dots by surface functionalization and heteroatom doping. Dye. Pigment. 2022, 201, 110190. [Google Scholar] [CrossRef]
- Yan, F.; Sun, Z.; Pang, J.; Jiang, Y.; Zheng, W. Functionalized carbon dots of thiazole derivatives based on inner filter effect for tetracyclines detection. Dye. Pigment. 2020, 183, 108673. [Google Scholar] [CrossRef]
- Li, L.; Shi, L.; Jia, J.; Eltayeb, O.; Lu, W.; Tang, Y.; Dong, C.; Shuang, S. Red fluorescent carbon dots for tetracycline antibiotics and pH discrimination from aggregation-induced emission mechanism. Sens. Actuators B Chem. 2021, 332, 129513. [Google Scholar] [CrossRef]
- Han, L.; Fan, Y.Z.; Qing, M.; Liu, S.G.; Yang, Y.Z.; Li, N.B.; Luo, H.Q. Smartphones and Test Paper-Assisted Ratiometric Fluorescent Sensors for Semi-Quantitative and Visual Assay of Tetracycline Based on the Target-Induced Synergistic Effect of Antenna Effect and Inner Filter Effect. ACS Appl. Mater. Interfaces 2020, 12, 47099–47107. [Google Scholar] [CrossRef] [PubMed]
- Xing, X.; Huang, L.; Zhao, S.; Xiao, J.; Lan, M. S,N-Doped carbon dots for tetracyclines sensing with a fluorometric spectral response. Microchem. J. 2020, 157, 105065. [Google Scholar] [CrossRef]
- Zhang, Z.; Fan, Z. Application of cerium–nitrogen co-doped carbon quantum dots to the detection of tetracyclines residues and bioimaging. Microchem. J. 2021, 165, 106139. [Google Scholar] [CrossRef]
- Shen, Z.; Zhang, C.; Yu, X.; Li, J.; Wang, Z.; Zhang, Z.; Liu, B. Microwave-assisted synthesis of cyclen functional carbon dots to construct a ratiometric fluorescent probe for tetracycline detection. J. Mater. Chem. C 2018, 6, 9636–9641. [Google Scholar] [CrossRef]
- Zhang, S.; Sun, Q.; Liu, X.; Li, H.; Wang, J.; Chen, M. Ratiometric fluorescence detection of tetracycline for tetracycline adjuvant screening in bacteria. Sens. Actuators B Chem. 2022, 372, 132687. [Google Scholar] [CrossRef]

Disclaimer/Publisher’s Note: The statements, opinions and data contained in all publications are solely those of the individual author(s) and contributor(s) and not of MDPI and/or the editor(s). MDPI and/or the editor(s) disclaim responsibility for any injury to people or property resulting from any ideas, methods, instructions or products referred to in the content. |
© 2023 by the authors. Licensee MDPI, Basel, Switzerland. This article is an open access article distributed under the terms and conditions of the Creative Commons Attribution (CC BY) license (https://creativecommons.org/licenses/by/4.0/).