Article

Identification of Distinct and Common Subpopulations of Myxoid Liposarcoma and Ewing Sarcoma Cells Using Self-Organizing Maps

1
Sahlgrenska Center for Cancer Research, Department of Laboratory Medicine, Institute of Biomedicine, Sahlgrenska Academy at University of Gothenburg, Medicinaregatan 1F, 413 90 Gothenburg, Sweden
2
Multid Analyses, Sofierogatan 3A, 412 51 Gothenburg, Sweden
3
Group of Applied Analytical Chemistry, Department of Chemistry, University of A Coruña, Campus de Zapateira, 15071 A Coruña, Spain
4
Wallenberg Centre for Molecular and Translational Medicine, University of Gothenburg, Medicinaregatan 1F, 413 90 Gothenburg, Sweden
5
Department of Clinical Genetics and Genomics, Region Västra Götaland, Sahlgrenska University Hospital, Medicinaregatan 1D, 413 45 Gothenburg, Sweden
*
Author to whom correspondence should be addressed.
Chemosensors 2023, 11(1), 67; https://doi.org/10.3390/chemosensors11010067
Submission received: 18 November 2022 / Revised: 11 January 2023 / Accepted: 11 January 2023 / Published: 14 January 2023
(This article belongs to the Special Issue Analytical and Computational Systems in Biosensing)

Abstract

:
Myxoid liposarcoma and Ewing sarcoma are the two most common tumor types that are characterized by the FET (FUS, EWSR1 and TAF15) fusion oncogenes. These FET fusion oncogenes are considered to have the same pathological mechanism. However, the cellular similarities between cells from the different tumor entities remain unknown. Here, we profiled individual myxoid liposarcoma and Ewing sarcoma cells to determine common gene expression signatures. Five cell lines were analyzed, targeting 76 different genes. We employed unsupervised clustering, focusing on self-organizing maps, to identify biologically relevant subpopulations of tumor cells. In addition, we outlined the basic concepts of self-organizing maps. Principal component analysis and a t-distributed stochastic neighbor embedding plot showed gradual differences among all cells. However, we identified five distinct and robust subpopulations using self-organizing maps. Most cells were similar to other cells within the same tumor entity, but four out of five groups contained both myxoid liposarcoma and Ewing sarcoma cells. The major difference between the groups was the overall transcriptional activity, which could be linked to cell cycle regulation. We conclude that self-organizing maps are useful tools to define biologically relevant subpopulations and that myxoid liposarcoma and Ewing sarcoma exhibit cells with similar gene expression signatures.

1. Introduction

More than 20 forms of sarcomas and leukemias are characterized by FET (FUS, EWSR1, TAF15) fusion oncogenes (FET sarcomas and leukemias) that result from chromosomal translocations [1]. This group of fusion oncogenes shares 5′ regions of the FET genes that are juxtaposed to various transcription factors, resulting in abnormal chimeric transcription factors. These FET fusion oncogenes are believed to be causative in tumor development [2]. FET sarcomas and leukemias most often develop during childhood and early adulthood and are currently treated with advanced surgery, chemo- and radiotherapy. The two most common tumor entities carrying the FET family fusion oncogenes are myxoid liposarcoma (MLS) and Ewing sarcoma (EWS). A majority of MLSs carry the FUS-DDIT3 fusion oncogene, while the most prevalent fusion oncogene in EWS is EWSR1-FLI1. FET sarcomas and leukemias are genetically stable, with few additional mutations [3,4]. Despite their genetic similarities, FET sarcomas and leukemias have not been directly compared at the cellular level. Tumors, including FET sarcomas and leukemias, are heterogeneous, including several tumor subpopulations with different biological functions and cellular characteristics [5,6,7].
Conventional RNA sequencing and quantitative PCR (qPCR) methods only provide information about average gene expression levels that are indirectly correlated to quantitative changes within specific cellular subpopulations. Consequently, in pathological states, such as cancer, it is usually not possible to determine if perturbations of gene expression detected in the tissues are due to modifications in the relative composition of different cell types or to changes in the gene expression profile of a specific subpopulation. These limitations become particularly challenging to overcome when studying minority populations, such as therapy-resistant and cancer stem cells, whose identification is elusive due to their low prevalence and lack of exclusive markers. To overcome these challenges, several single-cell approaches have been developed during the last decade, especially for mRNA analysis [8,9]. Single-cell data analysis is generally more complex than traditional gene expression profile analysis, since the data are noisy due to low transcript levels, and because previously unknown subpopulations first need to be defined before in-depth comparisons can be made.
To address these issues, both supervised and unsupervised data analysis algorithms have been developed and adapted to single-cell gene expression analysis [10,11]. A self-organizing map (SOM), also known as a Kohonen neural network, is a powerful tool for the unsupervised grouping or clustering of samples [12,13]. The term “self-organizing” refers to the network’s capability to learn and organize samples without any output value associated to them, i.e., assigned sample classes [14]. Additional developments, such as counter-propagation neural networks, have rendered the SOM a supervised tool for grouping and classification [15,16]. However, the use of SOMs to identify subpopulation of tumors cells using gene expression profiling has been poorly studied.
Here, we profiled the gene expression profiles of 5 FET sarcoma cell lines, 3 MLS, and 2 EWS cell lines at the single-cell level to determine the differences and similarities among FET sarcoma cells using qPCR. Raw data were preprocessed according to a standardized workflow and visualized by principal component analysis (PCA) and a t-distributed stochastic neighbor embedding (t-SNE) plot. Unsupervised SOMs were employed to identify the biologically relevant subpopulations of tumor cells. Next, we determined the gene expression pattern of each SOM-identified subpopulation and its biological relevance. We also reviewed and discussed the basics of SOMs, including the influence of specific parameter settings.

2. Materials and Methods

2.1. Cell Culture

The myxoid liposarcoma cell lines 2645-94, 1765-92, and 402-91 were cultured in RPMI 1640 GlutaMAX medium supplemented with 5% fetal bovine serum, 100 U/mL penicillin, and 100 μg/mL streptomycin (all Thermo Fisher Scientific, Waltham, MA, USA). The Ewing sarcoma cell lines TC-71 and SK-N-MC were cultured in Iscove’s Modified Dulbecco’s medium supplemented with 10% fetal bovine serum, 100 U/mL penicillin, and 100 μg/mL streptomycin (all Thermo Fisher Scientific, Waltham, MA, USA). Cell passaging was performed using 0.25% trypsin supplemented with 0.5 mM EDTA (Thermo Fisher Scientific, Waltham, MA, USA).

2.2. Single-Cell Analysis

The cells were detached using 0.25% trypsin supplemented with 0.5 mM EDTA, and then trypsin was inactivated with complete media. The cells were resuspended in phosphate-buffered saline (Thermo Fisher Scientific) supplemented with 2% bovine serum albumin (Sigma-Aldrich, St. Louis, MO, USA) and passed through a 70 µm cell strainer (Corning Life Sciences, Amsterdam, The Netherlands) to remove cell aggregates. Individual cells were collected into 96-well plates (Thermo Fisher Scientific, Waltham, MA, USA) that were prefilled with 5 μL lysis buffer per well, containing 1 μg/μL bovine serum albumin supplied in 2.5% glycerol (Thermo Fisher Scientific, Waltham, MA, USA) diluted in Ultrapure RNase & DNase free water (Thermo Fisher Scientific, Waltham, MA, USA) using a BD FACSAria II (BD Biosciences, San Jose, CA, USA) as described [17]. Plates with single cells were immediately frozen on dry ice and kept at −80 ℃ until subsequent analysis.
Reverse transcription was performed with the GrandScript cDNA Synthesis kit (TATAA Biocenter, Gothenburg, Sweden). Ten microliter reactions, containing 1× GrandScript RT reaction mix, 1× GrandScript RT enzyme, and direct lysed cells, were prepared. Reverse transcription was performed at 25 ℃ for 5 min and 42 ℃ for 30 min and terminated at 85 ℃ for 5 min. Samples were diluted to 1:4 with TE buffer, pH 8.0 (Thermo Fisher Scientific, Waltham, MA, USA). Targeted cDNA preamplification was performed in 30 μL reactions containing 1× iQ Supermix (Bio-Rad, Hercules, CA, USA), 40 nM of each primer, and 9 μL diluted cDNA. Preamplification and downstream qPCR were conducted with the same primers, as described [18]. The primer sequences are shown in Table S1. The following thermal profile was applied: 95 ℃ for 3 min followed by 20 cycles of amplification (95 ℃ for 20 s, 55 ℃ for 3 min, and 72 ℃ for 20 s). The final elongation step was performed for 10 min, and the samples were immediately frozen on dry ice and then diluted 1:4 in TE buffer, pH 8.0, and stored at −20 ℃ until analysis. High-throughput single-cell qPCR was performed on the BioMark system (Fluidigm, South San Francisco, CA, USA), using the 96 × 96 Dynamic Array Chip for Gene Expression and EvaGreen-based detection [18]. Briefly, each 5 μL sample contained 2 μL preamplified and diluted cDNA, 2.5 μL 2× SsoFast EvaGreen SuperMix (Bio-Rad Laboratories), 0.25 μL DNA Binding Dye Sample Loading Reagent (Fluidigm, South San Francisco, CA, USA), 0.01 μL 100× ROX (Thermo Fisher Scientific), and 0.24 μL nuclease free water. The 5 μL assay reaction contained 2.5 μL Assay Loading Reagent (Fluidigm, South San Francisco, CA, USA) and 2.5 μL of mixed forward and reverse primer pairs, with a final concentration of 2.5 μM. The dynamic array was primed and loaded, as recommended by the manufacturer, using the IFC controller HX. The system was run at 70 °C for 40 min for thermal mixing and 60 °C for 30 s, followed by 95 °C for 60 s and 40 cycles of amplification at 96 °C for 5 s and 60 °C for 20 s. The melting curve was registered from 60 °C to 95 °C, with 1 s per 0.5 °C increment. Data were analyzed using the Fluidigm Real-Time PCR Analysis software (Fluidigm, South San Francisco, CA, USA), applying the linear derivative baseline subtraction method and a user-defined global threshold to obtain the cycle of quantification values. The specificity of all assays was tested with gel electrophoresis.

2.3. Single-Cell Data Preprocessing

Data preprocessing was performed as previously described [19], using GenEx (version 7, Multid Analyses, Gothenburg, Sweden). Melting curve analysis was performed on all qPCR samples, and data with aberrant melting temperatures were removed. Raw data are shown in Table S2. A cycle of quantification cut-off value equal to >25 was used, and values above this level were replaced with a value of 25. The cycle of quantification values were transformed to relative quantities, assuming that a cycle of quantification of 25 was equal to one molecule. Missing data were replaced with 0.5 molecules, and all data were log2 transformed. The preprocessed data are shown in Table S2.

2.4. Single-Cell Data Analysis

Single-cell analysis and basic statistics, along with volcano and scatter plots, were performed using GenEx. Preprocessed and autoscaled data were used in all PCA, t-SNE plots, and SOMs. The perplexity in t-SNE was set to 10. The conceptual basis of SOMs is discussed in Appendix A. Here, we applied a learning rate of 0.4 and a maximum of 150 iterations for all topologies. The topology design and number of neighbors were optimized. We verified that our final SOM was not parameter-sensitive. The heat map analysis was performed with mean values for each gene. Figure 1 was created with BioRender.com, while Figure 2, Figure 3 and Figure 4 were generated by GenEx and merged using BioRender.com.

3. Results

3.1. Single-Cell Profiling of Myxoid Liposarcoma and Ewing Sarcoma Cells

We analyzed 353 single cells collected from 3 MLS (MLS 2645-94, MLS 1765-92, and MLS 402-91) and 2 EWS (SK-N-MC and TC-71) cell lines (Figure 1A). Individual cells were collected with a fluorescence-activated cell sorter and directly lysed. Cells were subsequently reverse transcribed, followed by targeted preamplification and high-throughput qPCR (Figure 1B). We profiled 76 different genes, with the majority associated with cell cycle regulation (Figure 1C). Additional genes were related to JAK-STAT signaling, apoptosis/cell death, TP53 regulation, and housekeeping functions. The last group includes genes associated with different essential cellular functions. The basic statistics for all genes and cell lines are summarized in Table S3, including the mean expression and variability calculated as standard deviation. We observed large expression level variability between and within cell lines, which was expected and in agreement with reported data [20,21]. For example, Figure S1 (Supplementary Materials) shows the variability of VIM and MCM7, the two genes with the largest variation in relative expression values. VIM and MCM7 displayed 42,000 and 10,000 times difference in expression level between the cell with the highest and lowest expression, respectively. Principal component analysis and a t-SNE plot showed that cells from different tumor types and cell lines partly overlapped (Figure 2).

3.2. Identification of Subpopulations of Tumor Cells Using Self-Organizing Maps

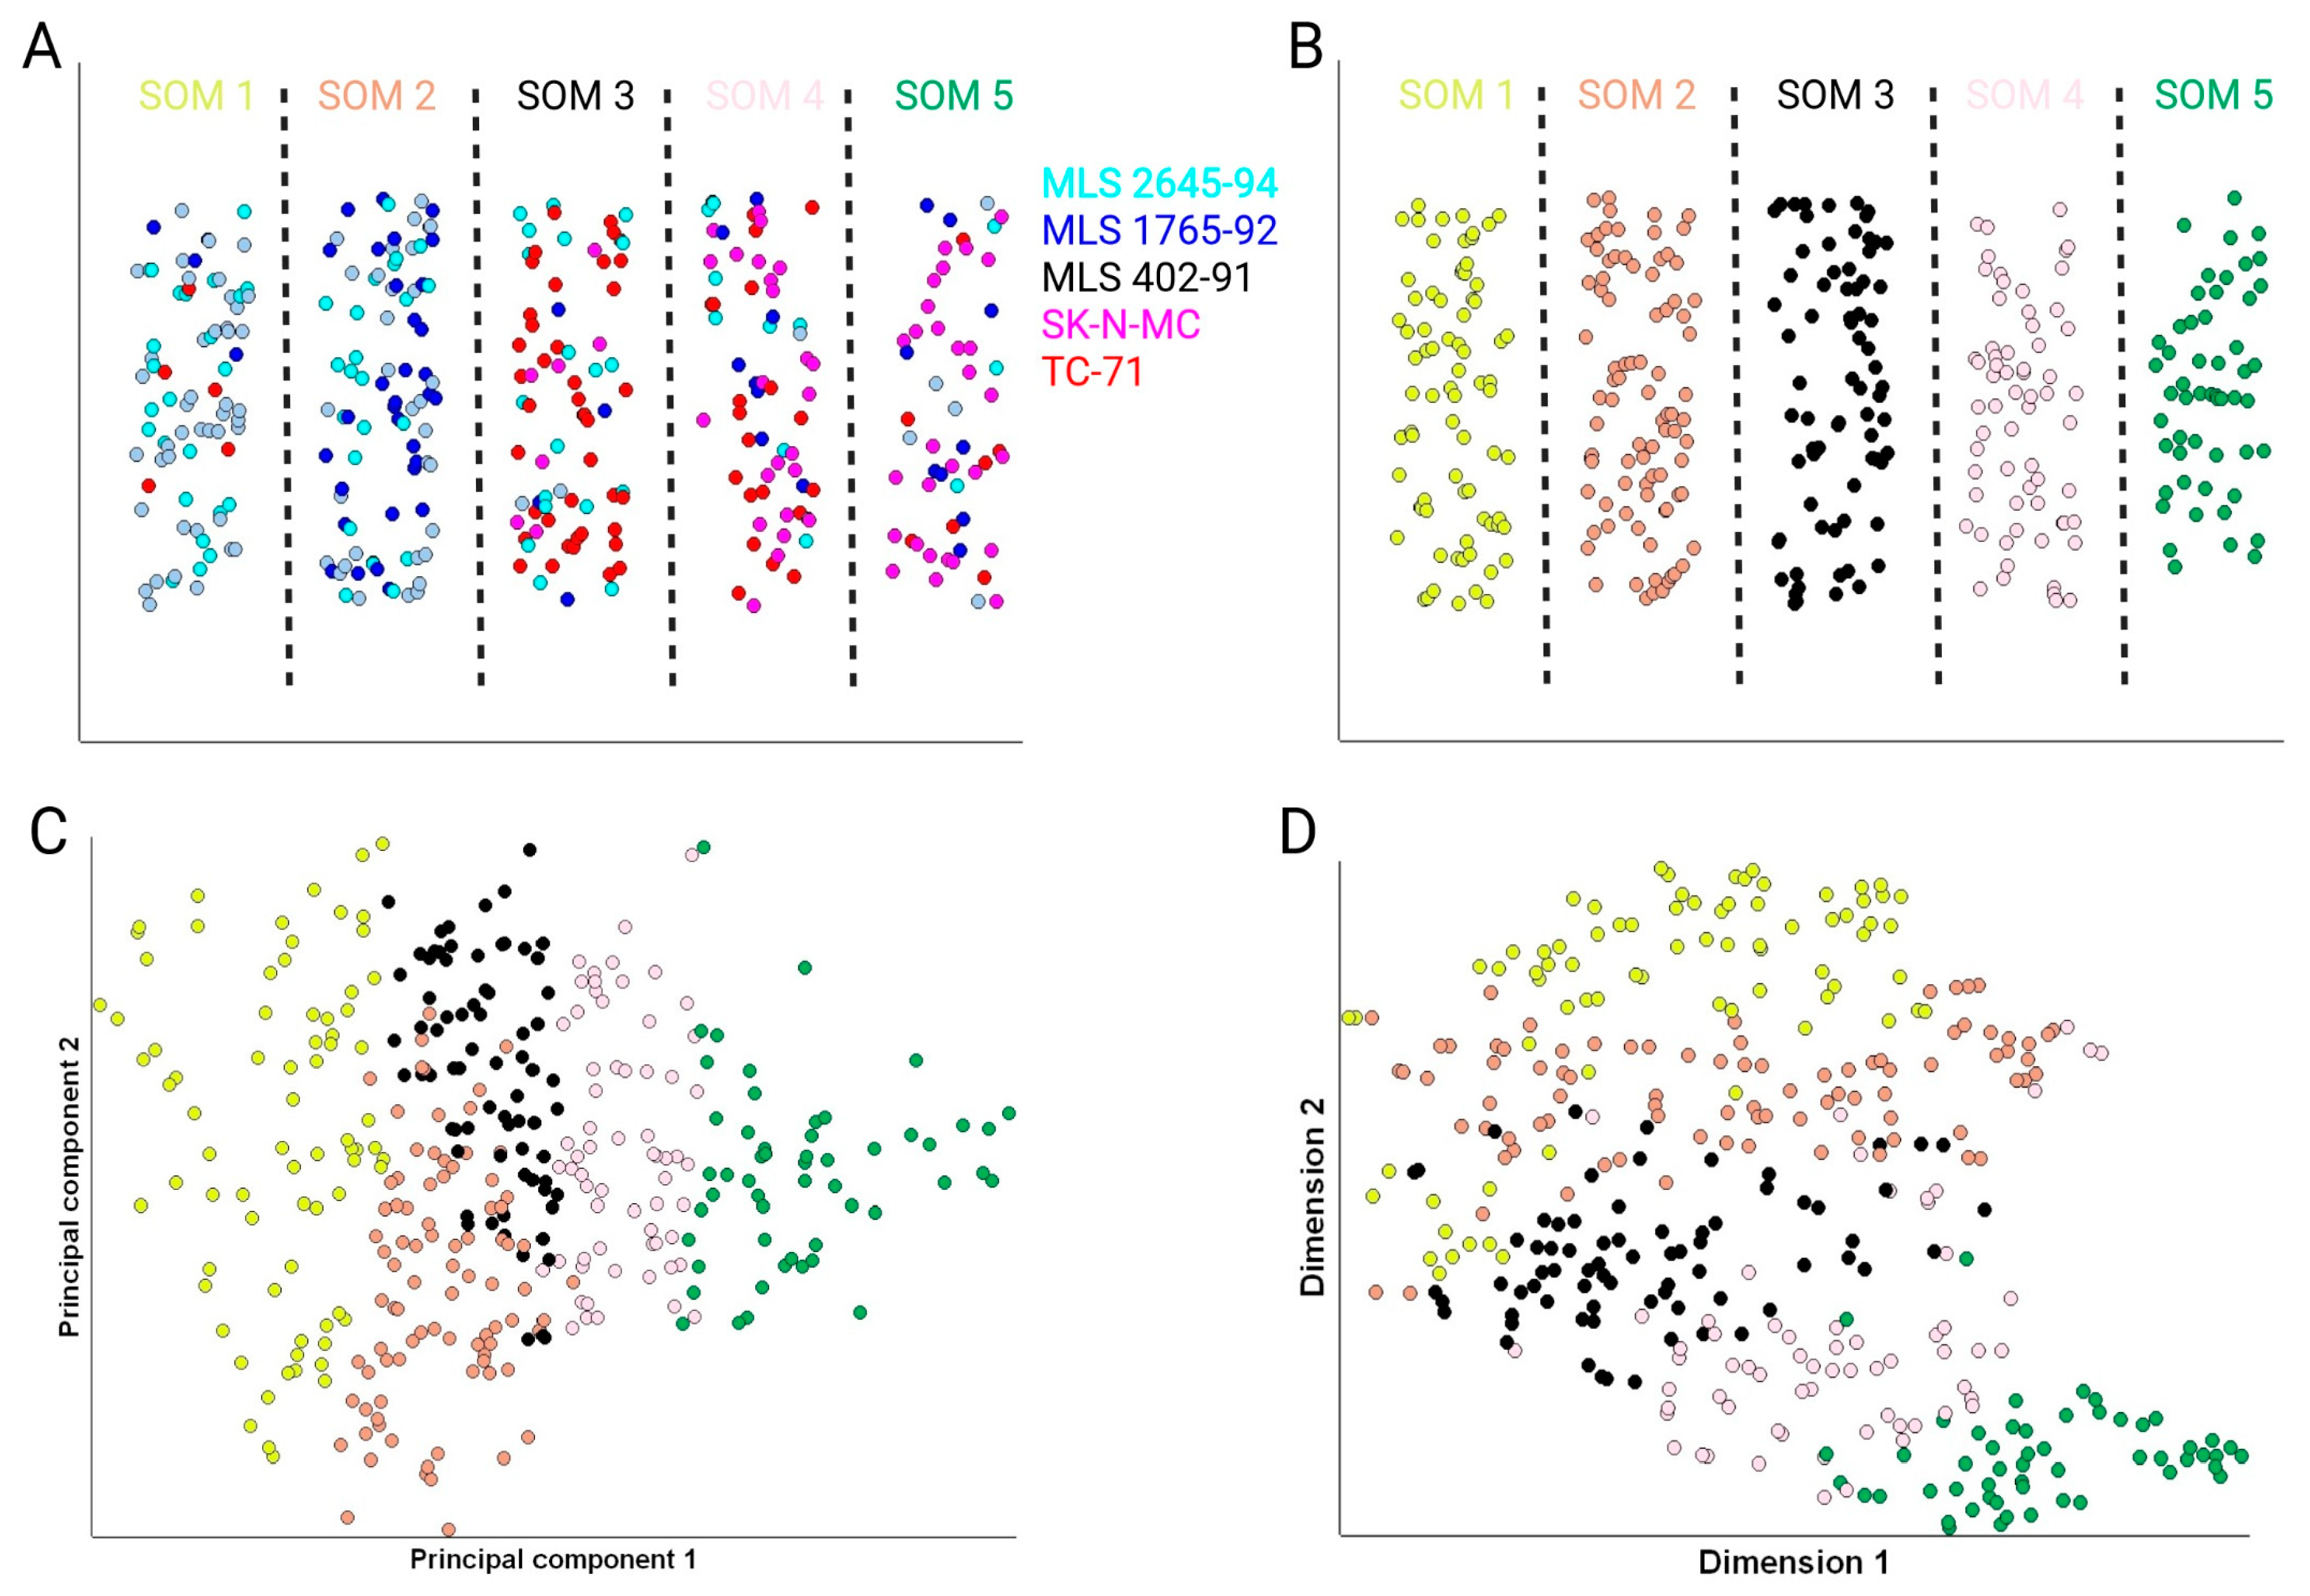
Self-organizing maps were applied to identify subpopulations of cells originating from all cell lines with similar gene signatures. The fundamentals of SOMs are outlined in Appendix A. We tested several SOM topology designs, including 1 × 3, 1 × 4, 1 × 5, 1 × 6, 1 × 7, 1 × 8, 1 × 9, 1 × 10, 2 × 2, 2 × 3, 2 × 4, 2 × 5, and 3 × 3, with variable numbers of neighbors. For the initial evaluation of different topologies, we studied whether or not the cells were consistently grouped together in the same neuron. All topologies that produced unstable SOMs, i.e., a variable subgrouping of cells, when repeated were discarded. We also aimed to define biologically relevant subpopulations and identified 5 relevant subpopulations using a 1 × 5 topology with 3 neighbors (Figure 3A,B).
To validate this SOM topology in more detail, we first divided all samples into a training dataset (n = 282) and a test dataset (n = 71). We randomly selected test samples and maintained the proportion of samples of each cell type. Then, we generated 5 SOM groups based only on the training dataset. All but 6 single cells grouped identically, compared with the grouping using the complete dataset. Next, we classified all test cells into the training SOM. All test cells were grouped into the same SOM groups used when all cells were analyzed together. Hence, we concluded that the 1 × 5 topology with 3 neighbors was highly reproducible.
To determine the biological relevance of these SOM-defined subpopulations we evaluated the same autoscaled data by other complementary approaches. First, we visualized the SOM-defined subpopulations by PCA (Figure 3C) and t-SNE (Figure 3D). Both PCA and the t-SNE plot showed that the cells from the SOM-defined groups clustered together. However, no SOM-defined group could easily be identified by visual inspection alone in the PCA nor the t-SNE plot. The PCA score plots in Figure 2A and Figure 3C are identical, except that in the latter, the sample identities are based on the SOM group and not the cell line. Principal components 1 and 2 explain 31% and 6% of all gene expression information, respectively. The most informative genes in principal component 1 were GAPDH, CDK4, MCM7, E2F4, EWSR1, RB1, STAT1, and VIM, while PLK1, E2F1, CCNA2, MCM5, CDC25C, CCNB2, and MCM4 had the greatest influence in principal component 2 (Table S4).
Next, we evaluated the number of cells of each cell line that grouped into each SOM group (Table 1). The number of cells varied between 53 and 87 in each SOM-defined group. Table 1 shows that cells from all MLS cell lines were present in all SOM groups. In contrast, no EWS cells were present in SOM group 2.
SOM group 1 was comprised mainly of MLS 2645-94 and MLS 402-91 cells with only 5 EWS cells; SOM group 2 consisted of cells from all 3 MLS cells lines; SOM group 3 exhibited mainly TC-71 cells, some MLS 2645-94 cells, and a few cells from each of the other cell lines; SOM group 4 was comprised mainly of EWS cells; and SOM group 5 was comprised mainly of SK-N-MC cells. These data showed that cells were primarily similar to other cells originating from the same tumor entity, i.e., MLS versus EWS. The differences between cells from the different cell lines for a specific tumor type were small. Nonetheless, several cells displayed gene expression signatures similar to cells in the other tumor entity, indicating common cellular phenotypes, regardless of their origin.
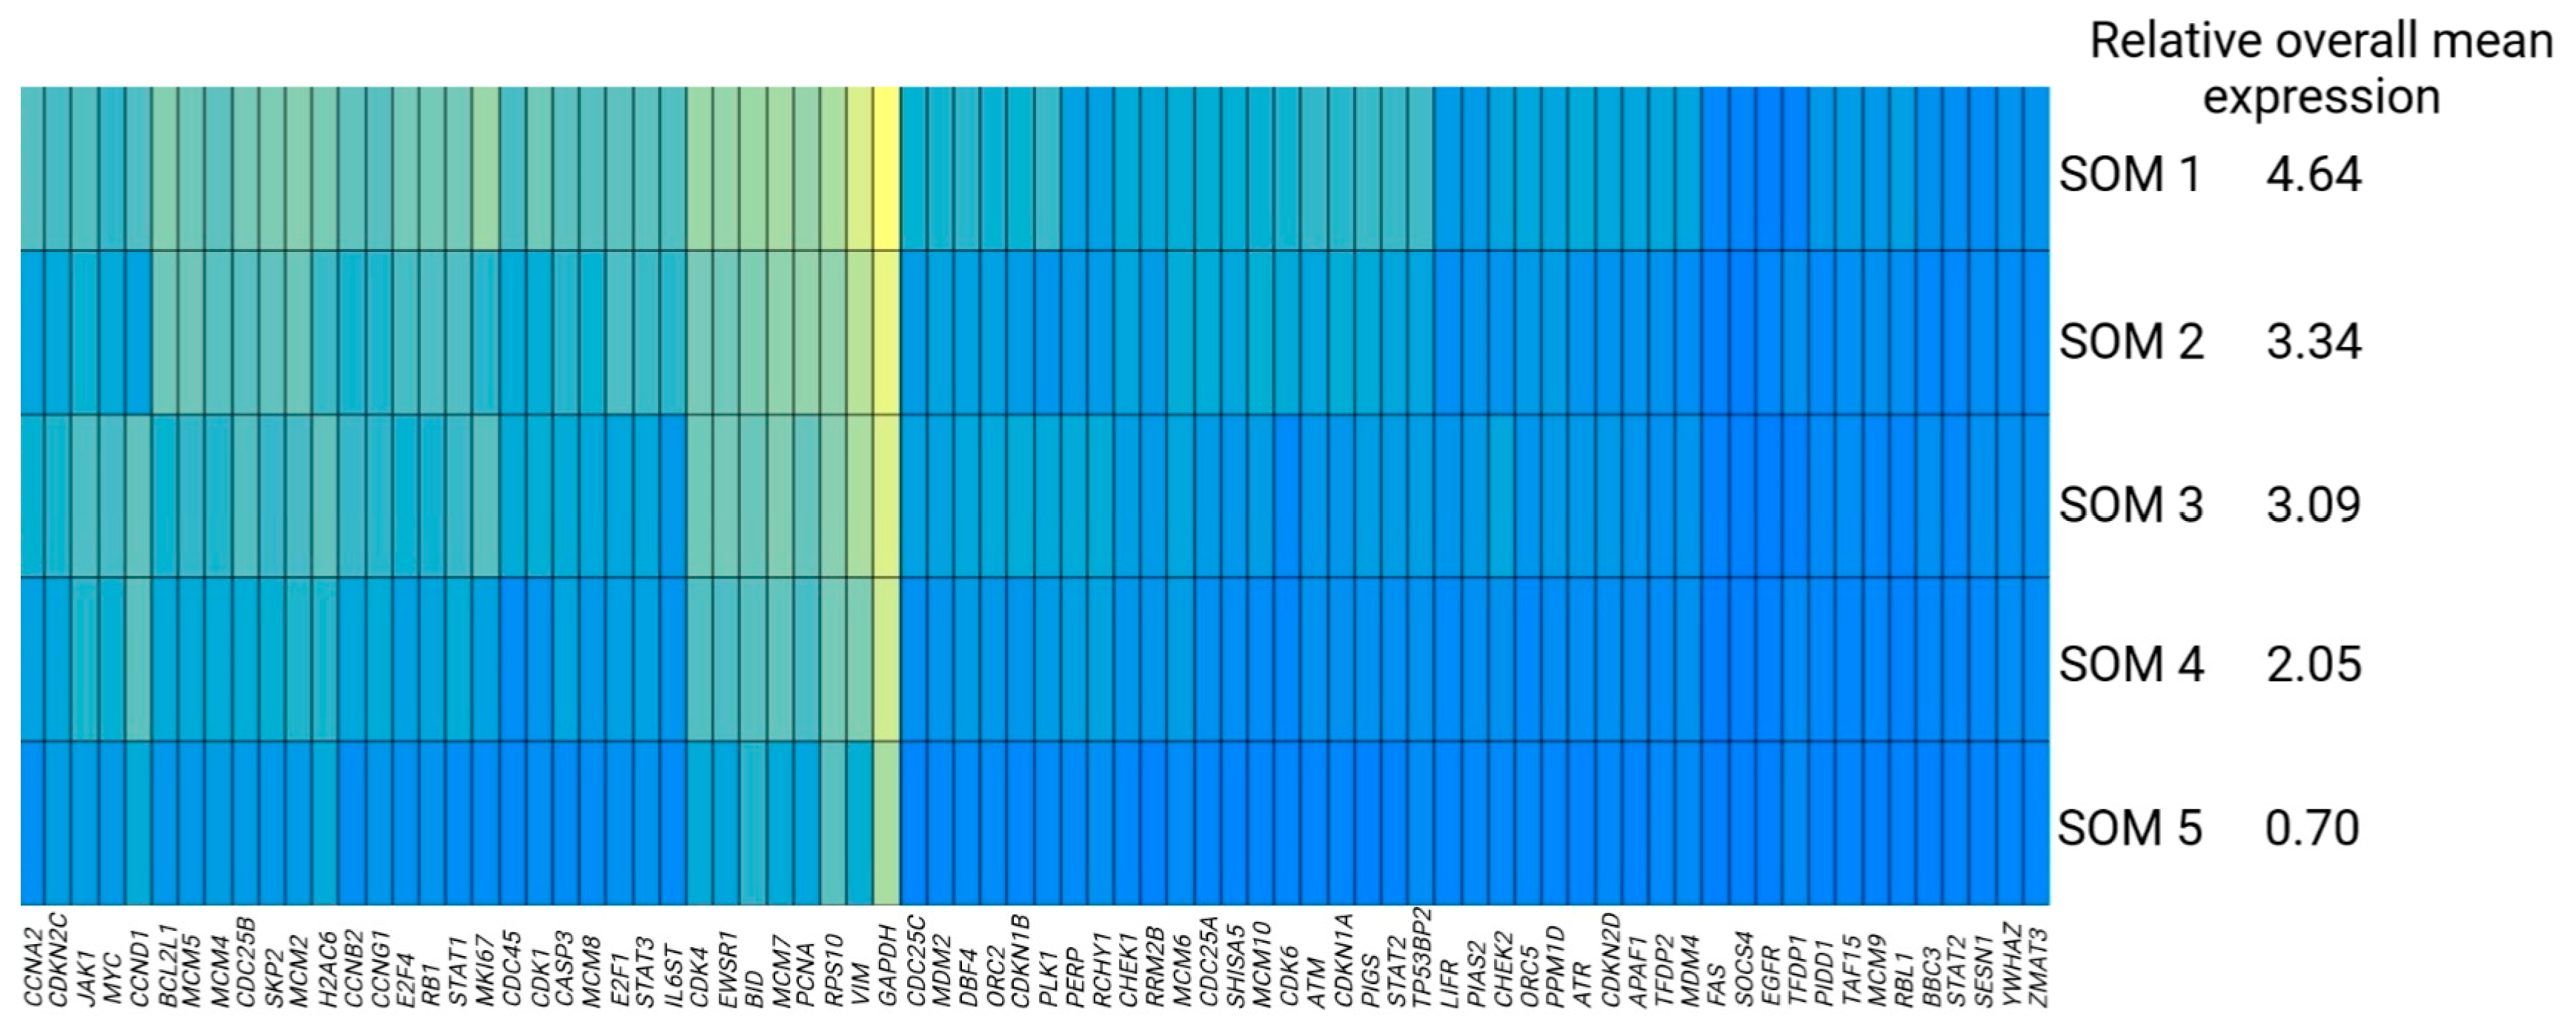
We evaluated the differences in mean expression and standard deviation of individual genes between the SOM groups (Figure 4, Table S3). The number of significantly regulated genes when comparing individual SOM groups was high, ranging from 29 to 69 genes (Table S5). The major difference between the SOM groups was their overall mean gene expression level (Figure 4). SOM group 1 displayed the highest mean expression of all genes, while SOM group 5 showed the lowest mean expression. Consequently, most individual genes were downregulated in the same pattern, from SOM group 1 to SOM group 5, but to a different extent. We also analyzed the average expression of all cells in each SOM group when the genes were grouped according to their cellular functions (Table 2). Again, we observed the same trends for all gene groups, with gradually decreasing expression levels from SOM group 1 to SOM group 5. This observation was also supported by a correlation analysis of the entire dataset (Table S6). Essentially, all genes were positively correlated with each other and 14% of all possible Spearman’s correlation coefficients were >0.5. Interestingly, principal component 1 of the PCA and dimension 2 of the t-SNE plot revealed an ordering pattern related to this feature (Figure 3C,D). The SOM groups that did not follow the same internal pattern were SOM group 2 and 3. SOM group 2 displayed a similar overall mean expression as SOM group 3. Here, 21 and 8 genes were up- and downregulated when comparing SOM group 2 with SOM group 3, respectively (Table S5).

4. Discussion

FET sarcomas and leukemias are subjected to multimodal treatment with extensive surgery, chemo- and radiotherapy, but they lack targeted therapies. The causative FET fusion oncoproteins interact with the SWI/SNF chromatin remodeling complex, resulting in epigenetic changes and deregulated genes [1]. Possible drug targets include the FET fusion oncoprotein itself, interaction partners of the SWI/SNF complex, and downstream signaling pathways. For example, MLS and EWS cell lines have been shown to be sensitive to the inhibition of BRD4, an interaction partner of the SWI/SNF complex [22]. JAK1/2 inhibition has also been demonstrated to decrease the number of cells with cancer stem cell properties, which are features associated with chemotherapy resistance in MLS [23]. We speculate that an optimal therapy has the potential to be effective in the treatment of all FET sarcomas and leukemias. However, identification of this target requires an improved understanding of tumor cell heterogeneity, both between and within each FET sarcoma and leukemia entity.
Here, we studied individual MLS and EWS cells, focusing on genes related to cell cycle regulation, JAK-STAT signaling, apoptosis/cell death, and TP53 regulation, as these signaling pathways are essential in most tumor cells. To identify biologically relevant subpopulations, we applied SOMs for unsupervised grouping, since PCA and t-SNE failed to identify any distinct subpopulations. The 1 × 5 SOM topology using 3 neighbors was optimal to obtain a reproducible subgrouping, with associated biological relevance. When we increased the number of SOM groups, we found no additional biological relevance for the additional groups of cells. Furthermore, larger topologies also generated unstable SOMs and required longer computation times.
We found that the major difference between the SOM-defined groups was the overall mean expression of all analyzed genes. Here, we used non-confluent cell cultures with active cell division. Consequently, the cells were expected to be in different cell cycle phases, which will result in an increased amount of total mRNA towards the end of the cell cycle [5,24]. Most in vitro cultured cells are in the G1 phase. Hence, we speculate that cells in SOM groups 2 to 5 are mainly in the G1 phase, while most cells in SOM group 1 belong to the G2/M phase. This is supported by a high expression of the G2/M marker genes CCNA2 and CCNB2 [5] in SOM group 1. Cell cycle-associated genes, along with many additional genes, are upregulated during the cell cycle [24]. In our study, most selected and analyzed genes, including genes related to JAK-STAT signaling, apoptosis/cell death, TP53 regulation, and housekeeping functions, were directly or indirectly related to cell cycle regulation. This was confirmed by the correlation analysis between gene pairs, which mainly revealed positive correlation coefficients. CCND1 was one of few genes that displayed a divergent expression pattern compared to the other cell cycle regulation genes among the SOM groups. CCND1 was highly expressed in SOM groups 3 and 4 compared with SOM group 2. Interestingly, SOM group 2 only consisted of MLS cells, while SOM groups 3 and 4 mainly consisted of EWS cells. This indicates that CCND1 may be differently regulated in MLS compared with EWS. As a majority of all genes displayed the lowest expression in SOM group 5, we speculate that some of these cells are partly senescent, a cell state that is associated with low transcriptional activity. However, we cannot rule out that some SOM group 5 cells were in an early apoptotic state, despite the fact that none of the genes related to apoptosis/cell death, such as BID and CASP3, were upregulated. The transcription factor MYC was upregulated in SOM group 3 compared with all other SOM groups. MYC is known to affect the total amount of mRNAs in cells [25,26], which may contribute to the observed cell heterogeneity. In addition to cell type and cell cycle phase, factors such as cell size [27] and age [28] may also affect the total mRNA level in individual cells. Despite significant histopathological differences, we observed that many MLS and EWS cells shared similar gene expression signatures, particularly in relation to cell cycle regulation. A limitation with our approach is that we performed targeted mRNA analysis. In the future, whole transcriptome analysis may reveal more similarities and differences between FET sarcoma and leukemia cells, possibly identifying a common therapy target. Furthermore, our experimental in vitro approach to culture MLS and EWS cells in a monolayer enrich for cellular phenotypes related to cell proliferation. The analysis of tumor cells directly prepared from tumor tissue or 3D culture systems that mimic in vivo conditions will most likely display more distinct phenotypes and even larger heterogeneity among FET sarcoma and leukemia cells.

5. Conclusions

In conclusion, we have shown that biologically relevant subpopulations of MLS and EWS cells can be identified by single-cell gene expression profiling combined with SOMs. Myxoid liposarcoma and EWS cells displayed distinct gene expression profiles, but a subset of MLS and EWS cells demonstrated similar gene expression signatures. Most observed cell heterogeneity was related to cell cycle regulation and overall transcriptional activity.

Supplementary Materials

The following supporting information can be downloaded at: https://www.mdpi.com/article/10.3390/chemosensors11010067/s1, Figure S1: Scatter plot showing the expression of VIM and MCM7 in MLS 2645-94, MLS 1765-92, MLS 402-91, SK-N-MC, and TC-71 cells; Table S1: Primer sequences; Table S2: Raw and preprocessed data; Table S3: Mean gene expression and standard deviation for respective genes in all cell lines and SOM groups; Table S4: PCA loadings; Table S5: Significantly regulated genes between individual SOM-defined groups; Table S6: Spearman’s correlation coefficients.

Author Contributions

Conceptualization, J.A. and A.S.; methodology, A.F., S.D. and D.S.; software, A.F.; validation, A.F., D.A., J.A. and A.S.; formal analysis, A.F., D.A., S.D., J.A. and A.S.; investigation, A.F., D.A., S.D., D.S., J.A. and A.S.; resources, A.S.; data curation, D.A., S.D. and A.S.; writing—original draft preparation, A.F., D.A., J.A. and A.S.; writing—review and editing, A.F., D.A., J.A. and A.S.; visualization, A.F. and A.S.; supervision, J.A. and A.S.; project administration, A.S.; funding acquisition, D.A. and A.S. All authors have read and agreed to the published version of the manuscript.

Funding

This research was funded by Assar Gabrielsson’s Research Foundation; the Johan Jansson Foundation for Cancer Research; Region Västra Götaland, Sweden; the Swedish Cancer Society (19-0306 and 22-2080); the Swedish Childhood Cancer Foundation (2020-007, 2022-0030 and MTI2019-0008); the Swedish Research Council (2021-01008); the Swedish state under the agreement between the Swedish government and the county councils, the ALF-agreement (965065); Sweden’s Innovation Agency (2018-00421 and 2020-04141); the Sjöberg Foundation; and the Wilhelm and Martina Lundgren Foundation for Scientific Research.

Institutional Review Board Statement

Not applicable.

Informed Consent Statement

Not applicable.

Data Availability Statement

Not applicable.

Acknowledgments

We thank Nicole Leypold for manuscript editing.

Conflicts of Interest

A.F. is a board member of Multid Analyses and declares stock ownership in Multid Analyses, Life Genomics, and Tataa HoldCo. S.D. is currently employed by AstraZeneca. D.S. declares stock ownership in TATAA HoldCo and is currently employed by SCTbio. A.S. is a board member of and declares stock ownership in Tulebovaasta, Iscaff Pharma, and SiMSen Diagnostics. The funders had no role in the design of the study; in the collection, analyses, or interpretation of data; in the writing of the manuscript, or in the decision to publish the results.

Appendix A

As for other types of artificial neural networks, SOMs are constituted by a set of neurons. The key objective of a SOM is to assign similar samples to the same or neighboring neurons. Neurons are processing units with mathematical functions defined by numerical coefficients called weights. The number of weights is usually equal to the number of experimental variables, and each weight can be viewed as a coefficient that determines the numerical output of the mathematical function behind the neuron. The weights are typically initiated with random values that undergo a steady evolution throughout successive iterations called epochs. The use of purely randomized numbers is not computationally efficient [13]. Instead, random numbers close to the average values of the input variables can be used [15].
In contrast to other types of artificial neural networks, the neurons of the SOMS are organized in a graphically regular shape, usually on a two-dimensional linear, rectangular, or hexagonal grid [12]. A graphical representation can be provided not only for the net, but also for the groups of samples. This feature simplifies the final interpretation of the SOM and its associated data. The two-dimensional geometric ordering of neurons in the grid is called topology, and it represents the structure of the multivariate input data when optimized [12], i.e., the pattern underlying the collection of samples, here single cells, used to develop and/or train the SOM. In more technical terms, a SOM can be defined as a nonlinear projection method that compresses the topographic relations of the original sample space into a two-dimensional topographical map [13,16]. This mapping is not a strict Euclidean space, but a regular array of neurons [13].
Therefore, one of the first steps used to identify distinct subgroups of samples using a SOM is to define its topology. Usually, the optimal topology cannot be determined in advance. A general assumption is that if the dataset is known to contain a limited number of groups, a coarse resolution will be sufficient, often where the number of neurons equals the number of sample groups. In contrast, if complex structures and/or an unknown number of sample groups are expected, larger neuron layouts may be needed [13]. A common strategy is to define square maps of N × N neurons. In the end, the topology of current SOMs, like those used here where counter-propagation layers do not exist to render them supervised, has to be optimized on an ad hoc basis.
Once the topology is defined, the SOM training starts. A computing loop is set to successively compare each sample to all neurons. The neuron which is most similar to the sample being compared is called the winning neuron, and it becomes activated. Its output is set to one, whereas the outputs of all other neurons are set to zero. However, noise is present in experimentally obtained data. Hence, we know that future samples will not be exactly like the ones used for training. A strategy to compensate for this effect is to allow the surrounding neurons of the winning neuron to be partially activated. This is performed by accepting a so-called Mexican hat approach in which the neurons close to the winning neuron are more activated than the distal neurons following an exponential function [29]. An alternative is to apply a Gaussian function that also decreases the activation when moving away from the winning neuron [12]. To set the degree of activation of the surrounding neurons, a neighborhood parameter, also called topological distance, is used. In the first stages of the training loop, the size of the neighborhood is of the same order as the net itself, but it rapidly decreases as training advances, and results start to converge.
Most of the learning time is devoted to adapting the weights of only the winning neurons [15]. The increment that is applied on each iteration, i.e., each time the samples are presented to the overall network, is defined by Equation (A1) [30]:
Δ w r = L R · ( 1 d r d m a x + 1 ) · ( x i w r o l d )
where wr is the weight vector of neuron r; LR is the learning rate; dr is the topological distance, i.e., the distance measured as the number of neurons which are between the winning neuron and the neuron under consideration; dmax is the maximum size of the neighborhood, which decreases during training; and xi is the vector with the experimental values of sample i. Thus, the extent of the increment that is added to the weights depends on the topological site of the neuron under consideration. Whenever the neighbor neuron is close to the winning neuron, the weights will be modified significantly [16], whereas neurons far away from the winning neuron will be less changed. The LR can be set as indicated in Equation (A2) [30]:
L R = ( L R s t a r t L R e n d ) · ( 1 l l t o t ) + L R e n d
with l being the number of actual iterations or training epochs; ltot is the number of total iterations; and start and end denote the onset and end of the network training, respectively. Note that Equations (A1) and (A2) proceed automatically, i.e., by unsupervised learning [16].
The similarity between a sample and all neurons is evaluated to identify the winning neuron. The most common approach is to consider the Euclidean distance as a measurement of similarity. This is the difference between the experimental values of the sample and the weights, balanced by the learning rate coefficient. In some software, this coefficient can be defined by the user. A large coefficient may accelerate the initial learning process but may also result in unstable SOMs. Therefore, most algorithms change the value of the learning rate from higher values at the beginning to lower values at the final stages [15]. This training forces the winning neurons to specialize in a particular type of sample. The procedure is repeated, either until convergence is reached or until a maximum number of training epochs set by the user has been performed. Note that in each iteration, all training samples are applied to the net. The last step consists of locating all samples in the two-dimensional linear map representing the neurons, i.e., displaying their labels or codes.
It is important to validate the performance of a selected SOM with an independent sample set that was not used in the initial training. Hence, overfitted models with poor generalization capabilities can be avoided. Unfortunately, this final step is rarely presented in reported studies. Finally, note that the optimal strategy to preprocess and scale raw data must be tested using an empirical trial-and-error approach, developing preliminary SOMs followed by evaluating their outputs. This may be time-consuming but should not be circumvented so that the most reproducible and appropriate results are found.

References

  1. Lindén, M.; Thomsen, C.; Grundevik, P.; Jonasson, E.; Andersson, D.; Runnberg, R.; Dolatabadi, S.; Vannas, C.; Luna Santamarίa, M.; Fagman, H.; et al. FET family fusion oncoproteins target the SWI/SNF chromatin remodeling complex. EMBO Rep. 2019, 20, e45766. [Google Scholar] [CrossRef]
  2. Åman, P. Fusion oncogenes in tumor development. Semin. Cancer Biol. 2005, 15, 236–243. [Google Scholar] [CrossRef] [PubMed]
  3. Ståhlberg, A.; Kåbjörn Gustafsson, C.; Engtröm, K.; Thomsen, C.; Dolatabadi, S.; Jonasson, E.; Li, C.Y.; Ruff, D.; Chen, S.M.; Åman, P. Normal and functional TP53 in genetically stable myxoid/round cell liposarcoma. PLoS ONE 2014, 9, e113110. [Google Scholar] [CrossRef] [Green Version]
  4. Tirode, F.; Surdez, D.; Ma, X.; Parker, M.; Le Deley, M.C.; Bahrami, A.; Zhang, Z.; Lapouble, E.; Grossetête-Lalami, S.; Rusch, M.; et al. Genomic landscape of Ewing sarcoma defines an aggressive subtype with co-association of STAG2 and TP53 mutations. Cancer Discov. 2014, 4, 1342–1353. [Google Scholar] [CrossRef] [Green Version]
  5. Dolatabadi, S.; Candia, J.; Akrap, N.; Vannas, C.; Tesan Tomic, T.; Losert, W.; Landberg, G.; Åman, P.; Ståhlberg, A. Cell Cycle and Cell Size Dependent Gene Expression Reveals Distinct Subpopulations at Single-Cell Level. Front. Genet. 2017, 8, 1. [Google Scholar] [CrossRef] [Green Version]
  6. Kåbjörn Gustafsson, C.; Ståhlberg, A.; Engtröm, K.; Danielsson, A.; Turesson, I.; Aman, P. Cell senescence in myxoid/round cell liposarcoma. Sarcoma 2014, 2014, 208786. [Google Scholar] [CrossRef] [Green Version]
  7. Aynaud, M.M.; Mirabeau, O.; Gruel, N.; Grossetête, S.; Boeva, V.; Durand, S.; Surdez, D.; Saulnier, O.; Zaïdi, S.; Gribkova, S.; et al. Transcriptional Programs Define Intratumoral Heterogeneity of Ewing Sarcoma at Single-Cell Resolution. Cell Rep. 2020, 30, 1767–1779.e6. [Google Scholar] [CrossRef] [PubMed] [Green Version]
  8. Kubista, M.; Dreyer-Lamm, J.; Ståhlberg, A. The secrets of the cell. Mol. Aspects Med. 2018, 59, 1–4. [Google Scholar] [CrossRef]
  9. Hedlund, E.; Deng, Q. Single-cell RNA sequencing: Technical advancements and biological applications. Mol. Asp. Med. 2018, 59, 36–46. [Google Scholar] [CrossRef]
  10. Andrews, T.S.; Hemberg, M. Identifying cell populations with scRNASeq. Mol. Asp. Med. 2018, 59, 114–122. [Google Scholar] [CrossRef]
  11. Peng, L.; Tian, X.; Tian, G.; Xu, J.; Huang, X.; Weng, Y.; Yang, J.; Zhou, L. Single-cell RNA-seq clustering: Datasets, models, and algorithms. RNA Biol. 2020, 17, 765–783. [Google Scholar] [CrossRef]
  12. Vandeginste, B.G.M.; Massart, D.L.; Buydens, L.M.C.; de Jong, S.; Lewi, P.J.; Smeyers-Verbeke, J. Handbook of Chemometrics and Qualimetrics (Part B); Elsevier: Amsterdam, The Netherlands, 1998; pp. 687–695. [Google Scholar]
  13. Kohonen, T. MATLAB Implementations and Applications of the Self-Organizing Map; Unigrafia Oy: Helsinki, Finland, 2014; pp. 2, 19–22. [Google Scholar]
  14. Borges, C.; Gómez-Carracedo, M.P.; Andrade, J.M.; Duarte, M.F.; Biscaya, J.L.; Aires-de-Sousa, J. Geographical classification of weathered crude oil samples with unsupervised self-organizing maps and a consensus criterion. Chemom. Intell. Lab. Syst. 2010, 101, 43–55. [Google Scholar] [CrossRef]
  15. Melssen, W.; Wehrens, R.; Buydens, L. Supervised Kohonen networks for classification problems. Chemom. Intell. Lab. Syst. 2006, 83, 99–113. [Google Scholar] [CrossRef]
  16. Aires de Sousa, J.M. Data visualization and analysis using Kohonen Self-Organizing Maps (Chapter 7). In Tutorials in Chemoinformatics; Varnek, A., Ed.; John Willey & Sons: Oxford, UK, 2017; pp. 119–126. [Google Scholar]
  17. Ståhlberg, A.; Bengtsson, M.; Hemberg, M.; Semb, H. Quantitative transcription factor analysis of undifferentiated single human embryonic stem cells. Clin. Chem. 2009, 55, 2162–2170. [Google Scholar] [CrossRef] [PubMed] [Green Version]
  18. Andersson, D.; Akrap, N.; Svec, D.; Godfrey, T.E.; Kubista, M.; Landberg, G.; Ståhlberg, A. Properties of targeted preamplification in DNA and cDNA quantification. Expert Rev. Mol. Diagn. 2015, 15, 1085–1100. [Google Scholar] [CrossRef] [PubMed]
  19. Ståhlberg, A.; Rusnakova, V.; Forootan, A.; Anderova, M.; Kubista, M. RT-qPCR work-flow for single-cell data analysis. Methods 2013, 59, 80–88. [Google Scholar] [CrossRef] [PubMed]
  20. Bengtsson, M.; Ståhlberg, A.; Rorsman, P.; Kubista, M. Gene expression profiling in single cells from the pancreatic islets of Langerhans reveals lognormal distribution of mRNA levels. Genome Res. 2005, 15, 1388–1392. [Google Scholar] [CrossRef] [Green Version]
  21. Raj, A.; Peskin, C.S.; Tranchina, D.; Vargas, D.Y.; Tyagi, S. Stochastic mRNA synthesis in mammalian cells. PLoS Biol. 2006, 4, e309. [Google Scholar] [CrossRef]
  22. Lindén, M.; Vannas, C.; Österlund, T.; Andersson, L.; Osman, A.; Escobar, M.; Fagman, H.; Ståhlberg, A.; Åman, P. FET fusion oncoproteins interact with BRD4 and SWI/SNF chromatin remodelling complex subtypes in sarcoma. Mol. Oncol. 2022, 16, 2470–2495. [Google Scholar] [CrossRef]
  23. Dolatabadi, S.; Jonasson, E.; Lindén, M.; Fereydouni, B.; Bäcksten, K.; Nilsson, M.; Martner, A.; Forootan, A.; Fagman, H.; Landberg, G.; et al. JAK-STAT signalling controls cancer stem cell properties including chemotherapy resistance in myxoid liposarcoma. Int. J. Cancer 2019, 145, 435–449. [Google Scholar] [CrossRef]
  24. Karlsson, J.; Kroneis, T.; Jonasson, E.; Larsson, E.; Ståhlberg, A. Transcriptomic Characterization of the Human Cell Cycle in Individual Unsynchronized Cells. J. Mol. Biol. 2017, 429, 3909–3924. [Google Scholar] [CrossRef] [PubMed]
  25. Lin, C.Y.; Lovén, J.; Rahl, P.B.; Paranal, R.M.; Burge, C.B.; Bradner, J.E.; Lee, T.I.; Young, R.A. Transcriptional amplification in tumor cells with elevated c-Myc. Cell 2012, 151, 56–67. [Google Scholar] [CrossRef] [PubMed] [Green Version]
  26. Nie, Z.; Hu, G.; Wei, G.; Cui, K.; Yamane, A.; Resch, W.; Wang, R.; Green, D.R.; Tessarollo, L.; Casellas, R.; et al. c-Myc is a universal amplifier of expressed genes in lymphocytes and embryonic stem cells. Cell 2012, 151, 68–79. [Google Scholar] [CrossRef] [PubMed] [Green Version]
  27. Marguerat, S.; Bahler, J. Coordinating genome expression with cell size. Trends Genet. 2012, 28, 560–565. [Google Scholar] [CrossRef] [Green Version]
  28. Hu, Z.; Chen, K.; Xia, Z.; Chavez, M.; Pal, S.; Seol, J.-H.; Chen, C.-C.; Li, W.; Tyler, J.K. Nucleosome loss leads to global transcriptional up-regulation and genomic instability during yeast aging. Genes Dev. 2014, 28, 396–408. [Google Scholar] [CrossRef] [Green Version]
  29. Burn, K.; Home, G. Environmental classification using Kohonen self-organizing maps. Expert Sys. 2008, 25, 98–114. [Google Scholar] [CrossRef]
  30. Ballabio, D.; Consoni, V.; Todeschini, R. The Kohonen and CPANN toolbox: A collection of MATLAB modules for Self-Organizing Maps and counterpropagation artificial neural networks. Chemom. Intell. Lab. Syst. 2009, 98, 115–122. [Google Scholar] [CrossRef]
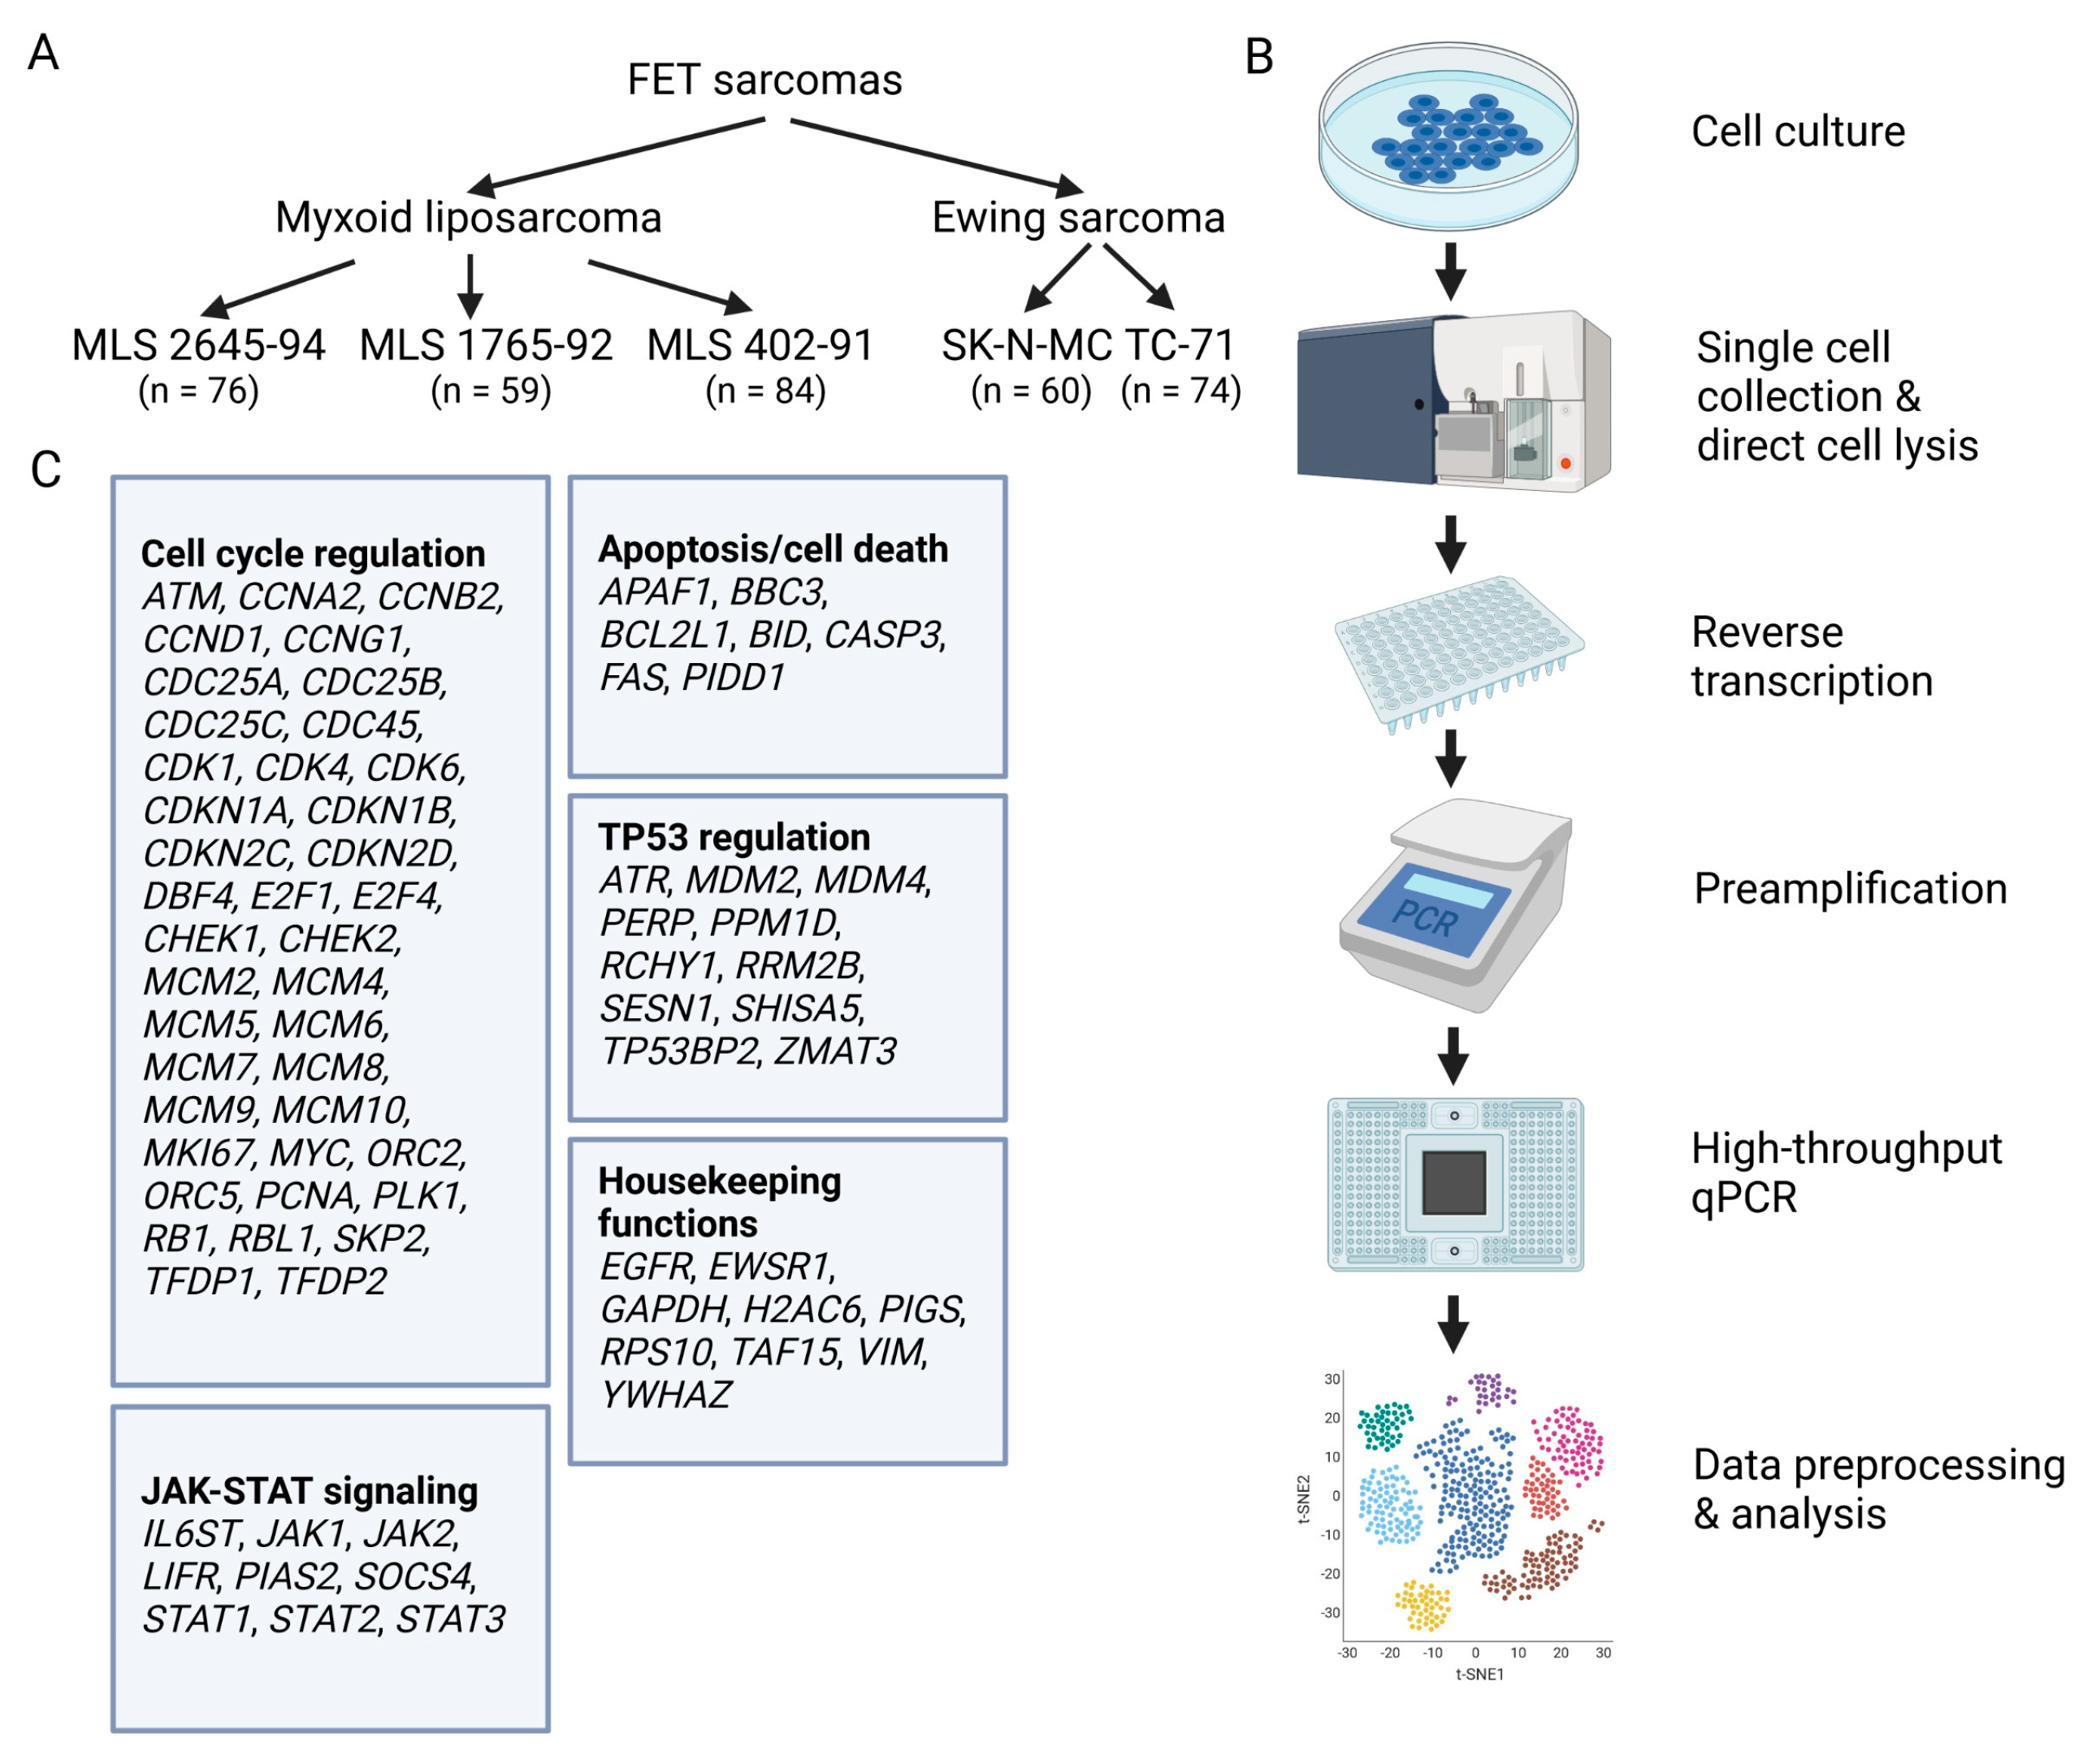
Figure 1. Experimental overview. (A) Overview of analyzed FET sarcoma cells. Three myxoid liposarcoma (MLS 2645-95, MLS 1765-92, and MLS 402-91) and 2 Ewing sarcoma (SK-N-MC and TC-71) cell lines were analyzed at the single-cell level. (B) Schematic overview of experimental steps, from cell culture to final data analysis. In vitro cultured cells were harvested and collected as single cells in 96-well plates using a fluorescence-activated cell sorter. The RNA in direct-lysed cells was reverse transcribed to cDNA, followed by targeted preamplification and high-throughput qPCR. Finally, raw data were preprocessed, and the expression profiles of single cells were analyzed by different means. (C) In total, 76 differently expressed genes were assessed. Genes were grouped into 5 different cellular functions.
Chemosensors 11 00067 g001
Figure 2. Unsupervised visualization of single-cell data: (A) principal component analysis and (B) t-distributed stochastic neighbor embedding plot of all single-cell data for MLS 2645-94, MLS 1765-92, MLS 402-91, SK-N-MC, and TC-71 cells.
Chemosensors 11 00067 g002
Figure 3. Identification of subpopulations. (A) Self-organizing map with 1 × 5 topology and 3 neighbors for all MLS 2645-94, MLS 1765-92, MLS 402-91, SK-N-MC, and TC-71 cells. (B) Re-analysis of data with cell identities based on the SOM-defined groups from subplot A. (C) Principal component analysis with cell identities based on the SOM-defined groups from subplot A. (D) t-distributed stochastic neighbor embedding plot with cell identities based on the SOM-defined groups from subplot A.
Chemosensors 11 00067 g003
Figure 4. Characterization of SOM-defined groups. Heat map showing the mean expression of each gene in respective SOM group. Color-coded data are shown in log2-scale. Values to the right show the mean expression of all genes for each SOM group. Bright color indicates high expression.
Chemosensors 11 00067 g004
Table 1. Number of cells present in each SOM-defined group.
SOM 1SOM 2SOM 3SOM 4SOM 5
MLS 2645-9423221993
MLS 1765-92433499
MLS 402-914432215
SK-N-MC0072429
TC-715041217
All MLS cells7187251917
All EWS cells50484536
Total number of cells7687736453
Table 2. Average gene expression of single cells in SOM-defined groups.
Cell Cycle RegulationJAK-STAT SignalingApoptosis/Cell DeathTP53 RegulationHousekeeping Functions
SOM 15.08 13.713.843.266.11
SOM 23.662.562.692.035.01
SOM 33.372.172.242.134.74
SOM 42.111.371.581.233.88
SOM 50.670.130.470.002.46
1 Relative mean expression levels are shown in log2-scale, averaging all cells and genes in each individual gene group.
Disclaimer/Publisher’s Note: The statements, opinions and data contained in all publications are solely those of the individual author(s) and contributor(s) and not of MDPI and/or the editor(s). MDPI and/or the editor(s) disclaim responsibility for any injury to people or property resulting from any ideas, methods, instructions or products referred to in the content.