
Origin Authentication of European and American Ash (Fraxinus spp.) Based on Stable Isotope Ratio and Elemental Characteristics Combined with Chemometrics Methods


Abstract
:
1. Introduction
2. Materials and Methods
2.1. Samples
2.2. Apparatus
2.3. Reagents
2.4. Experimental Methods
2.4.1. Determination of Mineral Elements
2.4.2. Determination of Stable Isotope Ratios δ13C and δ15N
2.5. Data Processing
3. Results
4. Discussion
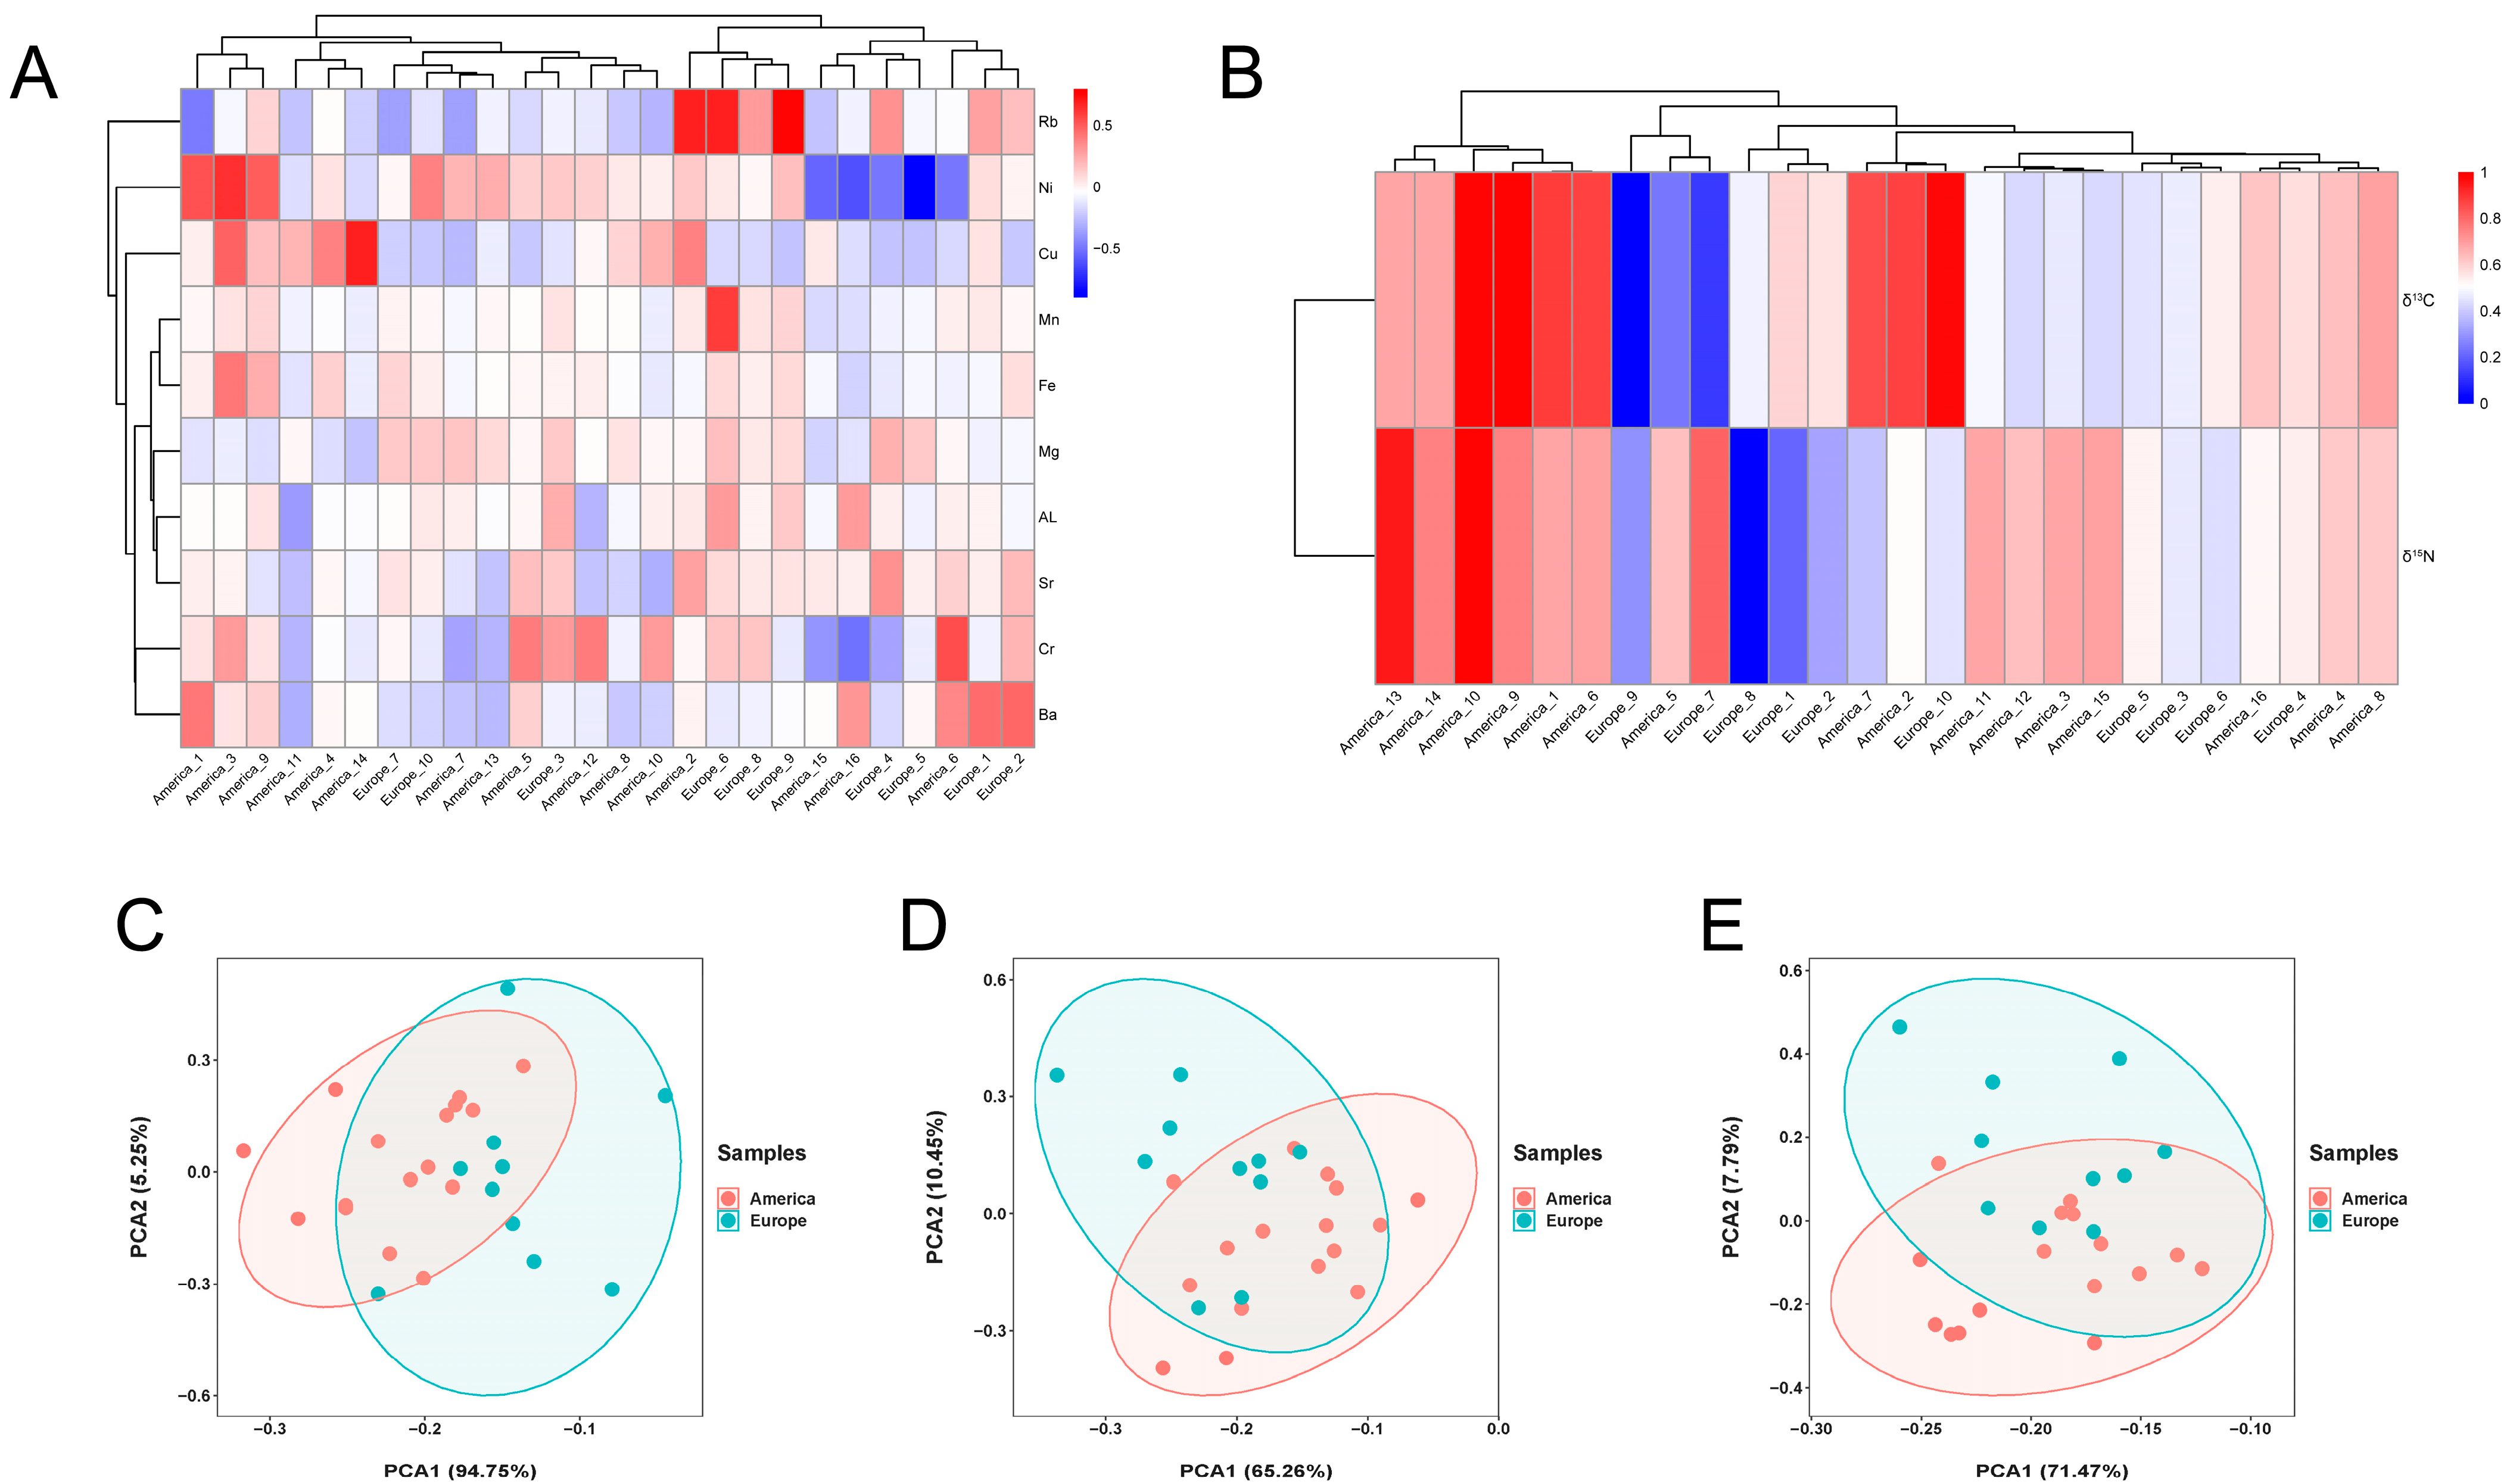
4.1. Cluster Analysis Conducted on Testing Results
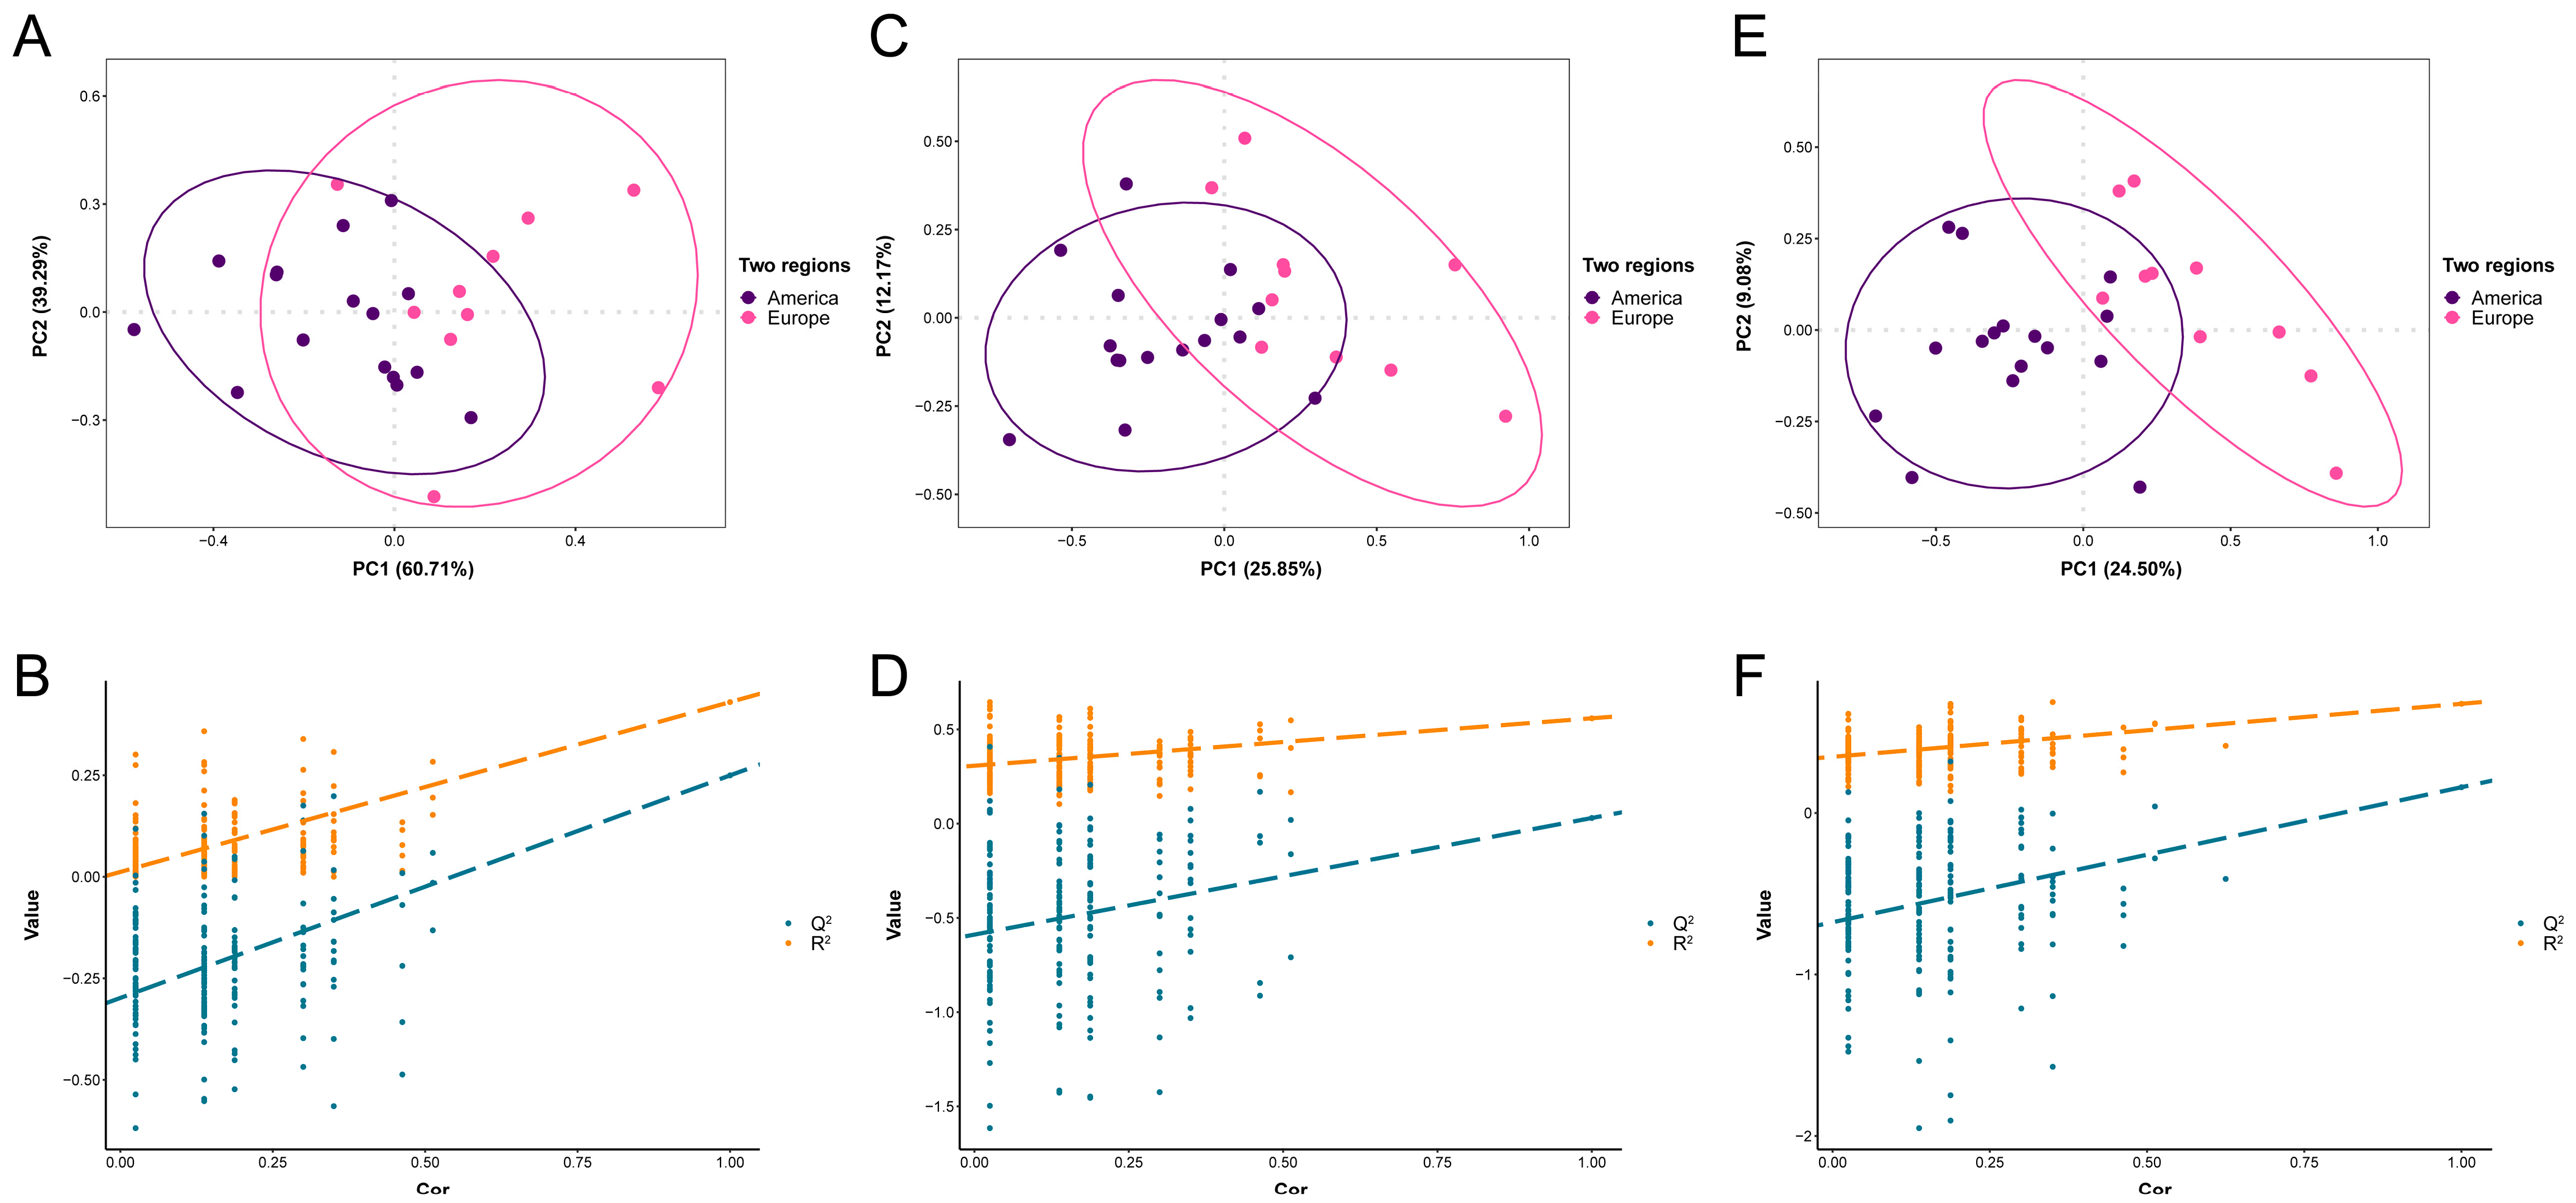
4.2. PLS-DA Model for Analyzing Element Content and Isotope Ratios
5. Conclusions
Author Contributions
Funding
Institutional Review Board Statement
Informed Consent Statement
Data Availability Statement
Conflicts of Interest
References
- Pautasso, M.; Aas, G.; Queloz, V.; Holdenrieder, O. European ash (Fraxinus excelsior) dieback—A conservation biology challenge. Biol. Conserv. 2013, 158, 37–49. [Google Scholar] [CrossRef]
- GB/T 18513-2022; Names of Main Woods Imported into China. Standards Press of China: Beijing, China, 2022.
- Cheng, Y.; Zhong, L.; Sun, Y. Review of Wood Identification Technology. Agric. Technol. Equip. 2021, 373, 125–128. [Google Scholar] [CrossRef]
- Zhang, J.; Yuan, P.; Li, J. Review of Wood Identification and Authentication Technology. Hubei For. Sci. Technol. 2015, 44, 30–35. [Google Scholar]
- Kremer, D.; Stabentheiner, E.; Borzan, Ž.; Grubešić, R.J. Micromorphological differences between some European and American Fraxinus (Oleaceae) species. Biologia 2008, 63, 1111–1117. [Google Scholar] [CrossRef]
- Aydoğan, B.; Cittan, M.; Çelik, A.; Kenan, D.O. A Comprehensive Analysis to Determine the Phytochemical Characteristics of Fraxinus Americana and Fraxinus Excelsior Leaves Extracts: Influence of the Extraction Method. Celal Bayar Univ. J. Sci. 2020, 16, 103–107. [Google Scholar]
- Ma, Y.; Guo, B.; Wei, Y. An Overview of Analytical Approaches for Determining the Geographical Origin of Plant-derived Foods. Food Sci. 2014, 35, 246–250. [Google Scholar] [CrossRef]
- Yan, T.; Chen, Y.; Shang, L.; Wang, Q.; Li, G. Discrimination of Volatile Components in Santalum album Heartwood from Different Habitats. China Wood Ind. 2019, 33, 18–21+26. [Google Scholar] [CrossRef]
- Deklerck, V. Timber origin verification using mass spectrometry: Challenges, opportunities, and way forward. Forensic Sci. Int. Anim. Environ. 2022, 3, 100057. [Google Scholar] [CrossRef]
- Wang, P.; Shen, J.; Tan, W. Progress in application of stable isotope in forest product traceability and adulteration detection. J. Zhejiang A&F Univ. 2018, 35, 968–974. [Google Scholar]
- Hong, H.; Tian, X.; Wen, F.; Cui, Y.; Peng, K.; Cao, W.; Wang, M.; Liu, Y.; Xu, Y. Research progress in origin traceability and authenticity identification of agricultural products using stable isotope. J. Food Saf. Qual. 2022, 13, 6889–6897. [Google Scholar] [CrossRef]
- Ma, M.; Feng, R.; Li, J.; Zhang, J.; Liu, Y.; Shi, T.; Cao, G.; Chen, X.; Yin, J. Origin traceability of imported barley based on 87Sr/86Sr and δ13C. J. Food Saf. Qual. 2021, 12, 7857–7862. [Google Scholar]
- Perini, M.; Giongo, L.; Grisenti, M.; Bontempo, L.; Camin, F. Stable isotope ratio analysis of different European raspberries, blackberries, blueberries, currants and strawberries. Food Chem. 2018, 239, 48–55. [Google Scholar] [CrossRef]
- Feng, R.; Cheng, Y.; Qian, N.; Ma, M.; Yang, X.; Chen, X.; Cao, G.; Yin, J. Research on Traceablility of Geographic Origin for Myrica rubra from Zhejiang Province by 87Sr/86Sr Isotope Ratios Using Thermal-Ionization Mass Spectrometry. J. Wuhan Univ. (Nat. Sci. Ed.) 2022, 68, 687–692. [Google Scholar] [CrossRef]
- Weckerle, B.; Richling, E.; Heinrich, S.; Schreier, P. Origin assessment of green coffee (Coffea arabica) by multi-element stable isotope analysis of caffeine. Anal. Bioanal. Chem. 2002, 374, 886–890. [Google Scholar] [CrossRef]
- Taous, F.; Amenzou, N.; Marah, H.; Maia, R.; Maguas, C.; Bahmad, L.; Kelly, S. Stable isotope ratio analysis as a new tool to trace the geographical origin of Argan oils in Morocco. Forensic Chem. 2020, 17, 100198. [Google Scholar] [CrossRef]
- Horacek, M.; Ogrinc, N.; Magdas, D.A.; Wunderlin, D.; Sucur, S.; Maras, V.; Misurovic, A.; Eder, R.; Čuš, F.; Wyhlidal, S.; et al. Isotope analysis (13C, 18O) of wine from central and eastern europe and argentina, 2008 and 2009 vintages: Differentiation of origin, environmental indications, and variations within countries. Front. Sustain. Food Syst. 2021, 5, 638941. [Google Scholar] [CrossRef]
- Watkinson, C.J.; Rees, G.O.; Hofem, S.; Michely, L.; Gasson, P.; Boner, M. A case study to establish a basis for evaluating geographic origin claims of timber from the Solomon Islands using stable isotope ratio analysis. Front. Forests Glob. Chang. 2022, 4, 645222. [Google Scholar] [CrossRef]
- Watkinson, C.J.; Gasson, P.; Rees, G.O.; Boner, M. The development and use of isoscapes to determine the geographical origin of Quercus spp. in the United States. Forests 2020, 11, 862. [Google Scholar] [CrossRef]
- Correia, I.; Almeida, M.H.; Aguiar, A.; Alia, R.; David, T.S.; Pereira, J.S. Variations in growth, survival and carbon isotope composition (δ13C) among Pinus pinaster populations of different geographic origins. Tree Physiol. 2008, 28, 1545. [Google Scholar] [CrossRef]
- Griboff, J.; Horacek, M.; Wunderlin, D.A.; Monferrán, M.V. Differentiation Between Argentine and Austrian Red and White Wines Based on Isotopic and Multi-Elemental Composition. Front. Sustain. Food Syst. 2021, 5, 657412. [Google Scholar] [CrossRef]
- Bin, L.; Wang, C.; Liu, Z.; He, W.; Zhao, D.; Fang, Y.-Y.; Li, Y.; Zhang, Z.; Chen, P.; Liu, W.; et al. Geographical origin traceability of muskmelon from Xinjiang province using stable isotopes and multi-elements with chemometrics. J. Food Compos. Anal. 2022, 106, 104320. [Google Scholar] [CrossRef]
- Muñoz-Redondo, J.; Bertoldi, D.; Tonon, A.; Ziller, L.; Camin, F.; Moreno-Rojas, J. Multi-element and stable isotopes characterization of commercial avocado fruit (Persea americana Mill) with origin authentication purposes. Food Control 2022, 137, 108975. [Google Scholar] [CrossRef]
- Jiao, L.; Lu, Y.; He, T.; Guo, J.; Yin, Y. DNA barcoding for wood identification: Global review of the last decade and future perspective. IAWA J. 2020, 41, 620–643. [Google Scholar] [CrossRef]
- Zhang, R.; Yin, Y.; Xu, X.; Ye, K. Application of DNA Technology for Wood Origin Identification. China Wood Ind. 2015, 29, 31–34. [Google Scholar]
- Boeschoten, L.E.; Sass-Klaassen, U.; Vlam, M.; Comans, R.N.; Koopmans, G.F.; Meyer-Sand, B.R.V.; Tassiamba, S.N.; Tchamba, M.T.; Zanguim, H.T.; Zemtsa, P.T.; et al. Clay and soil organic matter drive wood multi-elemental composition of a tropical tree species: Implications for timber tracing. Sci. Total Environ. 2022, 849, 157877. [Google Scholar] [CrossRef]
- Han, X.; Yan, C.; Chen, L.; Mei, X. Stable carbon isotope characteristics of some woody plants in warm temperate zone. Chin. J. Appl. Ecol. 2000, 11, 497–500. [Google Scholar]
- Liao, C.; Miao, S. Application of Stable Carbon and Nitrogen Isotopes in Tracing the Geographical Origin of Plants. J. Anhui Agric. Sci. 2022, 50, 19–21. [Google Scholar]
- Chai, H.; Zhong, S.; Cui, H.; Li, J.; Sun, W. Variation in the carbon isotope composition of CO2 derived from plant autotrophic respiration. Acta Ecol. Sin. 2018, 38, 2616–2624. [Google Scholar]
- Zhao, J.; Liu, W.; Chen, Y.; Zhang, X.; Wang, X.; Wang, F.; Qian, Y.; Qiu, J. Identification of markers for tea authenticity assessment: Non-targeted metabolomics of highly similar oolong tea cultivars (Camellia sinensis var. sinensis). Food Control 2022, 142, 109223. [Google Scholar] [CrossRef]
- Wang, H.; Cao, X.; Yuan, Z.; Guo, G. Untargeted metabolomics coupled with chemometrics approach for Xinyang Maojian green tea with cultivar, elevation and processing variations. Food Chem. 2021, 352, 129359. [Google Scholar] [CrossRef]

| Elements/Isotope | America Mean | America SD | Europe Mean | Europe SD | VIP | p Value |
|---|---|---|---|---|---|---|
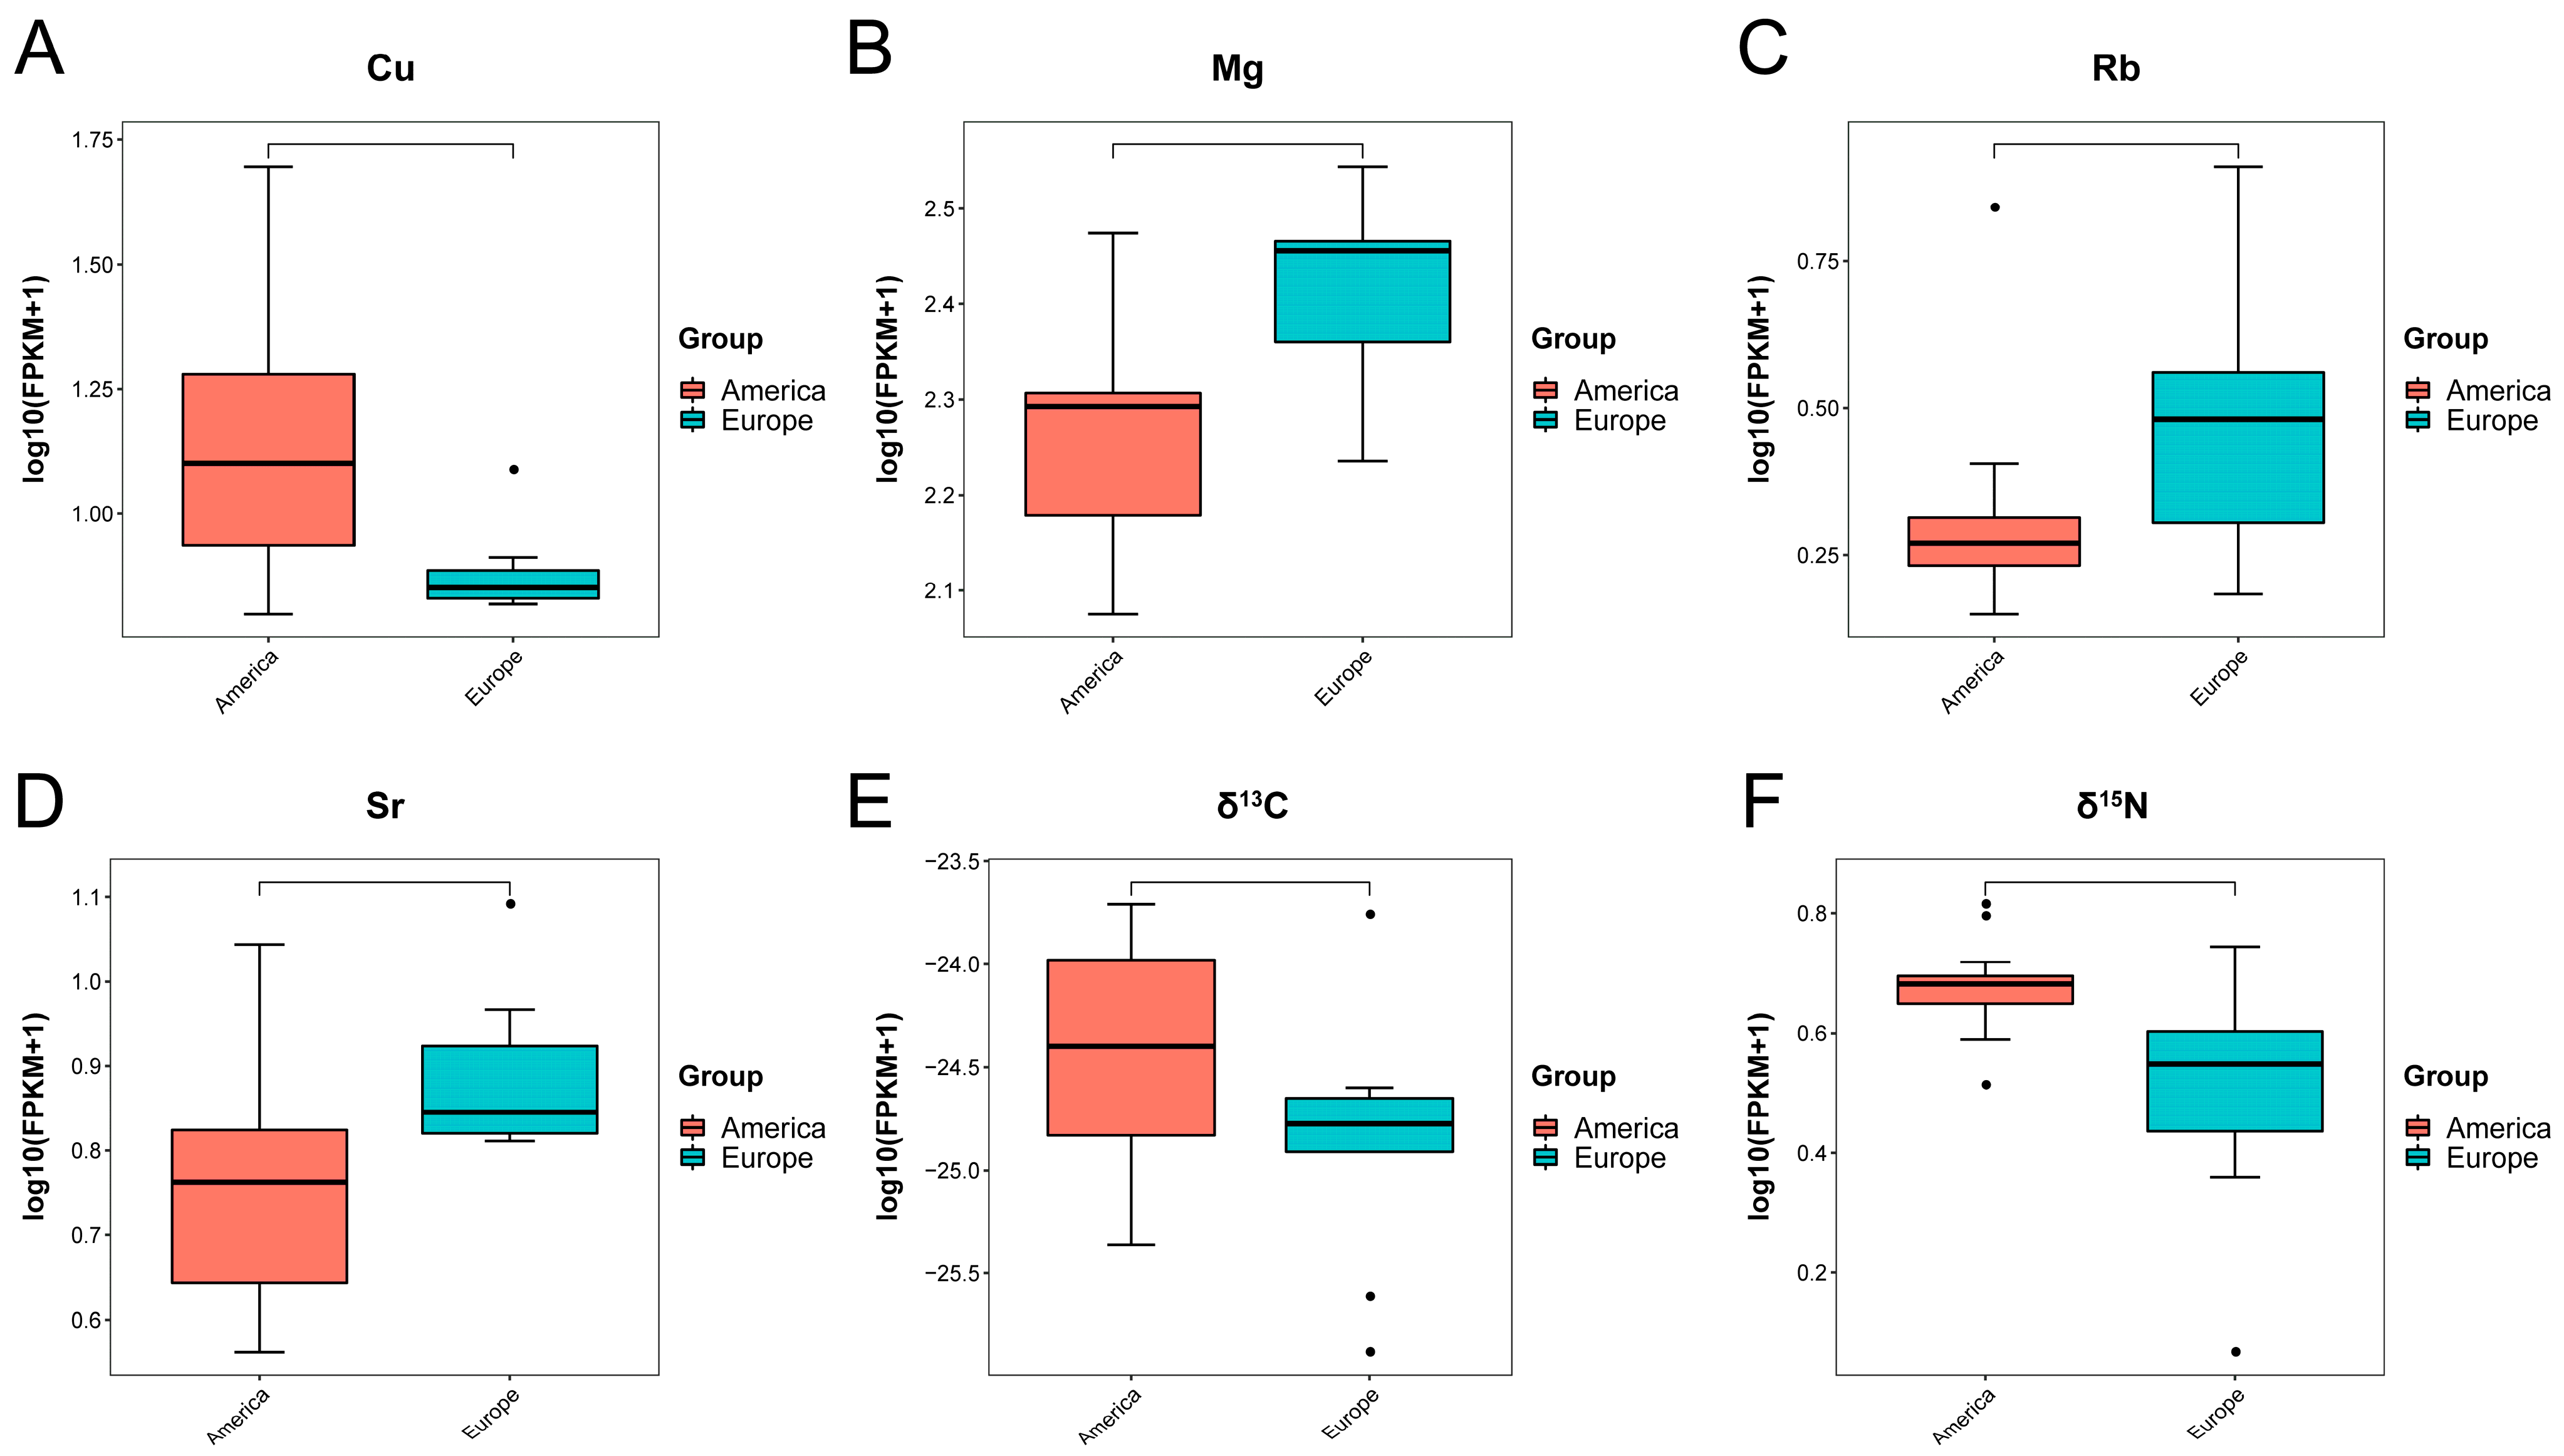
| Mg (mg kg−1) | 187.00 | 45.40 | 264.50 | 54.40 | 1.74 | 0.003 |
| Al (mg kg−1) | 12.10 | 3.93 | 14.8 | 4.59 | 0.84 | 0.220 |
| Cr (mg kg−1) | 0.73 | 0.53 | 0.63 | 0.26 | 0.33 | 0.938 |
| Mn (mg kg−1) | 3.07 | 0.51 | 4.39 | 2.96 | 0.63 | 0.036 |
| Fe (mg kg−1) | 48.70 | 21.70 | 48.1 | 7.75 | 0.41 | 0.310 |
| Ni (mg kg−1) | 16.90 | 13.10 | 12.2 | 6.60 | 0.53 | 0.517 |
| Cu (mg kg−1) | 15.50 | 11.00 | 6.68 | 1.60 | 1.04 | 0.004 |
| Rb (mg kg−1) | 1.18 | 1.30 | 2.55 | 2.10 | 1.23 | 0.023 |
| Sr (mg kg−1) | 4.97 | 1.97 | 6.78 | 1.74 | 1.07 | 0.006 |
| Ba (µg kg−1) | 7.85 | 4.35 | 8.32 | 5.79 | 0.60 | 0.979 |
| δ13C (‰) | −24.40 | 0.48 | −24.8 | 0.57 | 1.04 | 0.068 |
| δ15N (‰) | 3.78 | 0.80 | 2.35 | 1.17 | 1.44 | 0.002 |
| Modeling | Origins | Members | Accuracy | Total Accuracy |
|---|---|---|---|---|
| Stable isotope | America | 16 | 100% | 88.5% |
| Europe | 10 | 70% | ||
| Mineral element | America | 16 | 93.75% | 92.3% |
| Europe | 10 | 90% | ||
| Data fusion | America | 16 | 93.75% | 96.2% |
| Europe | 10 | 100% |
Disclaimer/Publisher’s Note: The statements, opinions and data contained in all publications are solely those of the individual author(s) and contributor(s) and not of MDPI and/or the editor(s). MDPI and/or the editor(s) disclaim responsibility for any injury to people or property resulting from any ideas, methods, instructions or products referred to in the content. |
© 2023 by the authors. Licensee MDPI, Basel, Switzerland. This article is an open access article distributed under the terms and conditions of the Creative Commons Attribution (CC BY) license (https://creativecommons.org/licenses/by/4.0/).
Share and Cite
Wang, H.; Liu, H.; Lu, B.; Ma, M.; Chen, J.; Nie, J. Origin Authentication of European and American Ash (Fraxinus spp.) Based on Stable Isotope Ratio and Elemental Characteristics Combined with Chemometrics Methods. Chemosensors 2023, 11, 536. https://doi.org/10.3390/chemosensors11100536
Wang H, Liu H, Lu B, Ma M, Chen J, Nie J. Origin Authentication of European and American Ash (Fraxinus spp.) Based on Stable Isotope Ratio and Elemental Characteristics Combined with Chemometrics Methods. Chemosensors. 2023; 11(10):536. https://doi.org/10.3390/chemosensors11100536
Chicago/Turabian StyleWang, Haibo, Huahong Liu, Bo Lu, Ming Ma, Jianguo Chen, and Jinfang Nie. 2023. "Origin Authentication of European and American Ash (Fraxinus spp.) Based on Stable Isotope Ratio and Elemental Characteristics Combined with Chemometrics Methods" Chemosensors 11, no. 10: 536. https://doi.org/10.3390/chemosensors11100536
APA StyleWang, H., Liu, H., Lu, B., Ma, M., Chen, J., & Nie, J. (2023). Origin Authentication of European and American Ash (Fraxinus spp.) Based on Stable Isotope Ratio and Elemental Characteristics Combined with Chemometrics Methods. Chemosensors, 11(10), 536. https://doi.org/10.3390/chemosensors11100536