Abstract
In the present study we report the development of an advantageous optical sensor for the speciation of Fe(III)/Fe(II). The sensor is based on the selective reaction of Fe(III) with a Desferal (Deferoxamine) reagent at pH = 2, while both Fe(III) and Fe(II) react with the reagent at pH = 5 using an acetate/glycine buffer. In this way, frequently used extra oxidation (H2O2) or reduction (ascorbic acid or hydroxylamine) steps are avoided. Both species can be determined in the range of 25 to 150 μM using a 96-well plate platform and the instrument-free detection of the colored complex with an overhead book scanner. The LOD is 4 μM, and an additional advantage is that a single calibration curve can be utilized for quantitation. The applicability of the sensor was demonstrated by analyzing commercially available pharmaceutical formulations for quality control purposes.
1. Introduction
Desferal (Deferoxamine) is an iron-binding agent belonging to a wider class of pharmaceuticals that are known as heavy metal antagonists [1]. It is produced by the fermentation of Streptomyces pilosus and is used in the therapy of individuals with acute iron intoxication and to treat transfusional iron overload in patients with chronic anemia [2]. The human body does not have a mechanism for eliminating excess iron, and the metal accumulates in organs such as the heart and liver, with highly toxic effects [3]. Through a simple mechanism of action, Desferal chelates iron by forming a stable complex that is readily soluble and excreted through the renal system. It is administrated intramuscularly –typically as a single dose–and should be avoided in patients with renal disorders.
Although the chemistry of the formation of a colored complex by Desferal and Fe(II)/Fe(III) was investigated by Goodwin and Whitten quite a few years ago [4], non-medical applications and studies are rather limited in the international literature. For example, Illmer reported that Desferal could increase the mobility of iron in soils [2]. Alberti et al. studied the chemical functionalization of filter papers with Desferal as the basis of the formation of a sensing device for Fe(III) and V(V) [5], while Takagai et al. described the modification of an acrylic micro-polymer resin with Desferal and evaluated its adsorption property for the recovery of uranium(VI) [6]. From an analytical chemistry point of view, in a 2022 review article Alberti et al. discussed Desferal-based applications for the chelation and recognition of Fe(III) specifically [7], while Sanna et al. quite recently re-evaluated the potential of Desferal as a useful spectrophotometric reagent for the determination of iron, emphasizing its ability to quantify total iron at elevated pH values [8].
The speciation of iron (Fe(II)/Fe(III)) is quite important in numerous fields such as plant science, the environment, pharmaceutics, and biology, and an interested reader can find several applications in the international literature [9,10,11,12,13,14,15,16,17,18,19,20,21,22,23,24,25]. A screening of the recently published methods (2016 to date) revealed that the speciation of iron (and/or the determination of total iron) is based on more or less known red/ox pretreatment steps, followed by state-specific color-forming or fluorescent reactions. In brief, either Fe(II) or Fe(III) is determined in a first run, total iron is determined in a second run, and speciation is achieved by subtraction. An overview of the principles of such procedures can be found in Table 1. As can be seen from the methods included in Table 1, they can be categorized into three main groups: (i) methods that are based on the reduction of Fe(III), typically by ascorbic acid or hydroxylamine [9,10,12,13,14,15,17,19,20,24]; (ii) methods that are based on the oxidation of Fe(II) by H2O2 [11,16,18]; and (iii) methods where both Fe(II) and Fe(III) interact with the selected probe, offering the possibility to perform total iron quantification in a single run (no speciation is reported though) [21,22,23]. Alternatively, a less-applied recent procedure is the column-based separation of Fe(II)/Fe(III) using cation exchange chromatography followed by compatible ICP detection [25].

Table 1.
Overview of experimental strategies for the speciation of iron.
In the present work, we propose an interesting alternative for the instrument-free, high-throughput speciation of Fe(II)/Fe(III). Desferal reacts selectively with Fe(III) (in the presence of Fe(II) at pH = 2) to form a colored complex [4]. At a pH value of 5 in acetate/glycine buffer, we proved that Desferal reacts with both Fe(III) and Fe(II) forming complexes with identical spectra and intensities. From a mechanistic point of view, it has been suggested that at this pH value, Desferal oxidizes Fe(II) quantitatively in the presence of dissolved oxygen followed by the color-forming complexation. All reactions and procedures were rapid and were developed using a high-throughput 96-well plate format, combined with instrument-free detection using an overhead book scanner. A single calibration curve can be employed for quantitative measurements reducing the number of analytical steps required [26]. The developed sensor was validated and applied to the determination of iron in commercially available pharmaceuticals.
2. Materials and Methods
2.1. Reagents and Solutions
All experiments involved analytical-grade reagents that were supplied by either Sigma (Athens, Greece) or Fluka (Thessaloniki, Greece). Doubly de-ionized water was prepared using a Milli-Q system. Fe(II) (Iron(II) sulfate heptahydrate, 10 mM) and Fe(III) (Iron(III) nitrate nonahydrate, 10 mM) stock solutions were prepared daily in 5 mM HCl to avoid hydrolysis. The Desferal reagent was obtained from its commercially available pharmaceutical formulation, which is free excipients (Novartis, Athens, Greece) and its working solutions were prepared daily in water at the desired concentration levels. Working buffers were prepared using mixtures of glycine and ammonium acetate (50 mM each, pH = 2–5) and were standardized with HCl ([HCl] = 1 mol L−1).
Selectivity studies aiming at the pharmaceutical application of the method were based on the preparation of a placebo mixture containing pharmaceutical-grade excipients (lactose monohydrate, sodium docusate, maize starch, polyvidone, talc, microcrystalline cellulose, sodium lauryl sulfate, silica colloidal anhydrous and magnesium stearate). All excipients were kindly donated by Cosmopharm Ltd. (Corinth, Greece). Equal amounts of each excipient were mixed and homogenized to form a fine powder. An accurately weighed amount of the resulting placebo was dispersed in water, corresponding to a nominal concentration of 10 mg mL−1. The mixture was ultra-sonicated to ensure maximum dissolution, centrifuged, and filtered under vacuum (0.45 μm membrane filters) to obtain a clear solution [27,28].
The evaluation of the potential interfering effects of typical cations and anions was carried out using respective salts (nitrate, chloride, potassium and sodium salts) in aqueous solutions. All aqueous solutions of the salts were prepared at 10 mM levels unless stated otherwise.
2.2. Instrumentation
UV-vis transparent 96-well plates were kindly donated by Metrolab (Athens, Greece). Detection/image capturing was performed using an overhead book scanner (IRIScan-Desk 6 Pro). UV-vis spectra were obtained via a UV-Vis 1700 benchtop spectrophotometer (Shimadzu, Kyoto, Japan). Other typical lab equipment included centrifuges, pH meters, magnetic stirrers, balances, syringe filters (0.45 μM PTFE or Nylon), etc.
2.3. Analytical Procedure for the Speciation of Iron
The quantification of Fe(II)/Fe(III) in aqueous solutions included the following steps: First, 50 μL of Desferal (10 mM), 50 μL of buffer (Gly/Ac, 50 mM each, pH = 2 or 5) and 200 μL of Fe(III)/Fe(II) samples or standards were pipetted into each well of the 96-well plate. The reactions were allowed to proceed under gentle orbital shaking for 5–15 min (no strict monitoring of the reaction time was required). Images of the colored complexes in each plate were captured using the IRIScan overhead book scanner (the LED-based light of the scanner was turned off to avoid reflections on the well plate). Each picture was saved in the JPEG format and was processed via the freely available Image J software (RGB mode, Image → type → RGB stack → blue). In brief, the red-green-blue scale assigns an integer value from 0 to 255 for each of these three colors in a given tone, with [0, 0, 0] indicating absolute black and [255, 255, 255] corresponding to true white. Fe(III) was quantified at pH = 2, while total Fe [Fe(III) + Fe(II)] was quantified at pH = 5. A single calibration curve (e.g., for Fe(III)) was employed for all experiments.
3. Results and Discussion
Desferal is known to react with Fe(III) specifically under acidic conditions and this reaction was the basis for the development of an iron speciation method by Yegorov et al. who proposed a mixed reagent of 1,10-phenanthroline/Desferal for Fe(II)-Fe(II)+Fe(III) quantitation [29]. Goodwin and Whitten were the first to present data on the potential suitability of the reagent for the complexation of Fe(II) as well [4]. They concluded that–in the presence of oxygen—at pH ≥ 5, Fe(II) reacts with Desferal through oxidation by the reagent to Fe(III) and subsequent complexation. According to the authors, common reducing agents such as ascorbic acid and hydroxylamine that are widely used for iron speciation (see Table 1) do not have any effect on the reaction. It was therefore rather intriguing for us to take advantage of this interesting chemistry and try to develop a quantitative sensor for the speciation of iron by simply changing the pH of the reaction, employing a single reagent, and avoiding intermediate reducing/oxidizing steps.
3.1. Preliminary Experiments
In a series of preliminary experiments, we evaluated the ability of the overhead book scanner to efficiently scan the whole area of the 96-well plate. This is particularly important when developing high-throughput assays because all wells can be used for sample processing. In brief, the Desferal-Fe(III) complex was prepared in a 20-mL container, and 250 μL of the colored complex was pipetted into 58 representative wells covering all areas of the plate (see Figure S1 in the Supplementary Materials). The plate was scanned and the image was processed as described in Section 2.3. The statistical evaluation of the results confirmed the ability of the scanner to efficiently scan the whole area of the plate since the RSD of the intensities was 1.6% (n = 58).
3.2. Effect of the pH on the Development of the Sensor
As discussed previously, the main goal of this work was to be able to achieve Fe(III)/Fe(II) speciation by simply taking advantage of the different behaviors of the reagent as a function of the pH. On this basis, we investigated the effect of the pH in the range of 2–8 using two different buffers: Glycine/Acetate (50 mM each) in the range of 2–5 and Tris buffer (100 mM) in the range of 5–8. Reaction of Fe(II)/Fe(III) with Desferal at the table pH value of 5 was examined comparatively using both buffers to evaluate the potential effect of the species on the reaction. As can be seen graphically in Figure 1, the experimental results were quite interesting and, to some extend, rather unexpected. It should be noted that all experiments were carried out with 100 μM Fe(III)/Fe(II) and that the results were normalized setting Fe(III)/pH = 2 as the 100% level. The following conclusions were derived:
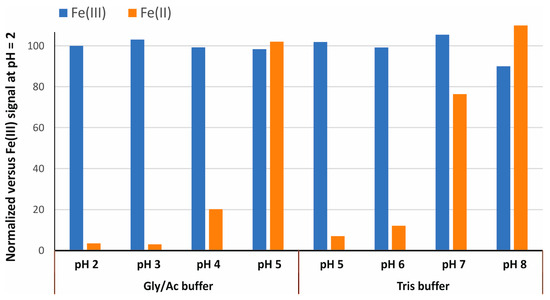
Figure 1.
Effect of the pH and the type of buffer on the reaction of Fe(III)/Fe(II) with Desferal.
- (i).
- Fe(III) had “uniform” behavior over almost the entire pH range regardless of the buffers used. A slight decrease of ca. 10% was observed at alkaline pH values of 8, which can be attributed to hydrolysis phenomena.
- (ii).
- No practical reaction between Fe(II) and Desferal was recorded at acidic pH values of ≤ 3. In the Acetate/Glycine buffer, Fe(II) started reacting with Desferal at pH values of > 4, and the reaction was completed at pH = 5, yielding signals equal to Fe(III).
- (iii).
- No Fe(II)-Desferal reaction was observed at pH = 5 using Tris buffer, indicating that besides the presence of dissolved oxygen, the species of the buffer plays an important role in the reaction. In Tris buffer, the reaction between Fe(II) and Desferal was evident for pH values > 7, which was in accordance with the findings of Yegorov et al., who used the same buffer at pH = 7.4 [29].
To further study the phenomena described above, off-line UV-vis spectra were recorded at pH values of 2 and 5 (acetate/glycine buffer), using equimolar concentrations of Fe(II) and Fe(III). This series of experiments confirmed that Fe(III)/pH = 2, Fe(III)/pH = 5, and Fe(II)/pH = 5 had identical spectra of equal intensities. No reaction was recorded for Fe(II) at pH = 2 (see representative spectra in Figure 2).
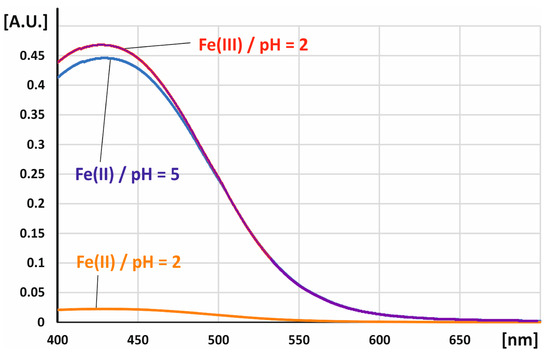
Figure 2.
Representative spectra of the reaction of Fe(III)/Fe(II) with Desferal at different pH values.
3.3. Effects of the Concentration of Desferal and the Reaction Time
The effect of the concentration of the complexing reagent is an important parameter to ensure an adequate excess of the reagent for quantitative purposes; it was therefore optimized in the range of 5–20 mM using 100 μM Fe(III) or Fe(II) at both pH values of 2 and 5. As can be seen from the graphical results in Figure 3, no practical variations were observed within the studied range, while no reaction of Fe(II) at pH = 2 was once again confirmed. Therefore, 10 mM Desferal was selected for subsequent experiments.
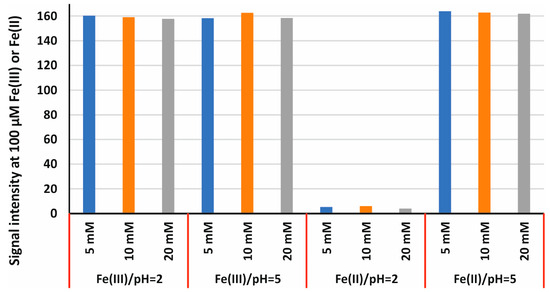
Figure 3.
Effect of the concentration of Desferal on the sensitivity of the sensor at pH = 2 and 5.
The sensor behaved similarly in terms of reaction time as well, since no variations were recorded between the practical time of 5 min and the highest examined value of 30 min. Therefore, no strict timing was adopted, with the scans being recorded anywhere between 5 and 15 min depending on the practical handling of the 96-well plate.
3.4. Speciation of Fe(III)/Fe(II) in Aqueous Solutions
To confirm that the speciation of Fe(III)/Fe(II) is feasible using the studied chemical system, calibration curves were obtained under different experimental conditions. The examined range was 25–150 μM for both Fe(II) and Fe(III), while three independent curves were plotted for each experimental set (n = 3 × 4 = 12). The results are included in Table 2, while a representative image is shown in Figure 4.
Table 2.
Fe(III)/Fe(II) aqueous calibration curves under various pH conditions.
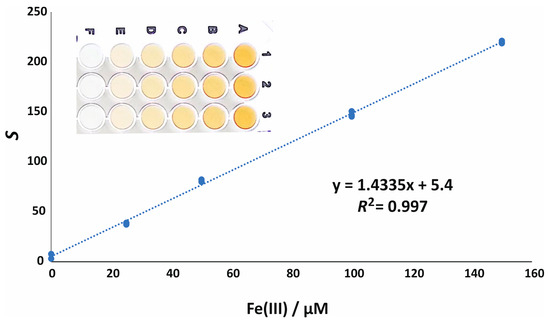
Figure 4.
Representative graphical depiction of the linearity of the method (Fe(III) at pH = 2); S = signal (arbitrary units); 1–3 = three independent curves ans F-A = 0–150 μM Fe(III).
As can be derived from the data presented in Table 2, Fe(II) showed a negligible reaction under acidic conditions (calibration curve [C]), with the calculated slope being only 1.3% of the Fe(III) slope at the same pH (calibration curve [A]). The same behavior was recorded at pH = 2 even at higher Fe(II) concentrations of up to 1000 μM.
Calibration curves [A], [B], and [D] were further compared in pairs to evaluate potential statistical variations. The calculated p-values (95% confidence) were p = 0.161, 0.325, and 0.859 for the [A]/[B], [A]/[D], and [D]/[B] comparisons of the calibration curves, respectively, confirming the statistical equivalence of the curves. This feature is particularly important since it provides the potential to use a single calibration (e.g., Fe(III) at pH = 2) for all quantitative measurements.
In a final series of experiments, various mixtures of Fe(II) and Fe(III) were prepared and processed at pH = 2 and pH = 5 (each mixture was processed in triplicate (n = 3)). Quantification was performed using the Fe(III)/pH = 2 calibration curve, and the experimental results are tabulated in Table S1 (Supplementary Materials). The recovery percentages were satisfactory in all cases, as they were in the range of 90–114%.
3.5. Analytical Figures of Merit
Linearity was obeyed in the range of 25–150 μM Fe(II)/Fe(III). A representative regression equation corresponding to the reaction of Fe(III) at pH = 2 is
S = 1.4335 (±0.0380) × Fe(III) + 5.4 (±1.7)
The LOD/LOQ (Limits of detection and quantification) of the sensor were calculated using the standard deviation of the intercept approach and were 4 and 12 μM respectively. The within-day precision was estimated (i) using repeated scans of the same plate (scanner precision) and (ii) using a single scan of 50 μM Fe(III) and Fe(II) (pH = 2 and 5) prepared independently and placed at different wells. The precision of the scanning process was satisfactory with the RSD values being 2.5% for 50 μM Fe(III) (n = 24) and 1.4% for 100 μM Fe(III) (n = 24). The precision of the method was similar, with the RSD values being in the neighborhood of 1.5% in all cases. The day-to-day precision was validated by preparing aqueous calibration curves for Fe(II) at pH = 5 and for Fe(II) at pH = 2 (three curves were scanned per day for a time period of three consecutive days). For both species of iron the RSD values were in the range of 7—9%, and were quite satisfactory for this type of detection.
3.6. Effects of Interfering Compounds/Selectivity
A very detailed theoretical overview of the formation of complexes between Desferal and metal ions is included in the review article by Bellotti and Remelli [3]. From an analytical chemistry point of view, the effects of various anions and cations were evaluated for 100 μM Fe(III)/Fe(II) (the criterion for interference was a ±10% deviation from the signal of the aqueous standards):
- (i).
- Mg(II), Ca(II), K(I), and Na(I) had no effect at the maximum ratio tested (100-fold excess).
- (ii).
- The same results were obtained for Cl−, SO42−, NO3−, and HCOO−.
- (iii).
- Phosphate ions were tolerable at 10-fold excess since their presence seemed to slow down the complexation reaction.
- (iv).
- Al(III), Co(II), Ni(II), and Zn(II) were also adequately tolerated at 10-fold excess.
3.7. Analytical Application
Iron is a well-documented essential nutrient for human health but a proven potential toxicant to cells as well. A sufficient iron concentration is therefore critical for numerous biological functions, including electron transfer reactions, gene regulation, the binding and transport of oxygen, and the regulation of cell growth and differentiation [30]. At the same time, organisms have to be able to avoid the accumulation of excess iron in cells through specific mechanisms [31]. Too much iron is considered to be toxic, affecting many organs and functions in the human body. For example, side effects in the heart may vary from arrythmia (irregular heartbeat) to heart failure; elevated iron levels in the liver may lead to liver failure or even cancer; and additional health problems associated with iron overload include arthritis (joint damage), malfunction of the spleen or thyroid, disorders of the reproductive system in men, and early menopause in women. For these reasons, it is critical to monitor iron levels in blood/serum and to ensure the quality of popular pharmaceuticals that are used for iron supplementation.
As a proof of concept, the developed sensor was therefore applied to the determination of the iron in various commercially available pharmaceutical formulations intended for human use. Four representative commercially available formulations were purchased from local pharmacies. The selected products included capsules, tablets, oral powders, and sachets for dispersion in water. The real samples were stored as in everyday usage until processing (protected from direct sunlight and humidity). Sample preparation was based on the European Pharmacopoeia and involved treating the samples with sulfuric acid to liberate Fe(II)/Fe(III) [32]. Before analysis, the samples were diluted with doubly de-ionized water to lower the acidity and match the concentration of the analyte to the range of the calibration curve.
Prior to the analytical application, it was necessary to examine the potential effect of the pharmaceutical matrix (excipients) on the performance of the sensor. A placebo mixture was prepared as described in Section 2.1, and a nominal concentration of 1 mg mL−1 was spiked individually with Fe(III) and Fe(II) in the range of 25–150 μM. The matrix-matched curves were statistically compared with the aqueous one (see Table 2), with the p-values being 0.651 and 0.703, respectively.
Table 3 includes the results from the analysis of the real samples and related information (type of iron, nominal concentration and pharmaceutical form). The accuracy of the method was further validated by spiking the treated pharmaceuticals with 25 and 50 μΜ Fe(II) and Fe(III). As can be seen in Table 4, the recovery percentages were satisfactory in all cases, ranging between 92 and 112%.
Table 3.
Analysis of pharmaceutical formulations.
Table 4.
Accuracy of the sensor for pharmaceuticals.
4. Conclusions
The proposed optical sensor for the speciation of Fe(III)/Fe(II) is based on the tendency for Desferal to simultaneously oxidize and complex Fe(II) at pH = 5 in a glycine/acetate buffer. In this way, a very simple approach for iron speciation was developed by simply changing the pH of the reaction from 2 (Fe(III) determination) to 5 (total iron determination). Another important feature of the chemical system is the statistical equivalence of all calibration curves, offering the potential to use a single curve during all quantitation steps. Development using a 96-well plate platform enhanced the high-throughput character of the sensor, with the latter being further simplified using instrument-free detection via an overhead book scanner. The limits of detection at low micromolar levels may not be adequate for certain types of applications, but there is always the alternative of applying preconcentration steps to the colored complex prior to image capturing (cloud point extraction, dispersive liquid micro-extraction, etc.).
Supplementary Materials
The following supporting information can be downloaded at: https://www.mdpi.com/article/10.3390/chemosensors11120577/s1, Figure S1: Evaluation of the ability of the overhead book scanner to scan the entire area of the 96-well plate (for experimental details please see text); Table S1: Analysis of mixtures of Fe(III)/Fe(II) in aqueous solutions.
Author Contributions
Conceptualization, P.D.T.; methodology, P.D.T. and C.K.Z.; validation, D.B. and A.T.; data curation, A.T. and C.K.Z.; writing—original draft preparation, D.B. and A.T.; writing—review and editing, P.D.T. All authors have read and agreed to the published version of the manuscript.
Funding
This research received no external funding.
Institutional Review Board Statement
Not applicable.
Data Availability Statement
Data may be available upon request.
Acknowledgments
The authors would like to acknowledge G. Tsogas (Depatment of Chemistry, Aristotle University of Thessaloniki, Greece) for helpful discussions and technical assistance.
Conflicts of Interest
The authors declare no conflict of interest.
References
- Desferal (Deferoxamine) Dosing, Indications, Interactions, Adverse Effects, and More, (n.d.). Available online: https://reference.medscape.com/drug/desferal-deferoxamine-343722#91 (accessed on 29 August 2023).
- Illmer, P. A commercially available iron-chelating agent, Desferal, promotes Fe- and Al-mobilization in soils. Soil Biol. Biochem. 2006, 38, 1491–1493. [Google Scholar] [CrossRef]
- Bellotti, D.; Remelli, M. Deferoxamine B: A Natural, Excellent and Versatile Metal Chelator. Molecules 2021, Vol. 26, Page 3255. 2021, 26, 3255. [Google Scholar] [CrossRef] [PubMed]
- Goodwin, J.F.; Whitten, C.F. Chelation of Ferrous Sulphate Solutions by Desferrioxamine B. Nature 1965, 205, 281–283. [Google Scholar] [CrossRef] [PubMed]
- Alberti, G.; Quattrini, F.; Colleoni, R.; Nurchi, V.M.; Biesuz, R. Deferoxamine-paper for iron(III) and vanadium(V) sensing. Chem. Papers. 2015, 69, 1024–1032. [Google Scholar] [CrossRef]
- Takagai, Y.; Abe, M.; Oonuma, C.; Butsugan, M.; Kerlin, W.; Czerwinski, K.; Sudowe, R. Synthesis and Evaluation of Reusable Desferrioxamine B Immobilized on Polymeric Spherical Microparticles for Uranium Recovery. Ind. Eng. Chem. Res. 2019, 58, 17928–17936. [Google Scholar] [CrossRef]
- Alberti, G.; Zanoni, C.; Magnaghi, L.R.; Biesuz, R. Deferoxamine-Based Materials and Sensors for Fe(III) Detection. Chemosensors 2022, 10, 468. [Google Scholar] [CrossRef]
- Nurchi, V.M.; Cappai, R.; Spano, N.; Sanna, G. A Friendly Complexing Agent for Spectrophotometric Determination of Total Iron. Molecules 2021, 26, 3071. [Google Scholar] [CrossRef]
- Sakamoto, M.; Hizawa, K.; Hosaka, M.; Sugawara, M. Visual assay of total iron in human serum with bathophenanthrolin disulfonate-accommodated MCM-41. Anal. Sci. 2016, 32, 241–244. [Google Scholar] [CrossRef]
- Jamali, M.R.; Tavakoli, M.; Rahnama, R. Development of ionic liquid-based in situ solvent formation microextraction for iron speciation and determination in water and food samples. J. Mol. Liquids. 2016, 216, 666–670. [Google Scholar] [CrossRef]
- Hormozi-Nezhad, M.R.; Taghipour, M. Quick speciation of iron(II) and iron(III) in natural samples using a selective fluorescent carbon dot-based probe. Anal. Methods 2016, 8, 4064–4068. [Google Scholar] [CrossRef]
- Paluch, J.; Kozak, J.; Wieczorek, M.; Kozak, M.; Kochana, J.; Widurek, K.; Konieczna, M.; Kościelniak, P. Novel approach to two-component speciation analysis. Spectrophotometric flow-based determinations of Fe(II)/Fe(III) and Cr(III)/Cr(VI). Talanta 2017, 171, 275–282. [Google Scholar] [CrossRef] [PubMed]
- Khalafi, L.; Doolittle, P.; Wright, J. Speciation and Determination of Low Concentration of Iron in Beer Samples by Cloud Point Extraction. J. Chem. Educ. 2018, 95, 463–467. [Google Scholar] [CrossRef]
- Phansi, P.; Danchana, K.; Ferreira, S.L.C.; Cerdà, V. Multisyringe flow injection analysis (MSFIA) for the automatic determination of total iron in wines. Food Chem. 2019, 277, 261–266. [Google Scholar] [CrossRef] [PubMed]
- Xue, D.S.; Chen, G.J.; Su, B.X.; Liu, Y.H.; Zhang, D.P.; Guo, Q.; Guo, J.J.; Sun, J.F. On-line spectrophotometric determination of ferrous and total iron in monominerals by flow injection combined with a Schlenk line-based digestion apparatus to exclude oxygen. Microchem. J. 2020, 155, 104743. [Google Scholar] [CrossRef]
- El-Reash, Y.G.A.; Tantawy, H.A.; Abdel-Latif, E.; Mortada, W.I. Micelle-mediated extraction for speciation and spectrophotometric determination of iron using a newly synthesized salicylic acid derivative. Microchem. J. 2020, 158, 105280. [Google Scholar] [CrossRef]
- Andreu, C.; Danchana, K.; Cerdà, V. Automated Spectrophotometric Multi-Pumping Flow System for the Determination of Total Iron in Wine. Anal. Lett. 2020, 53, 2775–2783. [Google Scholar] [CrossRef]
- Nourbala Tafti, E.; Haji Shabani, A.M.; Dadfarnia, S.; Dehghani Firouzabadi, Z. In syringe-supramolecular dispersive liquid-liquid microextraction followed by atomic absorption spectrometric determination for iron species in water and total iron in food samples. Int. J. Environ. Anal. Chem. 2021, 103, 6984–6995. [Google Scholar] [CrossRef]
- Laosuwan, M.; Gissawong, N.; Butwong, N.; Srijaranai, S.; Mukdasai, S. Facile liquid colorimetric sensor using high-density deep eutectic solvent for trace detection and speciation of iron in milk. Spectrochim. Acta-Part A Mol. Biomol. Spectrosc. 2022, 272, 121020. [Google Scholar] [CrossRef]
- Cooray, A.T.; Pullin, M.J. Ferrozine colorimetry and reverse flow injection analysis (rFIA) based method for the determination of total iron in aqueous solutions at nanomolar concentrations. J. Indian Chem. Soc. 2022, 99, 100541. [Google Scholar] [CrossRef]
- Duan, N.; Feng, J.; Deng, B.; Yang, S.; Tian, H.; Sun, B. A colourimetric fluorescent probe for the sensitive detection of total iron in wine. Food Chem. 2022, 383, 132594. [Google Scholar] [CrossRef]
- Cheng, F.; Zhang, T.; Yang, C.; Zhu, H.; Li, Y.; Sun, T.; Zhou, C. A direct and rapid method for determination of total iron in environmental samples and hydrometallurgy using UV–Vis spectrophotometry. Microchem. J. 2022, 179, 107478. [Google Scholar] [CrossRef]
- Namjan, M.; Kaewwonglom, N.; Dechakiatkrai Theerakarunwong, C.; Jakmunee, J.; Khongpet, W. An Environmentally Friendly Compact Microfluidic Hydrodynamic Sequential Injection System Using Curcuma putii Maknoi & Jenjitt. Extract as a Natural Reagent for Colorimetric Determination of Total Iron in Water Samples. J. Anal. Methods Chem. 2023, 2023, 3400863. [Google Scholar] [CrossRef] [PubMed]
- Mesquita, R.B.R.; Klima, C.; Martínez-Pérez-Cejuela, H.; Monforte, A.R.; Ferreira, A.C.S.; Rangel, A.O.S.S. Targeting iron speciation in wines: Design of a microfluidic paper-based device for determination of iron(II) and iron(III). Microchem. J. 2023, 188, 108462. [Google Scholar] [CrossRef]
- AOrłowska; Proch, J.; Niedzielski, P. A Fast and Efficient Procedure of Iron Species Determination Based on HPLC with a Short Column and Detection in High Resolution ICP OES. Molecules 2023, 28, 4539. [Google Scholar] [CrossRef] [PubMed]
- Zorzi, M.; Pastore, P.; Magno, F. A Single Calibration Graph for the Direct Determination of Ascorbic and Dehydroascorbic Acids by Electrogenerated Luminescence Based on Ru(bpy)32+ in Aqueous Solution. Anal. Chem. 2000, 72, 4934–4939. [Google Scholar] [CrossRef] [PubMed]
- Tzanavaras, P.D.; Themelis, D.G.; Zotou, A.; Stratis, J.; Karlberg, B. Optimization and validation of a dissolution test for selegiline hydrochloride tablets by a novel rapid HPLC assay using a monolithic stationary phase. J. Pharm. Biomed. Anal. 2008, 46, 670–675. [Google Scholar] [CrossRef]
- Tzanavaras, P.D.; Themelis, D.G. Automated determination of flutamide by a validated flow-injection method: Application to dissolution studies of pharmaceutical tablets. J. Pharm. Biomed. Anal. 2007, 43, 1820–1824. [Google Scholar] [CrossRef]
- Yegorov, D.Y.; Kozlov, A.V.; Azizova, O.A.; Vladimirov, Y.A. Simultaneous determination of Fe(III) and Fe(II) in water solutions and tissue homogenates using desferal and 1,10-phenanthroline. Free Radic. Biol. Med. 1993, 15, 565–574. [Google Scholar] [CrossRef]
- Beard, J.L. Iron Biology in Immune Function, Muscle Metabolism and Neuronal Functioning. J. Nutr. 2001, 131, 568S–580S. [Google Scholar] [CrossRef]
- Fine, J.S. Iron poisoning. Curr. Probl. Pediatr. 2000, 30, 71–90. [Google Scholar] [CrossRef][Green Version]
- European Pharmacopoeia (Ph. Eur.)–European Directorate for the Quality of Medicines & HealthCare, (n.d.). Available online: https://www.edqm.eu/en/european-pharmacopoeia (accessed on 30 August 2023).


Disclaimer/Publisher’s Note: The statements, opinions and data contained in all publications are solely those of the individual author(s) and contributor(s) and not of MDPI and/or the editor(s). MDPI and/or the editor(s) disclaim responsibility for any injury to people or property resulting from any ideas, methods, instructions or products referred to in the content. |
© 2023 by the authors. Licensee MDPI, Basel, Switzerland. This article is an open access article distributed under the terms and conditions of the Creative Commons Attribution (CC BY) license (https://creativecommons.org/licenses/by/4.0/).