Review

Spectroscopy, a Tool for the Non-Destructive Sensory Analysis of Plant-Based Foods and Beverages: A Comprehensive Review

by
Teodora Basile
*,
Domenica Mallardi
and
Maria Francesca Cardone
Council for Agricultural Research and Economics—Research Centre for Viticulture and Enology (CREA—VE), 70010 Turi, BA, Italy
*
Author to whom correspondence should be addressed.
Chemosensors 2023, 11(12), 579; https://doi.org/10.3390/chemosensors11120579
Submission received: 14 November 2023 / Revised: 8 December 2023 / Accepted: 10 December 2023 / Published: 18 December 2023

Abstract

:
In recent years, there has been a significant rise in the popularity of plant-based products due to various reasons, such as ethical concerns, environmental sustainability, and health benefits. Sensory analysis is a powerful tool for evaluating the human appreciation of food and drink products. To link the sensory evaluation to the chemical and textural compositions, further quantitative analyses are required. Unfortunately, due to the destructive nature of sensory analysis techniques, quantitative evaluation can only be performed on samples that are different from those ingested. The quantitative knowledge of the analytical parameters of the exact sample ingested would be far more informative. Coupling non-destructive techniques, such as near-infrared (NIR) and hyperspectral imaging (HSI) spectroscopy, to sensory evaluation presents several advantages. The intact sample can be analyzed before ingestion, providing in a short amount of time matrices of quantitative data of several parameters at once. In this review, NIR and imaging-based techniques coupled with chemometrics based on artificial intelligence and machine learning for sensory evaluation are documented. To date, no review article covering the application of these non-destructive techniques to sensory analysis following a reproducible protocol has been published. This paper provides an objective and comprehensive overview of the current applications of spectroscopic and sensory analyses based on the state-of-the-art literature from 2000 to 2023.

1. Introduction

In recent years, there has been a significant rise in the popularity of plant-based products. Many consumers base their dietary choices on the pursuit of health benefits, out of ethical concerns (e.g., concern for animal welfare), or on environmental sustainability (as a way to reduce their environmental footprint coming from intensive animal farming) [1,2]. Other drivers include scientists’ endorsement, media attention, and popular documentaries [3]. Regardless of the reasons behind this, it is evident that more consumers than ever are seeking to incorporate more plant-based foods into their diets [4]. The growth of interest in plant-based diets is reflected in the plant-based food market having increased29% in the U.S. between 2017 and 2019 [5]. Moreover, the sales of plant-based foods across European countries have grown by 21% since 2020, having reached a record EUR 5.8 billion in 2022 [6]. The interest in plant-based products is evident; however, not all plant-based products are equal. A healthful plant-based diet includes high-quality foods: whole foods like grains, fruits, vegetables, legumes, nuts, and seeds. It has been reported how health-promoting effects could be improved or worsened by the plant-based diet’s quality [7]. Therefore, it is important to consider the quality of the specific components of plant-based diets, as not all plant-source foods have the same beneficial health effects [4]. Generally, foods represent very complex and diverse mixtures, which pose enormous analytical challenges for an encompassing analysis. At present, the most common high-throughput analytical techniques that are applied for food quality assessment are high-performance liquid chromatography (HPLC) and gas chromatography (GC), especially coupled with sensitive mass spectrometry (MS) detectors [8]. The principles of classical techniques have been explained in other publications [9]. Despite being powerful analytical tools, these techniques have some main limitations. They are destructive, time-consuming, and laborious [10]. Moreover, they usually require complex sample preparation protocols, which include several pre-processing steps, e.g., the extraction, dilution, concentration, and collection of volatiles, which are prone to error and involve harmful chemicals that could cause negative environmental impacts [11]. Traditionally, these conventional techniques are used to measure one specific compound or a pool of well-defined compounds present in a given food or beverage [12]. Such an approach ignores the complexity of food products and the possible interactions between the different attributes that constitute its “quality”. Indeed, the problem with the quality analysis is linked to the definition of “quality”. Food quality has been defined as “a complex and multidimensional concept which is influenced by a wide range of situational and contextual factors”. The influencing factors include safety, origin, nutrition, sensorial properties, authenticity, and convenience [13]. For the European Commission, food quality is a complex, multidimensional concept that includes nine items related to nutritive, sensory, or ethical aspects [14]. Therefore, the term “quality”, beyond its relationship with the fruits’ or vegetables’ inherent attributes, such as sugar content, color, or firmness, must be viewed in terms of consumers’ appreciation [15].Consumers’ preferences vary widely among countries [16,17] or even within regions of the same country [18]. In addition to geographical differences, several factors influence consumers’ preferences, such as age, gender, socioeconomic level, and educational level. Moreover, these preferences have changed over time after the pandemic era [19]. Another important factor is consumers’ personal beliefs since often consumers base their decisions on their personal perception of what “quality” means. It was found that the term “quality” often has a positive connotation of high value, class, or degree of excellence that can differ from “true” or measurable quality [20]. Thus, food quality is constituted of multiple attributes or characteristics, some of which are not well defined or can only be measured using empirical or destructive methods (e.g., sugar content with a refractometer), while others are highly subjective (e.g., taste) [21]. If the value of conventional analytical techniques is unquestionable for a product’s chemical and physical characterization, the outcomes of these techniques must be correlated with sensory analysis. The knowledge of the perceived sensory characteristics of a product is a piece of useful information for the improvement of products or for novel product development [22]. The recent technological improvements allow researchers to perform multi-parametric non-targeted analysis. The ability to retrieve several chemical–physical and sensorial parameters at once makes novel techniques valuable tools for food quality evaluation. Advanced spectroscopic techniques coupled with machine learning have been largely applied for the quality analysis and authentication of a wide range of food products [23]. NIR spectroscopy and machine vision systems, such as hyperspectral imaging (HSI), are among the most successful technologies applied for the quality evaluation and safety inspection of several commodities [24]. These techniques are able to provide rapid, non-destructive, cost-effective, and environmentally friendly results [25]. The increase in the use of these techniques is inevitably linked to the increased ability of computational techniques. The application of chemometric tools based on artificial intelligence (AI) allows for the extraction of several types of information from very large spectroscopic datasets. These spectroscopic techniques have been applied to the combined determination of food composition, textural features, and food preferences, presented as promising tools to model food–human interactions [26]. Several reviews addressing the prediction of quality-related properties have been published in recent years, focusing on one specific beverage or food [25,27,28] or on a collection of fresh [26,29,30] or processed [31,32,33] commodities. Some reviews focused only on quality and safety [34,35,36,37]; others included sensory analysis but only of specific foods [38,39,40]. One review in 2019 focused on the relationship between the measured properties and the perceived ones [41], without providing information concerning the methodology or approach followed for the article selection. This review provides an overview of studies involving the spectroscopic techniques and chemometric methods that are largely applied for food sensory and quality evaluation. The present review is based on scientific articles written in English and published in peer-reviewed journals from 2000 to 20023. Two well-known multidisciplinary databases of peer-reviewed literature were searched, and the full procedure followed is reported in detail. Additionally, we discuss the current challenges and future developments of these techniques in food sensory analysis.

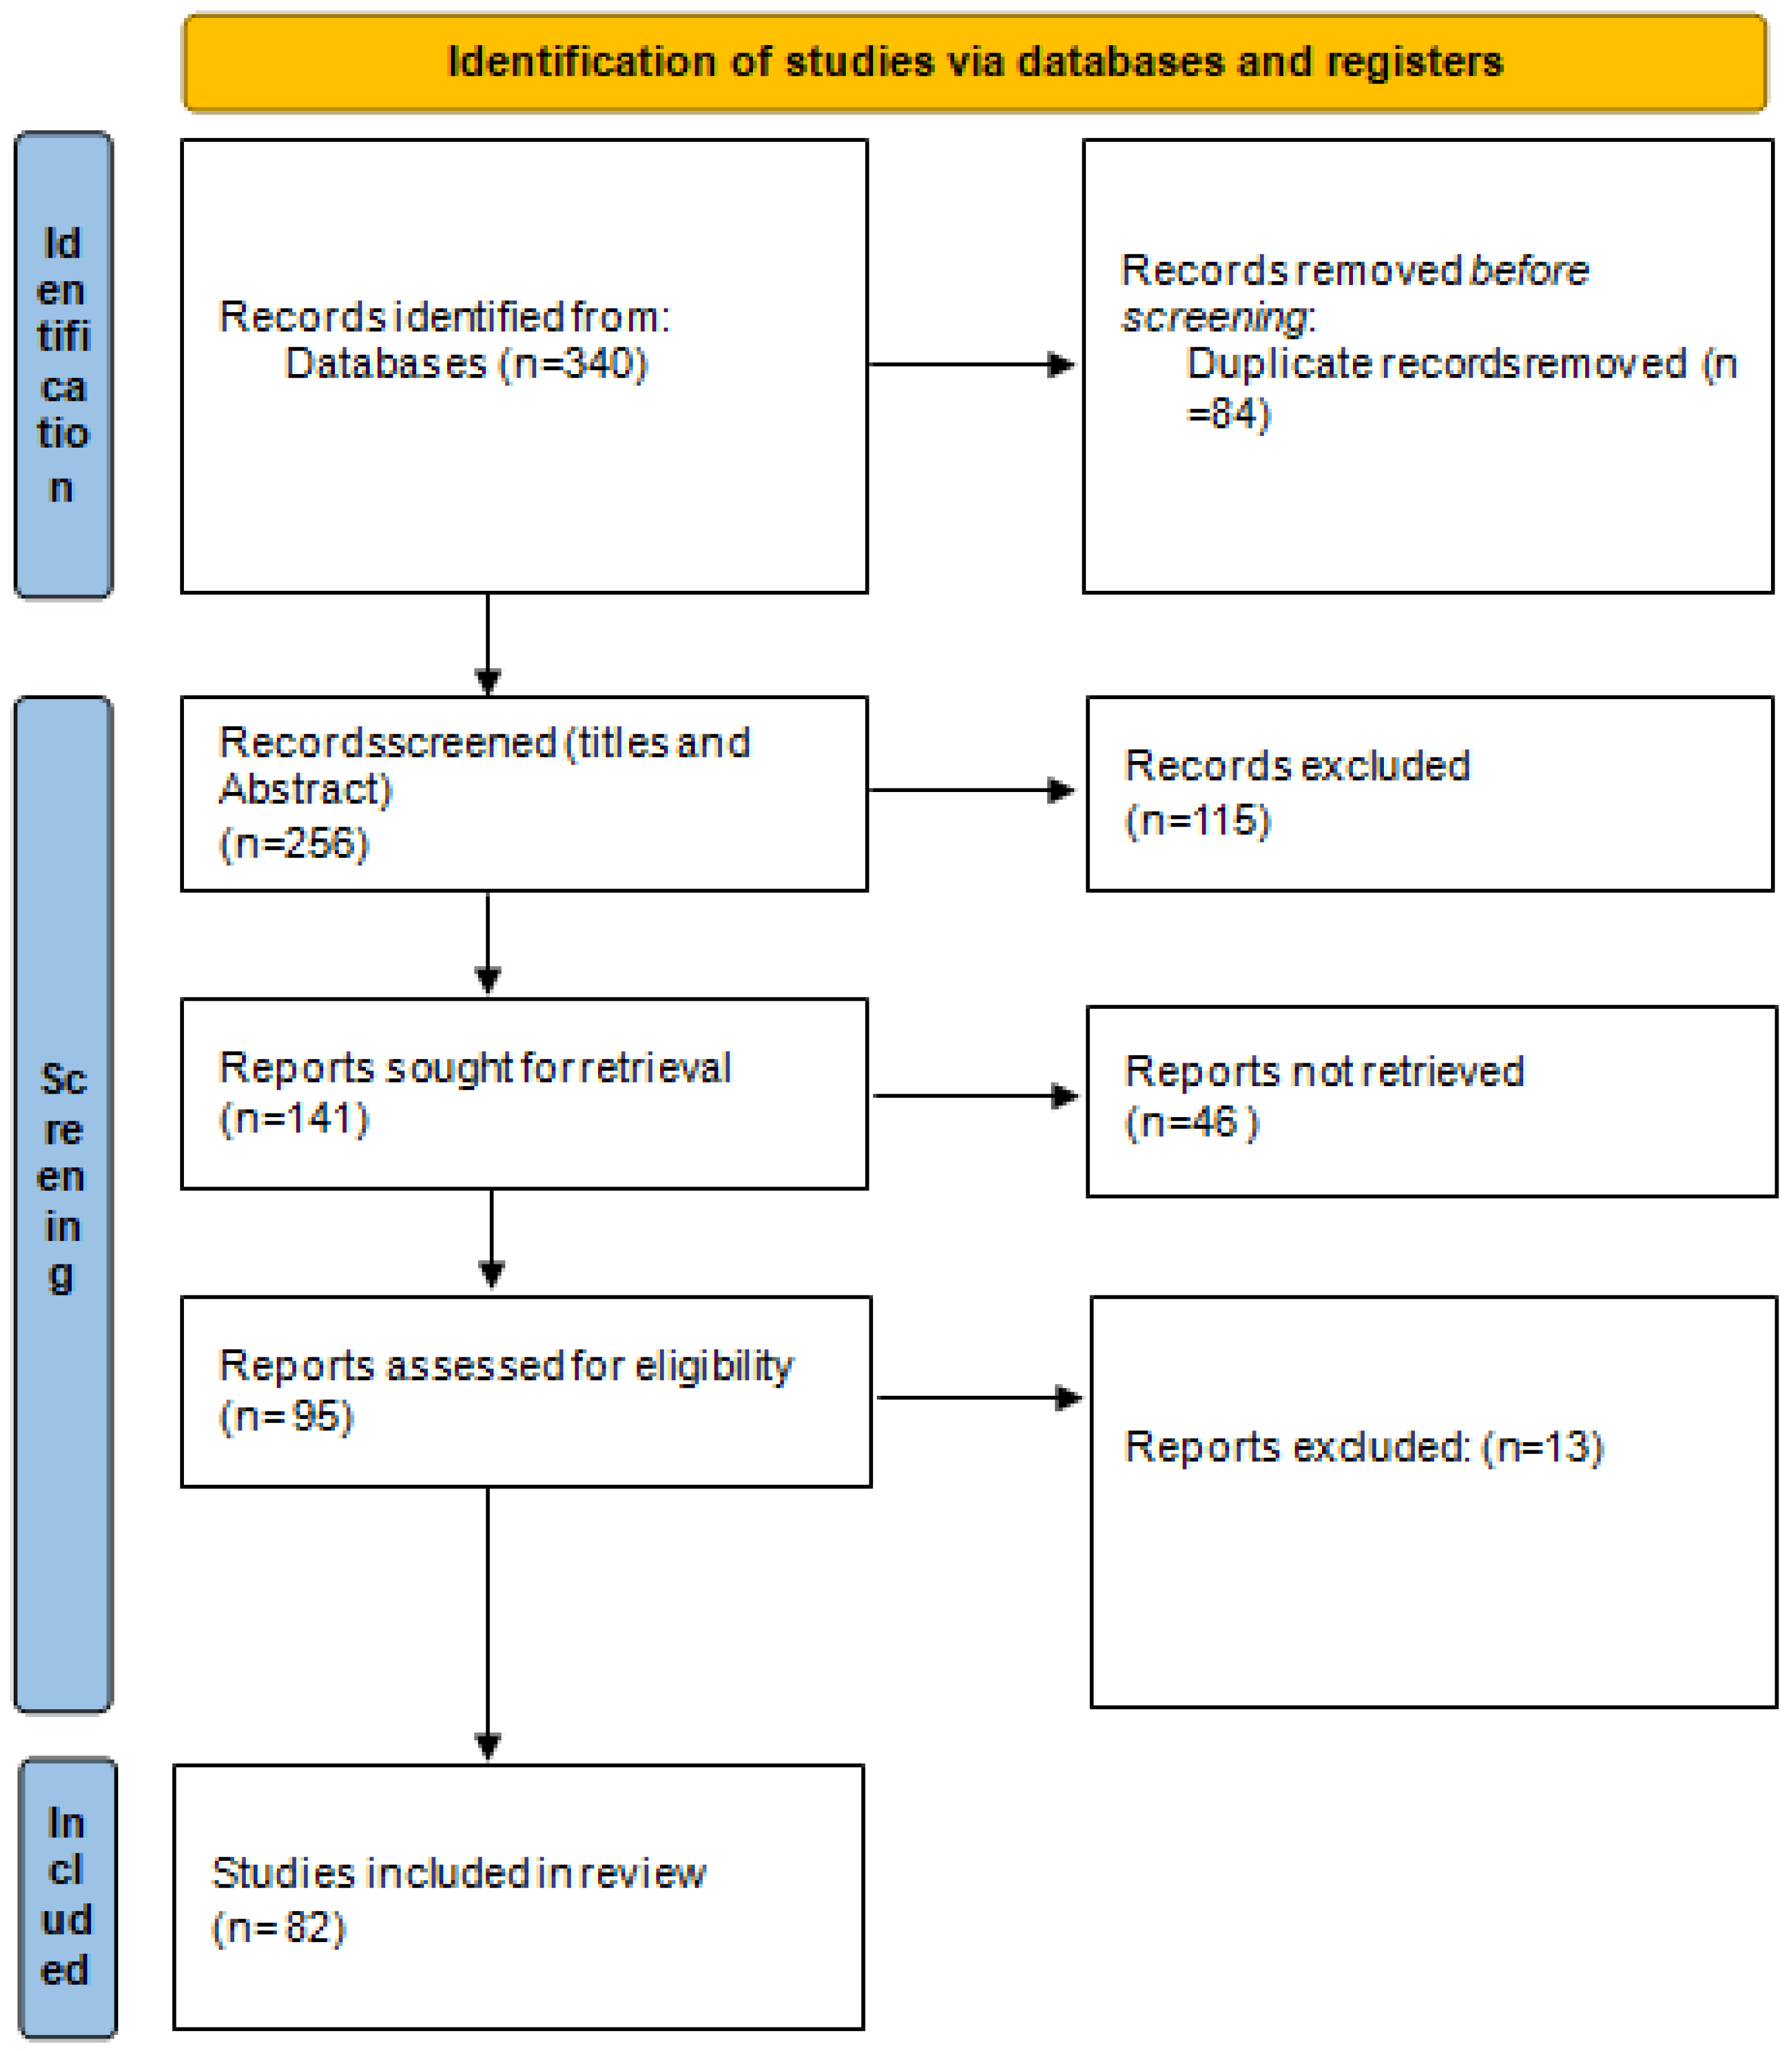
2. Methods: Review Protocol

The screening of the literature was performed following a procedure similar to the PRISMA one (preferred reporting items for systematic reviews and meta-analyses) to avoid subjective bias [42]. The SCOPUS and Web of Science (WoS) databases were searched for peer-reviewed studies up to October 2023. Two libraries of the R software were used in the article selection procedure: first, the “litsearchr” library [43] for keyword selection and, afterward, the “revtools” package [44] for title and abstract screening. To ensure inter-rater reliability, the reviewers conducted the literature search and selection process independently. A naïve search, the simplest method among the pattern-searching algorithms, was used to search for all the terms of the Boolean string in the chosen library databases. The naïve search retrieved 168 articles from WoS and 159 articles from Scopus. After the removal of duplicates using the litsearchr package, 250 articles were retained. In this article, a search for other potential keywords was performed using the rapid automatic keyword extraction algorithm. We tested several frequencies for the repetition of terms in the text and found that retaining 235 terms that appear at least four times in the text was the best option since they did not retain too many generic terms in the list. Then, we built a co-occurrence network that allowed the individuation of possible keywords among the terms in the list based on the quantity of their co-occurrence in the title/abstract/keywords of the selected articles. We plotted the node strengths in decreasing order (so that the most important terms were at the top) and found the cutoff value before which the terms explained 80% of the total importance in the network. The list of potential new keywords, 130 terms above our cutoff, was then screened manually following the PICO framework. The final Boolean search string employed is reported below.
((sensorial OR sensory) AND (“multispectr* imag*” OR “hyperspectr* imag*” OR hsi OR nir* OR near-infrar* OR “Near* Infrare*”) AND (analys* OR test* OR attribute* OR qualit*) AND (food* OR drink* OR beverage*)).
This search retrieved 173 articles from WoS and 167 from Scopus, which, after duplicate removal, were reduced to 256 articles in total. The revtools library was then used for the screening of titles and the abstracts. The authors performed the screening independently in light of the main reasons for exclusion that were stated prior to the search process. The inclusion and exclusion reasons were the following: only articles or reviews were considered, no books or conference proceedings; no industrial applications; no animal products; no classification based on geographical origins, varieties, or adulteration; and only published in the English language. In the case of a different opinion, the inclusion or exclusion of an article/review was discussed until agreement among the authors. After title and abstract selection, 141 articles were retained. A total of 82 articles were finally selected based on the eligible criteria previously stated. The flow diagram of the studies retrieved for this review is reported in Figure 1.

3. Near-Infrared (NIR) Spectroscopy

The IR region is conventionally divided into three sub-regions: starting from the visible, there are the near-infrared, which is “near” to the visible region (NIR, 12,820–4000 cm−1); the mid-infrared (MIR, 4000–400 cm−1); and the far-infrared (FIR, 400–33 cm−1) [45]. The basic components of a NIR spectrometer are: a light source, beam-splitter system, sample container, detector for intensity detection and the electrical conversion of light, and a data processing system for spectral data [46]. In food analysis, a halogen (tungsten) light source is usually employed for Vis-NIR systems, due to its wide-emitting spectral range [27]. Different optical geometries are available for NIR spectroscopy; the main difference is the placement of the detectors and the sample holder for different spectral modes of acquisition. The predominant spectra modes of the acquisition include diffuse reflectance, transmittance, or interactance [47]. NIR spectroscopy is a common technique for food detection, which provides information about the overtones and combinations of the stretching and bending modes involving chemical bonds, such as C-H, N-H, S-H, and O-H, commonly found in food and beverages [9]. Information about the chemical components is thus contained in a NIR spectrum and can be used to extract both qualitative and quantitative information about the chemical and physical properties of the product [21]. Samples with highly different aggregation states can be analyzed by NIR spectroscopy, from intact solids to gel-like solids, pasty, and fluid or liquid samples [47]. NIR spectroscopy is easy to use, fast, cheap, and non-destructive, since it requires minimal or no sample preparation. Its positive features have promoted its application for different purposes, from characterization and composition to the quality and safety evaluation of several food and beverage commodities. However, NIR measurements require a small area of the samples; this is not an issue with liquid samples, but for solid ones, this technique is inadequate for the evaluation of the spatial features of the sample. NIR spectral measurements are dependent on the specific setting or configuration of the lighting source and detection probe. Intact solid samples, often measured in diffuse reflectance, are challenging since measurements provide information on the light both reflected from and transmitted through the sample [21]. NIR spectroscopy shares the problems linked to the light penetration of solid samples with the HSI technique and are explained in detail in the following section. Powder samples naturally include different particle sizes. In NIR spectroscopy, deviation from the linear relationship usually assumed between the absorbance and concentration is found for samples with different particle sizes (e.g., ground coffee) due to the effects of remission and transmission through the sample. Indeed, particles with different sizes produce various light scattering effects, directly affecting the spectral information and model performance [48]. Therefore, the aggregation state of the sample has a major influence in the NIR analysis. Despite the challenges posed by some types of samples, NIR spectroscopy dominates the applications of vibrational spectroscopy in the evaluation of most liquid products, e.g., tea and coffee quality [25], and is widely used in food analysis for quality, safety (e.g., detection of contaminants), and origin identification.

4. Hyperspectral Imaging Spectroscopy

4.1. Imaging-Based Techniques

The main advantage of HSI over NIR is its ability to provide spectral information over the whole sample or, at least, over a large area of the sample, instead of focusing only on selected small areas [49]. HSI was initially applied only to remote sensing, but soon its ability to provide both spatial and spectral data spread its application to various fields, including several food and beverage commodities [26]. The HSI technique is an integration of imaging techniques and spectroscopic ones. As in the case of conventional imaging devices, hundreds of images are recorded at very close, almost continuous wavelengths. By selecting a single pixel of each image, it is possible to see the spectral information of that specific point [50]. Thus, HIS can be applied for the quantitative prediction of the inherent chemical and physical properties of samples as well as their spatial distribution simultaneously [25,36]. A hyperspectral image is a three-dimensional dataset, with two dimensions (x, y) representing spatial images and the third dimension (wavelength, λ) representing spectral information. In the HSI dataset (called hypercube, data cube, spectral cube, data volume, or spectral volume [36]) for each pixel, with specific x and y coordinates, the third dimension contains a unique spectrum [9]. This is highly informative because pixels with identical spectra have the same chemical composition [51]. The 3D hyperspectral data cube contains a sequence of consecutive sub-images at various wavelengths [52]. HSI is often conducted in the VIS/NIR region (400–2500 nm) since numerous chemical bonds in food samples absorb light in that range (900–2500 nm) [9]. HSI in the VIS/NIR region has been widely applied to quantify contaminants, detect defects, and analyze quality attributes in various food products [25,36]. It is possible to utilize various types of light sources with an HSI system (halogen lamps, light-emitting diodes, and lasers), although halogen lamps are the most popular for food analysis. The light interacts with the sample before entering the camera through a series of lenses that contain a device for dispersing light. Finally, a computer performs data acquisition and processing [53]. For detailed information about HSI components, please consult the work of Ma et al. [54]. HSI images can be acquired using different approaches, such as snapshots, point-to-point spatial patterns (the point-scan or whiskbroom method), line-by-line spatial scan patterns (the line-scan or push broom method),and wavelength tuning with filters (area scan or staring array imaging system) [55]. The in-line scanning (push broom) mode and the filter-based imaging mode (area scan imaging) systems are better suited for the quality analysis of food and agricultural materials [56]. In the push broom set-up, a linear scan of the sample surface is performed by time either moving the sample or using mirrors. This is particularly useful for quality checks in industrial applications; when samples are placed on moving belts in the filter-based mode, the complete spatial information is acquired each time. The scanning of samples consists in the acquisition of a two-dimensional image of a single waveband for the whole sample area in each step. The positions of both samples and the camera are fixed, and the wavelength selection is performed by electronically tunable optical filters [57]. The most common acquisition method is in-line scanning, which is especially applied for real-time and online applications. Filter-based HSI systems require more complex calibrations and are not easy to implement for online applications [29]. Spectral image data can be obtained in different spectral modes. For food and beverage quality analysis, the spectral modes used are interactance, diffuse reflectance, or transmittance. Transmittance, which requires high-resolution detectors, is usually employed when samples are homogeneous solids or transparent solutions. Transmittance is commonly used to monitor the internal quality changes in food products, since the light passes through samples before reaching the detector and, therefore, carries information on the internal composition. However, the product thickness must be below a certain value to ensure the possibility of imaging [58]. Diffuse reflectance and interactance are by far the preferred spectral modes used for the HSI analysis of food products. The most commonly used approach for the analysis of food quality and safety is the use of the push broom method in the reflectance mode [25,57].

4.2. Specific Problems

Despite the potential of the HSI technique, there are several factors that must be considered when collecting food spectral images, since they can influence the final outcome. Some of these factors are linked to the spectral mode employed, sample inhomogeneity (e.g., thickness of the powder pressing [59]), specular reflections caused by the smooth surface of certain foods [60], and the selected range of bands or wavelengths [61]. As explained previously for the NIR analysis, while beverages are homogeneous samples, food products are very complex ones. Handling real food products means dealing with samples that show very high variations in their surface (e.g., roughness, asymmetry, surface inhomogeneity, and spherical shape), which introduce random variations in the acquired dataset. The incident light could enter the sample, be reflected, or both, depending on the nature of the sample surface. The use of flat-surfaced samples for imaging is preferable since it makes the sample’s surface parallel to the imaging plane, e.g., powder samples are pressed into tablets with a smooth surface [62]. However, in several food product samples, e.g., intact fruits, surfaces present irregularities by varying in color and surface conditions/roughness, which creates incident light to scatter. Although the depth of penetration of the incident light is usually negligible [61], some absorption effects are inevitable. Therefore, the light that reaches the detector carries information about the sample’s composition at different locations but also different depths within the product [63]. However, it is not simple to determine the penetration depth, since it varies depending on the condition of the sample surface and the wavelength range [64]. While the scatter effect is due to physical properties (e.g., cellular structure, particle size, and density), the absorption effect is due to the chemical composition (e.g., sugars, proteins, and acids). Therefore, it is important to consider the sample surface variations and to apply adequate treatments during the image-processing steps, as is explained later. Another source of variation arises from products with a spherical or curved surface (e.g., apples). The curved surface causes a change in the distance from the detector to the sample surface, resulting in a discrepancy in the optical path length [65]. This problem can be solved during the acquisition step by rotating the sample or acquiring a panoramic image [66] or can be corrected after the acquisition by choosing adequate spectral pretreatments [61]. The other two common causes of variation in the dataset originate from specular reflection and high temperature. Specular reflection produces glare spots in the image. These spots alter the intensities of the pixels in each image band and consequently change the spectral profile. This produces artifacts that negatively affect the feature extraction step and, hence, the classification model. These spots can be avoided by modifying the sampling conditions, i.e., the angle of incidence of the radiation; otherwise, glare pixels need to be detected and removed before the feature extraction and classification steps [60,67]. With the extension of irradiation time with halogen lamps, the temperature increases the heating of the sample. This heating effect is evident in temperature-sensitive foods (e.g., honey) since it modifies their physical state, but also affects the absorption of light of any sample. If it is not possible to simply reduce the sampling time, it is necessary to apply a temperature interference correction method [61]. Working with hyperspectral imaging datasets is already complex since it requires handling a large number of images in both the spatial and spectral dimensions at the same time. Moreover, due to the afore-mentioned intrinsic complexity of food products, it is evident that one single sample spectrum cannot be considered representative of a product in a particular condition [62]. To increase the sample representativeness, it is necessary to acquire hyperspectral images of a large number of sample replicates under that particular condition [63]. If the number of samples is small, even DL algorithms cannot perform accurate qualitative and quantitative analyses of the samples. The use of large amounts of high-quality data is an effective way of improving the quality of the final model. Even though the sample quantity is a critical point, there is no specific or suggested number of samples. Researchers usually rely on rules of thumb rather than a specific simple formula. The preference for a heuristic approach is understandable since the sample size should be considered an optimization problem. The prediction ability of the model becomes robust as the number of data increases. In most cases, thousands of samples are required for DL models [68].The requirement of a large number of samples adds some drawbacks. Numerous samples require a long image acquisition time and also drastically increase the amount of data. These data require storage space and, furthermore, increase the difficulties in the already complex steps of image processing and analysis. HSI comprises a set of numerous monochromatic images corresponding to consecutive and almost continuous wavelengths. This 3D dataset normally contains redundant information or may exhibit a high degree of correlation. Therefore, the HSI dataset is often used to select the most efficient wavelengths to develop a multispectral computer vision system for food quality real-time inspection [50]. Many studies have applied statistical techniques to reduce the hyperspectral images to multispectral ones. The reduction of the large HSI dataset after the selection of fewer optimized monochromatic images to a small set of wavelengths is often a chosen approach [63]. Multispectral imaging (MSI) has been also used for food analysis on its own. Spectral imaging techniques can be classified as hyperspectral or multispectral. The difference is in the number of wavelength bands recorded, normally several hundred contiguous bands for HSI with a narrow bandwidth (5 and 10 nm) [69] and generally less than 20 [34], discrete, and narrow wavebands for multispectral imaging [36]. Multispectral imaging systems have been developed using a small number of narrow wavelengths to detect the features of interest. These wavelengths may range from visible to NIR regions [34].

5. Chemometrics

5.1. Hyperspectral Data

HSI data analysis produces two types of models, classification or regression models, depending on the aim of the research. The classification models attribute samples to discrete finite known or unknown groups, e.g., samples are divided into different classes based on a consumer’s rating. Instead, the prediction creates a regression model between the input data and target properties in a continuous range, e.g., sugar content prediction in fruit. In hyperspectral data analysis, before the application of any modeling method, some image processing steps are essential. Image processing involves the application of pre-processing tools, wavelength selection, feature extraction, and segmentation [50]. The application of pretreatment techniques reduces the undesirable variation, noise, and redundancy that are naturally introduced during hyperspectral data acquisition, which significantly affects the extraction of useful information [50,70]. In the field of hyperspectral imaging, the most common practice is the adaptation of the well-known pre-processing techniques of classical spectroscopy [71]. This is explained in detail in the following paragraph. HSI requires specific additional data processing steps due to its inherent complexity. HSI spectra have major problems with high collinearity and data redundancy. Hyperspectral images contain hundreds of continuous spectral bands (hundreds of spectral bands of relatively narrow bandwidths). In such a dataset, it is easy to face multicollinearity problems. If two independent variables in a model are highly correlated, then one of them can be predicted using the other. This correlation results in the weakening of the accuracy of the model, making the statistical inferences less reliable. The removal of wavelengths carrying redundant information not only contributes to the elimination of low signal-to-noise ratio bands, but also extracts the most representative wavelengths. This selection reduces the spectral dimension of the dataset decreasing the computational burden [25]. Various methods involving wavelength selection and feature extraction have been used to reduce the dimensionality of the hyperspectral images [50]. Data dimensionality reduction methods can be mainly divided into two categories: feature extraction and band selection. The main difference is that feature selection keeps a subset of the original features, while feature extraction algorithms transform the data into a new feature space. A detailed explanation of these methods can be found in the literature [72]. It is very important for HSI analysis to perform a segmentation of the image, which allows for background removal and the selection of the regions of interest (ROI). In the images acquired with HSI, the sample does not cover all the image area, and the parts of the image that do not include the sample must be eliminated. The elimination of these areas may seem a logical and simple task. Nevertheless, this selection is not straightforward [71]. The ROI selection could be performed by manual selection or by applying image segmentation algorithms. Image segmentation is often preferred in food analysis since manual segmentation is very time-consuming and prone to intra- and inter-observer variability [73]. The simplest image segmentation method is threshold segmentation; other types include region-based segmentation, edge segmentation, watershed segmentation, clustering-based segmentation, and deep learning [61]. Usually, to simplify the modeling procedure, a mean spectrum of all the pixels within the same ROI is calculated. However, ROI selection should be performed with great care. If the ROI chosen is too small, it may lead to the exclusion of pixels carrying important information about the food sample. Conversely, a larger ROI may cause a loss of specific information due to an average of too many pixels. Another issue may arise from dead pixels and spikes. Dead pixels are usually caused by anomalies in the detectors and are problematic since their presence can distort the final prediction models. It is also important to identify and handle spiked points (spikes), which appear as a sudden and sharp rise followed by a sharp decline in the spectrum. Spikes are anomalies linked to detectors or electronic circuit problems or arise from environmental conditions [71]. Among the several statistical techniques that are available for hyperspectral images, we focused only on the processing techniques that are usually applied for food and drink commodities’ quality analysis. General multivariate image analysis for HSI has been previously reviewed [74].

5.2. Multivariate Data Analysis

Large multivariate datasets are common in food research, especially from non-destructive technologies [75]. Numerous multivariate data analysis methods are available in the literature; the selection of the optimal method depends on the dataset and objective of the investigation. As with any analytical measurement, the experimental design, sample selection, and data collection steps must be carefully planned as they are of critical importance and could influence the analysis outcome [76]. For a multivariate data analysis, after data acquisition, several steps are required prior to the obtainment of the outcome. The main steps include the application of pretreatments to remove noise, feature extraction to eliminate non-informative or redundant information, model creation, and model validation.

5.2.1. Step 1: Pre-Processing

Data pre-processing is a fundamental step that removes undesired, irrelevant, and random or systematic variations in the dataset occurring during data acquisition. This type of noise could be linked to the sampling procedure, to the inhomogeneity of the biological samples, or simply due to the instrumental artifacts [77]. The efficacy of a pretreatment depends on several factors, such as the characteristics of the experimental data and the purpose of the analysis. The selection of the appropriate pre-processing method is not straightforward. Several pre-processing methods can be found in the literature, but there are no unequivocal guidelines for the selection of the most appropriate pre-processing method. It is always advisable to check the literature for pre-processing methods that have already been applied to similar experiments [57]. Since the primary objective of spectral pre-processing is to remove the effect of undesirable phenomena on the spectral data arising from measurements, the identification of the possible causes of noise is useful for selecting the appropriate pre-processing method or the combination of pre-processing methods. For instrumental noise, smoothing could be useful since it can partly remove random noise (e.g., Savitzky–Golay filter). NIR and hyperspectral data mainly suffer from light scattering effects resulting from the lack of homogeneity of the sample, linked to an uneven morphological surface (e.g., surface roughness) or the different sizes of particles. The most popular methods to handle light scattering are standard normal variate (SNV) and multiplicative scatter correction (MSC). The derivatives of spectral data are also used since they are able to reduce the spectral noise and enhance the difference between the spectra. The first and second derivative eliminate the additive baseline and linear baseline, respectively [71,78]. Derivatives increase sensitivity since they amplify small variations in the data, highlighting important spectral features that were partially obscured by noise. However, they also amplify the noise in the data. Therefore, after derivatives, a smoothing filter is usually applied (e.g., Savitzky–Golay filter). A comprehensive explanation of the various available pretreatments (e.g., mean centering and baseline correction) can be found in Siche et al. [34].

5.2.2. Step 2: Multivariate Analysis with ML

After pre-processing, the raw dataset is transformed into a “cleaned” dataset. At this point, dimensionality reduction and the selection of spectral features are usually performed. The feature extraction step is a very important one since it reduces the data to a set of independent variables containing key characteristics linked to the data. This selection will save computational time later when building the models between the data and the investigated parameter [79]. Chemometry is the discipline that uses mathematical and statistical methods to process chemical data and to maximize the extraction of useful information [80]. Machine learning (ML) is a branch of artificial intelligence (AI) often used as a chemometric tool. ML techniques are capable of removing irrelevant information, extracting feature variables and building calibration models with a strong fault tolerance and a high degree of robustness [26]. ML encompasses different scalable and heuristic algorithms. These algorithms learn rules from the training data and identify patterns in a dataset to classify or predict specific parameters without being explicitly programed [81]. Repeated iterations are performed, resulting in a model that progressively improves its performance [30]. The outstanding performances of non-destructive techniques in combination with advanced ML algorithms have made this combination widely applied in food analysis [75]. A large variety of chemometric-based feature selection algorithms are available; please consult the work of Lin Y. et al. [75] for a comprehensive list. The next step is the actual creation of a chemometric model that links the property of interest and the spectral data. The ML methods to be applied in this step depend on the scope of the investigation. The choice mainly depends on the quantitative or qualitative nature of the analysis. ML algorithms can be divided into unsupervised or supervised learning. The main difference between these two types is the labeling of the training data, which are the data used to build the model. Supervised machine learning is used for pattern recognition or regression and relies on labeled input and output training data, whereas unsupervised learning processes use unlabeled or raw data. If the information on the studied food attributes is missing, only an unsupervised classification can be performed. Since no information is available concerning the class label of the data or even the number of classes, the algorithm determines a mathematical boundary among the classes. In this approach, the unlabeled samples are then classified into different groups based on some measure of mathematical similarity. Therefore, in each cluster, there are samples similar to each other but mathematically different from samples in other clusters [82]. For the unsupervised qualitative analysis of food and drinks, a principal component analysis (PCA) is usually the first choice, as well as for an exploratory analysis of the data [76,83]. PCA can be used as a dimensionality reduction technique as it discovers independent latent variables by transforming the original variables linearly and removing the correlation between them [63]. This linear feature extraction method is suboptimal if the datasets investigated have a non-linear structure, which is often the case for datasets obtained by spectrometric techniques [75]. In addition to PCA, other types of clustering algorithms can be used for unsupervised classification, including hierarchical cluster analysis (HCA) and K-means clustering [25]. Supervised qualitative analysis differs from the unsupervised one since it has available information concerning the classes. The number of predefined classes is based on the measured dependent variable values that were previously measured. The model then classifies the membership of any novel sample to one of the classes. Different classification algorithms can be used; the most popular ML tools used in food and beverage analysis are linear discriminant analysis (LDA), partial least squares-discriminant analysis (PLS-DA), support vector machines (SVMs), K-nearest neighbor (KNN), and artificial neural networks (ANNs) [25,57]. PLS and ANNs are the most used in food analysis and are explained later in this paragraph. A complete general description of algorithms for classification purposes can be found elsewhere [84]. In quantitative analysis, the regression models correlate the spectral data and the quantity of a compound or a property of a sample (e.g., sugar concentration or hardness in berries). The analysis estimates the effect of the explanatory variables on the dependent one to identify which information captured by the independent variables is relevant to predicting the dependent one. The regression model allows the prediction of the dependent variable of interest from the independent ones. Therefore, this supervised modeling requires information on both the independent and dependent variables. The property or quantity data are obtained by previous measures on the samples using reference standard laboratory methods [57]. Regression learners are used to predict specific attributes or parameters, such as sensory descriptors in food and beverages. This type of ML may be classified as linear regression, regression trees, support vector machines (SVMs), Gaussian process regression, ensembles of trees, and ANNs [30]. For a quantitative analysis of fruits and vegetables, the most commonly used ML algorithms are PLS and ANNs [63]. A main difference among the regression models for quantitative analysis is the linear or non-linear nature of the relationship between the predicted variable and the independent ones. For predictive purposes, PLS is often the most appropriate method, if the relationship between the predicted variable and the independent ones is linear [57]. PLS, as with PCA, is used to convert a set of highly correlated variables into a smaller set of independent latent variables by projecting the independent and the predicted variables into a new latent space, where the covariance between these latent variables is maximized. PLS regression is particularly useful when the number of independent variables is higher than the dependent ones, since it allows to cope with multicollinearity among the predictors. PLS is also employed as a dimensionality reduction technique [63]. PLS-DA is a categorical version of PLS regression, where the variables to be predicted are discrete [85]. To model more complex relationships between the dependent and independent variables, deep learning (DL) algorithms are required. Artificial neural networks (ANNs) are a type of DL algorithm that are frequently used both for classification and quantification purposes in food and drink analysis. An ANN is a non-linear data modeling tool capable of modeling complex relationships between inputs and outputs or finding patterns in data when linear computing cannot. The structure of an ANN is modeled after the human brain, with a parallel series of interconnected sets of multiple layers of artificial neurons [86]. In recent years, the widespread application of ANN algorithms to various aspects of food science has been reported, especially concerning its application in food quality analyses [87]. ANNs’ ability to handle a large amount of heterogeneous data and to solve complex non-linear problems makes this algorithm well-suited for hyperspectral image processing and classification [75,88].

5.2.3. Step 3: Model Validation

Finally, the quality of the established models must be evaluated [25]. The performance of different classification models is compared based on their accuracy, sensitivity, and selectivity [89]. For regression, two types of validation procedures are possible, cross-validation (internal) and external validation. Cross-validation is also called “internal” validation since the dataset for the validation is composed of samples randomly selected from the same dataset on which training is performed. Internal validation is useful for the optimization of the model, since it allows selecting among alternative processing methods and to avoid overfitting. However, to assess the applicability or generalizability of the findings to the real world, external validation is required. A prediction model is evaluated for its adaptability and reliability with the help of cross-validation techniques and/or external validation datasets. The prediction model is used to predict the outcome (e.g., quality parameters of fruits and vegetables) of new input data [75], and the model’s prediction performance for these unknown samples is evaluated. The fitness of the model is based on the model’s performance on the test set through the calculation of several statistics. The most used ones include the root-mean-square error of calibration, cross-validation, or prediction (RMSEC, RMSECV, and RMSEP, respectively);the determination coefficients of calibration, cross-validation, or prediction (R2c, R2cv, and R2p, respectively); bias; and the ratio of prediction to deviation (RPD). The optimal model shows the highest R2 and RPD and the lowest RMSE [90]. Only after validation, the model can be applied to NIR spectra or to every pixel of a hyperspectral image recorded from unknown samples to predict the quality of interest [53].

6. Sensory Analysis—An Overview

It is well known that a broad range of factors, comprising chemical and physical properties, contribute to the perceived sensory characteristics of foods and drinks (e.g., smell, taste, and appearance) [41]. A simple quantification of chemical compounds does not account for the perceived taste or smell. There are effects such as the “masking effect” which decreases taste intensity despite the additional taste component [91]. In addition, it is well known that the concentration of volatile compounds should exceed their specific odor activity value (OAV) to be perceived [92]. Moreover, in the taste experience, the different factors are not separate but rather are interconnected. Flavor perception, defined as the amalgamation of taste and aroma, is determined by the presence and interaction of the various chemical compounds present in the food matrix perceived through a combination of different sensory modalities. For example, in wine, the aroma contributes significantly to the taste, while for meat and cheese, the combination of taste and aroma influences the flavor [41]. Time plays a non-negligible role in the overall sensory perception of food and beverages. It was reported that the human senses are keener to perceive changes in a stimulus during the eating or drinking process rather than having a response to its absolute intensity [93,94]. During ingestion, different processes could influence the perception of the overall aroma and taste features (e.g., the release and transport of volatile compounds to the olfactory epithelium [93]), and conventional analyses do not include an over-time investigation of food–human interactions. Although sensory perception relies on the human senses, several factors, such as individual preference, personal eating experience, previous eating experiences, palatability, and physical condition, could influence the overall judgment [95]. These sources of subjectivity are even more problematic since it was found that results could fluctuate among different tasters or even that the same tasters evaluate the same sample differently during different sensory trials [91]. Indeed, in a comparison of instrumental analysis and sensory analysis, it was found that the instrumental results were more sensitive to differences than the sensory analysis. This underlines how strong is the influence of parameters that are not quantifiable with common analytical methodologies on the sensory judgment. Therefore, a quality analysis based on visual appearance, texture, and chemical composition, even a very detailed one, is not sufficient to predict the consumer’s appreciation of a product. A combination of quality parameters determined by conventional analytical techniques together with a sensory analysis is the most suitable approach. In sensory analysis, the choice of tasters is made from a group of either trained experts or untrained consumers. The choice depends on the type of food and specific goals of assessment. Consumers are merely employed when information on hedonic liking, preference, or purchase intentions is required [96]. Sensory evaluation, particularly in complex samples such as foods and drinks, requires the selection of suitable methods and well-trained subjects who recognize the specific features of foods and drinks to avoid subjectivity. Trained panelists determine cores for samples considering their sensory characteristics, such as appearance, aroma, and taste, in accordance with official standard methodology using common sensory terms to describe food [48]. However, the analysis performed by sensory panels of experts, who have been trained in sensory evaluation methodologies, is not immune to error [96].

7. Applications for Plant-Based Products

From the considered studies, it can be observed that the regression methods most widely used to build prediction models are the PLS regression or ANN with different pre-processing methods. We found that several articles only reported the internal validations for their prediction models, and the statistics employed for the model evaluations differed. In general, the values of R2, RMSE (which can be RMSECV or RMSEP), and RPD were provided, sometimes also the bias, SEC (standard error of calibration), and SEP (standard error of prediction) values were included, while, at other times, only some or just one of those statistics alone was provided. Therefore, it is not easy to compare the fitness of the models and understand if they can be effectively applied to novel datasets. As explained in the previous paragraphs, the selection of specific wavelengths or bands in the spectrum is of pivotal importance [97,98]. However, the majority of articles report the selection procedure that is followed, but do not always indicate the actual wavebands used to build the models. The bulk of articles found report on the studies on worldwide, highly consumed foods or drinks, e.g., tea and coffee.

7.1. Coffee

Coffee is a popular beverage consumed throughout the world. This beverage is one of the most studied agricultural commodities in terms of sensory quality. Several studies have been carried out on the application of NIR to predict the sensory attributes of coffee in conjunction with a sensory evaluation performed by a panel of experts [99]. In general, it was possible to build suitable models to predict the sensory attributes of coffee from NIR spectral features [100,101,102] or HSI [103]. Some studies reported the most important wavelengths related to the sensory attributes measured. Generally, sensory attributes, such as the aroma, acidity, mouthfeel, aftertaste, bitterness, cleanliness, astringency, defects, and overall quality, are evaluated, following the roles established by the Specialty Coffee Association of America (SCAA) [104]. Coffee quality depends on the chemical composition of green coffee beans, which in turn is influenced by planting patterns and design, and the roasting process. Concerning the applicability of models to different datasets, a rapid and simultaneous quantification of different classes of molecules in green coffee beans (lipids, proteins, sucrose, phenolic compounds, total chlorogenic acids, and caffeine) was reported using a previously published prediction model. A sensory analysis was then performed to correlate perceived flavor to specific compounds belonging to those classes identified by the HPLC/UV-Vis analysis [105]. In another study, the authors performed a correlation between the composition of green Arabica coffee beans and the sensory quality of coffee brews demonstrating that high cafestol, sucrose/acid, and cafestol/kahweol ratios in the green coffee beans were usually associated with higher quality scores for the coffee brews [104]. HSI is another useful technique used to predict sensory attributes, such as coffee aroma. It was possible to predict volatile compounds using the HSI spectra acquired for single-roasted coffee beans, which were successfully segregated into batches based on the HSI predictions of groups of volatile compounds (pyrazines) and analytically predicted sensory traits (nutty) [103]. NIR has been also applied to classify espresso coffees with different sensory characteristics [106], to distinguish between defective and non-defective roasted coffees [107] and to discriminate between Arabica and Robusta coffees, which strongly influence the perceived aroma [108,109]. Indeed, the authors developed a rapid and simple method to identify pure Arabica coffee and blended coffee by NIR spectroscopy reaching a purity level that varied from 98.71 to 101.53% for pure Arabica coffees and from 77.22 to 83.93% for Arabica concentrations in blended coffees [109]. A discrimination was performed for Robusta coffee grown in different agroforestry systems with a micro-portable NIR and sensory analysis. They used the NIR spectral data to create a PCA and found that some wavelengths responsible for the clusterization of samples were linked to the stretching and bending of groups belonging to sugars, caffeine, sucrose, and chlorogenic acids. These compounds were correlated to attributes of bitterness, flavor, cleanliness, and mainly acidity, body, and overall quality in the sensory analysis [110].

7.2. Tea

Together with coffee, tea is a very popular non-alcoholic drink appreciated for its flavor and also its various health benefits. There are different varieties of tea (black, green, Oolong white, and Pu-erh), but all are derived from the leaves of Camellia sinensis. They are categorized according to the degree of fermentation (unfermented, lightly or semi-fermented, fully fermented and post-fermented). The aromatic differences are determined by the level of oxidation, which determines a different chemical compositions [111]. The influence of fermentation on the quality of tea is linked to the changes in the chemical composition, which influences the taste, aroma, color, and nutritional value. Several authors developed prediction models for various polyphenolic compounds in fermented black tea. Models were built for eight individual catechins in the black tea drying process [112]. Many chemical compounds affect tea flavor, including catechins, which can specifically provide important taste profiles during tea’s infusion, especially for bitterness and astringency. In this article, the authors underlined how the strong predictive power of catechins in the black tea drying process was determined by their model, which was a guideline for controlling the sensory quality of black tea. Instead, other authors built models for various theaflavins in the black tea fermentation process and performed a hierarchical cluster analysis combined with a sensory evaluation to group the samples through different fermentation processes [113], showing a clear link between those molecules and sensory perception. Harvest can strongly influence tea quality. Indeed, several chemical compounds of white teas produced from fresh leaves with different maturity levels (mature leaves and shoots, or buds and young leaves) were analyzed, including catechins, alkaloids, amino acids, and flavonol glycosides; also, the sensory characteristics of two categories were also assessed by the panelists. The testers observed a considerable difference between the two maturity levels. Then NIR data used to build the PCA showed a separation between the two maturity levels; thus, the authors underline how NIR spectroscopy is a potential method to discriminate between the sensory characteristics of white teas [114].NIR is a useful method to classify teas based on their sensory characteristics, as shown in the discrimination of premium-grade green tea. This “Special-Grade Green Tea” is difficult to recognize only based on the dry tea’s appearance. PLS modeling allowed for the prediction of the sensory scores of samples with a high prediction accuracy (over 90%). Moreover, the authors showed a potential correlation between specific spectral regions and the presence of polyphenols and alkaloids measured in the samples (total polyphenols, catechins, and flavonol glycosides) through principal components [115].The moisture content of leaves during processing can seriously influence the tea’s sensory quality. The control of water content during the processing of tea can be useful to stabilize the quality and flavor of the beverage. The results obtained demonstrate that the data fusion of a micro-NIR spectrometer and portable colorimeter is feasible to establish a quantitative prediction model of the moisture content in Longjing tea [116].

7.3. Soft Drinks

We did not find many articles that correlated sensory perception with fruit juices. The authors mainly predicted the total soluble solids (TSSs) content, pointing out how the TSSs parameter was related to sensory attributes [117,118]. A hyperspectral microscope was used for the sensory quality analysis of matcha in an attempt to mimic human tasters. This hyperspectral microscope imaging (HMI) system is composed of an HSI spectrometer and an upright microscope. The most informative spectral regions were selected by competitive adaptive reweighted sampling (CARS). ANN models were established based on the spectral information possessed by the most informative regions selected by CARS and the sensory scores from the sensory evaluation. Different sets of spectral variables were used to predict the appearance, infusion color, aroma, taste, and overall quality profiles. HMI technology as a rapid, objective, and accurate tool has the potential for estimating the quality of matcha [48].

7.4. Alcoholic Drinks

VIS-NIR spectroscopy was also used to evaluate wine sensory characteristics. Some authors modeled the relationship between some sensory and palate properties and the Vis-NIR spectra of white wine using PLS. Specifically, the correlation coefficients (Rcal) obtained were higher than 0.70 for estery, lemon, and honey aromas, and less than 0.50 for passion fruit aroma, overall flavor, and sweetness in the cross-validation [119]. In aged wines and spirits, volatile phenolic compounds are responsible for characteristic odor notes. The levels in the aged wine spirits are influenced by the aging system, e.g., the wood and toasting levels of the barrels. The NIR technique was used to predict the volatile phenols content, which are known contributors to the sensory quality of spirit beverages [120]. The same authors analyzed wine spirits aged in stainless-steel or wooden barrels and found that PCAs created with NIR spectra over a range of 540 days were able to efficiently cluster the samples based on the different aging technologies and wood species used [121]. Other authors also reported a classification (LDA) of wine spirits, and brandies by aging according to their phenolic and higher alcohol compositions. Moreover, a PLS allowed the prediction of the same compounds in novel samples [122]. In both articles, the importance of the compounds analyzed for wine and spirit sensory characteristics was stressed, but an actual sensory analysis was not provided.

7.5. Fresh Fruits and Vegetables

Fruits and vegetables have been mainly analyzed with regard to their main components, such as sugar and acids, and for quality defects, like internal browning [123]. Sugar quantification with NIR techniques for fruits is a well-established technique [124]. Several authors applied NIR or VIS-NIR spectroscopic techniques to predict, in addition to sugar, other fundamental fruit and vegetable quality parameters linked to the chemical composition, such as TA, pH, dry matter content, and total phenolic content [125]. HSI was also used to predict some of these parameters for table grapes [126]. Both color and some textural attributes were well predicted from the NIR spectra for boiled potatoes. The most valuable traits from a sensory analysis are useful information for potato breeding programs [127]. Prediction models were developed through a PLS regression relating sensory-based texture descriptors to the dry matter (DM) content of potatoes. Since, using PLS, the NIR spectra were also related to the DM content, the author noted the existence of a relationship between NIR spectra and sensory-perceived texture [128]. A prediction of dry matter using NIR spectra was performed. Dry matter was selected since it includes sugars and other compounds (fibers, minerals, acids, etc.) that contribute to flavor. The models were built for the dry matter analysis of the d’Anjou pear cultivar using fruit samples collected in two consecutive years. Pear samples were pooled into three classes depending on the predicted dry matter content. Two hedonic tests in consecutive years were performed and the samples were judged on a sensory scale for eight sensory attributes (appearance, aroma, firmness, crunchiness, juiciness, sweetness, bitterness, and pear flavor) and overall liking. Consumers significantly favored higher dry matter fruits over lower dry matter fruits in terms of the perceived pleasant traits. Thus, the NIR sorting of pears by dry matter at harvest is a rapid and simple way to select consumers’ favored products [129]. Another essential aspect that contributes to the perceived quality of both fruits and vegetables is the texture [96]. A number of different VIS-NIR prediction models were developed to evaluate the texture properties of fruits. Texture parameters, such as roughness, crunchiness, mealiness in apples, hardness, chewiness, cohesiveness, and firmness of dates, were analyzed [130]. Only one study investigated the application of MSI to predict the color and texture of packaged wild rocket [131]. We found that HSI and MSI were principally employed for the detection of internal defects that affected quality. A major advantage is obviously the spatial information provided regarding color homogeneity and the presence of surface defects or contamination (e.g., mold). In most of the studies involving fresh vegetables and fruits, a sensory analysis was performed in combination with quality parameter detection and Vis-NIR spectra acquisition. In a study on fresh tomatoes, a PLS model built with selected informative wavelengths was able to predict eight sensory attributes. Moreover, high inter-correlations among sensory attributes, metabolites determined by GC-MS analysis, and the selected informative wavelengths were found using PCA. Indeed, this study on showed how 8 out of 19 sensory attributes were well predicted from the Vis-NIR spectra of intact tomatoes using a PLS regression method [132]. Other authors tried to predict the sensory characteristics of fruits and vegetables from spectra obtained by non-destructive methods [133,134,135,136]. For table grapes, both NIR spectroscopy and HSI were able to predict several physicochemical parameters. However, rather than a direct prediction of consumer appreciation or specific sensory parameters, the spectral information was employed to search for a correlation of sensory data to the spectral features associated with chemical compounds [126,137]. To investigate the effects of the ripening stages and parcel types on Cabernet Franc grapes, fifteen different batches were characterized by descriptive sensory analyses, compression measurements, and Vis/NIR spectroscopy. Using Vis/NIR spectroscopy, the researchers were able to discriminate between the ripening and parcel effects using a factorial discriminant analysis (FDA). Moreover, they established a relationship between different Vis/NIR wavelengths and sensory attributes (firmness, elasticity, and touch resistance) [138]. Spectroscopic techniques are considered a rapid tool to discriminate defective from non-defective extra virgin olive oil and to classify it based on the fruitiness level [139]. Furthermore, quality parameters as well as the adulteration of oils have also been monitored spectroscopically [47]. A sensory analysis in conjunction with an MSI analysis was performed to follow the modification of wok-fried vegetables during storage. While repeated sensory analyses showed that the tasters’ appreciation remained stable over time, the authors found differences in some wavebands during storage that were not correlated to the actual compounds, but indicated modification in the overall composition. These findings highlight how the MSI technique can detect alterations in food products, even before a perceived sensory modification [140].

7.6. Cocoa

Multiple substances are known to contribute to cocoa flavor and may be used as biochemical quality parameters to describe cocoa quality. For example, the bitter taste is associated with methylxanthines (theobromine and caffeine), while the acidic note is mainly due to the lactic and acetic acids formed during the fermentation process. Conversely, astringency is caused by phenolic substances. In addition, other quality parameters, like lipid, carbohydrate, protein, and moisture contents, are involved in the definition of cocoa flavor. The applicability of NIR spectroscopy for the quantification of these substances offers a rapid and reliable method to evaluate quality parameters linked to the sensorial perception of cocoa and its derivates, such as chocolate [141]. A recent study showed that is possible to relate the chemical and sensory profiles of chocolate. The correlation is more difficult when the analysis is performed on cocoa beans. Indeed, the cocoa flavor strongly depends on the post-harvest processing (i.e., fermentation and drying) to which the fresh cocoa is subjected prior to being consumed [142].

7.7. Processed Food

Cereals and cocoa are usually used as ingredients in processed foods, such as biscuits and snacks [143,144]. Non-destructive techniques have been adopted to assess the quality, shelf life, and sensory evaluation of several types of processed foods [143]. The shelf lives of traditional biscuits and two (millet and buckwheat) by-product-enriched biscuit formulations were monitored according to several parameters, including both texture and sensory-related (e.g., peroxide value and free fatty acids), by NIR spectroscopy. ANNs were preferred over PLS for the prediction of the optimal storage time, free fatty acid content, and the peroxide value of biscuits, because of their more accurate performances [144]. Other authors, instead, assessed wafer cookies’ storage time with a combination of both destructive (water activity, mechanical properties, and sensory acceptance) and non-destructive techniques (image analysis, NIR spectroscopy, and HSI). PLS models allowed a good determination of the storage time and water activity using NIR spectroscopy and Vis/NIR HSI data. The water activity was an important parameter that discriminated between “good” and “compromised” wafers, in terms of sensory (textural) properties [145]. Two IR regions (MIR and NIR) combined with chemometric analysis were used to develop rapid methods for the determination of glucose, fructose, and sucrose levels in cereal-based snacks, showing a good predictable performance for the PLS regression model [146]. NIR spectroscopy was also applied to determine xanthines and polyphenols, considered as being mainly responsible for the bitter taste of chocolate in eleven types of different biscuits. PLS regressions for each of the compound classes were created with the FT-NIR dataset using HPLC-MS\MS as the reference method. The authors reported that the comparison between the sensory panel test evaluation of the “Bitter Taste Index” (BTI), on a scale from 1 to 12, showed a correlation between the concentration of these compounds and the perceived bitter taste of the biscuits. However, in addition to this finding, no results of the sensory analysis were reported in the article [147]. In an interesting article, the authors evaluated the quality of pre-fried carrots and celeriac during defrosting at +5 °C. For 14 days, both multispectral image analysis and sensory analysis with a trained panel were performed. MSI was able to detect minor changes prior to the sensory panel. Interestingly, the article reported the statistical treatment performed on the sensory data [140]. Various chemical parameters, namely, starch, sugar, protein, dry matter, fat, phytate, and tannin, were determined from the yam flour using NIR spectroscopy. A significant relationship between chemical composition and sensory attributes from a sensory quantitative descriptive analysis (QDA) of yam tubers was found using Pearson’s correlation analysis. The prediction of the sensory attributes from the chemical parameters was performed with linear multiple regressions. All the models predicted coefficients of determination close to 1. Unfortunately, it is not clear if any type of validation was further performed on the dataset [148].
The previous sections discuss the use of the described non-destructive spectroscopic techniques for predicting the quality parameters and sensory attributes of plant-based products. Table 1 summarizes the applications of the same techniques for the classification of foods and beverages.
In Table 2, a summary of the NIR, MSI, and HSI techniques used for prediction purposes is presented.

8. Technical Challenges and Future Perspectives

Although spectroscopy techniques are useful analytical methods to aid our understanding of the aroma and taste of both foods and drinks, these methodologies have not been widely applied to predict sensory parameters but rather have been used as complementary techniques. A large scientific literature is available concerning the application of NIR spectroscopy and HSI techniques to quantify and predict several chemical properties (e.g., sugars and hardness) linked to consumers’ appreciation of a wide range of products. However, a clear gap remains between the applications of these techniques to the prediction of compositional parameters or for quality classification and the prediction of sensory properties in foods. The spectroscopic analysis of sensory parameters poses both theoretical and practical issues. These issues principally arise from the lack of a generalization approach for the established models and the large differences in the number of samples employed in the literature. The interpretation of spectroscopy data, whether in the form of signals or images, is a task that cannot be performed without the assistance of complex chemometric approaches. These approaches involve various steps that are essential for extracting relevant information. An effective handling of the spectroscopic data must be performed by experienced and well-trained personnel and require expensive GPUs and large storage space. The choice of an appropriate algorithm is very important for the robustness of the final model. Nevertheless, different authors propose different algorithms (e.g., different pre-treatments and selected wavelengths) to solve the same problems. The selected wavelengths employed to build models for the same type of sample often differ from study to study. These differences can be attributed to differences in cultivar, the cultivation technologies adopted in the field, or seasonal variation. However, only a few studies explained these wavelengths in terms of product characteristics or tentatively attributed them to specific compounds in an attempt to link the investigated parameters and the underlying chemical composition. An in-depth analysis of the selected wavelength in relation to the features investigated can be very useful for future research. A common procedure or a reference framework that can suggest algorithms for specific applications can favor the use of these spectroscopy techniques by other authors and ease the comparison of the outcomes. However, the influence of instrument setups from different manufacturers and the experimental conditions (e.g., illumination and calibration of the system) is strong. This makes the generalization of unified robust calibration models, which should also be used for extended periods and different situations, quite hard to achieve. Other issues are the number of samples, the model validation procedure, and the lack of statistical analysis for reference sensory methods. The small number of samples in most of the applications reported in the literature is a drawback for the use of this technology in food science [156]. In most of the articles, only a few samples are analyzed (less than 100) and internal cross-validation is the preferred validation method. Without external validation using an independent set of samples, the applicability to real case scenarios is lacking. Moreover, information about statistics related to the sensory method used as a reference to develop and interpret NIR calibration models is often lacking. From the literature published in the last 10 years, the strong development of NIR spectroscopy and HSI applications in the food industry steadily emerges, and an even wider application in the future is possible. An increase in the available scientific evidence of the accuracy of these spectroscopic techniques for sensory analysis would surely promote the application of these techniques to sensory evaluations. This could be easily achieved through increased model robustness and predictive ability, increased sample numbers, and the addition of appropriate statistical treatment to the sensory step.

Author Contributions

Conceptualization, T.B.; investigation, T.B., D.M. and M.F.C.; resources, M.F.C.; data curation, T.B. and D.M.; writing—original draft preparation, T.B. and D.M.; writing—review and editing, T.B., D.M. and M.F.C.; project administration, M.F.C.; funding acquisition, M.F.C. All authors have read and agreed to the published version of the manuscript.

Funding

This research was funded by Italian Ministry of University and Research (MUR): Project AGRIFOOD, ARS01_00640, “POFACS—Conservabilità, qualità sicurezza dei prodotti ortofrutticoli ad alto contenuto di servizio”, PON R&I 2014–2020.

Conflicts of Interest

The authors declare no conflict of interest. The funders had no role in the design of the study; in the collection, analyses, or interpretation of data; in the writing of the manuscript; or in the decision to publish the results.

References

  1. EFSA—Sustainable Healthy Diets. Available online: https://www.efsa.europa.eu/sites/default/files/2021-03/5.5-new-dietary-guidelines.pdf (accessed on 1 September 2023).
  2. Hargreaves, S.M.; Raposo, A.; Saraiva, A.; Zandonadi, R.P. Vegetarian Diet: An Overview through the Perspective of Quality of Life Domains. Int. J. Environ. Res. Public Health 2021, 18, 4067. [Google Scholar] [CrossRef] [PubMed]
  3. European Commission. Horizon the EU Research and Innovation Magazine. Available online: https://ec.europa.eu/research-and-innovation/en/horizon-magazine/plant-based-diets-improve-health-and-environment-says-top-eu-scientific-advisor (accessed on 1 September 2023).
  4. Clem, J.; Barthel, B. A Look at Plant-Based Diets. Mo. Med. 2021, 118, 233–238. [Google Scholar] [PubMed]
  5. The Good Food Institute. U.S. Plant-Based Market Overview: New SPINS Retail Sales Data. Published 27 November 2018. Available online: https://www.gfi.org/marketresearch (accessed on 1 September 2023).
  6. The Good Food Institute. Plant-Based Sales Boast 21% Growth Since 2020. Published 3 April 2023. Available online: https://gfieurope.org/blog/plant-based-sales-in-europe-22-growth/ (accessed on 1 September 2023).
  7. Hemler, E.C.; Hu, F.B. Plant-Based Diets for Cardiovascular Disease Prevention: All Plant Foods Are Not Created Equal. Curr. Atheroscler. Rep. 2019, 21, 18. [Google Scholar] [CrossRef] [PubMed]
  8. Rammanee, K.; Hongpattarakere, T. Effects of tropical citrus essential oils on growth, aflatoxin production, and ultrastructure alterations of Aspergillus flavus and Aspergillus parasiticus. Food Bioprocess Technol. 2011, 4, 1050–1059. [Google Scholar] [CrossRef]
  9. Hussain, N.; Sun, D.W.; Pu, H. Classical and emerging non-destructive technologies for safety and quality evaluation of cereals: A review of recent applications. Trends Food Sci. Technol. 2019, 91, 598–608. [Google Scholar] [CrossRef]
  10. Ren, Q.-S.; Fang, K.; Yang, X.-T.; Han, J.-W. Ensuring the quality of meat in cold chain logistics: A comprehensive review. Trends Food Sci. Technol. 2022, 119, 133–151. [Google Scholar] [CrossRef]
  11. Orecchio, S.; Amorello, D.; Barreca, S. Chapter 7—Analysis of Contaminants in Beverages. Volume17: The Science of Beverages. In Quality Control in the Beverage Industry; Grumezescu, A.M., Holban, A.M., Eds.; Academic Press: Cambridge, MA, USA, 2019; pp. 225–258. [Google Scholar] [CrossRef]
  12. El Masry, G.; Nakauchi, S. Image analysis operations applied to hyperspectral images for non-invasive sensing of food quality a comprehensive review. Biosyst. Eng. 2016, 142, 53–82. [Google Scholar] [CrossRef]
  13. Rodrigues Arruda Pinto, V.; Faria de Abreu Campos, R.; Rocha, F.; Emmendoerfer, M.L.; Teixeira Ribeiro Vidigal, M.C.; Silva Soares da Rocha, S.J.; Della Lucia, S.M.; Fernandes Melo Cabral, L.; Fernandes de Carvalho, A.; Tuler Perrone, Í. Perceived healthiness of foods: A systematic review of qualitative studies. Future Foods 2021, 4, 100056. [Google Scholar] [CrossRef]
  14. European Commission. Definition of Food Quality. Published in 19 February 2021. Available online: https://knowledge4policy.ec.europa.eu/food-fraud-quality/topic/food-quality_en (accessed on 1 September 2023).
  15. Shewfelt, R.L. What is quality? Postharvest Biol. Technol. 1999, 15, 197–200. [Google Scholar] [CrossRef]
  16. Suwannaporn, P.; Linnemann, A. Rice-eating quality among consumers in different rice grain preference countries. J. Sens. Stud. 2008, 23, 1–13. [Google Scholar] [CrossRef]
  17. Bonany, J.; Brugger, C.; Buehler, A.; Carbó, J.; Codarin, S.; Donati, F.; Echeverria, G.; Egger, S.; Guerra, W.; Hilaire, C.; et al. Preference mapping of apple varieties in Europe. Food Qual. Pref. 2014, 32, 317–329. [Google Scholar] [CrossRef]
  18. Cicerale, S.; Liem, G.; Keast, R.S.J. Consumer perception, attitudes, liking and preferences for olive oil. In Products from Olive Tree; Boskou, D., Clodoveo, M.L., Eds.; Intechopen: London, UK, 2016. [Google Scholar] [CrossRef]
  19. Sevim, Y.; Yalcın, T. Changes in the food preferences and purchase behaviors in the new normal: A cross-sectional study. Rev. Esp. Nutr. Hum. Diet. 2022, 26, 167–177. [Google Scholar] [CrossRef]
  20. Romero del Castillo, R.; Sans, S.; Casañas, F.; Soler, S.; Prohens, J.; José Diez, M.; Casals, J. Fine tuning European geographic quality labels, an opportunity for horticulture diversification: A tentative proposal for the Spanish case. Food Control 2021, 129, 108196. [Google Scholar] [CrossRef]
  21. Lu, Y.; Huang, Y.; Lu, R. Innovative Hyperspectral Imaging-Based Techniques for Quality Evaluation of Fruits and Vegetables: A Review. Appl. Sci. 2017, 7, 189. [Google Scholar] [CrossRef]
  22. Liu, Y.; Zhang, J.; Yuan, H.; Song, M.; Zhu, Y.; Cao, W.; Jiang, X.; Ni, J. Non-Destructive Quality-Detection Techniques for Cereal Grains: A Systematic Review. Agronomy 2022, 12, 3187. [Google Scholar] [CrossRef]
  23. Kharbach, M.; Alaoui Mansouri, M.; Taabouz, M.; Yu, H. Current Application of Advancing Spectroscopy Techniques in Food Analysis: Data Handling with Chemometric Approaches. Foods 2023, 12, 2753. [Google Scholar] [CrossRef]
  24. Kang, Z.; Zhao, Y.; Chen, L.; Guo, Y.; Mu, Q.; Wang, S. Advances in Machine Learning and Hyperspectral Imaging in the Food Supply Chain. Food Eng. Rev. 2022, 14, 596–616. [Google Scholar] [CrossRef]
  25. Lin, X.; Sun, D.W. Recent developments in vibrational spectroscopic techniques for tea quality and safety analyses. Trends Food Sci. Technol. 2020, 104, 163–176. [Google Scholar] [CrossRef]
  26. Hassoun, A.; Jagtap, S.; Garcia-Garcia, G.; Trollman, H.; Pateiro, M.; Lorenzo, J.M.; Trif, M.; Vasile Rusu, A.; Muhammad Aadil, R.; Šimat, V.; et al. Food quality 4.0: From traditional approaches to digitalized automated analysis. J. Food Eng. 2023, 337, 111216. [Google Scholar] [CrossRef]
  27. Ma, S.; Li, Y.; Peng, Y. Spectroscopy and computer vision techniques for non invasive analysis of legumes: A review. Comput. Electron. Agric. 2023, 206, 107695. [Google Scholar] [CrossRef]
  28. Onuma, T.; Maruyama, H.; Sakai, N. Enhancement of Saltiness Perception by Monosodium Glutamate Taste and Soy Sauce Odor: A Near-Infrared Spectroscopy Study. Chem. Senses. 2018, 43, 151–167. [Google Scholar] [CrossRef] [PubMed]
  29. Roberts, J.; Power, A.; Chapman, J.; Chandra, S.; Cozzolino, D. A Short Update on the Advantages, Applications and Limitations of Hyperspectral and Chemical Imaging in Food Authentication. Appl. Sci. 2018, 8, 505. [Google Scholar] [CrossRef]
  30. Gonzalez Viejo, C.; Torrico, D.D.; Dunshea, F.R.; Fuentes, S. Emerging Technologies Based on Artificial Intelligence to Assess the Quality and Consumer Preference of Beverages. Beverages 2019, 5, 62. [Google Scholar] [CrossRef]
  31. Raponi, F.; Moscetti, R.; Monarca, D.; Colantoni, A.; Massantini, R. Monitoring and Optimization of the Process of Drying Fruits and Vegetables Using Computer Vision: A Review. Sustainability 2017, 9, 2009. [Google Scholar] [CrossRef]
  32. Armstrong, C.E.J.; Niimi, J.; Boss, P.K.; Pagay, V.; Jeffery, D.W. Use of Machine Learning with Fused Spectral Data for Prediction of Product Sensory Characteristics: The Case of Grape to Wine. Foods 2023, 12, 757. [Google Scholar] [CrossRef]
  33. Ghnimi, H.; Ennouri, M.; Chèné, C.; Karoui, R. A review combining emerging techniques with classical ones for the determination of biscuit quality: Advantages and drawbacks. Crit. Rev. Food Sci. Nutr. 2023, 63, 5009–5032. [Google Scholar] [CrossRef]
  34. Siche, R.; Vejarano, R.; Aredo, V.; Velasquez, L.; Saldaña, E.; Quevedo, R. Evaluation of Food Quality and Safety with Hyperspectral Imaging (HSI). Food Eng. Rev. 2016, 8, 306–322. [Google Scholar] [CrossRef]
  35. Mahajan, P.V.; Caleb, O.J.; Gil, M.I.; Izumi, H.; Colelli, G.; Watkins, C.B.; Zude, M. Quality and safety of fresh horticultural commodities: Recent advances and future perspectives. Food Packag. Shelf Life 2017, 14, 2–11. [Google Scholar] [CrossRef]
  36. Su, W.H.; He, H.J.; Sun, D.W. Non-Destructive and rapid evaluation of staple foods quality by using spectroscopic techniques: A review. Crit. Rev. Food Sci. Nutr. 2017, 57, 1039–1051. [Google Scholar] [CrossRef]
  37. Basile, T.; Marsico, A.D.; Perniola, R. NIR Analysis of Intact Grape Berries: Chemical and Physical Properties Prediction Using Multivariate Analysis. Foods 2021, 10, 113. [Google Scholar] [CrossRef]
  38. Perez, M.; Lopez-Yerena, A.; Vallverdú-Queralt, A. Traceability, authenticity and sustainability of cocoa and chocolate products: A challenge for the chocolate industry. Crit. Rev. Food Sci. Nutr. 2020, 62, 475–489. [Google Scholar] [CrossRef] [PubMed]
  39. Baiano, A. Applications of hyperspectral imaging for quality assessment of liquid based and semi-liquid food products: A review. J. Food Eng. 2017, 214, 10–15. [Google Scholar] [CrossRef]
  40. Quelal-Vásconez, M.A.; Lerma-García, M.J.; Pérez-Esteve, É.; Talens, P.; Barat, J.M. Roadmap of cocoa quality and authenticity control in the industry: A review of conventional and alternative methods. Compr. Rev. Food Sci. Food Saf. 2020, 19, 448–478. [Google Scholar] [CrossRef] [PubMed]
  41. Chapman, J.; Elbourne, A.; Khanh Truong, V.; Newman, L.; Gangadoo, S.; Rajapaksha Pathirannahalage, P.; Cheeseman, S.; Cozzolino, D. Sensomics—From conventional to functional NIR spectroscopy- Shining light over the aroma and taste of foods. Trends Food Sci. Technol. 2019, 91, 274–281. [Google Scholar] [CrossRef]
  42. Page, M.J.; McKenzie, J.E.; Bossuyt, P.M.; Boutron, I.; Hoffmann, T.C.; Mulrow, C.D.; Shamseer, L.; Tetzlaff, J.M.; Akl, E.A.; Brennan, S.E.; et al. The PRISMA 2020 statement: An updated guideline for reporting systematic reviews. BMJ 2021, 372, 71. [Google Scholar] [CrossRef] [PubMed]
  43. Grames, E.M.; Stillman, A.N.; Tingley, M.W.; Elphick, C.S. An automated approach to identifying search terms for systematic reviews using keyword co-occurrence networks. Methods Ecol. Evol. 2019, 10, 1645–1654. [Google Scholar] [CrossRef]
  44. Westgate, M.J. revtools: An R package to support article screening for evidence synthesis. Res. Synth. Methods 2019, 10, 606–614. [Google Scholar] [CrossRef]
  45. Chen, R.; Liu, F.; Zhang, C.; Wang, W.; Yang, R.; Zhao, Y.; Peng, J.; Kong, W.; Huang, J. Trends in digital detection for the quality and safety of herbs using infrared and Raman spectroscopy. Front. Plant Sci. 2023, 14, 1128300. [Google Scholar] [CrossRef]
  46. Lin, M.; Rasco, B.A.; Cavinato, A.; Al-Holy, M. Infrared (IR) spectroscopy near-infrared spectroscopy and mid-infrared spectroscopy. In Infrared Spectroscopy for Food Quality Analysis and Control, 1st ed.; Sun, D.-W., Ed.; Elsevier: Amsterdam, The Netherlands; Academic Press: Cambridge, MA, USA, 2008; pp. 119–143. [Google Scholar]
  47. Porep, J.U.; Kammerer, D.R.; Carle, R. On-line application of near infrared (NIR) spectroscopy in food production. Trends Food Sci. Technol. 2015, 46, 211–230. [Google Scholar] [CrossRef]
  48. Ouyang, Q.; Wang, L.; Park, B.; Kang, R.; Wang, Z.; Chen, Q.; Guo, Z. Assessment of matcha sensory quality using hyperspectral microscope imaging technology. LWT 2020, 125, 109254. [Google Scholar] [CrossRef]
  49. Lohumi, S.; Lee, S.; Lee, H.; Cho, B.-K. A review of vibrational spectroscopic techniques for the detection of food authenticity and adulteration. Trends Food Sci. Technol. 2015, 46, 85–98. [Google Scholar] [CrossRef]
  50. Zhang, B.; Huang, W.; Li, J.; Zhao, C.; Fan, S.; Wu, J.; Liu, C. Principles, developments and applications of computer vision for external quality inspection of fruits and vegetables: A review. Food Res. Int. 2014, 62, 326–343. [Google Scholar] [CrossRef]
  51. Ghaffari, M.; Omidikia, N.; Ruckebusch, C. Essential Spectral Pixels for Multivariate Curve Resolution of Chemical Images. Anal. Chem. 2019, 91, 10943–10948. [Google Scholar] [CrossRef] [PubMed]
  52. Paoletti, M.E.; Haut, J.M.; Plaza, J.; Plaza, A. Deep learning classifiers for hyperspectral imaging: A review. ISPRS J. Photogramm. Remote Sens. 2019, 158, 279–317. [Google Scholar] [CrossRef]
  53. Feng, Y.Z.; Sun, D.W. Application of hyperspectral imaging in food safety inspection and control: A review. Crit. Rev. Food Sci. Nutr. 2012, 52, 1039–1058. [Google Scholar] [CrossRef] [PubMed]
  54. Ma, J.; Sun, D.-W.; Pu, H.; Cheng, J.-H.; Wei, Q. Advanced techniques for hyperspectral imaging in the food industry: Principles and recent applications. Annu. Rev. Food Sci. Technol. 2019, 10, 197–220. [Google Scholar] [CrossRef]
  55. Wang, W.; Paliwal, J. Near-infrared spectroscopy and imaging in food quality and safety. Sens. Instrum. Food Qual. Safe. 2007, 1, 193–207. [Google Scholar] [CrossRef]
  56. Mehl, P.M.; Chen, Y.-R.; Kim, M.S.; Chan, D.E. Development of hyperspectral imaging technique for the detection of apple surface defects and contaminations. J. Food Eng. 2004, 61, 67–81. [Google Scholar] [CrossRef]
  57. Mahanti, N.K.; Pandiselvam, R.; Kothakota, A.; Ishwarya, P.S.; Kumar Chakraborty, S.; Kumar, M.; Cozzolino, D. Emerging non-destructive imaging techniques for fruit damage detection: Image processing and analysis. Trends Food Sci. Technol. 2022, 120, 418–438. [Google Scholar] [CrossRef]
  58. Pan, L.Q.; Sun, Y.; Xiao, H.; Gu, X.Z.; Hu, P.C.; Wei, Y.Y.; Tu, K. Hyperspectral imaging with different illumination patterns for the hollowness classification of white radish. Postharv. Biol. Technol. 2017, 126, 40–49. [Google Scholar] [CrossRef]
  59. Huang, M.; Kim, M.S.; Chao, K.L.; Qin, J.W.; Mo, C.Y.; Esquerre, C.; Delwiche, S.; Zhu, Q.B. Penetration depth measurement of Near-Infrared Hyperspectral Imaging light for milk powder. Sensors 2016, 16, 441. [Google Scholar] [CrossRef]
  60. Lu, G.; Wang, D.; Qin, X.; Halig, L.; Muller, S.; Zhang, H.; Chen, A.; Pogue, B.W.; Chen, Z.G.; Fei, B. Framework for hyperspectral image processing and quantification for cancer detection during animal tumors surgery. J. Biomed. Opt. 2015, 20, 126012. [Google Scholar] [CrossRef] [PubMed]
  61. Xu, H.; Ren, J.; Lin, J.; Mao, S.; Xu, Z.; Chen, Z.; Zhao, J.; Wu, Y.; Xu, N.; Wang, P. The impact of high-quality data on the assessment results of visible/near-infrared hyperspectral imaging and development direction in the food fields: A review. Food Measure 2023, 17, 2988–3004. [Google Scholar] [CrossRef]
  62. Amigo, J.M. Practical issues of hyperspectral imaging analysis of solid dosage forms. Anal. Bioanal. Chem. 2010, 398, 93–109. [Google Scholar] [CrossRef]
  63. Lorente, D.; Aleixos, N.; Gómez-Sanchis, J.; Cubero, S.; García-Navarrete, Ó.L.; Blasco, J. Recent Advances and Applications of Hyperspectral Imaging for Fruit and Vegetable Quality Assessment. Food Bioprocess Technol. 2012, 5, 1121–1142. [Google Scholar] [CrossRef]
  64. Rodríguez-Ortega, A.; Aleixos, N.; Blasco, J.; Albert, F.; Munera, S. Study of light penetration depth of a Vis-NIR hyperspectral imaging system for the assessment of fruit quality. A case study in persimmon fruit. J. Food Eng. 2023, 358, 111673. [Google Scholar] [CrossRef]
  65. Pu, Y.Y.; Feng, Y.Z.; Sun, D.W. Recent progress of Hyperspectral Imaging on Quality and Safety Inspection of fruits and vegetables: A review. Compr. Rev. Food Sci. Food Saf. 2015, 14, 176–188. [Google Scholar] [CrossRef] [PubMed]
  66. Sun, Y.; Xiao, H.; Tu, S.; Sun, K.; Pan, L.; Tu, K. Detecting decayed peach using a rotating hyperspectral imaging test bed. LWT 2018, 87, 326–332. [Google Scholar] [CrossRef]
  67. Fomina, P.; Femenias, A.; Hlavatsch, M.; Scheuermann, J.; Schäfer, N.; Freitag, S.; Patel, N.; Kohler, A.; Krska, R.; Koeth, J.; et al. A Portable Infrared Attenuated Total Reflection Spectrometer for Food Analysis. Appl. Spectrosc. 2023, 77, 1073–1086. [Google Scholar] [CrossRef]
  68. Zhao, Y.Y.; Zhu, S.S.; Zhang, C.; Feng, X.P.; Feng, L.; He, Y. Application of hyperspectral imaging and chemometrics for variety classification of maize seeds. RSC Adv. 2018, 8, 1337–1345. [Google Scholar] [CrossRef]
  69. Garg, P.K. Chapter10-Effect of contamination and adjacency factors on snow using spectroradiometer and hyperspectral images. In Hyperspectral Remote Sensing; Pandey, P.C., Srivastava, P.K., Balzter, H., Bhattacharya, B., Petropoulos, G.P., Eds.; Elsevier: Amsterdam, The Netherlands, 2020; pp. 167–196. [Google Scholar] [CrossRef]
  70. Basile, T.; Marsico, A.D.; Perniola, R. Use of Artificial Neural Networks and NIR Spectroscopy for Non-Destructive Grape Texture Prediction. Foods 2022, 11, 281. [Google Scholar] [CrossRef] [PubMed]
  71. Vidal, M.; Amigo, J.M. Pre-processing of hyperspectral images. Essential steps before image analysis. Chemom. Intell. Lab. Syst. 2012, 117, 138–148. [Google Scholar] [CrossRef]
  72. Li, G.; Ma, S.; Li, K.; Zhou, M.; Lin, L. Band selection for heterogeneity classification of hyperspectral transmission images based on multi-criteria ranking. Infrared Phys. Technol. 2022, 125, 104317. [Google Scholar] [CrossRef]
  73. Raju, V.B.; Imtiaz, M.H.; Sazonov, E. Food Image Segmentation Using Multi-Modal Imaging Sensors with Color and Thermal Data. Sensors 2023, 23, 560. [Google Scholar] [CrossRef] [PubMed]
  74. Prats-Montalbán, J.M.; de Juan, A.; Ferrer, A. Multivariate image analysis: A review with applications. Chemom. Intell. Lab. Syst. 2011, 107, 1–23. [Google Scholar] [CrossRef]
  75. Lin, Y.; Ma, J.; Wang, Q.; Sun, D.W. Applications of machine learning techniques for enhancing non destructive food quality and safety detection. Crit. Rev. Food Sci. Nutr. 2023, 63, 1649–1669. [Google Scholar] [CrossRef]
  76. Buvè, C.; Saeys, W.; Rasmussen, M.A.; Neckebroeck, B.; Hendrickx, M.; Grauwet, T.; VanLoey, A. Application of multivariate data analysis for food quality investigations: An example-based review. Food Res. Int. 2022, 151, 110878. [Google Scholar] [CrossRef]
  77. Engel, J.; Gerretzen, J.; Szymańska, E.; Jansen, J.J.; Downey, G.; Blanchet, L.; Buydens, L.M.C. Breaking with trends in pre-processing? Trends Anal. Chem. 2013, 50, 96–106. [Google Scholar] [CrossRef]
  78. Conzen, J.-P. Multivariate Calibration, 3rd ed.; Bruker Optik GmbH: Ettlingen, Germany, 2014; ISBN 978-3-929431-13-1. [Google Scholar]
  79. Saha, D.; Manickavasagan, A. Machine learning techniques for analysis of hyperspectral images to determine quality of food products: A review. Curr. Res. Food Sci. 2021, 4, 28–44. [Google Scholar] [CrossRef]
  80. Wang, H.-P.; Chen, P.; Dai, J.-W.; Liu, D.; Li, J.-Y.; Xu, Y.-P.; Chu, X.-L. Recent advances of chemometric calibration methods in modern spectroscopy: Algorithms, strategy, and related issues. TrAC Trends Anal. Chem. 2022, 153, 116648. [Google Scholar] [CrossRef]
  81. Badillo, S.; Banfai, B.; Birzele, F.; Davydov, I.I.; Hutchinson, L.; Kam-Thong, T.; Siebourg-Polster, J.; Steiert, B.; Zhang, J.D. An Introduction to MachineLearning. Clin. Pharmacol. Ther. 2020, 107, 871–885. [Google Scholar] [CrossRef] [PubMed]
  82. Ezugwu, A.E.; Ikotun, A.M.; Oyelade, O.O.; Abualigah, L.; Agushaka, J.O.; Eke, C.I.; Akinyelu, A.A. A comprehensive survey of clustering algorithms: State-of-the-art machine learning applications, taxonomy, challenges, and future research prospects. Eng. Appl. Artif. Intell. 2022, 110, 104743. [Google Scholar] [CrossRef]
  83. Basile, T.; Amendolagine, A.M.; Tarricone, L. Rootstocks’ and Cover-Crops’ Influence on Grape: A NIR-Based ANN Classification Model. Agriculture 2023, 13, 5. [Google Scholar] [CrossRef]
  84. Sheth, V.; Tripathi, U.; Sharma, A. A Comparative Analysis of Machine Learning Algorithms for Classification Purpose. Procedia Comput. Sci. 2022, 215, 422–431. [Google Scholar] [CrossRef]
  85. Berrier, K.L.; Prebihalo, S.E.; Synovec, R.E. Chapter 7—Advanced data handling in comprehensive two-dimensional gas chromatography. In Basic Multidimensional Gas Chromatography; Separation Science and Technology Book Series; Snow, N.H., Ed.; Elsevier: Amsterdam, The Netherlands, 2020; Volume 12, pp. 229–268. [Google Scholar] [CrossRef]
  86. LeCun, Y.; Bengio, Y.; Hinton, G. Deep learning. Nature 2015, 521, 436–444. [Google Scholar] [CrossRef]
  87. Huang, Y.; Kangas, L.J.; Rasco, B.A. Applications of artificial neural networks (ANNs) in food science. Crit. Rev. Food Sci. Nutr. 2007, 47, 113–126. [Google Scholar] [CrossRef]
  88. Plaza, A.; Benediktsson, J.A.; Boardman, J.W.; Brazile, J.; Bruzzone, L.; Camps-Valls, G.J.; Chanussot, M.; Fauvel, P.; Gamba, A.; Gualtieri, M.; et al. Recent advances in techniques for hyperspectral image processing. Remote Sens. Environ. 2009, 113, S110–S122. [Google Scholar] [CrossRef]
  89. Boichenko, E.; Panchenko, A.; Tyndyk, M.; Maydin, M.; Kruglov, S.; Artyushenko, V.; Kirsanov, D. Validation of classification models in cancer studies using simulated spectral data—A “sandbox” concept. Chemom. Intell. Lab. Syst. 2022, 225, 104564. [Google Scholar] [CrossRef]
  90. Pu, H.; Kamruzzaman, M.; Sun, D.-W. Selection of feature wavelengths for developing multispectral imaging systems for quality, safety and authenticity of muscle foods-a review. Trends Food Sci. Technol. 2015, 45, 86–104. [Google Scholar] [CrossRef]
  91. Hoshi, A.; Aoki, S.; Kouno, E.; Ogasawara, M.; Onaka, T.; Miura, Y.; Mamiya, K. A novel objective sour taste evaluation method based on near-infrared spectroscopy. Chem. Senses 2014, 39, 313–322. [Google Scholar] [CrossRef]
  92. Wang, H.; Miao, Y.; Xu, X.; Ye, P.; Wu, H.; Wang, B.; Shi, X. Effects of Blending on Phenolic, Colour, Antioxidant and Aroma Components of Cabernet Sauvign on Wine from Xinjiang (China). Foods 2022, 11, 3332. [Google Scholar] [CrossRef] [PubMed]
  93. Smyth, H.; Cozzolino, D. Instrumental methods (spectroscopy, electronic nose and tongue) as tools to predict taste and aroma in beverages: Advantages and limitations. Chem. Rev. 2013, 113, 1429–1440. [Google Scholar] [CrossRef] [PubMed]
  94. Hugi, A.; Voirol, E. Instrumental measurements and sensory parameters. In Instrumentation and Sensors for the Food Industry, 2nd ed.; Rogers, E.K., Brimelow, C.J.B., Eds.; CRC Press: Boca Raton, FL, USA, 2001; pp. 31–60. [Google Scholar]
  95. Peleg, M. On fundamental issues in texture evaluation and texturization—A view. Food Hydrocoll. 2006, 20, 405–414. [Google Scholar] [CrossRef]
  96. Chen, L.; Opara, U.L. Texture measurement approaches in fresh and processed foods. A review. Food Res. Int. 2013, 51, 823–835. [Google Scholar] [CrossRef]
  97. Özdoğan, G.; Lin, X.; Sun, D.-W. Rapid and non invasive sensory analyses of food products by hyperspectral imaging: Recent application developments. Trends Food Sci. Technol. 2021, 111, 151–165. [Google Scholar] [CrossRef]
  98. Mavani, N.R.; Ali, J.M.; Othman, S.; Hussain, M.A.; Hashim, H.; Rahman, N.A. Application of Artificial Intelligence in Food Industry—A Guideline. Food Eng. Rev. 2022, 14, 134–175. [Google Scholar] [CrossRef]
  99. Belchior, V.; Botelho, B.G.; Franca, A.S. Comparison of Spectroscopy-Based Methods and Chemometrics to Confirm Classification of Specialty Coffees. Foods 2022, 11, 1655. [Google Scholar] [CrossRef]
  100. Esteban-Díez, I.; González-Sáiz, J.M.; Pizarro, C. Prediction of sensory properties of espresso from roasted coffee samples by near-infrared spectroscopy. Anal. Chim. Acta 2004, 525, 171–182. [Google Scholar] [CrossRef]
  101. Ribeiro, J.S.; Ferreira, M.M.C.; Salva, T.J.G. Chemometric models for the quantitative descriptive sensory analysis of Arabica coffee beverages using near infrared spectroscopy. Talanta 2011, 83, 1352–1358. [Google Scholar] [CrossRef]
  102. Baqueta, M.R.; Coqueiro, A.; Valderrama, P. Brazilian Coffee Blends: A Simple and Fast Method by Near-Infrared Spectroscopy for the Determination of the Sensory Attributes Elicited in Professional Coffee Cupping. J. Food Sci. 2019, 84, 1247–1255. [Google Scholar] [CrossRef]
  103. Caporaso, N.; Whitworth, M.B.; Fisk, I.D. Prediction of coffee aroma from single roasted coffee beans by hyperspectral imaging. Food Chem. 2022, 371, 131159. [Google Scholar] [CrossRef] [PubMed]
  104. de Souza Gois Barbosa, M.; Dos Santos Scholz, M.B.; Good Kitzberger, C.S.; de Toledo Benassi, M. Correlation between the composition of green Arabica coffee beans and the sensory quality of coffee brews. Food Chem. 2019, 292, 275–280. [Google Scholar] [CrossRef] [PubMed]
  105. Dos Santos Scholz, M.B.; Kitzberger, C.S.G.; Durand, N.; Rakocevic, M. From the field to coffee cup: Impact of planting design on chlorogenic acid isomers and other compounds in coffee beans and sensory attributes of coffee beverage. Eur. Food Res. Technol. 2018, 244, 1793–1802. [Google Scholar] [CrossRef]
  106. Belchior, V.; Gonçalves Botelho, B.; Oliveira, L.S.; Franca, A.S. Attenuated Total Reflectance Fourier Transform Spectroscopy (ATR-FTIR) and chemometrics for discrimination of espresso coffees with different sensory characteristics. Food Chem. 2019, 273, 178–185. [Google Scholar] [CrossRef] [PubMed]
  107. Craig, A.P.; Franca, A.S.; Oliveira, L.S.; Irudayaraj, J.; Ileleji, K. Application of elastic net and infrared spectroscopy in the discrimination between defective and non-defective roasted coffees. Talanta 2014, 128, 393–400. [Google Scholar] [CrossRef] [PubMed]
  108. Buratti, S.; Sinelli, N.; Bertone, E.; Venturello, A.; Casiraghi, E.; Geobaldo, F. Discrimination between washed Arabica, natural Arabica and Robusta coffees by using near infrared spectroscopy, electronic nose and electronic tongue analysis. J. Sci. Food Agric. 2015, 95, 2192–2200. [Google Scholar] [CrossRef] [PubMed]
  109. Cestari, A. Development of a fast and simple method to identify pure Arabica coffee and blended coffee by Infrared Spectroscopy. J. Food Sci. Technol. 2021, 58, 3645–3654. [Google Scholar] [CrossRef]
  110. Correia, R.M.; Andrade, R.; Tosato, F.; Nascimento, M.T.; Pereira, L.L.; Araújo, J.B.S.; Pinto, F.E.; Endringer, D.C.; Padovan, M.P.; Castro, E.V.R.; et al. Analysis of Robusta coffee cultivated in agroforestry systems (AFS) by ESI-FT-ICRMS and portable NIR associated with sensory analysis. J. Food Compos. Anal. 2020, 94, 103637. [Google Scholar] [CrossRef]
  111. Yu, X.L.; Sun, D.-W.; He, Y. Emerging techniques for determining the quality and safety of tea products: A review. Compr. Rev. Food Sci. Food Saf. 2020, 19, 2613–2638. [Google Scholar] [CrossRef]
  112. Li, L.; Sheng, X.; Zan, J.; Yuan, H.; Zong, X.; Jiang, Y. Monitoring the dynamic change of catechins in black tea drying by using near-infrared spectroscopy and chemometrics. J. Food Compos. Anal. 2023, 119, 105266. [Google Scholar] [CrossRef]
  113. Jin, G.; Wang, Y.; Li, M.; Li, T.; Huang, W.; Li, L.; Deng, W.-W.; Ning, J. Rapid and real-time detection of black tea fermentation quality by using an inexpensive data fusion system. Food Chem. 2021, 358, 129815. [Google Scholar] [CrossRef] [PubMed]
  114. Li, C.; Zong, B.; Guo, H.; Luo, Z.; He, P.; Gong, S.; Fan, F. Discrimination of white teas produced from fresh leaves with different maturity by near-infrared spectroscopy. Spectrochim. Acta A Mol. Biomol. Spectrosc. 2020, 227, 117697. [Google Scholar] [CrossRef] [PubMed]
  115. Li, C.; Guo, H.; Zong, B.; He, P.; Fan, F.; Gong, S. Rapid and non-destructive discrimination of special-grade flat green tea using Near-infrared spectroscopy. Spectrochim. Acta A Mol. Biomol. Spectrosc. 2019, 206, 254–262. [Google Scholar] [CrossRef] [PubMed]
  116. Zong, X.; Sheng, X.; Li, L.; Zan, J.; Jiang, Y.; Zou, H.; Shen, S.; Yuan, H. Rapid Detection of Moisture Content in the Processing of Longjing Tea by Micro-Near-Infrared Spectroscopy and a Portable Colorimeter Based on a Data Fusion Strategy. Horticulturae 2022, 8, 1007. [Google Scholar] [CrossRef]
  117. Daniels, A.J.; Poblete-Echeverría, C.; Opara, U.L.; Nieuwoudt, H.H. Measuring Internal Maturity Parameters Contactless on Intact Table Grape Bunches Using NIR Spectroscopy. Front Plant Sci 2019, 10, 1517. [Google Scholar] [CrossRef] [PubMed]
  118. Włodarska, K.; Szulc, J.; Khmelinskii, I.; Sikorska, E. Non-destructive determination of strawberry fruit and juice quality parameters using ultraviolet, visible, and near-infrared spectroscopy. J. Sci. Food Agric. 2019, 99, 5953–5961. [Google Scholar] [CrossRef] [PubMed]
  119. Cozzolino, D.; Smyth, H.E.; Lattey, K.A.; Cynkar, W.; Janik, L.; Dambergs, R.G.; Francis, I.L.; Gishen, M. Relationship between sensory analysis and near infrared spectroscopy in Australian Riesling and Chardonnay wines. Anal. Chim. Acta 2005, 539, 341–348. [Google Scholar] [CrossRef]
  120. Anjos, O.; Caldeira, I.; Fernandes, T.A.; Pedro, S.I.; Vitória, C.; Oliveira-Alves, S.; Catarino, S.; Canas, S. PLS-R Calibration Models for Wine Spirit Volatile Phenols Prediction by Near-Infrared Spectroscopy. Sensors 2022, 22, 286. [Google Scholar] [CrossRef]
  121. Anjos, O.; Caldeira, I.; Roque, R.; Pedro, S.I.; Lourenço, S.; Canas, S. Screening of Different Ageing Technologies of Wine Spirit by Application of Near-Infrared (NIR) Spectroscopy and Volatile Quantification. Processes 2020, 8, 736. [Google Scholar] [CrossRef]
  122. Čiča, K.H.; Pezer, M.; Mrvčić, J.; Stanzer, D.; Čačić, J.; Jurak, V.; Krajnović, M.; Gajdoš Kljusurić, J. Identification of phenolic and alcoholic compounds in wine spirits and their classification by use of multivariate analysis. J. Serbian Chem. Soc. 2019, 84, 663–677. [Google Scholar] [CrossRef]
  123. Srivastava, S.; Sadistap, S. Data processing approaches and strategies for non-destructive fruits quality inspection and authentication: A review. J. Food Meas. Charact. 2018, 12, 2758–2794. [Google Scholar] [CrossRef]
  124. Jaywant, S.A.; Singh, H.; Arif, K.M. Sensors and Instruments for Brix Measurement: A Review. Sensors 2022, 22, 2290. [Google Scholar] [CrossRef] [PubMed]
  125. Yuan, L.-M.; Sun, L.; Cai, J.-R.; Lin, H. A Preliminary Study on Whether the Soluble Solid Content and Acidity of Oranges Predicted by Near Infrared Spectroscopy Meet the Sensory Degustation. J. Food Process Eng. 2015, 38, 309–319. [Google Scholar] [CrossRef]
  126. Baiano, A.; Terracone, C.; Peri, G.; Romaniello, R. Application of hyperspectral imaging for prediction of physico-chemical and sensory characteristics of table grapes. Comput. Electron. Agric. 2012, 87, 142–151. [Google Scholar] [CrossRef]
  127. Nantongo, J.S.; Tinyiro, S.E.; Nakitto, M.; Serunkuma, E.; Namugga, P.; Ayetigbo, O.; Mayanja, S.; Moyo, M.; Ssali, R.; Mendes, T. End-user preferences to enhance prospects for varietal acceptance and adoption in potato breeding in Uganda. J. Sci. Food Agric. 2023. online ahead of print. [Google Scholar] [CrossRef] [PubMed]
  128. Van Dijk, C.; Fischer, M.; Holm, J.; Beekhuizen, J.-G.; Stolle-Smits, T.; Boeriu, C. Textureof Cooked Potatoes (Solanum tuberosum).1. Relationships between Dry Matter Content, Sensory-Perceived Texture, and Near-Infrared Spectroscopy. J. Agric. Food Chem. 2002, 50, 5082–5088. [Google Scholar] [CrossRef] [PubMed]
  129. Serra, S.; Goke, A.; Diako, C.; Vixie, B.; Ross, C.; Musacchi, S. Consumer perception of d’Anjou pear classified by dry matter at harvest using near-infrared spectroscopy. Int. J. Food Sci. Technol. 2019, 54, 2256–2265. [Google Scholar] [CrossRef]
  130. Alhamdan, A.M.; Fickak, A.; Atia, A.R. Evaluation of sensory and texture profile analysis properties of stored Khalal Barhi dates non destructively usingVis/NIR spectroscopy. J. Food Process. Eng. 2019, 42, e13215. [Google Scholar] [CrossRef]
  131. Løkke, M.M.; Fast Seefeldt, H.; Skov, T.; Edelenbos, M. Color and textural quality of packaged wild rocket measured by multispectral imaging. Postharvest Biol. Technol. 2013, 75, 86–95. [Google Scholar] [CrossRef]
  132. Li, X.; Tsuta, M.; Hayakawa, F.; Nakano, Y.; Kazami, Y.; Ikehata, A. Estimating the sensory qualities of tomatoes using visible and near-infrared spectroscopy and interpretation based on gas chromatography-mass spectrometry metabolomics. Food Chem. 2021, 343, 128470. [Google Scholar] [CrossRef]
  133. Plans, M.; Simó, J.; Casañas, F.; Romero del Castillo, R.; Rodriguez-Saona, L.E.; Sabaté, J. Estimating sensory properties of common beans (Phaseolus vulgaris L.) by near infrared spectroscopy. Food Res. Int. 2014, 56, 55–62. [Google Scholar] [CrossRef]
  134. Mehinagic, E.; Royer, G.; Bertrand, D.; Symoneaux, R.; Laurens, F.; Jourjon, F. Relationship between sensory analysis, penetrometry and visible–NIR spectroscopy of apples belonging to different cultivars. Food Qual. Pref. 2003, 14, 473–484. [Google Scholar] [CrossRef]
  135. Jensen, P.N.; Sørensen, G.; Engelsen, S.B.; Bertelsen, G. Evaluation of Quality Changes in Walnut Kernels (Juglans regia L.) by Vis/NIR Spectroscopy. J. Agric. Food Chem. 2001, 49, 5790–5796. [Google Scholar] [CrossRef] [PubMed]
  136. Sans, S.; Ferré, J.; Boqué, R.; Sabaté, J.; Casals, J.; Simó, J. Estimating Sensory Properties with Near-Infrared Spectroscopy: A Tool for Quality Control and Breeding of ‘Calçots’ (Allium cepa L.). Agronomy 2020, 10, 828. [Google Scholar] [CrossRef]
  137. Basile, T.; Marsico, A.D.; Cardone, M.F.; Antonacci, D.; Perniola, R. FT-NIR Analysis of Intact Table Grape Berries to Understand Consumer Preference Driving Factors. Foods 2020, 9, 98. [Google Scholar] [CrossRef] [PubMed]
  138. LeMoigne, M.; Maury, C.; Bertrand, D.; Jourjon, F. Sensory and instrumental characterisation of Cabernet Franc grapes according to ripening stages and growing location. Food Qual. Pref. 2008, 19, 220–231. [Google Scholar] [CrossRef]
  139. Sinelli, N.; Cerretani, L.; Di Egidio, V.; Bendini, A.; Casiraghi, E. Application of near (NIR) infrared and mid (MIR) infrared spectroscopy as a rapid tool to classify extravirgin olive oil on the basis of fruity attribute intensity. Food Res. Int. 2010, 43, 369–375. [Google Scholar] [CrossRef]
  140. Clemmensen, L.H.; Dissing, B.S.; Hyldig, G.; Løje, H. Multispectral Imaging of Wok-Fried Vegetables. J. Imaging Sci. Technol. 2012, 56, 020404-1–020404-6. [Google Scholar] [CrossRef]
  141. Krähmer, A.; Engel, A.; Kadow, D.; Ali, N.; Umaharan, P.; Kroh, L.W.; Schulz, H. Fast and neat—Determination of biochemical quality parameters in cocoa using near infrared spectroscopy. Food Chem. 2015, 181, 152–159. [Google Scholar] [CrossRef]
  142. Biancolillo, A.; Preys, S.; Gaci, B.; Le-Quere, J.-L.; Laboure, H.; Deuscher, Z.; Cheynier, V.; Sommerer, N.; Fayeulle, N.; Costet, P.; et al. Multi-block classification of chocolate and cocoa samples into sensory poles. Food Chem. 2021, 340, 127904. [Google Scholar] [CrossRef]
  143. Ashraf, S.; Ghufran Saeed, S.M.; Sayeed, S.A.; Kanwar, H.; Ahmed, M.; Ali, R. Impact of Lentil Fortification on Physical, Chemical and Instrumental Properties of Dough and its Influence on overall Quality of Cookies. Arab. Gulf J. Sci. Res. 2012, 30, 125–134. [Google Scholar] [CrossRef]
  144. Radoš, K.; Čukelj Mustač, N.; Benković, M.; Kuzmić, I.; Novotni, D.; Drakula, S.; Habuš, M.; Voučko, B.; Ćurić, D. The quality and shelf life of biscuits with cryo-ground proso millet and buck wheat by-products. J. Food Process. Preserv. 2022, 46, 15532. [Google Scholar] [CrossRef]
  145. Cevoli, C.; Evangelisti, A.; Gradari, P.; Fabbri, A. Storage of wafer cookies: Assessment by destructive techniques, and non-destructive spectral detection methods. J. Food Eng. 2023, 336, 111209. [Google Scholar] [CrossRef]
  146. Wang, T.; Rodriguez-Saona, L.E. Rapid determination of sugar level in snack products using infrared spectroscopy. J. Food Sci. 2012, 77, C874–C879. [Google Scholar] [CrossRef] [PubMed]
  147. Bedini, A.; Zanolli, V.; Zanardi, S.; Bersellini, U.; Dalcanale, E.; Suman, M. Rapid and Simultaneous Analysis of Xanthines and Polyphenols as Bitter Taste Markers in Bakery Products by FT-NIR Spectroscopy. Food Anal. Methods 2013, 6, 17–27. [Google Scholar] [CrossRef]
  148. Otegbayo, B.; Oluyinka, O.; Tanimola, A.R.; Bisi, F.; Ayomide, A.; Tomilola, B.; Madu, T.; Okoye, B.; Chijioke, U.; Ofoeze, M.; et al. Food quality profile of pounded yam and implications for yam breeding. J. Sci. Food Agric. 2023. [Google Scholar] [CrossRef]
  149. Craig, A.P.; Franca, A.S.; Oliveira, L.S.; Irudayaraj, J.; Ileleji, K. Fourier transform infrared spectroscopy and near infrared spectroscopy for the quantification of defects in roasted coffees. Talanta 2015, 134, 379–386. [Google Scholar] [CrossRef]
  150. Corona, P.; Frangipane, M.T.; Moscetti, R.; LoFeudo, G.; Castellotti, T.; Massantini, R. Chestnut Cultivar Identification through the Data Fusion of Sensory Quality and FT-NIR Spectral Data. Foods 2021, 10, 2575. [Google Scholar] [CrossRef]
  151. Manthou, E.; Lago, S.-L.; Dagres, E.; Lianou, A.; Tsakanikas, P.; Panagou, E.Z.; Anastasiadi, M.; Mohareb, F.; Nychas, G.J.E. Application of spectroscopic and multispectral imaging technologies on the assessment of ready-to-eat pineapple quality: A performance evaluation study of machine learning models generated from two commercial data analytics tools. Comp. Electron. Agric. 2020, 175, 105529. [Google Scholar] [CrossRef]
  152. Nirere, A.; Sun, J.; Atindana, V.A.; Hussain, A.; Zhou, X.; Yao, K. A comparative analysis of hybrid SVM and LS-SVM classification algorithms to identify dried wolfberry fruits quality based on hyperspectral imaging technology. J. Food Process. Preserv. 2022, 46, e16320. [Google Scholar] [CrossRef]
  153. Bertone, E.; Venturello, A.; Giraudo, A.; Pellegrino, G.; Geobaldo, F. Simultaneous determination by NIR spectroscopy of the roasting degree and Arabica/Robusta ratio in roasted and ground coffee. Food Control 2016, 59, 683–689. [Google Scholar] [CrossRef]
  154. Ibrahim, A.; Alghannam, A.; Eissa, A.; Firtha, F.; Kaszab, T.; Kovacs, Z.; Helyes, L. Preliminary Study for Inspecting Moisture Content, Dry Matter Content, and Firmness Parameters of Two Date Cultivars Using an NIR Hyperspectral Imaging System. Front. Bioeng. Biotechnol. 2021, 9, 720630. [Google Scholar] [CrossRef] [PubMed]
  155. Champagne, E.T.; Bett-Garber, K.L.; Grimm, C.C.; McClung, A.M.; Moldenhauer, K.A.; Linscombe, S.; McKenzie, K.S.; Barton, F.E. II Near-Infrared Reflectance Analysis for Prediction of Cooked Rice Texture. Cereal Chem. 2001, 78, 358–362. [Google Scholar] [CrossRef]
  156. Großmann, J.L.; Westerhuis, J.A.; Næs, T.; Smilde, A.K. Critical evaluation of assessor difference correction approaches in sensory analysis. Food Qual. Pref. 2023, 106, 104792. [Google Scholar] [CrossRef]
Figure 1. Data search flow diagram.
Chemosensors 11 00579 g001
Table 1. Classification models.
ProductSampleNTechniqueRegionsBest ModelStatisticsSensory AnalysisReferences
CoffeeGreen beans and roasted ground coffee194NIR12,500–3700 cm−1LDA100%NOBuratti et al. (2014) [108]
Roasted and ground coffee beans45NIR1200–2400 nmElastic net0.88–0.94%NOCraiget al. (2015) [149]
Espresso24FT-NIR4000–600 cm−1PLS-DAAroma:sensitivity = 0.92–1; specificity = 0.82–0.99YES
n = 6 trained testers
Belchior et al. (2019) [106]
Flavor: sensitivity = 0.75–0.97; specificity = 0.94–0.99
Aftertaste: sensitivity = 0.90–1; specificity = 0.93–1
Acidity: sensitivity = 0.75–0.97; specificity= 0.90–1
Body: sensitivity = 0.84–1; specificity = 0.87–0.99
TeaWhite tea127FT-NIR10,000–4000 cm−1PSO-SVM98.92% discrimination of tea (buds and young leaves vs. mature leaves and shoots)YES
n = 6 trained testers
Li et al. (2019) [114]
Green tea279NIR10,000–4000 cm−1siPLS93%externalpredictionaccuracyYES
n = 6 trained testers
Li et al. (2019) [115]
Black tea110Micro-NIR900–1700 nmSVM83.78–89.19% (low–mediumlevel data fusion: color and spectra)YES
n = 5 trained testers
Jin et al. (2021) [113]
Alcoholic beverageWine spirits16NIR904–1699 nmLDA66–100%NOČica et al. (2019) [122]
Fresh/dried Fruits and oilsRaw and boiled chestnuts96VIS-NIR10,000–4000 cm−1PLS-DAData fusion based, raw and boiled: accuracy (0.99 both), sensitivity (0.98 and 0.99), specificity (0.99 both) YES
n = 8 trained testers
Corona et al. (2021) [150]
PLS-DAOnly spectral data:CV = 0.78 boiled CV = 0.98 raw
Pineapple424MSI405–970 nmPLS-DAColor:accuracy (85.71%),sensitivity (100%),specificity (42.86%)YES
n = 2 testers
Manthou et al. (2020) [151]
PLS-DAOdor:accuracy (83.04%);sensitivity (61.54%);specificity (89.53%)
PLS-DATexture:accuracy (72.32%);sensitivity (95%);specificity (15.63%)
Virgin olive oils112FT-NIR12,500–4500 cm−1LDA76.3% (67.2–100%): 4 classes: defective and non-defective oils (low, medium, high fruity flavor)YES
n = 16 trained testers
Sinelli et al. (2010)
[139]
LDA98% (92.9–100%):3 classes: low, medium, high fruity flavor
Grapes15 batchesVis-NIRyesFDA55–79%YES
n = 12 trained testers
Le Moigne et al.(2008)
[138]
Gooseberries HSI400.680–1001.612 nmLS-SVM96.66%NONirere et al. (2022)
[152]
CocoaChocolate97VIS-NIR400–2498 nmSO-PLS-LDA (selected data from NIR + PTR-ToF-MS fluorescence)77.4%YES
n = NS
Biancolillo et al. (2021)
[142]
Table 2. Prediction models.
ProductSampleNTechniqueRegionsQuality Parameters/Sensory AttributesBest ModelAccuracySensory AnalysisReferences
CoffeeRoasted coffee beans250HSI1000–2500 nmAldehydesPLSR2cv = 0.67; RMSE = 2.85; RPD = 1.82NOCaporaso et al. (2022)
[103]
PyrazinePLSR2cv = 0.69; RMSE = 4.65; RPD = 1.78
KetonesPLSR2cv = 0.43; RMSE = 0.64; RPD = 1.37
PhenolsPLSR2cv = 0.54; RMSE = 0.25; RPD = 1.87
AcidsPLSR2cv = 0.18; RMSE = 4.26; RPD = 1.12
HeterocyclicPLSR2cv = 0.26; RMSE = 1.95; RPD = 1.89
Roasted and ground coffee130FT-NIR12,500–3500 cm−1Roasting colorPLSR2cv = 0.87NOBertone et al. (2016) [153]
Arabica contentPLSR2cv = 0.97
Espresso
green coffee beans
35
38
NIR
on roasted ground coffee
1100–2200 nmAcidityPLSR2cv = 0.94; RMSECV = 6.77%YES
n = 11 trained testers
Esteban D’ıez et al. (2004) [100]
Mouthfeel (body)
PLSR2cv = 0.83; RMSECV = 7.01%
BitternessPLSR2cv = 0.94; RMSECV = 4.74%
AftertastePLSR2cv = 0.86; RMSECV = 6.57%
Arabica roasted coffee51NIR1100–2500 nmAcidityPLSR2cv = 0.84; RMSECV = 0.28YES
n = 5 trained testers
Ribeiro et al. (2011) [101]
BitternessPLSR2cv = 0.87; RMSECV = 0.35
FlavorPLSR2cv = 0.93; RMSECV = 0.31
CleanlinessPLSR2cv = 0.91; RMSECV = 0.38
BodyPLSR2cv = 0.88; RMSECV = 0.27
Overall qualityPLSR2cv = 0.91; RMSECV = 0.39
Coffee217NIR900–1650 nmBodyPLSR2ev = 0.80; RMSEP = 0.28; RPD = 1.86YES
n = 2 trained testers
Baqueta et al. (2019) [102]
FlavorPLSR2ev = 0.77; RMSEP = 0.13; RPD = 1.23
AstringencyPLSR2ev = 0.84; RMSEP = 0.13; RPD = 1.09
AcidityPLSR2ev = 0.80; RMSEP = 0.11; RPD = 5 × 10⁻¹⁴
BitternessPLSR2ev = 0.84; RMSEP = 0.10; RPD = 0.74
Powder fragrancePLSR2ev = 0.75; RMSEP = 0.15; RPD = 1.05
Drink aromaPLSR2ev = 0.75; RMSEP = 0.16; RPD = 1.02
Residual flavorPLSR2ev = 0.75; RMSEP = 0.15; RPD = 0.89
Overall qualityPLSR2ev = 0.74; RMSEP = 0.16; RPD = 1.02
Coffee56NIR900–2300 nmQuality scorePLSR2ev = 0.98; RMSEP = 0.52YES
n = 6 trained testers
Belchioret et al. (2022) [106]
Coffee blends55NIR1200–2400 nmDefective coffeePLSR2ev = 0.87–0.91; RMSEP = 0.03 (mixture of defects)NOCraiget et al.
(2015) [149]
TeaGreen tea225micro-NIR900–1700 nmMoisturePLSR2ev = 0.98; RMSEP = 0.03; RPD = 6.53NOZong et al. (2022) [116]
Black tea108NIR1000–1800 nmCatechinLS-SVMR2ev = 0.98; RPD = 5.65NOLi et al. (2023) [112]
Catechin gallateLS-SVMR2ev = 0.99; RPD = 10.7
EpicatechinLS-SVMR2ev = 0.99; RPD = 7.16
Epicatechin gallateLS-SVMR2ev = 0.98; RPD = 5.45
EpigallocatechinLS-SVMR2ev = 0.98; RPD = 5.40
Epigallocatechin gallateLS-SVMR2ev = 0.98; RPD = 6.37
GallocatechinLS-SVMR2ev = 0.98; RPD = 6.22
Gallocatechin gallateLS-SVMR2ev = 0.99; RPD = 14.8
Black tea110micro-NIR900–1700 nmTheaflavinSVMR2ev = 0.79; RMSEP = 0.77; RPD = 1.60 (micro-NIR)YES
n = 5 trained testers
Jin et al. (2021) [113]
R2ev = 086; RMSEP = 0.58; RPD = 2.01 (data fusion)
Theaflavin-3-gallateSVMR2ev = 0.73; RMSEP = 0.74; RPD = 1.48 (micro-NIR)
R2ev = 0.67; RMSEP = 0.74; RPD = 1.36 (data fusion)
Theaflavin-3-3′-gallateSVMR2ev = 0.24; RMSEP = 2.05; RPD = 0.98 (micro-NIR)
R2ev = 0.18; RMSEP = 1.90; RPD = 0.99 (data fusion)
Theaflavin-3′-gallateSVMR2ev = 0.63; RMSEP = 0.48; RPD = 1.30 (micro-NIR)
R2ev = 0.55; RMSEP = 0.47; RPD = 1.18 (data fusion)
BeveragesWine spirits16NIR904–1699 nmAlcohols and phenolsPLSR2cal = 0.82–0.98NOČica et al. (2019) [122]
Wine spirits120NIR12,500–4000 cm−1GuaiacolPLSR2 = 0.96; RMSEP = 0.0296; RPD = 5.90NOAnjos et al. (2022) [120]
4-methylguaiacolPLSR2 = 0.96; RMSEP = 0.0233; RPD = 5.36
EugenolPLSR2 = 0.95; RMSEP = 0.0049; RPD = 4.92
SyringolPLSR2 = 0.97; RMSEP = 0.1170; RPD = 6.76
4-methylsyringolPLSR2 = 0.94; RMSEP = 0.0874; RPD = 4.45
4-allylsyringoPLSR2 = 0.90; RMSEP = 0.0176; RPD = 3.19
White wine120Vis-NIR400–2500 nmEstery aromaPLSR2cv = 0.67; SEP = 0.61YES
n = 16 trained testers
Cozzolino et al. (2005) [119]
Lemon aromaPLSR2cv = 0.71; SEP = 0.40
Passionfruit aromaPLSR2cv = 0.58; SEP = 1.01
Honey aromaPLSR2cv = 0.78; SEP = 0.50
Sweetness (flavor)PLSR2cv = 0.60; SEP = 0.30
Overall flavorPLSR2cv = 0.77; SEP = 0.30
Strawberry juice122FT-NIR800–2400 nmTSSPLSR2ev = 0.979; RMSEP = 0.25; RPD = 6.8NOWłodarska et al. (2019) [118]
Total phenolic contentPLSR2ev = 0.844; RMSEP = 126.7; RPD = 2.6
Matcha drink115HSI400–998 nmAppearanceANNR2ev = 0.79; RMSEP = 3.23; RPD = 2.20YES
n = 5 trained testers
Ouyang et al. (2020) [48]
Infusion colorANNR2ev = 0.71; RMSEP = 3.43; RPD = 1.74
AromaANNR2ev = 0.67; RMSEP = 2.98; RPD = 1.76
TasteANNR2ev = 0.77; RMSEP = 2.34; RPD = 2.03
Overall qualityANNR2ev = 0.77; RMSEP = 2.56; RPD = 2.01
Fruits and vegetablesTable grapes350FT-NIR11,544–3952 cm−1Titratable acidityPLSR2cv = 0.57; RMSECV = 0.861YES
n = 82 consumers
Basile et al. (2020) [137]
TSSPLSR2cv = 0.83; RMSECV = 1.3
White and red table grapes140HSI400–1000 nmTSS (white)PLSR2cv = 0.94; RMSE = 0.06YES
n = 15 trained testers
Baiano et al. (2012) [16]
TA (white)PLSR2cv = 0.95; RMSE = 0.06
pH (white)PLSR2cv = 0.80; RMSE = 0.06
TSS (red)PLSR2cv = 0.94; RMSE = 0.12
TA (red)PLSR2cv = 0.82; RMSE = 0.25
pH (red)PLSR2cv = 0.90; RMSE = 0.12
Dates250Vis-NIR285–1200 nmHardnessPCRR2cv = 0.91; RMSE = 1.05YES
n = 10 trained testers
Alhamdan et al. (2019) [31]
ChewinessPCRR2cv = 0.68; RMSE = 3.56
CohesivenessPCRR2cv = 0.80; RMSE = 1.34
Dates200NIR-HSI950–1700 nmMoisturePLSR2ev = 0.91; RPD = 3.65; SEP = 0.82NOIbrahim et al. (2021) [154]
Dry matterPLSR2ev = 0.91; RPD = 3.69; SEP = 0.81
FirmnessPLSR2ev = 0.89; RPD = 3.42; SEP = 4.12
Pears200NIR729–975 nmDry matter harvest 2016PLSR2 = 0.90; RMSE = 0.32YES
n = 668 consumers
Serra et al. (2019) [129]
200 Dry matter harvest 2017PLSR2 = 0.94; RMSE = 0.36
Oranges600FT-NIR10,000–4000 cm−1TSSPLSR2ev = 0.83; RMSEP = 0.61YES
n = 23 consumers
Yuan et al. (2014) [125]
pHPLSR2ev = 0.73; RMSEP = 0.17
Apples380Vis-NIR400–2100 nmRoughnessPLSR2cv = 0.84YES
n = 16 trained testers
Mehinagic et al. (2003) [134]
CrunchinessPLSR2cv = 0.49
MealinessPLSR2cv = 0.41
Sweet tastePLSR2cv = 0.65
Sour tastePLSR2cv = 0.63
Tomatoes356VIS-NIR400–2499 nmGreen, unripePLSR2cv = 0.66YES
n = 9 trained testers
Li et al. (2021) [132]
SaltinessPLSR2cv = 0.85
SweetnessPLSR2cv = 0.92
UmamiPLSR2cv = 0.74
TinglingPLSR2cv = 0.78
FirmnessPLSR2cv = 0.76
SmoothnessPLSR2cv = 0.72
MealinessPLSR2cv = 0.65
Beans55NIR1100–2500 nmAromaPLSR2ev = 0.31; RMSEP = 0.77; RPD = 1.19YES
n = 11 trained testers
Plans et al. (2014) [133]
FlavorPLSR2ev = 0.70; RMSEP = 0.71; RPD = 1.62
MealinessPLSR2ev = 0.81; RMSEP = 0.81; RPD = 1.90
Seed-coat perceptionPLSR2ev = 0.26; RMSEP = 1.26; RPD = 1.16
Seed-coat roughnessPLSR2ev = 0.59; RMSEP = 1.22; RPD = 1.55
Seed-coat
brightness
PLSR2ev = 0.55; RMSEP = 0.99; RPD = 1.47
Wild rocket96 packagesMSI405–970 nmVisual freshnessPLSRMSECV = 1.5YES
n = 11 trained testers
Løkke et al. (2013) [131]
SprinklinessPLSRMSECV = 1.7
Green leavesPLSRMSECV = 1.6
Yellow leavesPLSRMSECV = 1.5
Cooked potatoes81NIR1100–2500 nmDry matterPLSR2 = 0.88–0.94; RMSEP = 6.84–12.70YES
n = 16 trained testers
Van Dijk et al. (2002) [128]
Cooked garlic85NIR1100–2500 nmSweetnessiPLSR2ev = 0.66–0.72; RMSEP = 0.76–0.73; RPD = 1.71–1.78YES
n = 8 trained testers
Sans et al. (2020) [136]
FiberiPLSR2ev = 0.58–0.42; RMSEP = 0.64–0.82; RPD = 1.41–1.10
Off flavoriPLSR2ev = 0.57–0.20; RMSEP = 0.77–1.02; RPD = 1.48–1.12
CerealsCooked rice76Vis-NIR400–2500 nmInitial starch coatingPLSR2cv = 0.76; RMSEP = 0.20YES
n = 12 trained testers
Champagne et al. (2001) [155]
SlicknessPLSR2cv = 0.53; RMSEP = 0.38
StickinessPLSR2cv = 0.58; RMSEP = 0.33
HardnessPLSR2cv = 0.67; RMSEP = 0.32
Cohesiveness of massPLSR2cv = 0.83; RMSEP = 0.22
AmylosePLSR2cv = 0.81; RMSEP = 1.91
ProteinPLSR2cv = 0.85; RMSEP = 0.38
LipidPLSR2cv = 0.90; RMSEP = 0.04
Dried fruitsWalnuts50Vis-NIR400–2500 nmPeroxide valuePLSR2cv = 0.55; RMSECV = 1.9YES
n = 9 trained testers
Jensen et al. (2001) [135]
Hexanal contentPLSR2cv = 0.72; RMSECV = 26.2
NuttyPLSR2cv = 0.77; RMSECV = 11.7
SweetPLSR2cv = 0.76; RMSECV = 7.8
RancidPLSR2cv = 0.86; RMSECV = 13.4
BitterPLSR2cv = 0.75; RMSECV = 8.8
CocoaCocoa beans48FT-NIR12,500–3600 cm−1MoisturePLSR2cv = 0.88; RMSECV = 0.21; RPD = 2.87NOKrähmer et al. (2015) [141]
pHPLSR2cv = 0.94; RMSECV = 0.11; RPD = 4.22
Free amino acidsPLSR2cv = 0.82; RMSECV = 0.25; RPD = 1.79
Nitrogen contentPLSR2cv = 0.87; RMSECV = 0.06; RPD = 2.81
Organic acidsPLSR2cv = 0.88; RMSECV = 0.14; RPD = 2.91
Acetic acidPLSR2cv = 0.67; RMSECV = 0.10; RPD = 1.75
Lactic acidPLSR2cv = 0.85; RMSECV = 0.11; RPD = 2.57
MethylxanthinesPLSR2cv = 0.74; RMSECV = 0.20; RPD = 1.98
TheobrominePLSR2cv = 0.79; RMSECV = 0.14; RPD = 2.19
CaffeinePLSR2cv = 0.26; RMSECV = 0.17; RPD = 1.16
FatPLSR2cv = 0.80; RMSECV = 1.05; RPD = 2.25
CarbohydratesPLSR2cv = 0.82; RMSECV = 0.32; RPD = 2.35
PhenolsPLSR2cv = 0.93; RMSECV = 0.25; RPD = 3.77
EpicatechinPLSR2cv = 0.93; RMSECV = 0.22; RPD = 3.69
Processed foodsBiscuits164FT-NIR10,000–4000 cm−1XanthinesPLSR2ev = 0.96; SEC/SEP= 77 mg kg−1YES
n = 8 trained testers
Bedini et al. (2013) [147]
156 10,000–4000 cm−1PolyphenolsPLSR2ev = 0.96; SEC/SEP= 3 mg kg−1YES
n = 8 trained testers
SEC: standard error of calibration, SEP: standard error of prediction, TSS: total soluble solids, R2cal: correlation coefficient.
Disclaimer/Publisher’s Note: The statements, opinions and data contained in all publications are solely those of the individual author(s) and contributor(s) and not of MDPI and/or the editor(s). MDPI and/or the editor(s) disclaim responsibility for any injury to people or property resulting from any ideas, methods, instructions or products referred to in the content.

