Article

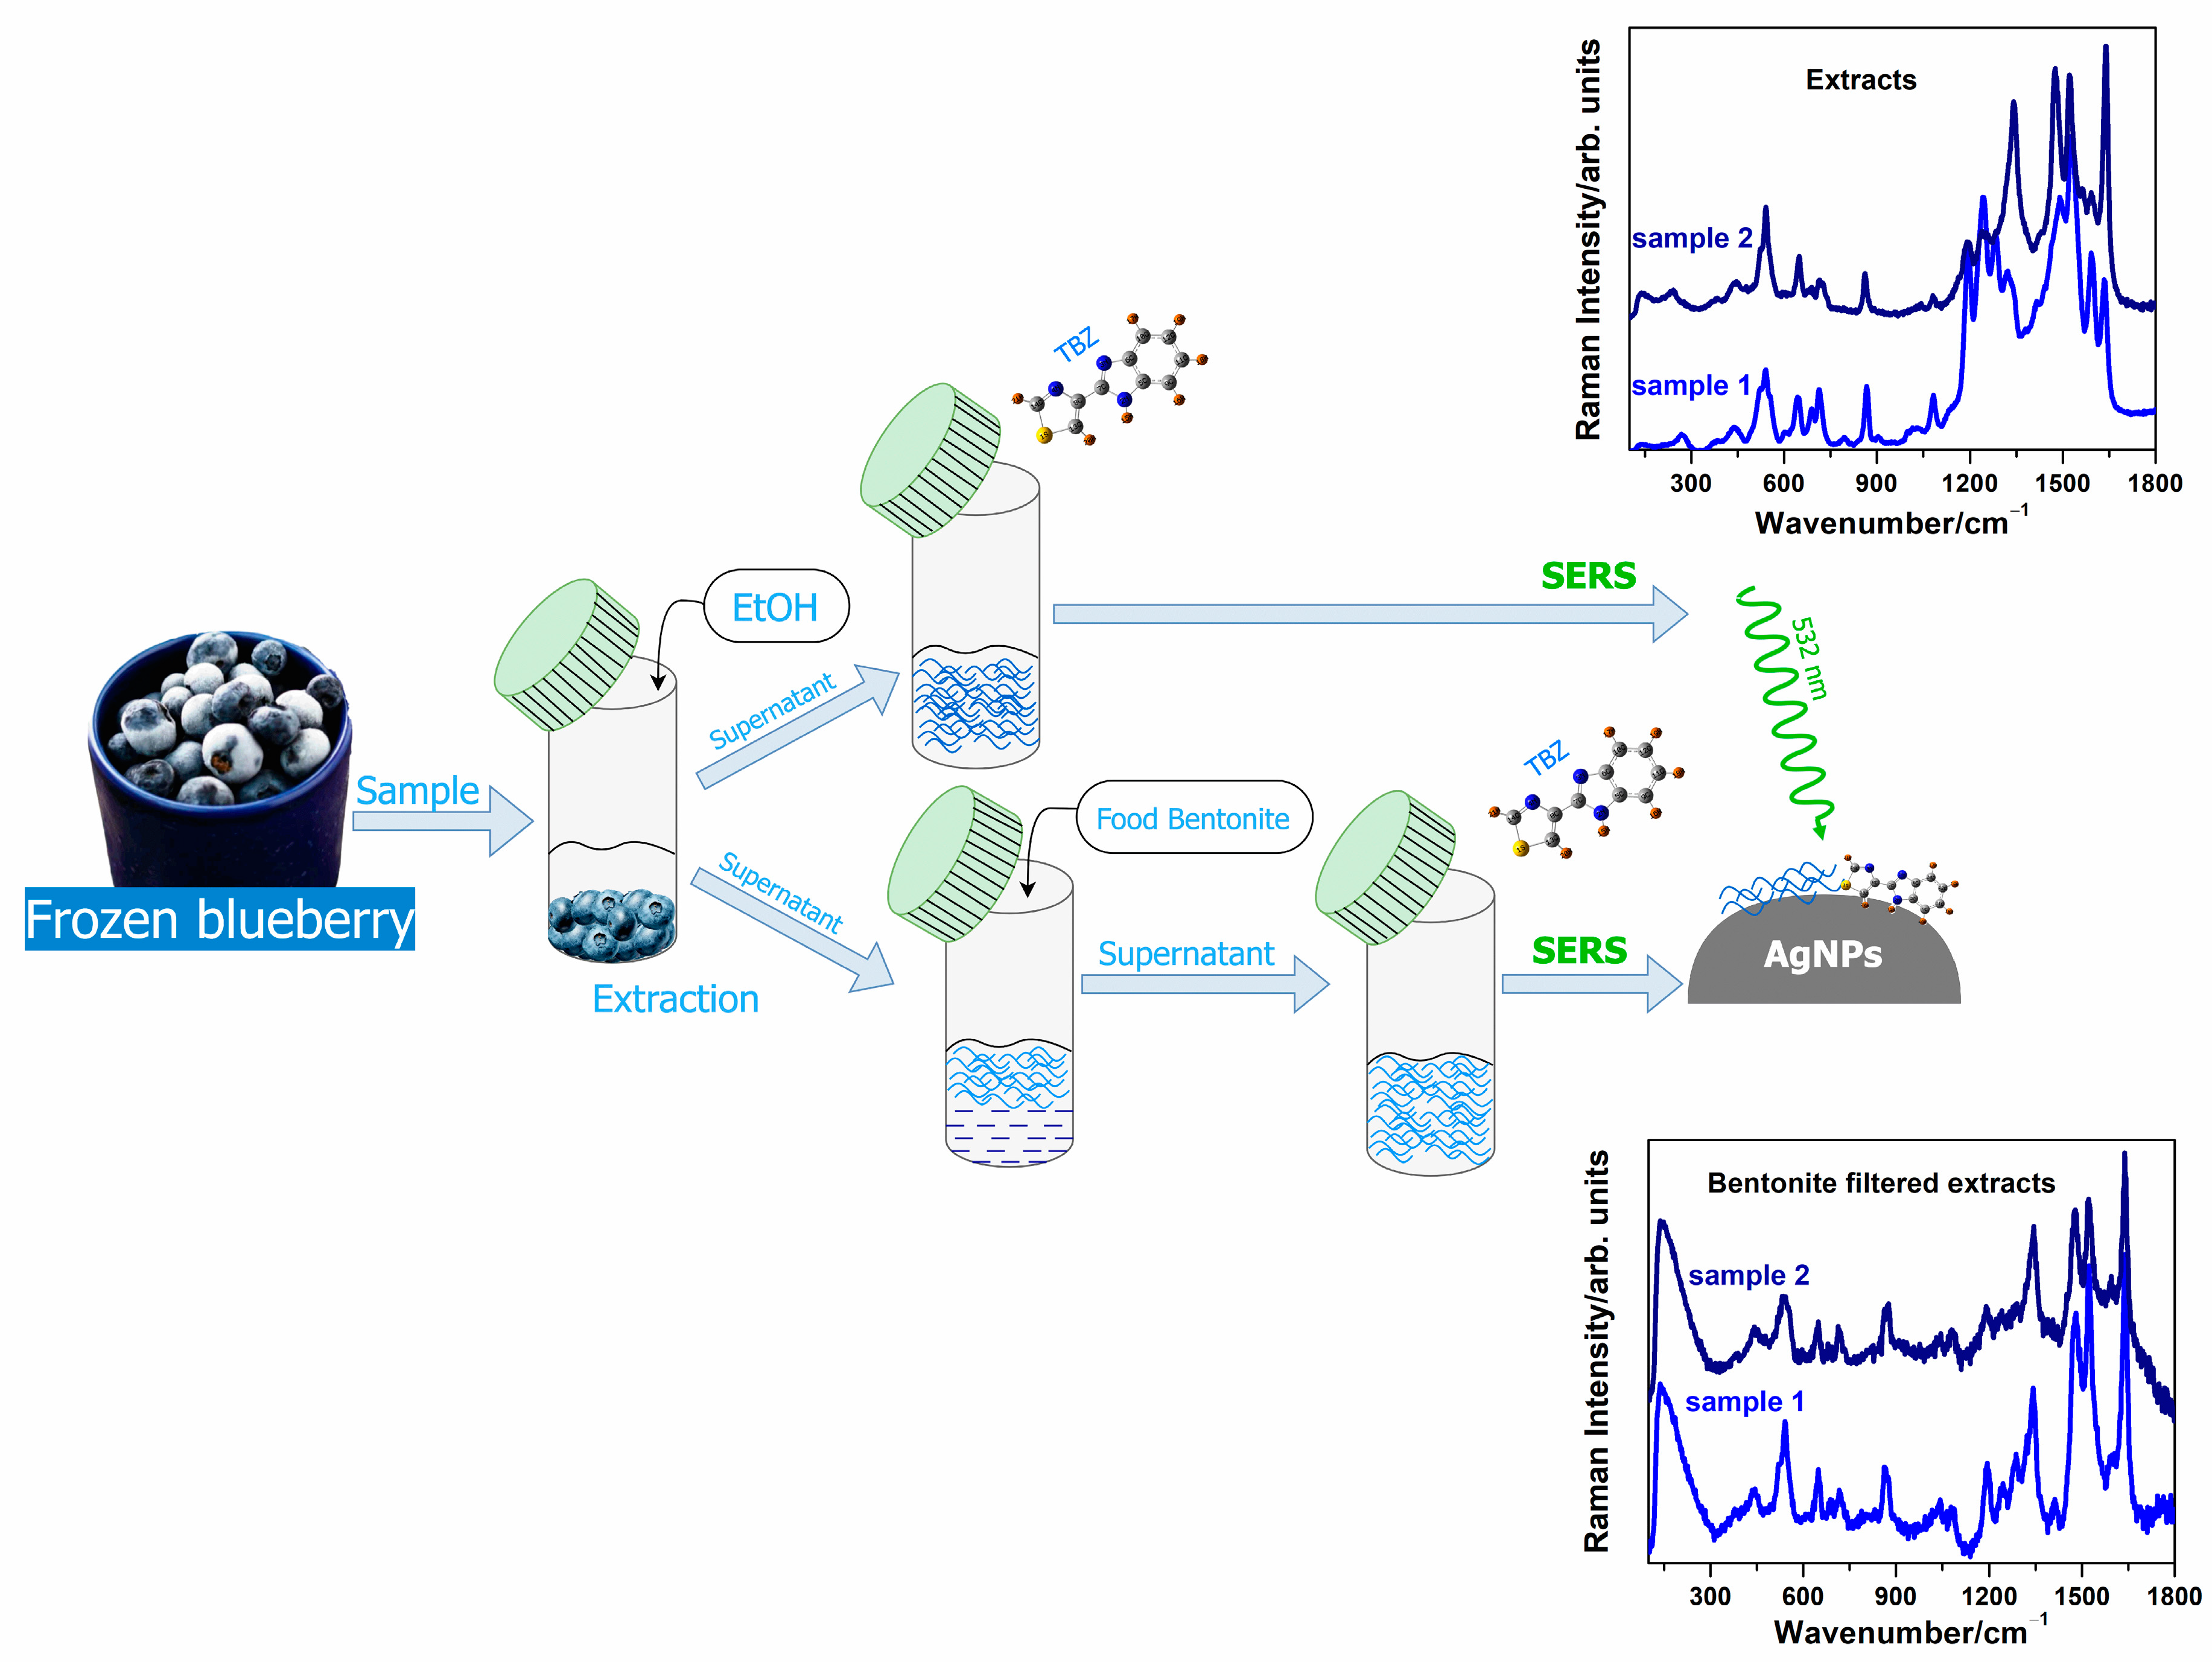
Surface-Enhance Raman Spectroscopy Detection of Thiabendazole in Frozen Food Products: The Case of Blueberries and Their Extracts

by
Csilla Müller Molnár
1,2,*,
Camelia Berghian-Groșan
1,
Dana Alina Măgdaș
1 and
Simona Cîntă Pînzaru
2,*
1
National Institute for Research and Development of Isotopic and Molecular Technologies, 67-103 Donath, 400293 Cluj-Napoca, Romania
2
Biomolecular Physics Department, Faculty of Physics, Babeş–Bolyai University, Kogălniceanu 1, 400084 Cluj-Napoca, Romania
*
Authors to whom correspondence should be addressed.
Chemosensors 2023, 11(9), 505; https://doi.org/10.3390/chemosensors11090505
Submission received: 27 June 2023 / Revised: 19 August 2023 / Accepted: 31 August 2023 / Published: 17 September 2023
(This article belongs to the Special Issue Surface-Enhanced Raman Spectroscopy for Bioanalytics)

Abstract

:
To improve the control and detection methods of thiabendazole (TBZ), a fungicide and parasiticide often used in food products, we investigated the performance of the SERS technique applied to frozen blueberry fruits available on the market. TBZ-treated fruit extracts provided a multiplexed SERS feature, where the SERS bands of TBZ could be distinctly recorded among the characteristic anthocyanidins from blueberries. Quantitative SERS of TBZ in a concentration range from 20 µM to 0.2 µM has been achieved in solutions. However, quantitative multiplexed SERS is challenging due to the gradually increasing spectral background of polyphenols from extracts, which covers the TBZ signal with increasing concentration. The strategy proposed here was to employ food bentonite to filter a substantial amount of flavonoids to allow a higher SERS signal-to-background recording and TBZ recognition. Using bentonite, the LOD for SERS analysis of blueberry extracts provided a detection limit of 0.09 µM. From the relative intensity of the specific SERS bands as a function of concentration, we estimated the detection capability of TBZ to be 0.0001 mg/kg in blueberry extracts, which is two orders of magnitude lower than the maximum allowed by current regulations.

1. Introduction

Pesticides are toxic chemicals that can be potentially hazardous to humans, animals, and other organisms, and they can damage the environment; therefore, they require strict monitoring [1]. The main intake of pesticides takes place through food ingestion, rather than through consumed water or air inhalation. Thiabendazole (TBZ), (2-(4-thiazolyl) benzimidazole, C10H7N3S, denoted as E233, is one of the most widely used pesticides to control different fungal diseases in fruits and vegetables [2]. Additionally, TBZ is used as a food additive [3].
Since fruit and vegetables are treated with plant protection products and are unprocessed when eaten, they have become the main source of pesticide residues in the human body. Nevertheless, because of the negative effects of pesticides on human health and consumer awareness regarding food safety, strict maximum residue levels (MRL) have been established by the European Food Safety Authority (EFSA) to limit consumers’ total dietary intake. The Commission Regulation (EU) 2021/1807 set maximum residue levels of TBZ (0.01 mg/kg) in fresh or frozen fruits and vegetables [4]. The Environmental Protection Agency (EPA) 40 CFR 180.242 established tolerance levels for thiabendazole, including its metabolites and degradants, in or on strawberries to 5 ppm [5]. For other berry fruits, such as the blueberry, there has been no identification of a TBZ tolerance level; only other pesticides have been investigated so far. In this context, it is of the utmost importance to develop adapted sensing protocols with great applicability in food safety and control by employing simple, affordable, and accessible techniques.
Since fresh products may not be available for the entire year, frozen products represent an affordable alternative. They are solutions both acting as agricultural commodities at relatively low costs and satisfying consumer demand for a variety of products throughout the year. Among the huge varieties of frozen products, blueberries are also continuously in demand. Due to their elevated levels of antioxidants, anthocyanidins, vitamins, and other health-beneficial microelements, nutritionists consider blueberries one of the most high-value plant-based foods, one of the so-called “superfoods” that are readily available. A problem still remains, because depending on the product’s origin, an increased amount of pesticides might be present and untraceable in frozen products due to a lack of local regulation [6].
Although it is stipulated by law that manufacturers are obliged to indicate the content of food additives on food product labels [7], the market situation is complicated. From the two available types of frozen samples, bio/eco/organic or non-bio/eco/organic, only bio/eco/organic samples have been awarded the siglum RO-ECO, which means that the use of chemical fertilizers has been avoided.
Frozen products are almost always flash-frozen the same day that they are harvested, preserving the natural nutrients and antioxidants that are present during their peak of freshness. Thus, it can be assumed that frozen fruits and vegetable products have much lower levels of pesticide and crop spray exposure and residue. However, an additive may be present in food without having been directly added as the result of a transfer from an ingredient wherein the additive was authorized, or pesticides can be absorbed from soil [8]. Subsequently, ultrasensitive monitoring of TBZ in commonly consumed food products is a current need for preventing such conditions and preventing exposure over the regulated limits.
An analysis of pesticides in food is regularly carried out using chromatographic techniques such as gas chromatography (GC), liquid chromatography (LC) [9,10], and high-performance liquid chromatography in tandem with mass spectrometry [11,12,13,14], using electrochemical sensors and biosensors for detection [15]. These methods require complicated laboratory sample preparation, are time-consuming, and need qualified persons to carry out the analysis.
In this context, one of the most promising analytical methods for the rapid, reliable, and direct detection of pesticides at trace levels, either in liquid samples or on the surface of a solid sample, is surface-enhanced Raman spectroscopy (SERS). So far, there have been no reports on using SERS for monitoring pesticides in frozen products, even though SERS-based approaches have been successfully employed for the trace-level sensing of contaminants within a wide range of food control and safety issues related to plant-based products [1,16].
Previously reported studies on red soil extracts using SERS based on AuNPs have found a TBZ concentration in the range of 0.1–10 mg/L and an LOD of 0.1 mg/L [8]. SERS has also been demonstrated to be a very effective method for the detection of pesticide residues on tomatoes [17]. In situ detection of TBZ was achieved via SERS tattoo, and revealed a detection limit of 0.2 ppm in oranges, which is below EU-specified maximum residue levels [18]. Another study detected TBZ in food by using SERS based on a silver nano-substrate combined with chemometric methods with a limit of detection of 0.1 mg/L [19]. Simultaneous detection of TBZ on the surfaces of apples, tomatoes, and pears was achieved by SERS coupled with interfacial self-assembly gold nanorod array substrates with detection limits of 0.79, 0.76, and 0.80 ng/cm2, respectively [20].
These examples highlight the possibility of TBZ detection from fruit samples through SERS if silver nanoparticles are involved, being similar to other results reported in the literature for various types of pesticides, as summarized in Supplementary Table S1.
The present study aimed to assess the detection capability of SERS techniques for TBZ in frozen products available on the market. A particular application was developed for randomly selected frozen market products, such as blueberries. In frozen fruits, traces of pesticides can occur if they were previously applied to fresh products before freezing and commercialization. Thus, here, we selected two independent stocks of commercially available blueberries and, furthermore, their crude extracts of frozen fruits. The extracts were subject to spectroscopic analysis in their raw form and were subsequently tested using SERS to find the characteristic fingerprints of TBZ. Moreover, several extracts were artificially exposed to TBZ and subsequently tested regarding the quantitative assessment of TBZ using SERS.
Quantitative multiplexed SERS is challenging due to gradually increasing spectral background polyphenols from extracts, which cover the TBZ signal in increasing concentrations. The strategy employed here proposed food bentonite to filter a substantial amount of flavonoids co-existent in extracts, in order to probe higher SERS signal-to-background recording and TBZ recognition.
Bentonite is an absorbent swelling clay especially used as a filter, with the ability to absorb large quantities of water or solutions [21]. We consider this biochemical precipitation step a key aspect of our sensing technique for trace levels of TBZ, and also an original approach in combination with SERS as an analytical tool.

2. Material and Methods

2.1. Materials

The TBZ, C10H7N3S, was purchased from Sigma-Aldrich as a powder ≥99%. Food bentonite (100 g) was purchased from a local market by producer Mifalchim. Food bentonite for the wine industry (vinification) is a product made from clay rock (bentonite) to stabilize wines and give them transparency. We used it to adsorb macromolecular ingredients from fruits extracts to lower their fluorescence when exposed to Raman analysis and SERS.

2.2. Silver Colloid Synthesis

As the SERS active surface, silver colloids prepared according to the Leopold and Lendl method were used [22]. The materials required for the preparation of the colloid, the hydroxylamine hydrochloride, and silver nitrate were purchased from Sigma-Aldrich, and the sodium hydroxide from Merck.
Briefly, the colloid was prepared by dissolving 0.017 g of AgNO3 in 90 mL of water. Separately, 0.021 g of hydroxylamine hydrochloride (HONH2·HCl) was dissolved in 5 mL water, and 4.5 mL 0.1 M sodium hydroxide was added. The mixture was rapidly added to the AgNO3 solution, and in a few seconds, a grey-brown solution was obtained. The resulting AgNPs were freshly characterized using UV-VIS absorption spectroscopy, and their absorbance peaked at 412 nm, in line with the previous characterization. The Raman spectrum of the blank colloid sowed only weak bands of water, as expected.

2.3. Sample Preparation and Analysis

2.3.1. Concentration Dependence SERS Spectra of TBZ

Different concentration stock solutions of TBZ in the 10−3 to 10−6 mol L−1 range were prepared from TBZ powder dissolved in ethanol of analytical purity. SERS samples were prepared by adding 10 µL from each TBZ stock solution to 490 µL colloidal Ag and measured immediately after preparation. The TBZ final SERS final concentrations were in the range of 2 × 10⁻⁵ mol L−1 (20 µM) to 2 × 10⁻⁸ mol L−1 (0.2 µM).

2.3.2. SERS Spectra of the Frozen Blueberry Fruit Extracts and TBZ-Treated Extracts

Several frozen fruit stocks of both EU and non-EU provenance were acquired from popular local markets and employed for sampling. Their labeling comprises the nutritional information, but any information regarding their potential chemical treatment or contamination is not specified; only the package of bio/organic/eco frozen fruit samples had labels indicating they were from ECO Agriculture, the principle of which is no-chemical synthetic pesticides and fertilizers [23,24].
Subsamples were prepared from each stock by immersing 1g of frozen fruit in 1.5 mL of ethanol of analytical purity. Strongly colored extracts were obtained after 24 h. The supernatant was carefully separated, sealed, and deposited in cold and dark conditions for further use. All crude extracts were analyzed with SERS by adding 10 µL from each extract to 490 µL colloidal Ag, and measured immediately.
To evaluate the detection of TBZ in frozen fruit samples, two bio/eco/organic extracts of these frozen fruits were chosen. Specifically, two blueberry stocks from different producers and origins were selected. These extracts were utilized to create TBZ-treated frozen fruit extracts for probing TBZ detection in samples. The TBZ samples were made by adding a 10−3 M solution of TBZ to the fruit extract solution in a proportion of 1/1 (v/v). For TBZ-treated extract solutions, SERS samples were made by adding 1 µL to 490 µL silver colloidal solution. A small amount of 1, 2, 3, 4 and 5 µL of the resulting mixed solution was further used for SERS sampling and immediate spectra recording. The SERS solutions were measured immediately after preparation. The SERS spectra were recorded from each in triplicate, and the average spectrum has been further used for analyses.

2.3.3. SERS Spectra of the Bentonite-Filtered Extracts

The second set of experiments employed bentonite for lowering the polyphenolic content of extracts. The bentonite filtered samples were made by adding 0.0625 g food bentonite powder to 500 µL extract solution. The obtained mixtures were stirred for about 1 min, afterward being left for 3 h to rest, thereby resulting in a bentonite-filtered sample. The supernatant was further separated and used for SERS analyses. The TBZ-treated bentonite filtered samples were made by adding a 10−3 M solution of TBZ to extract the supernatant from the bentonite solution in a proportion of 1/1 (v/v). A small amount of 1, 2, 3, 4, and 5 µL of resulting bentonite-filtered solution was further used for SERS sampling and immediate spectra recording. The illustrative graphical sketch of the successive steps taken to conduct SERS analysis for TBZ detection is presented in Figure 1.

2.4. Instrumentation

The SERS spectra were recorded using a Confocal Renishaw InVia Reflex Raman system with a 532 nm line for excitation and an output power of 100 mW. SERS spectra were recorded in triplicate in the 50–1800 cm−1 spectral range with 0.5 cm−1 resolution.
The TBZ concentration values reached by SERS are indicated on each spectrum. The experiments were conducted three times using different samples prepared from the same lot. All the measurements were performed at room temperature.

3. Results

3.1. SERS Spectra of the Frozen Blueberry Fruit Extracts

Several frozen blueberry fruit stocks, both bio/ecologic/organic and non-bio/ecologic/organic, were acquired from popular local markets and employed for sampling. Their extracts were investigated with SERS by adding 10 µL from each extract solution to 490 µL colloidal Ag, and measured immediately. Figure 2 shows the bio (olive color and non-bio (blue color) blueberry extracts’ SERS spectra in comparison with the SERS spectra of TBZ at 10−3 M concentration (red color).
Blueberries are rich in flavonoids and their extracts SERS signature is characteristic of these compounds. The most intense SERS bands of catechins were reported at 1035/1039 cm−1, 1328 cm−1, and 1513 cm−1. Anthocyanins are also expected to be observed as prominent SERS bands in the ranges of 1325–1339 cm−1, 1516–1545 cm−1, and one distinct, intense band between 1624–1645 cm−1, among others [25].
Supplementary Table S2 summarizes the observed bands in SERS spectra of frozen blueberry extracts and their vibrational bands’ assignment based on the literature [25].
Independent blueberry stocks provided similar SERS signals in terms of band positions, but with slight differences in their relative intensity, indicating a slightly different balance of flavonoids content from one stock fruit to another. Among the flavonoids’ bands, the TBZ fingerprint could not be observed in raw extracts.
The crude extracts’ SERS analyses clearly showed the absence of the TBZ SERS bands, which could suggest that the purchased stocks of market fruits were free of TBZ (or that TBZ was not detectable in all randomly acquired fruit stocks).

3.2. The Concentration Dependence SERS Spectra of TBZ

A series of SERS spectra of 20 µM to 0.2 µM TBZ solution are presented in Figure 3A. The SERS spectra at the chosen concentrations showed reproducible features, meaning that the main SERS bands are observed with similar relative intensities and band positions. Theoretically, the SERS effect could be influenced by concentrations, in a certain range exceeding the so-called coverage effect (many molecules, completely occupying every plasmonic surface, which could completely change the SERS feature in terms of observed bands).
The most significant SERS bands are observed at 1618, 1571, 1400, 1318, 1005, and 778 cm−1, in agreement with previous reports on SERS of TBZ on various nanostructured substrates [19,26,27,28]. Additional weak and medium peaks are also observed, as summarized in Supplementary Table S3, along with their vibrational assignment. Taking into account the SERS selection rules, which explain the strong enhancement on the nanoparticles’ surface, SERS data suggested an approach orientation of the TBZ skeletal molecular structure relative to the AgNPs’ surface via N atoms. The presence of the SERS band at 239 cm−1 attributed to the Ag-N in SERS complex supports molecular chemisorption with respect to the AgNPs’ surface [29].
The SERS spectral shape suggests that the concentration decreasing does not affect the orientation of the adsorbed species with respect to the Ag surface in the discussed concentration range (from 20 µM to 0.2 µM). The SERS spectral shape of TBZ at 2 × 10⁻⁷ mol L−1 (0.2 µM) is still consistent with the main fingerprint of the TBZ.
Figure 3B–D shows the linear relationship between the SERS intensity of the main TBZ peaks and the TBZ concentrations. Based on the concentration dependence spectra of TBZ, linear regression equations describing the intensity variation with concentration of the three most prominent Raman bands at 778, 1005, and 1571 cm−1 were established. The TBZ concentrations were 0.5, 2, 5, 10, and 20 µM, respectively. Although visible as weak bands, at the lower concentration values of TBZ, the overall SERS feature is changed for very low concentrations, suggesting a slightly different orientation mechanism of the molecules with respect to the nanoparticles’ surface. Consequently, the SERS feature at lower concentrations, although useful for observing the TBZ weak bands, was not included in the calibration curves due to the different mechanisms governing their overall SERS feature.
With the increase in TBZ concentration, the SERS intensity at 1571 cm−1, gradually increased, which was used for quantitative SERS analysis with R2 = 0.96064 (Figure 3B). For the third important band of TBZ spectra (778 cm−1), an acceptable correlation was obtained for the investigated concentration range, (Figure 3D). The band at 778 cm−1 is assigned to the υ(C-S) and breathing mode of the penta ring of TBZ, as shown in the Supplementary Material, Table S3. This medium band is less sensitive to lower concentrations, in line with previously cited studies [28] (indicating a TBZ SERS affinity to AgNPs via N atoms rather than S atoms); thus, this vibrational mode is not directly involved in the SERS adsorption process. The cited reference also supports these considerations, highlighting that at a concentration of 0.1 µm, the 778 cm−1 band is not visible in their SERS spectrum. This is because for the main SERS band of TBZ at 1571 cm−1, the linear correlation coefficient was superior, and we can assume a strong linear correlation between the SERS signal intensity and the concentration of TBZ. In other words, the main band at 1571 cm−1 is directly related to the SERS adsorption, due to the interaction of the skeletal TBZ structure via N atoms. Consequently, the SERS technique proves to be reliable and accurate in quantifying the TBZ analyte in the sample, allowing for precise and accurate measurements to be obtained.
The successful quantitative dependency of SERS intensity on the TBZ concentrations readily enables the present SERS assay of in situ monitoring of pesticides.

3.3. SERS Spectra of the TBZ-Treated Frozen Blueberry Fruit Extracts (Multiplexed SERS)

The TBZ samples were made by adding a 10−3 M solution of TBZ to fruit extract solutions in proportion a of 1/1 (v/v). For TBZ-treated extract solutions, SERS samples were made by adding 1 µL to 490 µL silver colloidal solution. A small amount of 1, 2, 3, 4 and, 5 µL of the resulting mixed solution was used for SERS sampling. The TBZ-treated fruit extracts provide a multiplexed SERS feature, where the SERS bands of TBZ could be distinctly recorded among the characteristic anthocyanins from blueberries; thus, TBZ is detectable in a pool of flavonoids.
The measurements were conducted for two independent and randomly selected blueberry stocks, denoted stock 1 and stock 2 in Figure 4. SERS measurements were run in similar conditions, and the SERS protocol was similar. The volume ratio of extract to TBZ solutions used revealed that increasing the amount of sample (extract + TBZ) results in increasing the SERS background, along with the increased TBZ characteristic SERS bands (Figure 4A, E). Even so, data analysis revealed that the three main bands of TBZ at 1571, 1005, and 778 cm−1 were detectable in the multiplexed SERS feature among the flavonoid bands, and their intensity increased with the increasing TBZ concentration. The linear fit of intensity plot of the three main bands of TBZ at 1571, 1005, and 778 cm−1 as a function of concentration showed a coefficient R2 of 0.81, 0.94 and 0.93 (Figure 4B–D) for stock 1 and 0.98, 0.89, and 0.91 (Figure 4F–H) for stock 2, respectively, as comparatively shown in Figure 4 for the two independent stocks. Thus, using any of the three main bands of TBZ, the limit of detection was submicromolar in each case, as indicated in Figure 4.
Due to the multiplexed SERS signature of the berry extracts and TBZ, we further used an original approach to lower the extract molecular contribution of complex samples to the overall SERS signature, namely by filtering the fruit extracts on bentonite to reduce the flavonoid content, which is responsible for the increased SERS background with the increasing concentration of TBZ-treated extract on AgNPs.
Bentonite is known to adsorb efficiently; thus, we assume substantial adsorption of major molecular compounds from extracts. Therefore, the signal of TBZ is expected to be more effectively observed in a SERS analysis for the purpose of quantification.

3.4. SERS Spectra of Bentonite-Filtered Extracts

Bentonite appeared to adsorb a significant amount of compounds from crude extracts; thus, the comparative spectra of crude extracts and bentonite-filtered extracts revealed a much weaker SERS signal of the latter, as depicted for the two cases in Figure 5. It is worth mentioning that the two extracts denoted 1 and 2 in Figure 5 showed different balances of compounds, the most common being flavonoids, including catechins, epicatechins, and anthocyanins [30].
Catechins were previously studied using SERS, and their prominent bands were used for quantitative analysis [31]. Thus, using AgNPs, the bands of extracts are expected to reveal the most intense SERS bands of catechins, which were reported at 1035/1039 cm−1, 1328 cm−1, and 1513 cm−1. Anthocyanins are also expected to be observed as prominent SERS bands in the ranges 1325–1339 cm−1, 1516–1545 cm−1 range, and one distinct, intense band between 1624–1645 cm−1, among others [25]. Unfortunately, these spectral ranges are very common for multiple flavonoid compounds; therefore, analyzing the SERS bands’ positions in a blueberry extract, it is difficult to precisely identify one flavonoid from another. Certainly, their balance in the two extracts is different, as the relative intensities of the SERS bands of two distinct crude extracts in Figure 5 are different in similar SERS experimental conditions. However, the same band positions are observed in both investigated sample extracts, indicating that the SERS method applied here to control the presence of TBZ is effective, although crude extracts from different provenances show different balances of flavonoids.
The crude extracts’ SERS analyses clearly showed the absence of the TBZ SERS bands, which could suggest that the two independent stocks of market fruits were free of TBZ.
Comparing the bands’ positions in the filtered versus non-filtered berry extracts on bentonite from Figure 5, it appears that bentonite adsorbs a significant number of flavonoid compounds; moreover, the SERS bands after bentonite filtration appeared with small shifts, which may indicate that certain compounds (very sensitive to pH) are adsorbed, and the remnants in the solution above bentonite clay are distinct compounds with less adsorption availability.
Thus, we can tentatively conclude that the number and amount of flavonoids from extracts are substantially lowered by bentonite adsorption. The supernatant on bentonite is likely to reveal a lesser fluorescence background in the SERS spectra of bentonite-treated extracts.

3.5. SERS Spectra of the Bentonite-Filtered Extracts Treated with TBZ

The TBZ samples were made by adding a 10−3 M solution of TBZ to bentonite filtered fruit extracts solution in a proportion of 1/1 (v/v). For TBZ-treated bentonite filtered extract solutions, SERS samples were made by adding 1 µL to 490 µL silver colloidal solution. A small amount of 1, 2, 3, 4 and 5 µL of resulting mix solution was used for SERS sampling.
The SERS spectra of bentonite-filtered blueberry extracts shown in Figure 6 (upper: stock 1, lower- stock 2, as indicated) treated with TBZ clearly show an increased intensity of the TBZ SERS bands with increasing concentration. The insert in Figure 6 shows the spectral details of the three main bands of TBZ, at 1571, 1005, and 778 cm−1, respectively, and the plot of SERS intensity of these bands of TBZ as a function of concentration. A linear fit with a slightly different R2 coefficient of determination and the LOD is given in each plot. Error bars represent the relative error of each determination (percentage). In this case, the LOD of TBZ was 0.09 µM when the main SERS band of TBZ at 1571 cm−1 was used, and 0.15 and 0.17 µM in the case of using the bands at 1005 and 778 cm−1, respectively. Note the lower LOD compared to that from Figure 4 (non-filtered on bentonite). The slightly different values are due to the complex mechanism of SERS enhancement underlying the specific polarizability components of each vibrational mode in the discussion. Overall, comparing Figure 4 and Figure 6, the bentonite-treated fruit extracts allowed for the lowering of the limit of detection within an order of magnitude (from 0.4 to 0.09 µM).
Bentonite will not influence the TBZ content, regardless of adding it before or after filtering. According to literature [32], bentonite adsorbs cations, having a high cation exchange capacity (CEC) [33]. Thiabendazole could be potentially adsorbed, provided that changing the ionization status is achieved, namely passing from a neutral to a protonated form. In the present study, the TBZ solution has a pH of 7. According to PubChem, Thiabendazole is “stable in water and in acid and alkaline solution; stable under normal conditions to hydrolysis, light, and heat” [34], and its dissociation constant is pKa 4.64 (at 25 °C).
Furthermore, in our previous study on the detection of thiabendazole applied to citrus fruits and bananas using SERS [27], we conducted theoretical calculations of the pKa values of TBZ molecule using ACD/LABS pKa calculator software, version 2010-2013 ACD/LABS. The theoretical predictions indicated that the first protonated form (N from ring 2) appears at pKa 3.4”. The cumulative conclusions from the above-cited references are that in the TBZ solution used herein, the TBZ species is present in a neutral form, and not protonated; thus, it is not suitable as a cation for adsorption on bentonite.
These bentonite-treated versus non-treated extracts were further comparatively investigated regarding SERS detection of TBZ. The SERS spectra of the bentonite-treated versus non-treated extracts treated with TBZ 10−3 M are displayed in Figure 7.
The bentonite filtered samples treated with TBZ were made by adding a 10−3 M solution of TBZ to extract the supernatant on bentonite in a proportion of 1/1 (v/v). From this solution, 1 µL was added to 490 µL AgNPs and used for SERS measurements. The spectral difference in every case is calculated and displayed in Figure 7C, D for stock 1, and Figure 7G, H, for stock 2.
Comparing the band intensities at 1571 cm−1 in Figure 7B, F of the filtered versus non-filtered extracts on bentonite-filtered extract treated with TZB, it appears that when a larger amount of mixed solution was added to the AgNPs, the SERS band intensities decreased.
This observation does not contradict our previous statement that with the increasing concentration of the TBZ, the fingerprint bands’ intensities increase merely with an increase in the amount of TBZ extract; the overall fluorescence background is increased, to the detriment of the signal-to-background ratio.
Raw SERS spectra of blueberry fruit extract from independent market fruit stock (sample 2) were used to validate the method. In comparison with the raw TBZ-treated fruit extract, the bentonite-filtered extract revealed, upon spectral differences, a clear SERS signature of the TBZ, indicating unambiguous detection of the added TBZ. The calculated spectral differences (between TZB-treated and normal) from Figure 7A,B are plotted in Figure 7C,D, respectively. SERS of TBZ is shown in the dotted spectrum from Figure 7D for the eye guide.

4. Conclusions

The sensitivity of the proposed method allows for the efficient monitoring of TBZ in solutions resulting from frozen fruit extracts reaching the detection limits (LOD) of this approach at 10−7 M. The blueberry fruit extracts control for TBZ via SERS, resulting in a multiplexing assay; this is due to the strong SERS signal of anthocyanins, which is characteristic of these fruit products. Here, we employed bentonite to adsorb a substantial amount of molecular extracts and lower the SERS background for improved SERS detection of TBZ in frozen fruits.
This work proposes a simple, affordable, and sensitive method for the improved detection of TBZ from blueberry samples, involving the bentonite filtration and subsequent SERS supernatant analysis of flavonoid-rich frozen fruit extracts. Through this approach, it was possible to get rid of the main SERS fingerprint bands, which are characteristic of the blueberry fruits, by extaracting them.
The sensitivity of the proposed method allows for the efficient monitoring of TBZ in solutions resulting from frozen fruit extracts. Thus, using bentonite, the LOD for SERS analysis allowed a detection limit of 0.09 µM. More precisely, from the relative intensity of the specific SERS bands as a function of concentration, we estimated a total amount of TBZ of 0.0001 mg/kg in blueberry extracts, which is two orders of magnitude lower than the maximum allowed by current regulations.
To validate, an independent stock of frozen fruits was taken for analysis, and a similar approach was applied. This analysis showed that the blueberry fruits exhibited slightly different molecular ratios of the main compounds, revealing the strongest SERS bands; the detection capability of the technique produced evidence of TBZ from artificially treated fruits. This approach shows promise for a fast and cheap food control approach when a robust SERS calibration curve is available. By these means, we were able to increase the specificity and performance of TBZ detection on real-world samples, by reaching an LOD two orders of magnitude lower than the maximum allowed by current regulations. The demonstrated practical efficiency and the very low costs of SERS-based TBZ sensing in frozen products mean we can recommend our approach as a promising alternative in the food safety monitoring of omnipresent pesticides in commercial products.

Supplementary Materials

The following supporting information can be downloaded at: https://www.mdpi.com/article/10.3390/chemosensors11090505/s1, Table S1: Detection of pesticides from fruits and vegetables using SERS substrates [35,36,37,38,39,40,41,42,43,44,45,46,47,48,49,50,51,52,53]; Table S2: The proposed assignment of SERS peaks of frozen blueberry extracts [25]; Table S3: The proposed assignment of the main Raman and SERS bands of TBZ on the hydrox-ylamine-reduced AgNPs [19,26,27,28].

Author Contributions

Conceptualization, C.M.M. and S.C.P.; methodology, C.M.M. and S.C.P.; software, C.M.M.; validation, C.M.M. and S.C.P.; investigation, C.M.M. and S.C.P.; resources, S.C.P. and D.A.M.; data curation, C.M.M.; writing—original draft preparation, C.M.M., C.B.-G. and S.C.P.; writing—review and editing, D.A.M. and S.C.P.; visualization, C.M.M.; supervision, S.C.P. and D.A.M.; project administration, C.M.M.; funding acquisition, C.M.M. All authors have read and agreed to the published version of the manuscript.

Funding

This research was funded by the Executive Agency for Higher Education, Research, Development and Innovation Funding (UEFISCDI), Programmes: PN-III-P2-2.1-PED-2019-3004. Project number 359PED from 23/10/2020 (Rapid detection of Thiabendazole pesticide in frozen fruits and vegetables commercialized on Romanian stores) (C.M.M.).

Institutional Review Board Statement

Not applicable.

Informed Consent Statement

Not applicable.

Data Availability Statement

Not applicable.

Acknowledgments

This research was funded by Executive Agency for Higher Education, Research, Development and Innovation Funding (UEFISCDI), Programmes: PN-III-P2-2.1-PED-2019-3004. Project number 359PED from 23/10/2020 (Rapid detection of Thiabendazole pesticides in frozen fruits and vegetables commercialized in Romanian stores) (Cs.M.). This work was supported by the Ministry of Research, Innovation and Digitization, CCDI-UEFISCDI, through the project 37PFE/30.12.2021, within PNCDI III.

Conflicts of Interest

The authors declare no conflict of interest.

References

  1. Xu, M.L.; Gao, Y.; Han, X.X.; Zhao, B. Detection of Pesticide Residues in Food Using Surface-Enhanced Raman Spectroscopy: A Review. J. Agric. Food Chem. 2017, 65, 6719–6726. [Google Scholar] [CrossRef]
  2. Veneziano, A.; Vacca, G.; Arana, S.; De Simone, F.; Rastrelli, L. Determination of Carbendazim, Thiabendazole and Thiophanate-Methyl in Banana (Musa Acuminata) Samples Imported to Italy. Food Chem. 2004, 87, 383–386. [Google Scholar] [CrossRef]
  3. Castillo, L.E.; Ruepert, C.; Solis, E. Pesticide Residues in the Aquatic Environment of Banana Plantation: Areas in the North Atlantic Zone of Costa Rica. Environ. Toxicol. Chem. 2000, 19, 1942–1950. [Google Scholar] [CrossRef]
  4. European Commission. Commission Regulation (Eu) 2021/1807. Off. J. Eur. Union 2021, 51, 1–37. [Google Scholar]
  5. Environmental Protection Agency. Thiabendazole; Tolerances for Residues; Environmental Protection Agency: Chicago, IL, USA, 2022; pp. 552–553. [Google Scholar]
  6. Wolfgang Bödeker Pesticide Atlas-Health. Available online: https://eu.boell.org/en/PesticideAtlas-health (accessed on 18 October 2022).
  7. European Council. Regulamentul (CE) NR. 1333/2008 al Parlamentului European și al Consiliului din 16 Decembrie 2008 Privind Aditivii Alimentari; European Council: Brussels, Belgium, 2010; Volume 40, pp. 1–89.
  8. Zheng, D.; Hu, X.; Fu, X.; Xia, Z.; Zhou, Y.; Peng, L.; Yu, Q.; Peng, X. Flowerlike Ni-NiO Composite as Magnetic Solid-Phase Extraction Sorbent for Analysis of Carbendazim and Thiabendazole in Edible Vegetable Oils by Liquid Chromatography-Mass Spectrometry. Food Chem. 2022, 374, 131761. [Google Scholar] [CrossRef]
  9. Almutairi, M.; Alsaleem, T.; Al Herbish, H.; Al Sayari, A.A.; Alowaifeer, A.M. LC-MS/MS and GC-MS/MS Analysis of Pesticide Residues in Ecuadorian and Filipino Cavendish Bananas Imported into Saudi Arabia. Food Addit. Contam. Part A Chem. Anal. Control Expo. Risk Assess. 2021, 38, 1376–1385. [Google Scholar] [CrossRef]
  10. Choi, S.I.; Han, X.; Lee, S.J.; Men, X.; Oh, G.; Lee, D.S.; Lee, O.H. Validation of an Analytical Method for the Determination of Thiabendazole in Various Food Matrices. Separations 2022, 9, 135. [Google Scholar] [CrossRef]
  11. Fares, N.V.; Hassan, Y.A.A.; Hussein, L.A.; Ayad, M.F. Determination of Fungicides’ Residues and Their Degradation Kinetics in Orange Tree Fruits Using Liquid Chromatography—Tandem Mass Spectrometry Coupled with QuEChERS Method. Microchem. J. 2021, 168, 106376. [Google Scholar] [CrossRef]
  12. Calero, M.; Fernández, R.; García, M.; Juan-borrás, M.; Escriche, I.; Arnau, A.; Montoya, Á.; Jiménez, Y. High Fundamental Frequency (HFF) Monolithic Quartz Crystal Microbalance with Dissipation Array for the Simultaneous Detection of Pesticides and Antibiotics in Complex Food. Biosensors 2022, 12, 433. [Google Scholar] [CrossRef] [PubMed]
  13. Mao, X.; Wang, Y.; Jiang, L.; Zhang, H.; Zhao, Y.; Liu, P.; Liu, J.; Hammock, B.D.; Zhang, C. A Polydopamine-Coated Gold Nanoparticles Quenching Quantum Dots-Based Dual-Readout Lateral Flow Immunoassay for Sensitive Detection of Carbendazim in Agriproducts. Biosensors 2022, 12, 83. [Google Scholar] [CrossRef]
  14. Budetić, M.; Samardžić, M.; Bubnjar, K.; Dandić, A.; Živković, P.; Széchenyi, A.; Kiss, L. A New Sensor for Direct Potentiometric Determination of Thiabendazole in Fruit Peels Using the Gran Method. Food Chem. 2022, 392, 133290. [Google Scholar] [CrossRef] [PubMed]
  15. Lin, Z.; He, L. Recent Advance in SERS Techniques for Food Safety and Quality Analysis: A Brief Review. Curr. Opin. Food Sci. 2019, 28, 82–87. [Google Scholar] [CrossRef]
  16. Nie, P.; Dong, T.; Xiao, S.; Lin, L.; He, Y.; Qu, F. Quantitative Determination of Thiabendazole in Soil Extracts by Surface-Enhanced Raman Spectroscopy. Molecules 2018, 23, 1949. [Google Scholar] [CrossRef]
  17. Tao, M.; Fang, H.; Feng, X.; He, Y.; Liu, X.; Shi, Y.; Wei, Y.; Hong, Z. Rapid Trace Detection of Pesticide Residues on Tomato by Surface-Enhanced Raman Spectroscopy and Flexible Tapes. J. Food Qual. 2022, 2022, 6947775. [Google Scholar] [CrossRef]
  18. Wang, C.M.; Roy, P.K.; Juluri, B.K.; Chattopadhyay, S. A SERS Tattoo for In Situ, Ex Situ, and Multiplexed Detection of Toxic Food Additives. Sens. Actuators B Chem. 2018, 261, 218–225. [Google Scholar] [CrossRef]
  19. Lin, L.; Dong, T.; Nie, P.; Qu, F.; He, Y.; Chu, B.; Xiao, S. Rapid Determination of Thiabendazole Pesticides in Rape by Surface Enhanced Raman Spectroscopy. Sensors 2018, 18, 1082. [Google Scholar] [CrossRef] [PubMed]
  20. Hu, B.; Sun, D.W.; Pu, H.; Wei, Q. Rapid Nondestructive Detection of Mixed Pesticides Residues on Fruit Surface Using SERS Combined with Self-Modeling Mixture Analysis Method. Talanta 2020, 217, 120998. [Google Scholar] [CrossRef]
  21. “0Bentonite”, Lexico, Lexico UK English Dictionary, Oxford University Press., Archived from the original on 27 April 2021. Available online: https://www.dictionary.com/browse/bentonite (accessed on 26 June 2023).
  22. Stiufiuc, R.; Iacovita, C.; Lucaciu, C.M.; Stiufiuc, G.; Dutu, A.G.; Braescu, C.; Leopold, N. SERS-Active Silver Colloids Prepared by Reduction of Silver Nitrate with Short-Chain Polyethylene Glycol. Nanoscale Res. Lett. 2013, 8, 47. [Google Scholar] [CrossRef]
  23. Information, B.; Labelling, O. Brief Information about the Organic Labeling According to Reg. (EC) 834/07 (Including Reg. (EC) 271/10), NOP and JAS; CERES: Boston, MA, USA, 2022; pp. 6–8. [Google Scholar]
  24. Jacquet, F.; Jeuffroy, M.H.; Jouan, J.; Le Cadre, E.; Litrico, I.; Malausa, T.; Reboud, X.; Huyghe, C. Pesticide-Free Agriculture as a New Paradigm for Research. Agron. Sustain. Dev. 2022, 42, 8. [Google Scholar] [CrossRef]
  25. Zaffino, C.; Russo, B.; Bruni, S. Surface-Enhanced Raman Scattering (SERS) Study of Anthocyanidins. Spectrochim. Acta Part A Mol. Biomol. Spectrosc. 2015, 149, 41–47. [Google Scholar] [CrossRef]
  26. Kim, M.S.; Kim, M.K.; Lee, C.J.; Jung, Y.M.; Lee, M.S. Surface-Enhanced Raman Spectroscopy of Benzimidazolic Fungicides: Benzimidazole and Thiabendazole. Bull. Korean Chem. Soc. 2009, 30, 2930–2934. [Google Scholar] [CrossRef]
  27. Müller, C.; David, L.; Chiş, V.; Pînzaru, S.C. Detection of Thiabendazole Applied on Citrus Fruits and Bananas Using Surface Enhanced Raman Scattering. Food Chem. 2014, 145, 814–820. [Google Scholar] [CrossRef]
  28. Brezestean, I.A.; Tosa, N.; Falamas, A.; Cuibus, D.; Muntean, C.M.; Bende, A.; Cozar, B.; Berghian-Grosan, C.; Farcău, C. Silver Nanoparticle Films Obtained by Convective Self-Assembly for Surface-Enhanced Raman Spectroscopy Analyses of the Pesticides Thiabendazole and Endosulfan. Front. Chem. 2022, 10, 915337. [Google Scholar] [CrossRef] [PubMed]
  29. Fleischmann, M.; Graves, P.R.; Hill, I.R.; Robinson, J. Raman Spectroscopy of Pyridine Adsorbed on Roughened β Palladium Hydride Electrodes. Chem. Phys. Lett. 1983, 95, 322–324. [Google Scholar] [CrossRef]
  30. Xia, J.; Wang, D.; Liang, P.; Zhang, D.; Du, X.; Ni, D.; Yu, Z. Vibrational (FT-IR, Raman) Analysis of Tea Catechins Based on Both Theoretical Calculations and Experiments. Biophys. Chem. 2020, 256, 106282. [Google Scholar] [CrossRef]
  31. Huang, C.C.; Chen, W. A SERS Method with Attomolar Sensitivity: A Case Study with the Flavonoid Catechin. Microchim. Acta 2018, 185, 120. [Google Scholar] [CrossRef]
  32. El-Nahhal, Y.Z. Development of Controlled Release Formulations of Thiabendazole. J. Agric. Chem. Environ. 2014, 3, 1–8. [Google Scholar] [CrossRef]
  33. Ahmed Said, A.E.A.; Goda, M.N. Superior Competitive Adsorption Capacity of Natural Bentonite in the Efficient Removal of Basic Dyes from Aqueous Solutions. ChemistrySelect 2021, 6, 2790–2803. [Google Scholar] [CrossRef]
  34. PubChem. Thiabendazole. Available online: https://pubchem.ncbi.nlm.nih.gov/compound/Thiabendazole#section=Henry%27s-Law-Constant (accessed on 26 June 2023).
  35. Chen, J.; Huang, Y.; Kannan, P.; Zhang, L.; Lin, Z.; Zhang, J.; Chen, T.; Guo, L. Flexible and Adhesive Surface Enhance Raman Scattering Active Tape for Rapid Detection of Pesticide Residues in Fruits and Vegetables. Anal. Chem. 2016, 88, 2149–2155. [Google Scholar] [CrossRef]
  36. Liu, B.; Han, G.; Zhang, Z.; Liu, R.; Jiang, C.; Wang, S.; Han, M.Y. Shell Thickness-Dependent Raman Enhancement for Rapid Identification and Detection of Pesticide Residues at Fruit Peels. Anal. Chem. 2012, 84, 255–261. [Google Scholar] [CrossRef]
  37. Zhou, N.; Meng, G.; Huang, Z.; Ke, Y.; Zhou, Q.; Hu, X. A Flexible Transparent Ag-NC@PE Film as a Cut-and-Paste SERS Substrate for Rapid: In Situ Detection of Organic Pollutants. Analyst 2016, 141, 5864–5869. [Google Scholar] [CrossRef] [PubMed]
  38. Tang, X.; Cai, W.; Yang, L.; Liu, J. Highly Uniform and Optical Visualization of SERS Substrate for Pesticide Analysis Based on Au Nanoparticles Grafted on Dendritic α-Fe 2O3. Nanoscale 2013, 5, 11193–11199. [Google Scholar] [CrossRef] [PubMed]
  39. Dai, H.; Sun, Y.; Ni, P.; Lu, W.; Jiang, S.; Wang, Y.; Li, Z.; Li, Z. Three-Dimensional TiO2 Supported Silver Nanoparticles as Sensitive and UV-Cleanable Substrate for Surface Enhanced Raman Scattering. Sens. Actuators B Chem. 2017, 242, 260–268. [Google Scholar] [CrossRef]
  40. Yang, J.K.; Kang, H.; Lee, H.; Jo, A.; Jeong, S.; Jeon, S.J.; Kim, H.I.; Lee, H.Y.; Jeong, D.H.; Kim, J.H.; et al. Single-Step and Rapid Growth of Silver Nanoshells as SERS-Active Nanostructures for Label-Free Detection of Pesticides. ACS Appl. Mater. Interfaces 2014, 6, 12541–12549. [Google Scholar] [CrossRef]
  41. Tang, X.; Dong, R.; Yang, L.; Liu, J. Fabrication of Au Nanorod-Coated Fe3O4 Microspheres as SERS Substrate for Pesticide Analysis by near-Infrared Excitation. J. Raman Spectrosc. 2015, 46, 470–475. [Google Scholar] [CrossRef]
  42. Kumar, S.; Goel, P.; Singh, J.P. Flexible and Robust SERS Active Substrates for Conformal Rapid Detection of Pesticide Residues from Fruits. Sens. Actuators B Chem. 2017, 241, 577–583. [Google Scholar] [CrossRef]
  43. Shiohara, A.; Langer, J.; Polavarapu, L.; Liz-Marzán, L.M. Solution Processed Polydimethylsiloxane/Gold Nanostar Flexible Substrates for Plasmonic Sensing. Nanoscale 2014, 6, 9817–9823. [Google Scholar] [CrossRef]
  44. He, L.; Chen, T.; Labuza, T.P. Recovery and Quantitative Detection of Thiabendazole on Apples Using a Surface Swab Capture Method Followed by Surface-Enhanced Raman Spectroscopy. Food Chem. 2014, 148, 42–46. [Google Scholar] [CrossRef]
  45. Liou, P.; Nayigiziki, F.X.; Kong, F.; Mustapha, A.; Lin, M. Cellulose Nanofibers Coated with Silver Nanoparticles as a SERS Platform for Detection of Pesticides in Apples. Carbohydr. Polym. 2017, 157, 643–650. [Google Scholar] [CrossRef]
  46. Moldovan, R.; Milenko, K.; Vereshchagina, E.; Iacob, B.C.; Schneider, K.; Farcău, C.; Bodoki, E. EC-SERS Detection of Thiabendazole in Apple Juice Using Activated Screen-Printed Electrodes. Food Chem. 2023, 405. [Google Scholar] [CrossRef]
  47. Tian, L.; Su, M.; Yu, F.; Xu, Y.; Li, X.; Li, L.; Liu, H.; Tan, W. Liquid-State Quantitative SERS Analyzer on Self-Ordered Metal Liquid-like Plasmonic Arrays. Nat. Commun. 2018, 9. [Google Scholar] [CrossRef] [PubMed]
  48. Alsammarraie, F.K.; Lin, M.; Mustapha, A.; Lin, H.; Chen, X.; Chen, Y.; Wang, H.; Huang, M. Rapid Determination of Thiabendazole in Juice by SERS Coupled with Novel Gold Nanosubstrates. Food Chem. 2018, 259, 219–225. [Google Scholar] [CrossRef] [PubMed]
  49. Wijaya, W.; Pang, S.; Labuza, T.P.; He, L. Rapid Detection of Acetamiprid in Foods Using Surface-Enhanced Raman Spectroscopy (SERS). J. Food Sci. 2014, 79, 1–5. [Google Scholar] [CrossRef] [PubMed]
  50. Fan, Y.; Lai, K.; Rasco, B.A.; Huang, Y. Determination of Carbaryl Pesticide in Fuji Apples Using Surface-Enhanced Raman Spectroscopy Coupled with Multivariate Analysis. Lwt 2015, 60, 352–357. [Google Scholar] [CrossRef]
  51. Xu, Q.; Guo, X.; Xu, L.; Ying, Y.; Wu, Y.; Wen, Y.; Yang, H. Template-Free Synthesis of SERS-Active Gold Nanopopcorn for Rapid Detection of Chlorpyrifos Residues. Sens. Actuators B Chem. 2017, 241, 1008–1013. [Google Scholar] [CrossRef]
  52. Li, C.; Yang, C.; Xu, S.; Zhang, C.; Li, Z.; Liu, X.; Jiang, S.; Huo, Y.; Liu, A.; Man, B. Ag2O@Ag Core-Shell Structure on PMMA as Low-Cost and Ultra-Sensitive Flexible Surface-Enhanced Raman Scattering Substrate. J. Alloys Compd. 2017, 695, 1677–1684. [Google Scholar] [CrossRef]
  53. Zhai, C.; Li, Y.Y.; Peng, Y.K.; Xu, T.F. Detection of Chlorpyrifos in Apples Using Gold Nanoparticles Based on Surface Enhanced Raman Spectroscopy. Int. J. Agric. Biol. Eng. 2015, 8, 113–120. [Google Scholar] [CrossRef]
Figure 1. Illustrative graphical sketch of the SERS procedure for the detection of TBZ from frozen fruits.
Chemosensors 11 00505 g001
Figure 2. (A) Typical SERS spectra of 11 different crude blueberry extracts—from different market stocks. The “bio” and “non-bio” stocks are indicated with different colors. The SERS spectrum of TBZ alone is given in bottom as a dotted line for the eye guide. The FT-Raman spectrum of blueberry is given with black color on the top. (B) Spectral detail in the 1400–1700 cm−1 range is given in the right panel to highlight that the main TBZ band is not overlapped by the crude extracts’ bands.
Chemosensors 11 00505 g002
Figure 3. (A) SERS spectra of TBZ on hydroxylamine-reduced AgNPs at different concentrations, from 20 µmol l−1 to 0.2 µmol l−1, as indicated on each spectrum; excitation: 532 nm. (BD) The linear regression equations between SERS band intensity and TBZ solution concentration for three different TBZ SERS bands: (B) 1571 cm−1; (C) 1005 cm−1; (D) 778 cm−1. Error bars were inserted, representing a 3% percentage of data values.
Chemosensors 11 00505 g003
Figure 4. SERS spectra of blueberry extracts: (A) stock 1, (E) stock 2, as indicated, treated with TBZ at concentrations from 1.01 to 5.06 µM, as shown by the color code. The inserts showed spectral details of the three prominent bands of TBZ, at 1571, 1005, and 778 cm−1, respectively, and the plot of the SERS intensity of these bands of TBZ as a function of concentration is shown individually by (BD) for stock 1, and by (FH) for stock 2. A linear fit with a slightly different R2 coefficient of determination and the LOD is given in each plot. Error bars represent the relative error of each determination (percentage); excitation: 532 nm.
Chemosensors 11 00505 g004
Figure 5. (A) Image of the two different stocks of blueberry extracts filtered on bentonite. (B) The SERS spectra of two different blueberry extracts, samples 1 and 2, compared with the corresponding SERS spectra of bentonite-filtered extracts, respectively. Note the decreased SERS intensity and lower spectral background in the bentonite-filtered samples.
Chemosensors 11 00505 g005
Figure 6. SERS spectra of bentonite-filtered blueberry extracts (upper, (A): stock 1, lower, (E)- stock 2, as indicated) treated with TBZ at concentrations from 1.01 to 5.06 µM as showed with color code. The insert showed spectral details of the three main bands of TBZ, at 1571, 1005, and 778 cm−1, respectively, and the plot of SERS intensity of these bands of TBZ as a function of concentration is shown individually, (BD) for stock 1, (FH) for stock 2. A linear fit with a slightly different R2 coefficient of determination and the LOD is given in each plot. Error bars represent the relative error of each determination (percentage). Excitation: 532 nm. Note the lower LOD compared to those from Figure 4 (non-filtered on bentonite).
Chemosensors 11 00505 g006
Figure 7. (A). SERS spectra of two stocks of blueberry extracts, denoted sample 1 and sample 2, in comparison with TBZ-treated ones (B) SERS spectra of bentonite-filtered blueberry fruit extract in comparison with TBZ-treated ones and the calculated spectral difference (between treated and normal) are plotted in (C), respectively; (D,E). Raw SERS spectra of blueberry fruit extract from independent market fruit stock (sample 2) in comparison with the TBZ-treated one; (F) SERS spectra of bentonite-filtered blueberry fruit extract compared to the TBZ-treated one; and the calculated spectral differences (between TBZ-treated and normal) from (E,F) are plotted in (G,H), respectively. Note the improved and unambiguous detection of the TBZ bands in the bentonite-filtered extract from (H). SERS of TBZ is showed in the dotted spectrum from (H).
Chemosensors 11 00505 g007
Disclaimer/Publisher’s Note: The statements, opinions and data contained in all publications are solely those of the individual author(s) and contributor(s) and not of MDPI and/or the editor(s). MDPI and/or the editor(s) disclaim responsibility for any injury to people or property resulting from any ideas, methods, instructions or products referred to in the content.

